Next-Generation Sequencing of Genomic DNA Fragments Bound to a Transcription Factor in Vitro Reveals Its Regulatory Potential


Abstract
:1. Introduction
2. Experimental Section
2.1. Protein Synthesis
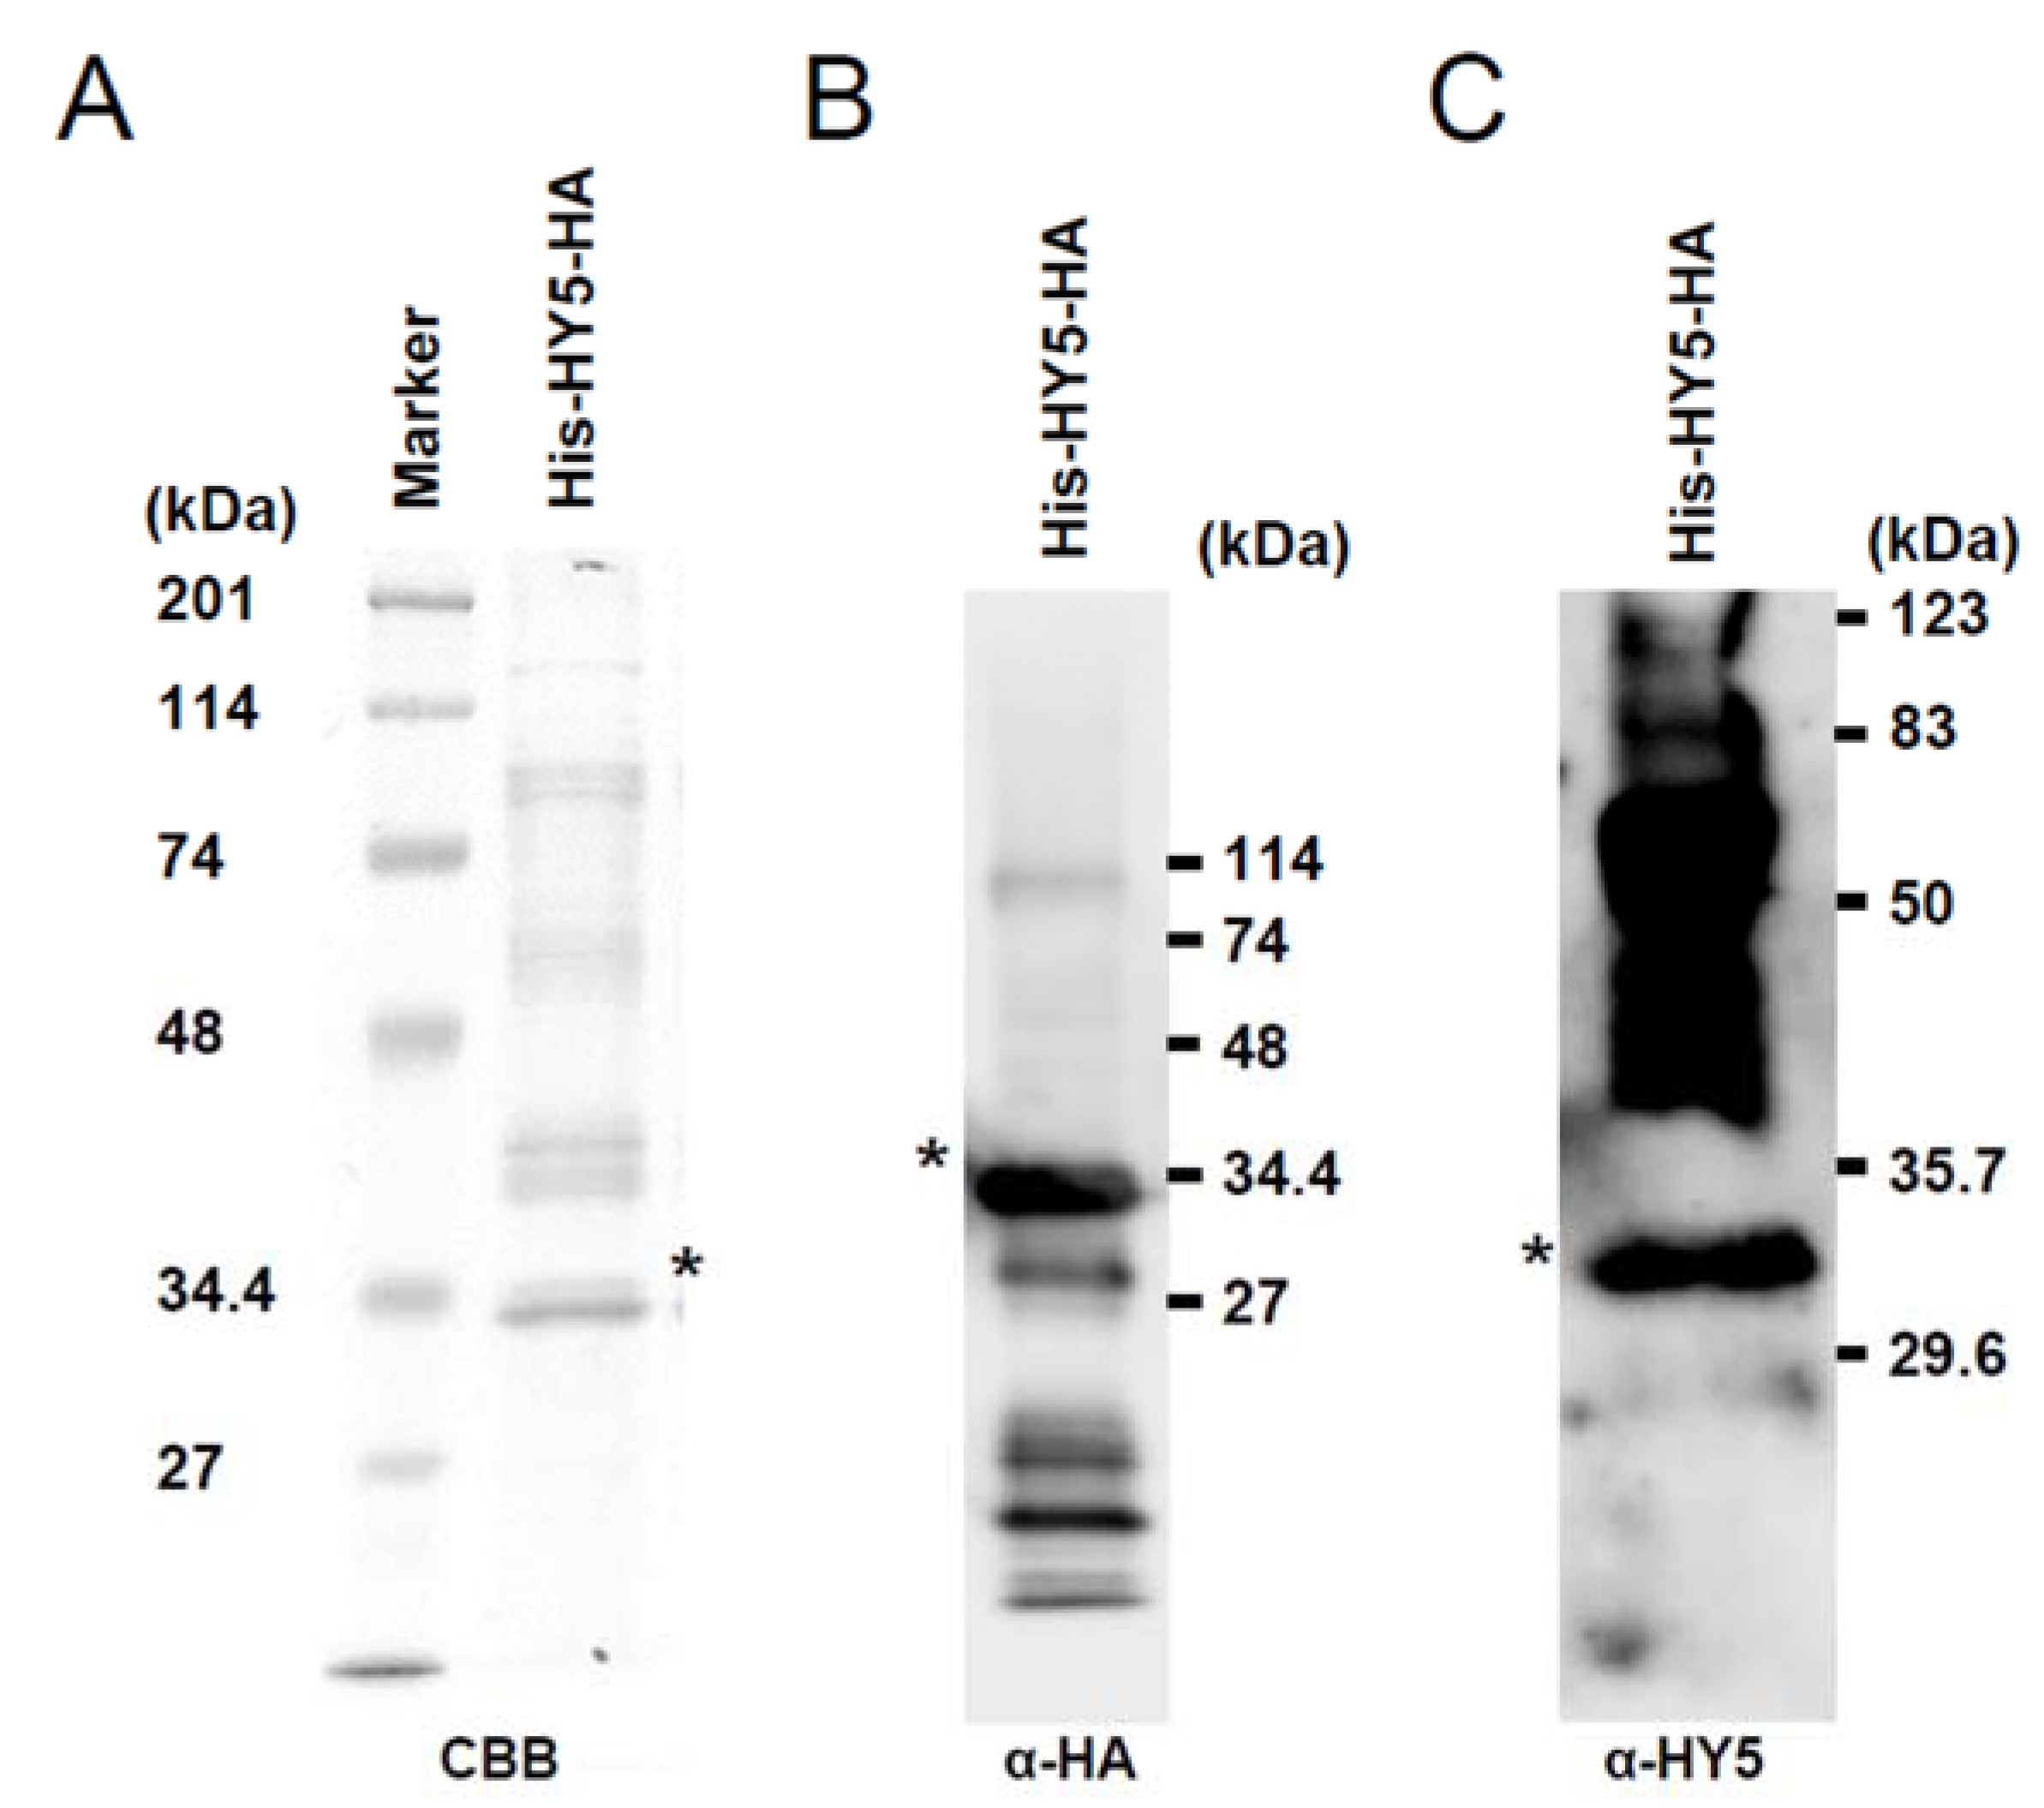
2.2. SDS-PAGE and Western Blot
2.3. DNA Immunoprecipitation, Sequencing and Analysis
2.4. Microarray Analysis
2.5. RNA-Seq Analysis
2.6. Semi-Quantitative RT-PCR Analysis
3. Results and Discussion
3.1. Synthesis of Recombinant HY5 Protein
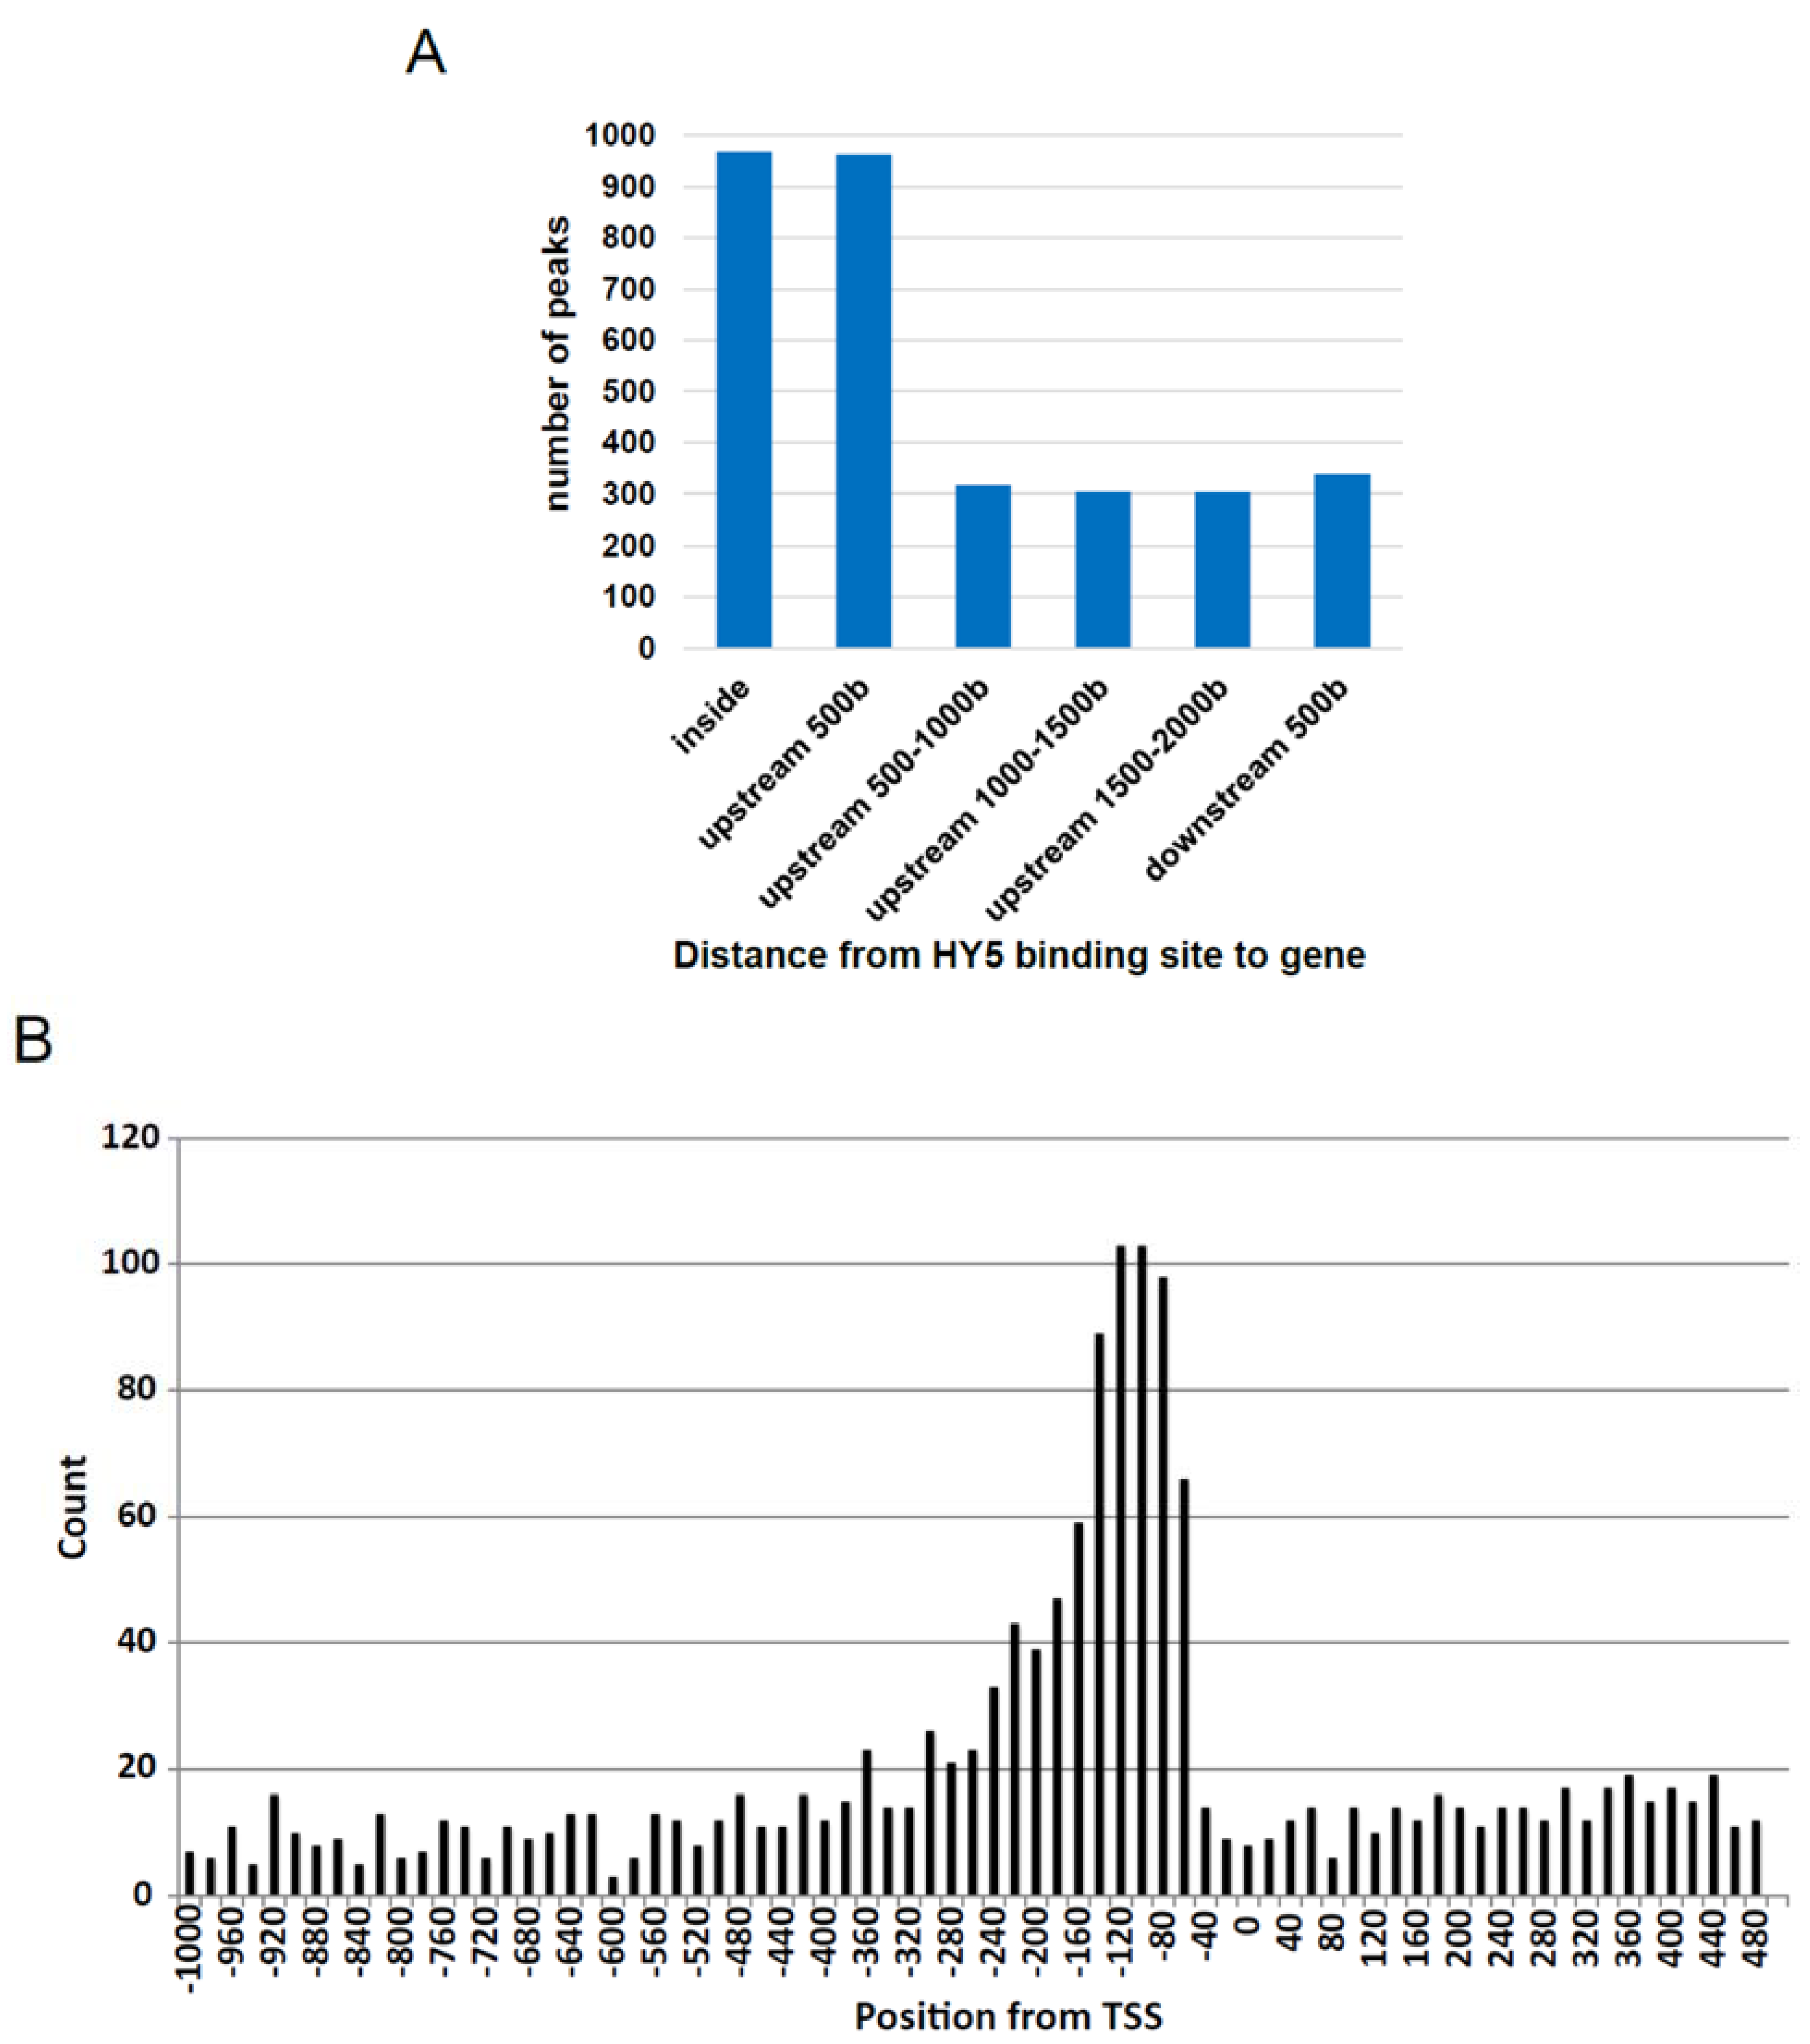
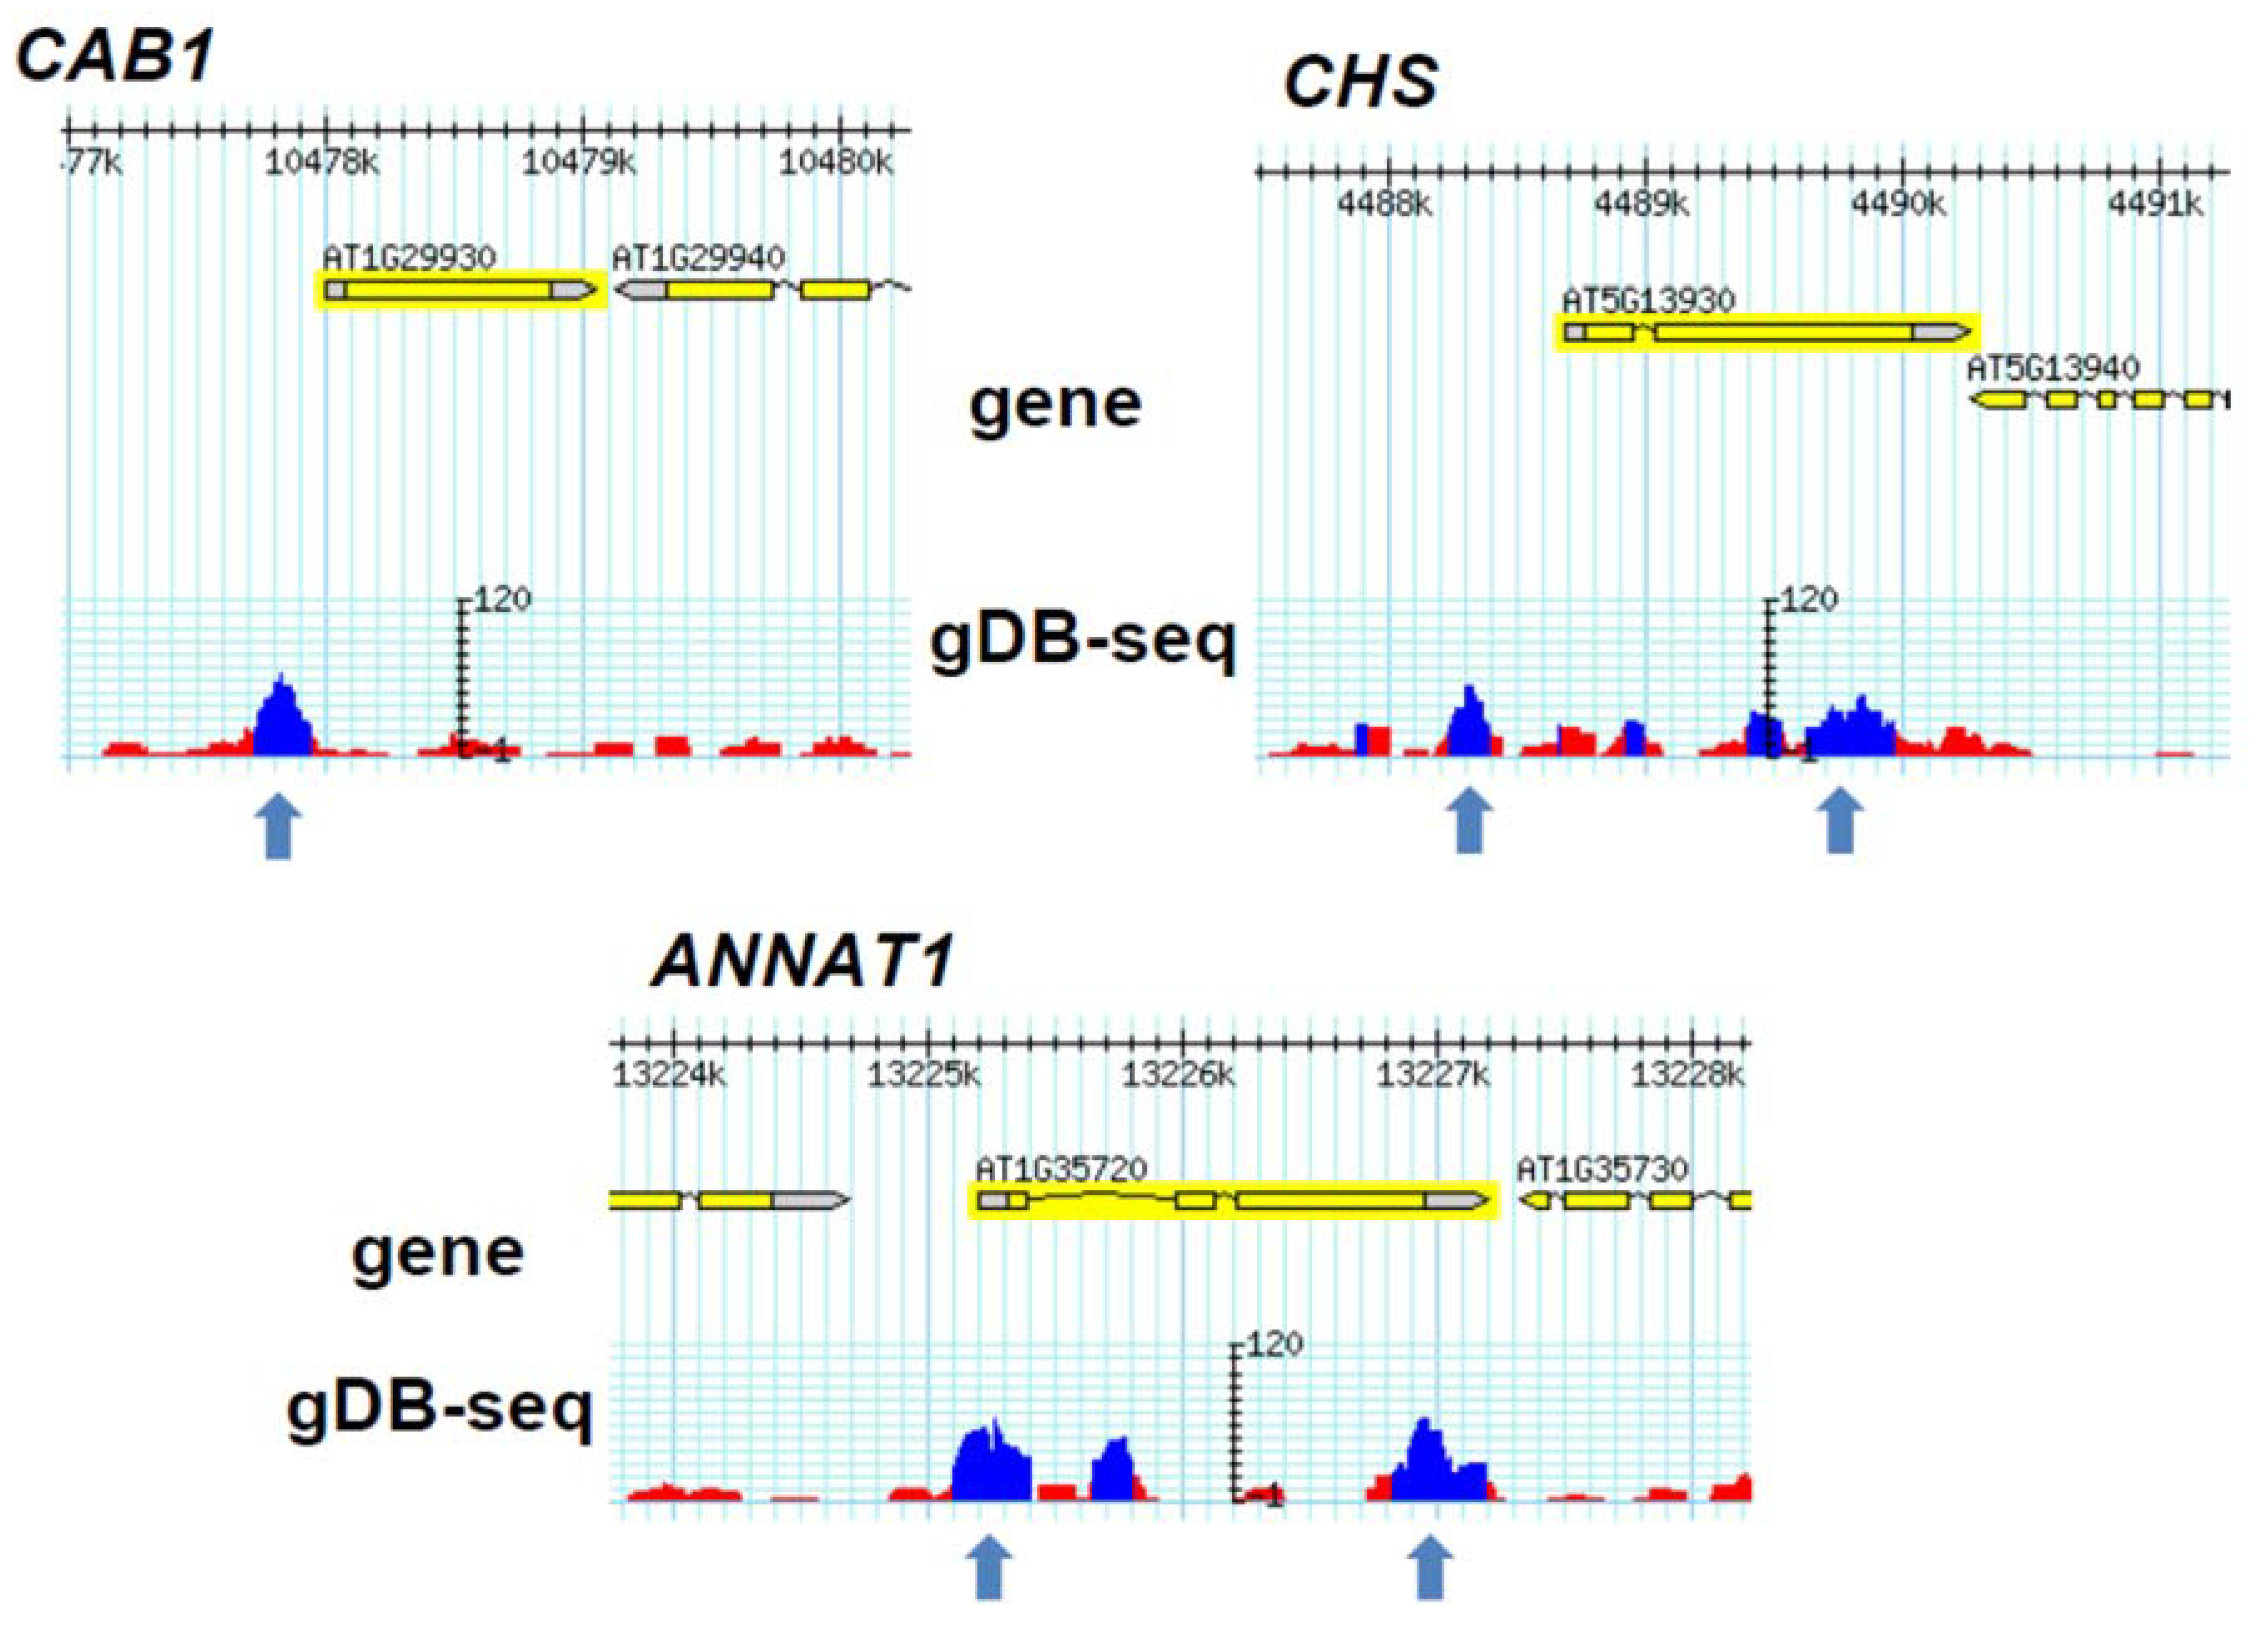
3.2. Establishment of in Vitro Genomic DNA Binding Assay


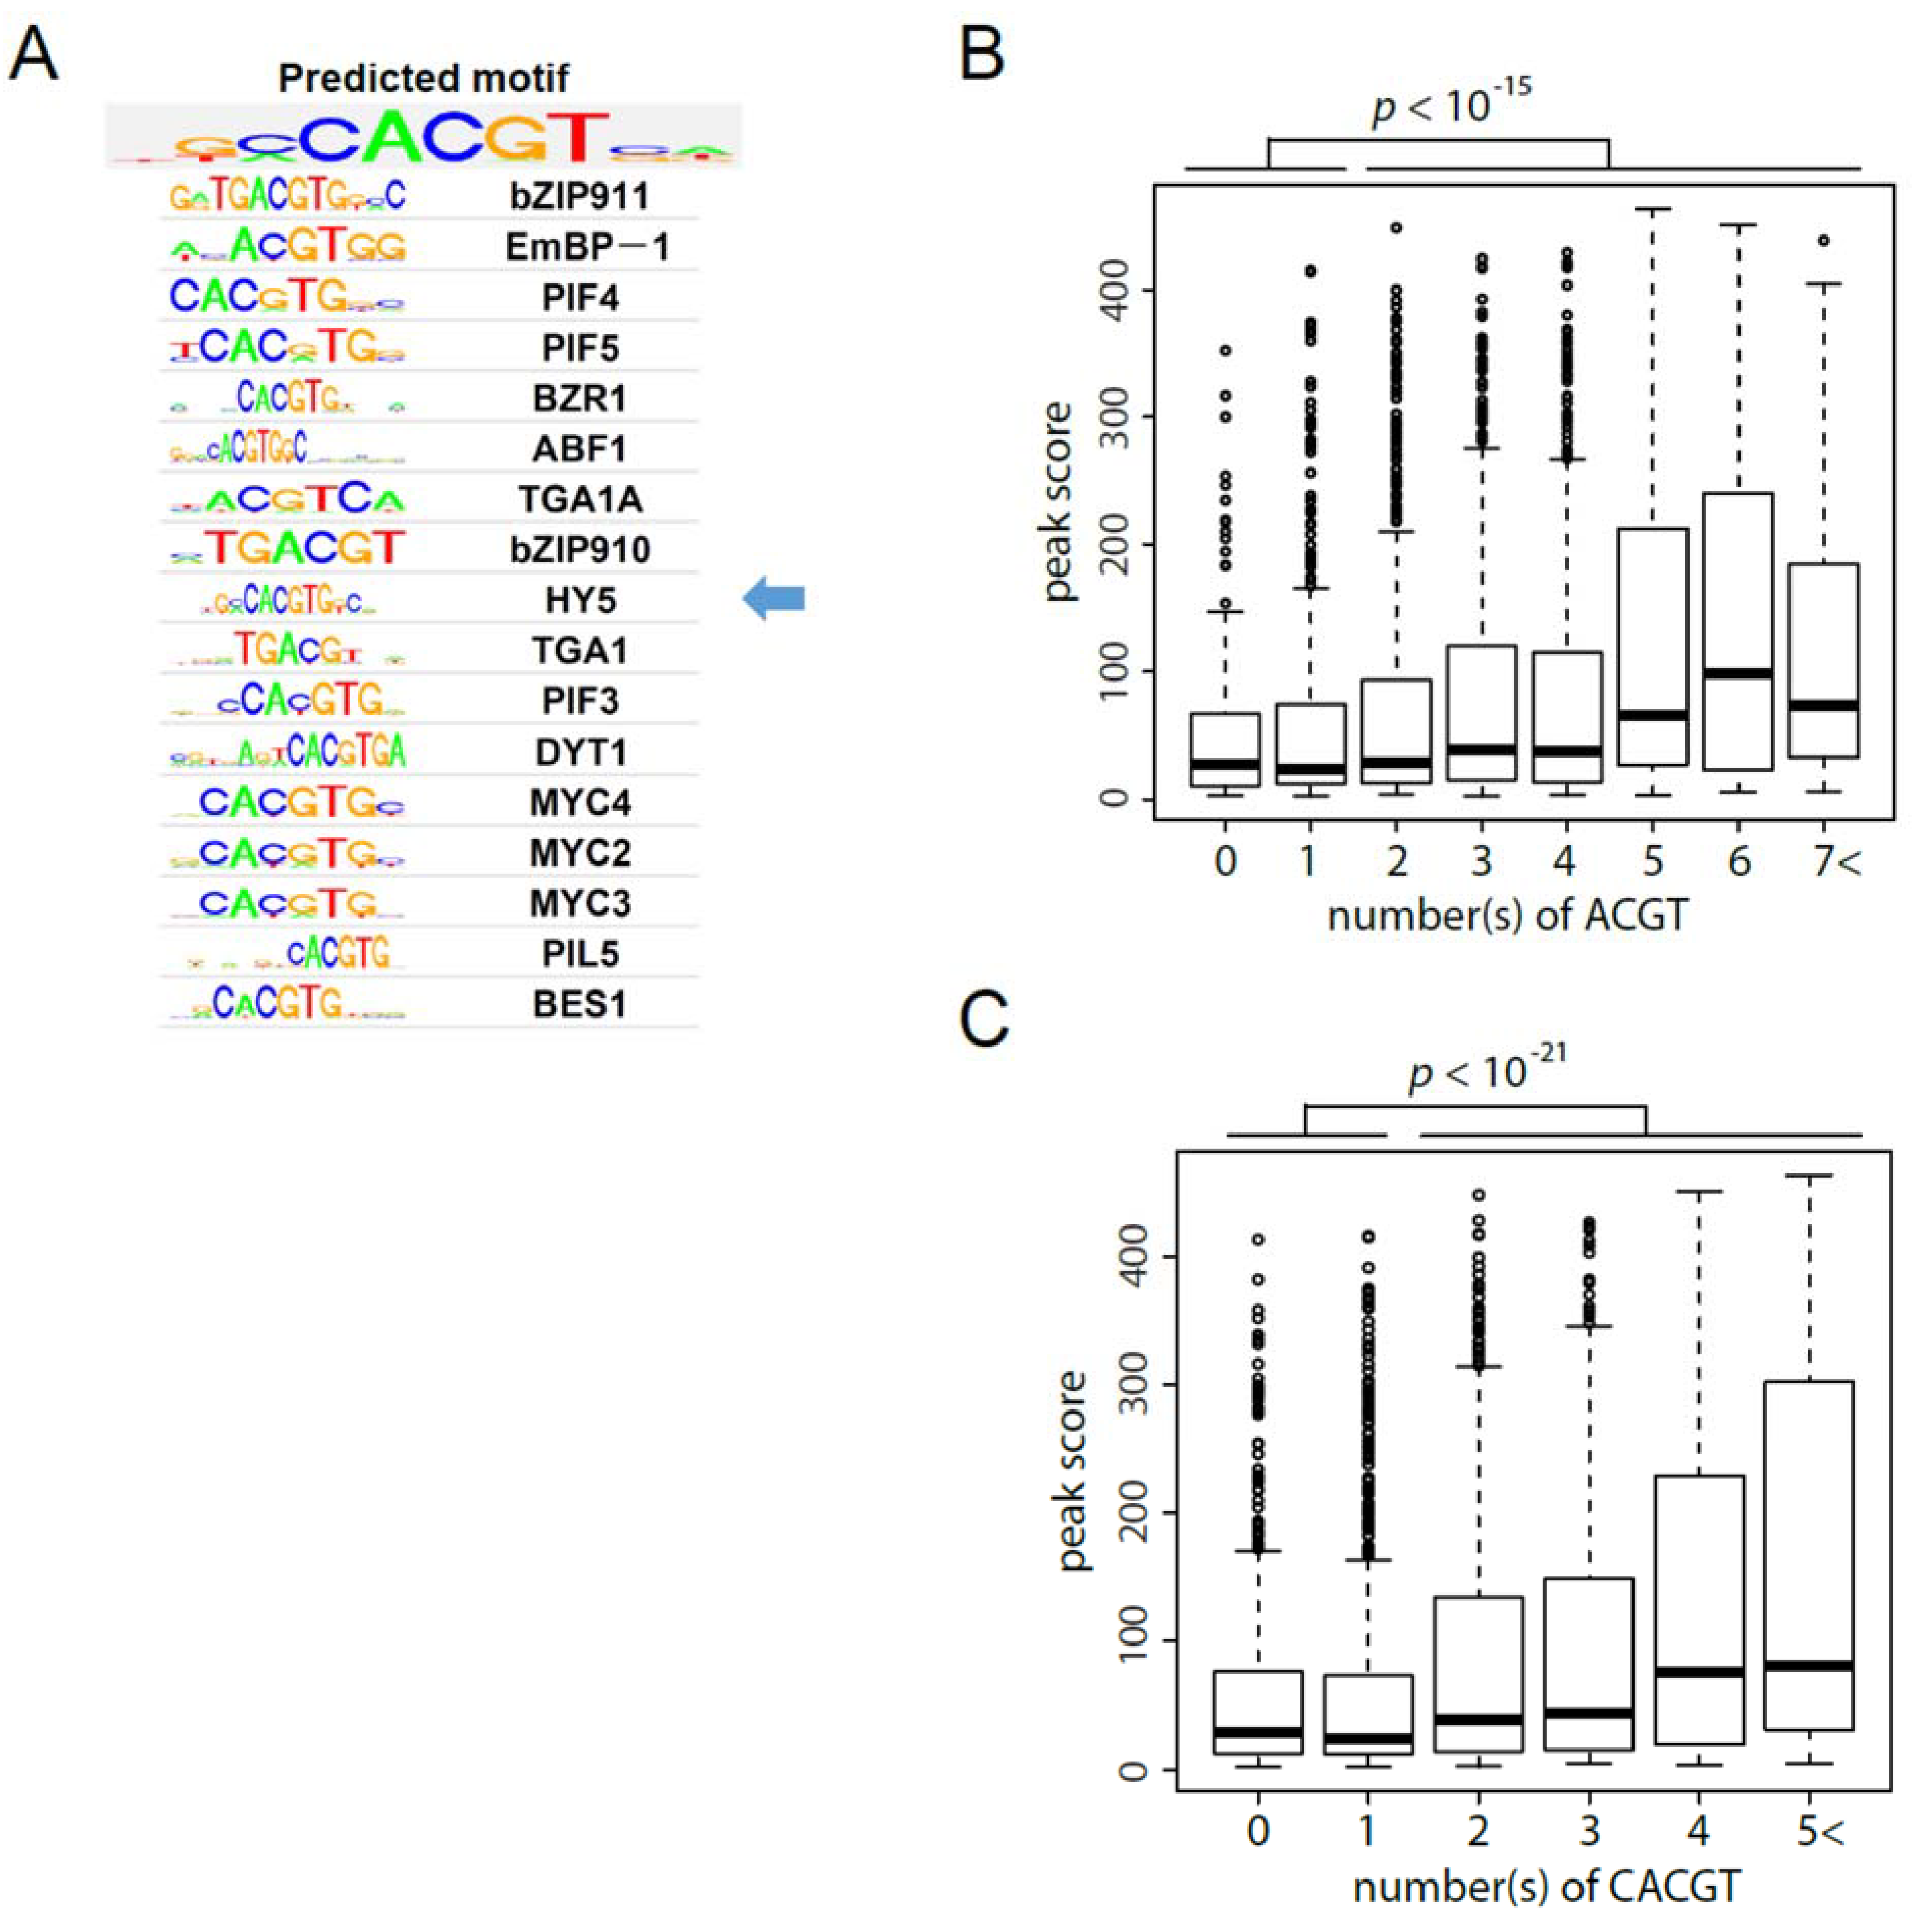
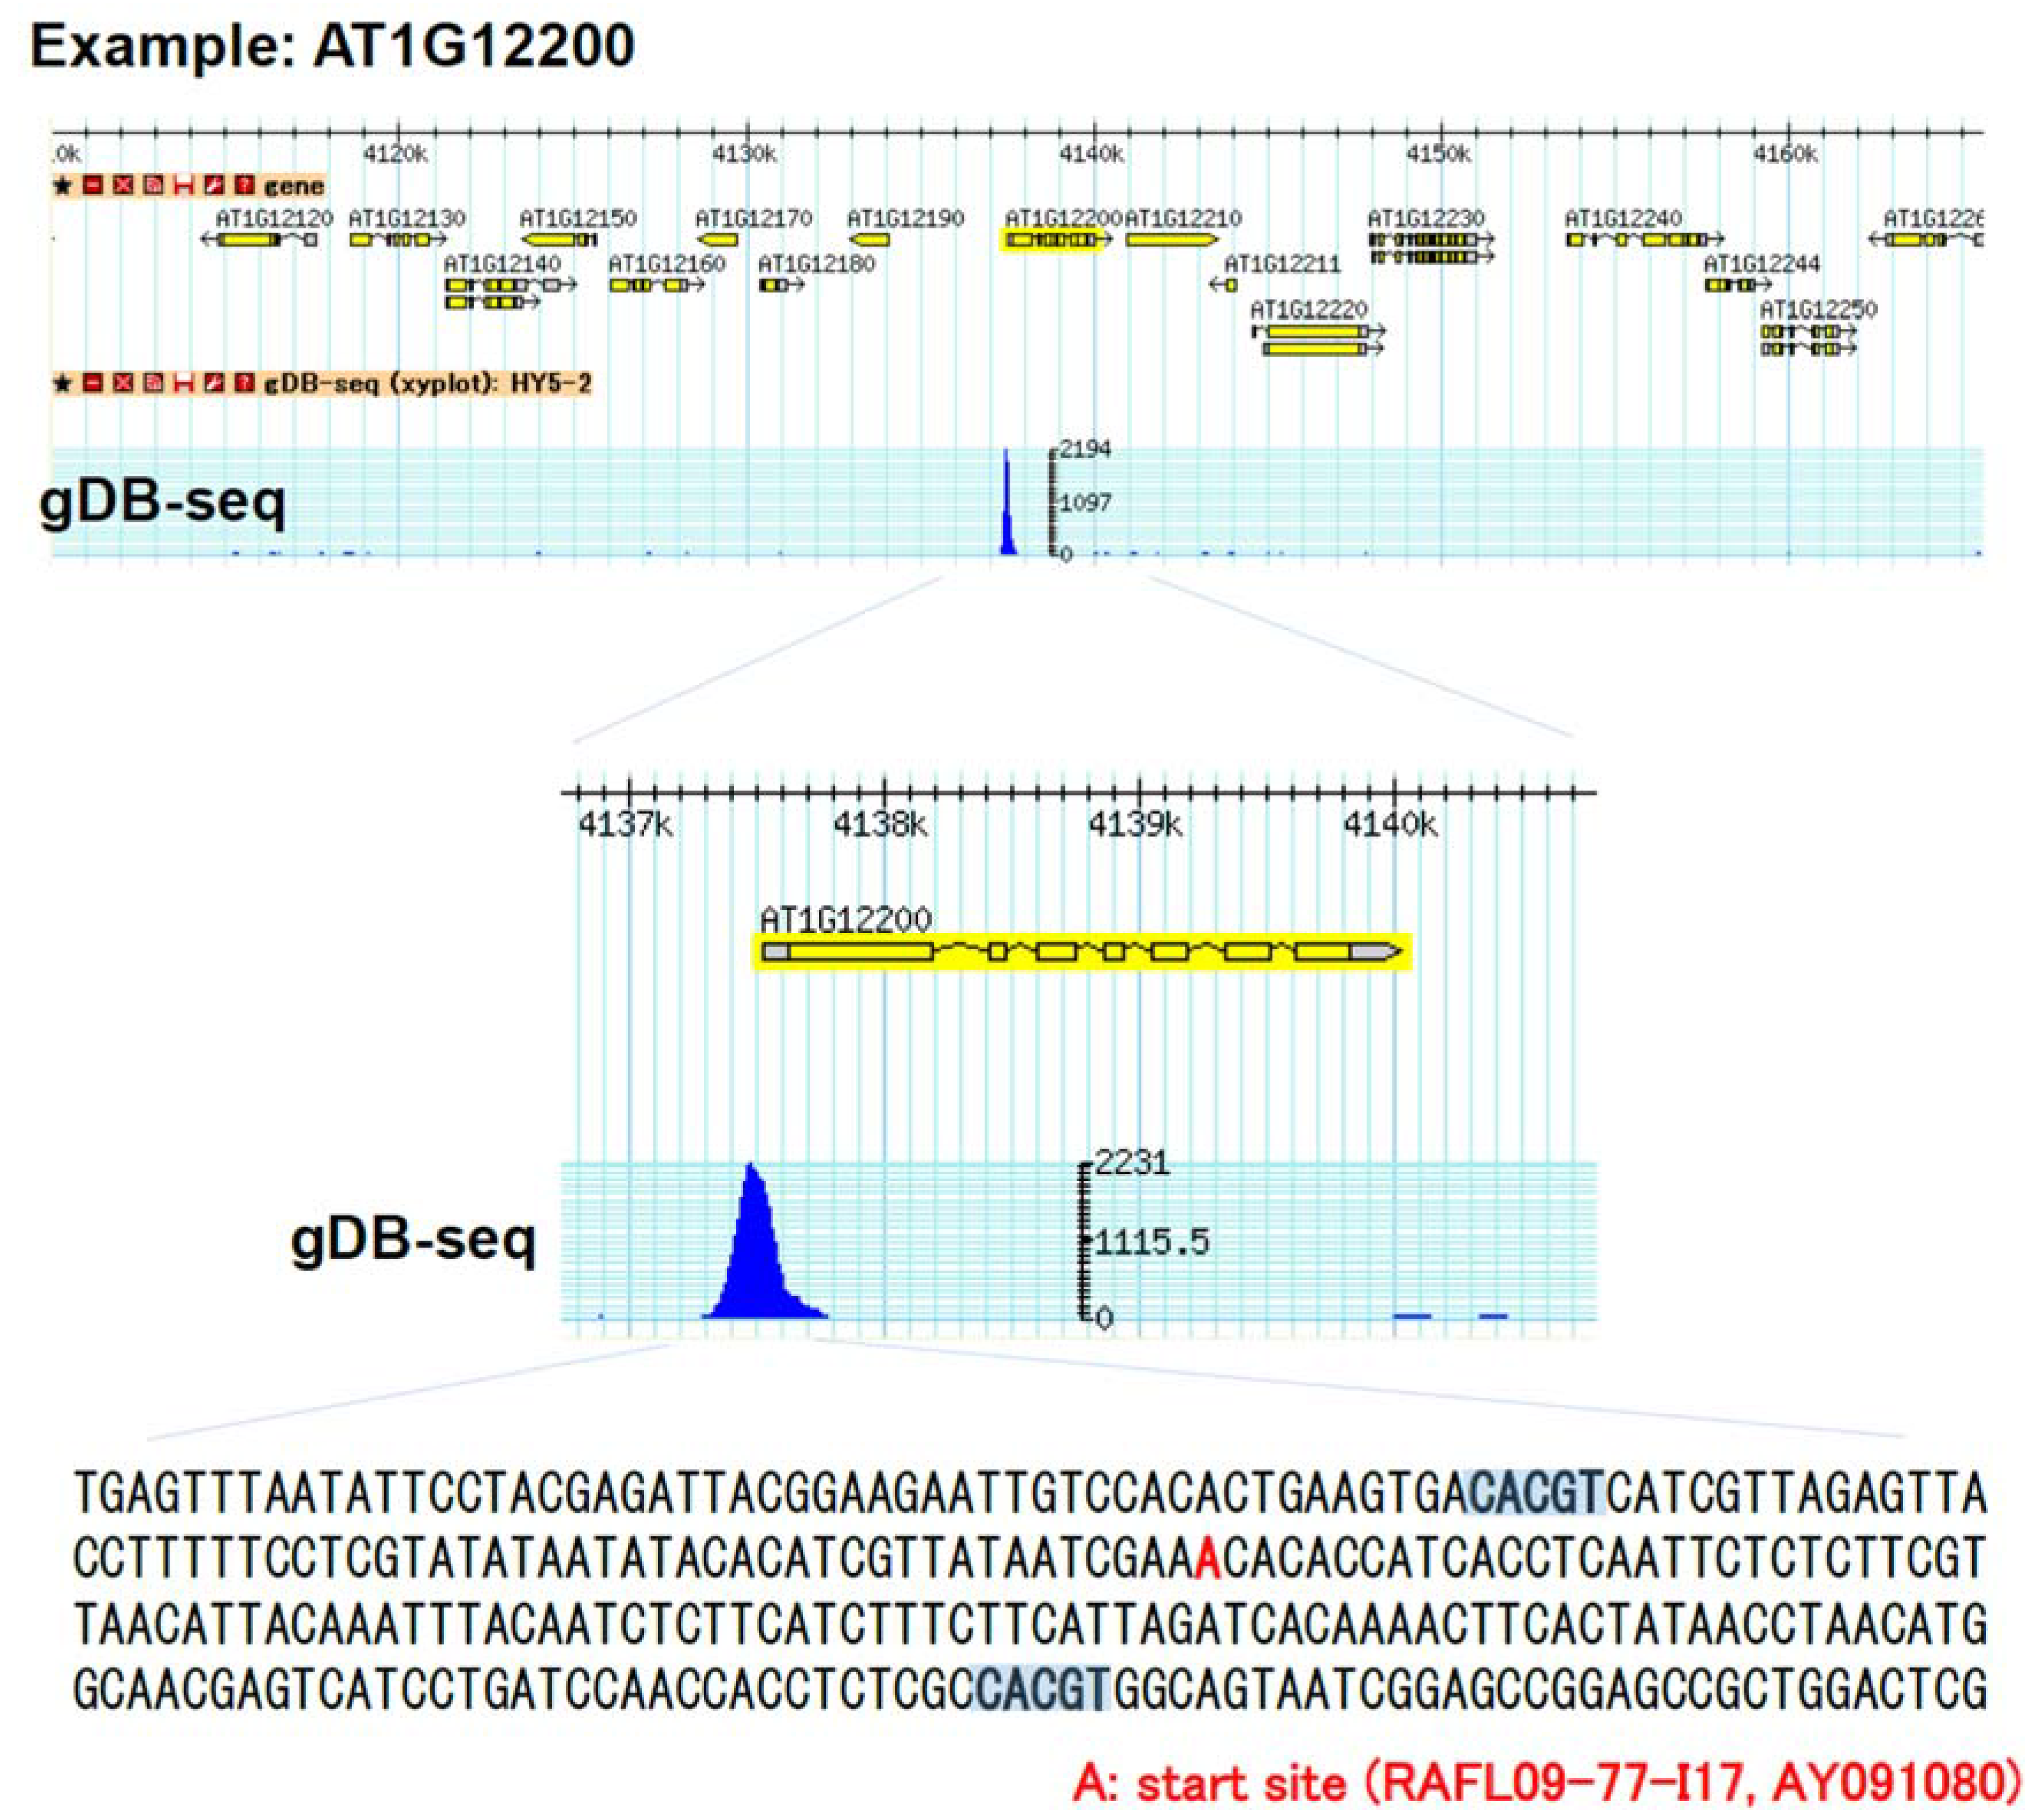
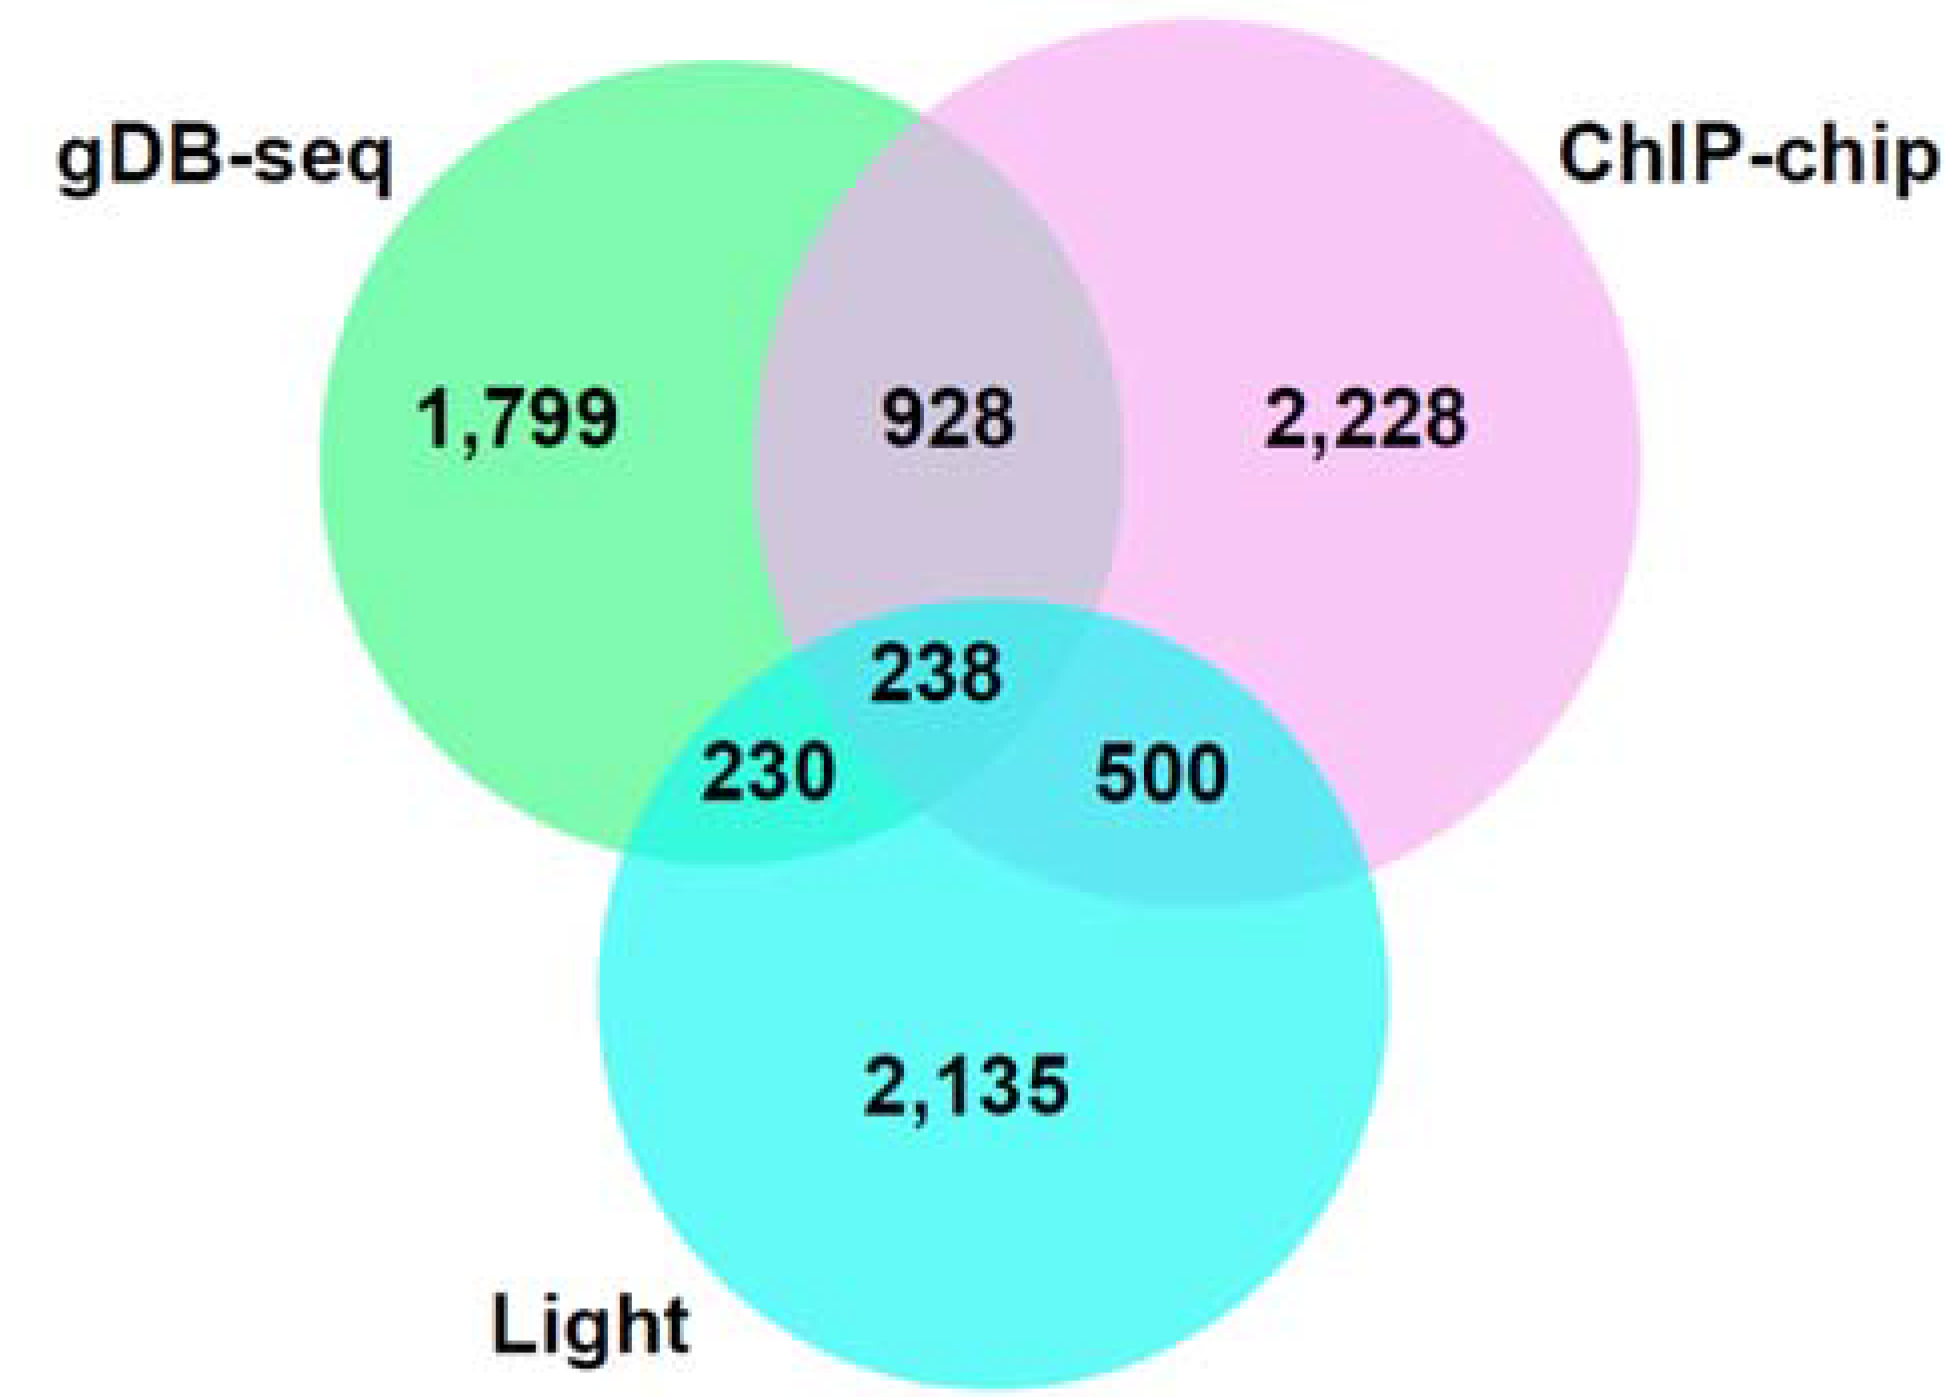
3.3. Comparison of gDB-Seq with ChIP-Chip
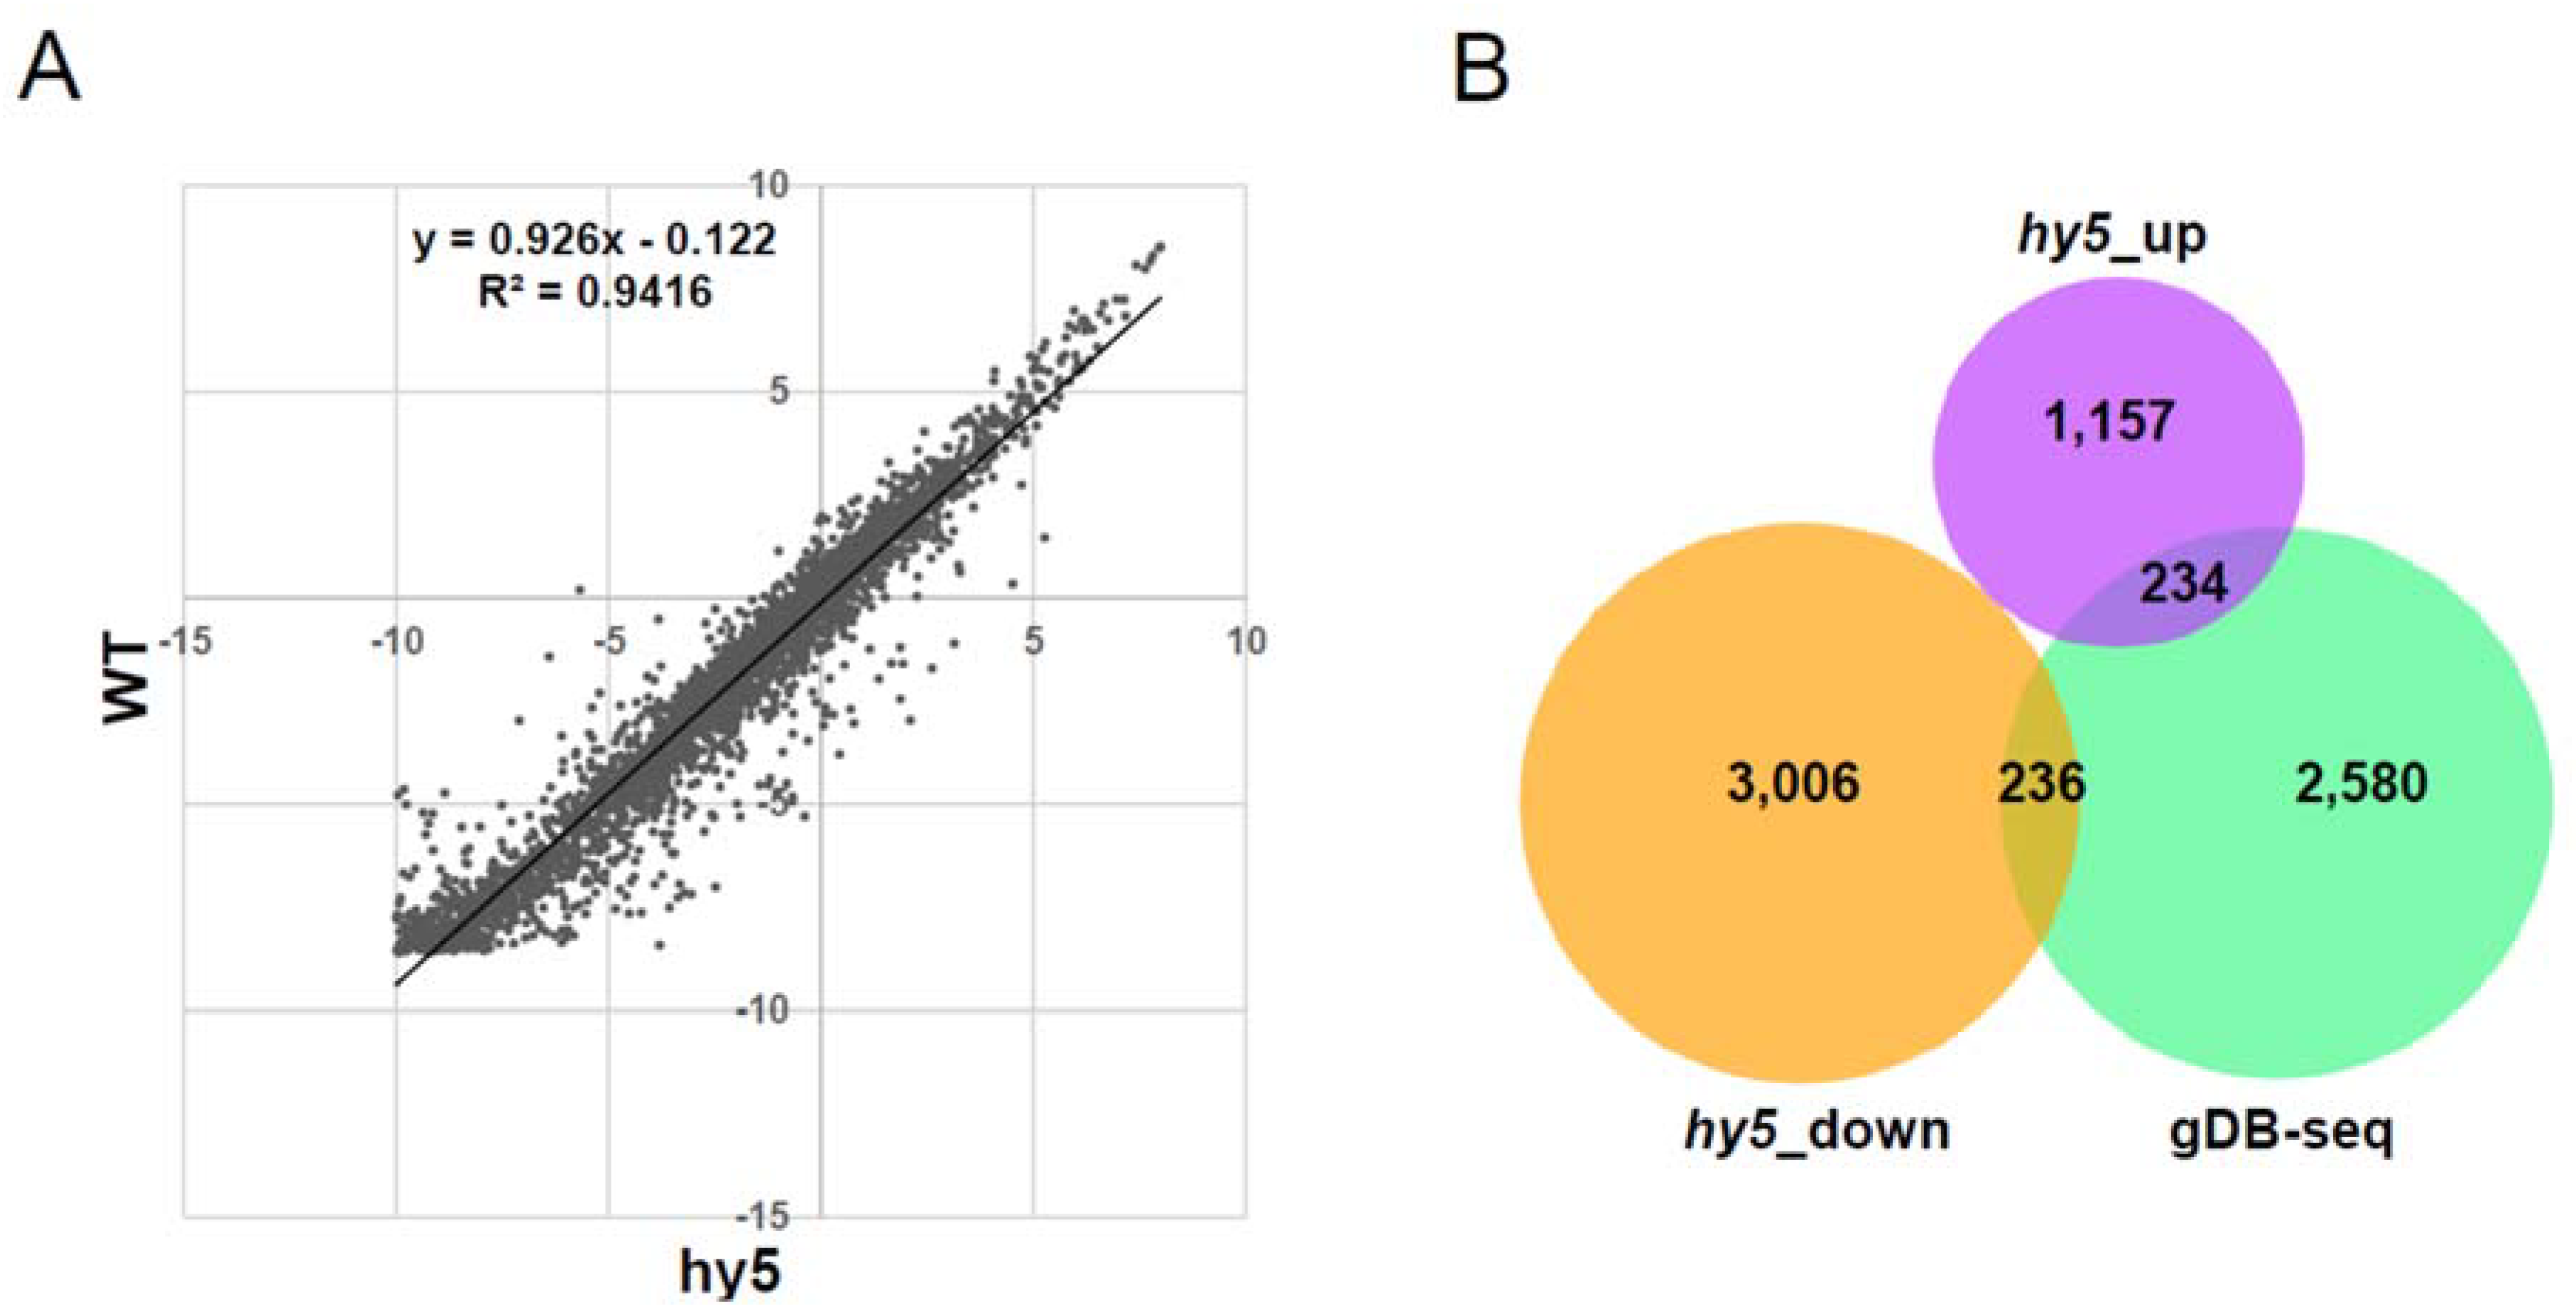
3.4. Association Study between gDB-Seq and Microarray in hy5 Mutant

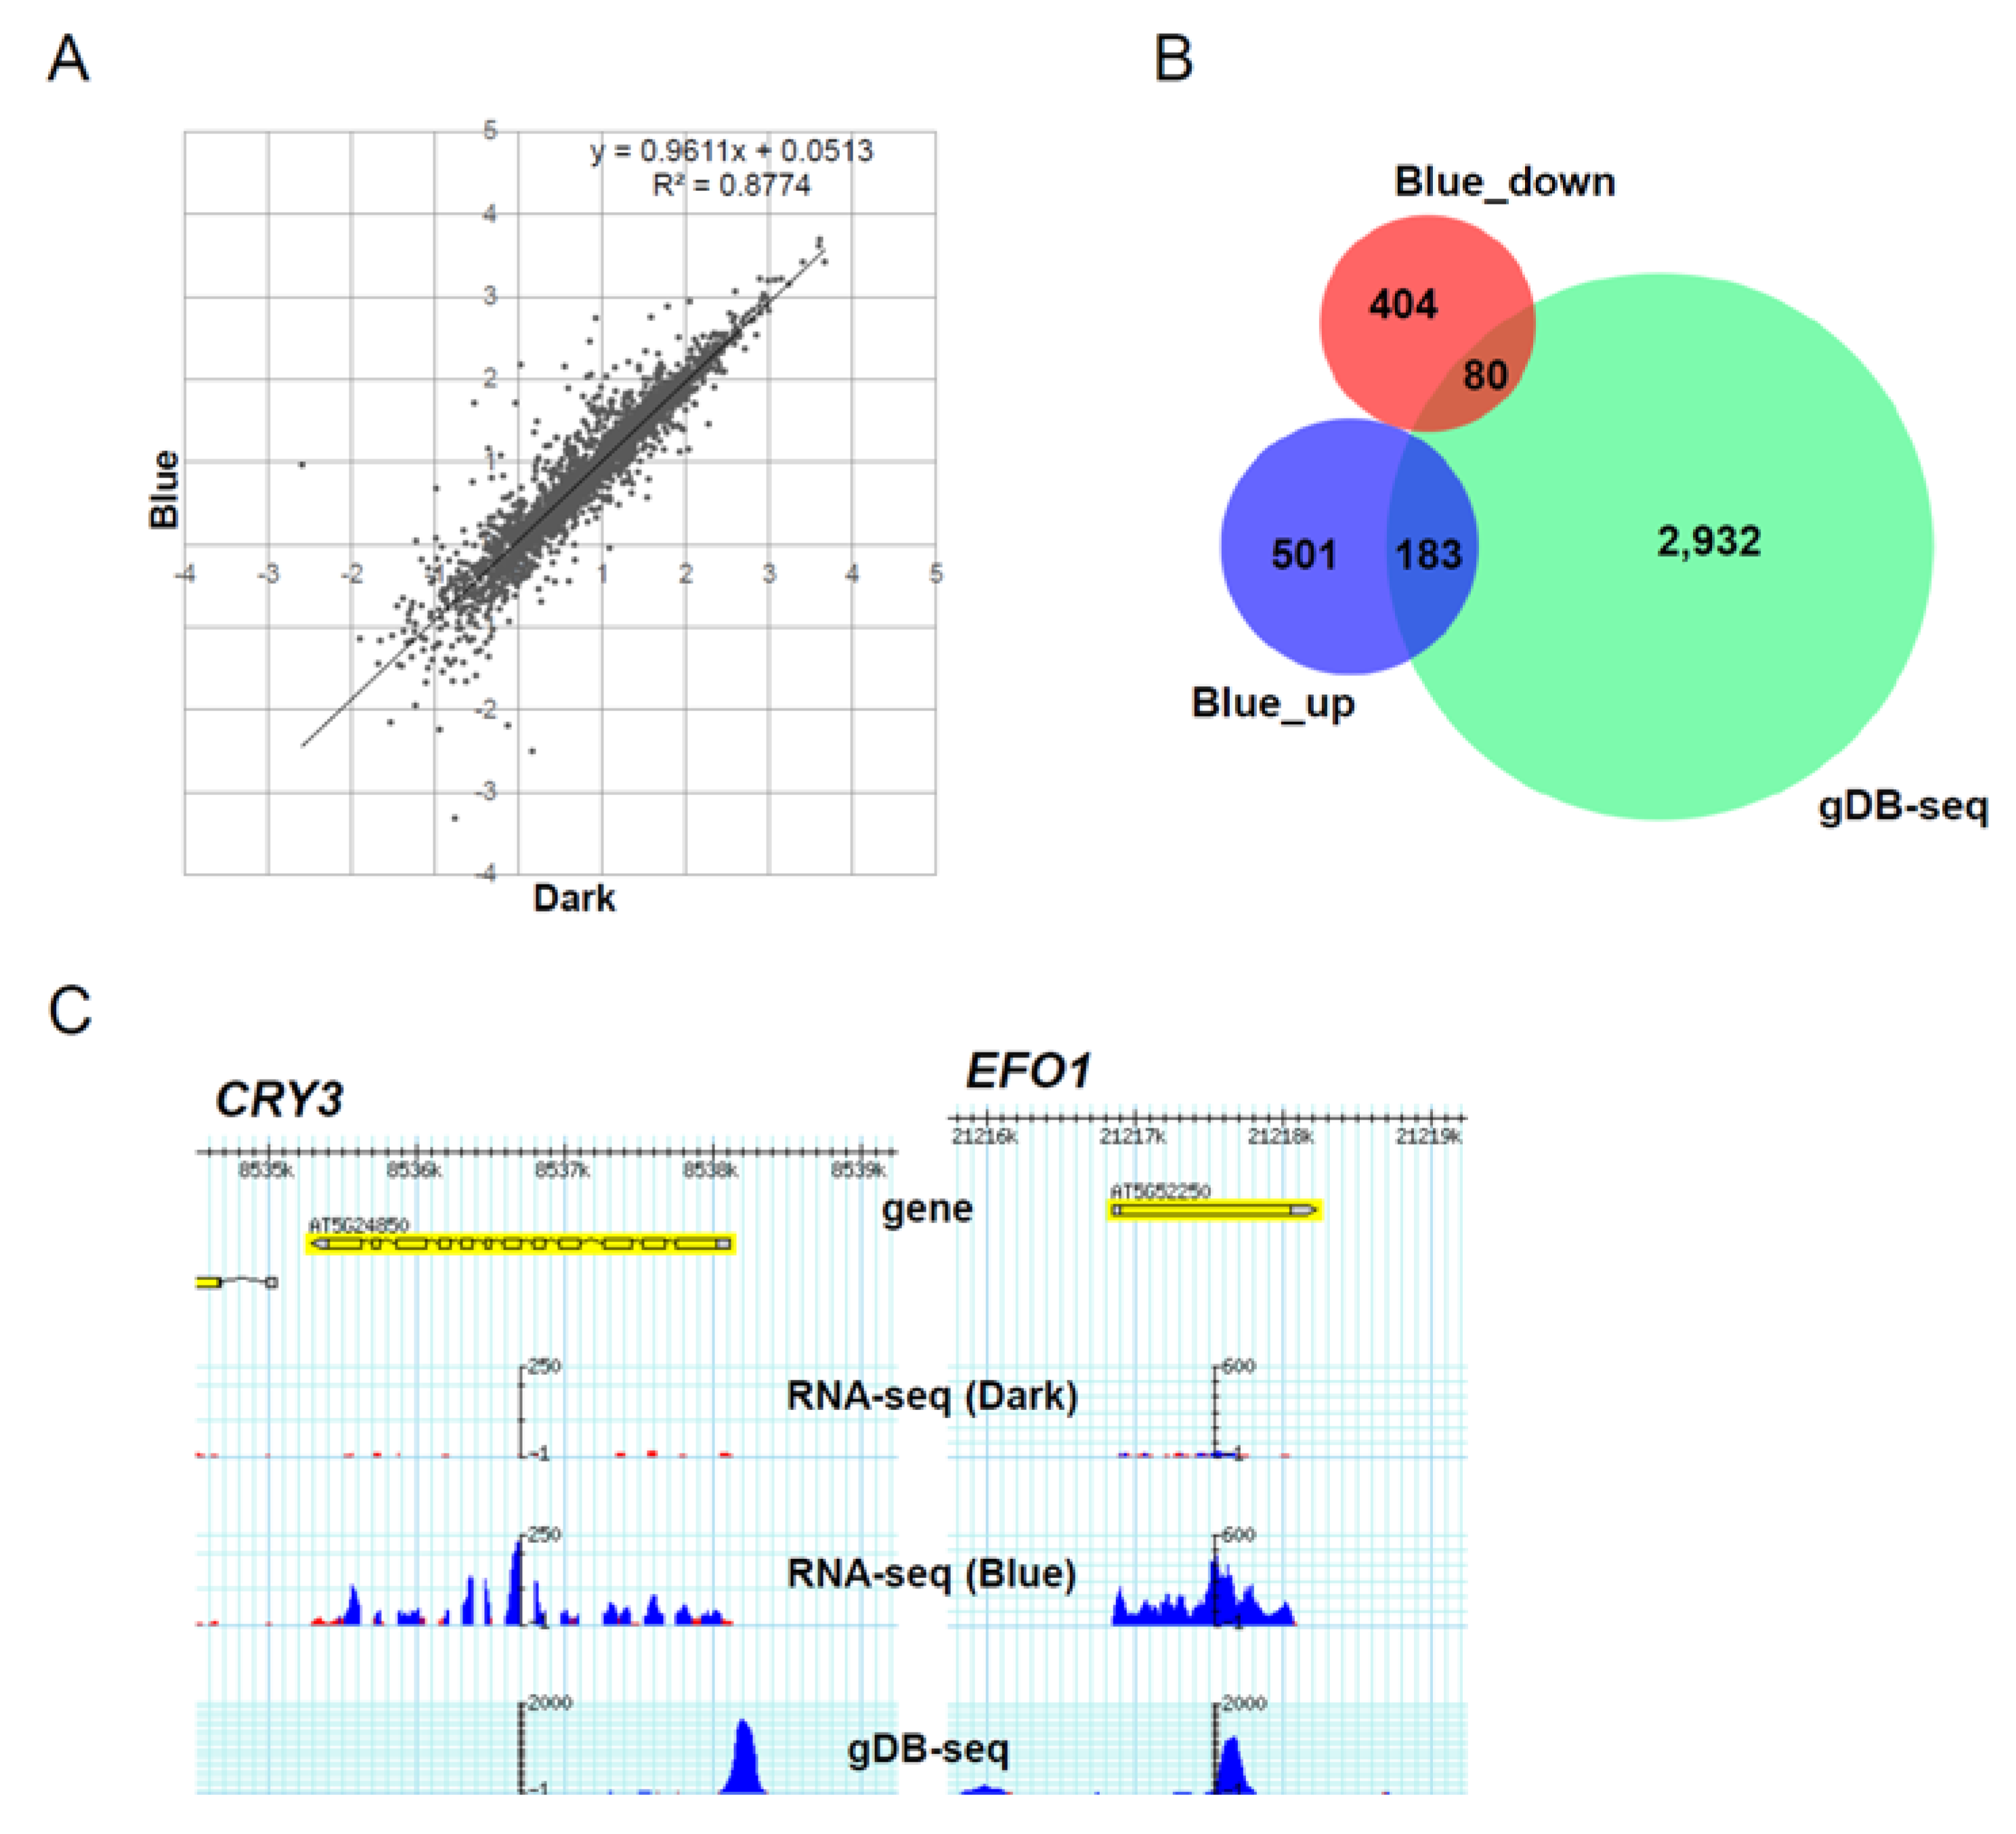
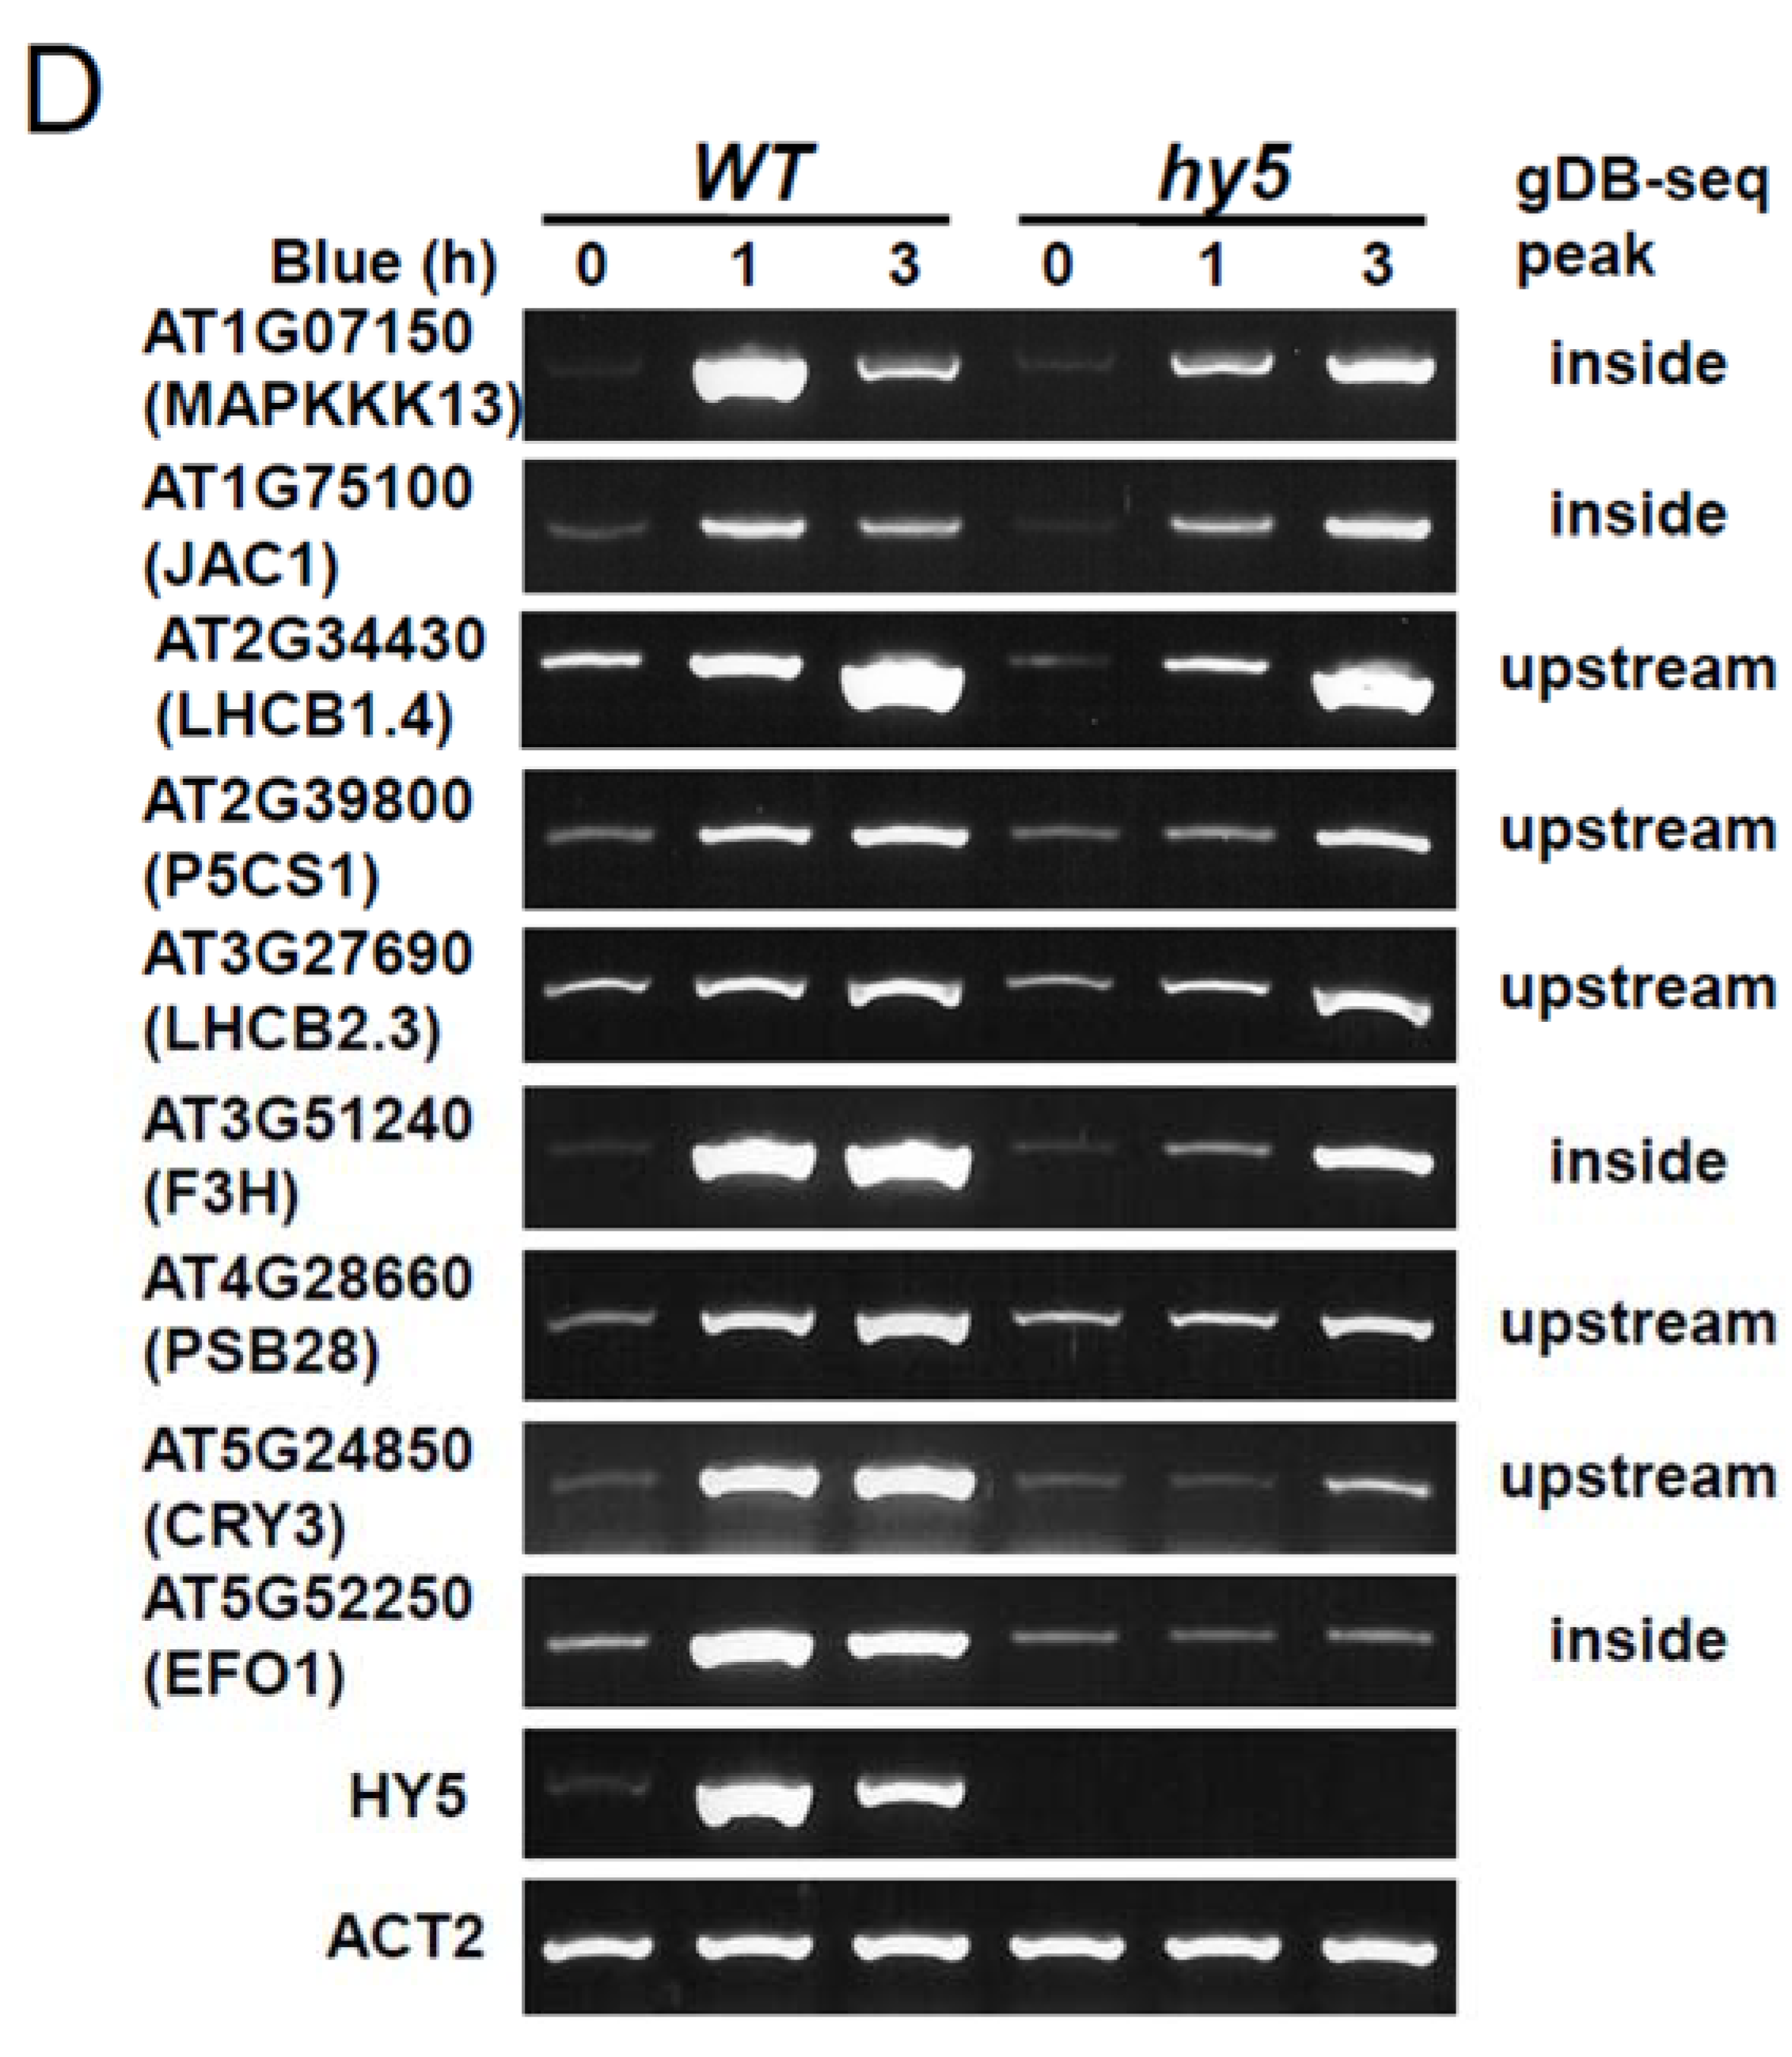
3.5. Role of HY5-Binding Potential in Response to Blue Light Exposure

4. Conclusions
Supplementary Files
Supplementary File 1Supplementary File 2Data Deposit
Acknowledgments
Author Contributions
Conflicts of Interest
References
- Brivanlou, A.H.; Darnell, J.E. Signal transduction and the control of gene expression. Science 2002, 295, 813–818. [Google Scholar] [CrossRef] [PubMed]
- Mitsuda, N.; Ohme-Takagi, M. Functional analysis of transcription factors in Arabidopsis. Plant Cell Physiol. 2009, 50, 1232–1248. [Google Scholar] [CrossRef] [PubMed]
- Bowman, J.L.; Smyth, D.R.; Meyerowitz, E.M. Genes directing flower development in Arabidopsis. Plant Cell 1989, 1, 37–52. [Google Scholar] [CrossRef] [PubMed]
- Ripoll, J.J.; Roeder, A.H.K.; Ditta, G.S.; Yanofsky, M.F. A novel role for the floral homeotic gene APETALA2 during Arabidopsis fruit development. Development 2011, 138, 5167–5176. [Google Scholar] [CrossRef] [PubMed]
- Fujita, Y.; Fujita, M.; Satoh, R.; Maruyama, K.; Parvez, M.M.; Seki, M.; Hiratsu, K.; Ohme-Takagi, M.; Shinozaki, K.; Yamaguchi-Shinozaki, K. AREB1 is a transcription activator of novel ABRE-dependent ABA-signaling that enhances drought stress tolerance in Arabidopsis. Plant Cell 2005, 17, 3470–3488. [Google Scholar] [CrossRef] [PubMed]
- Sakuma, Y.; Maruyama, K.; Osakabe, Y.; Qin, F.; Seki, M.; Shinozaki, K.; Yamaguchi-Shinozaki, K. Functional analysis of an Arabidopsis transcription factor, DREB2A, involved in drought-responsive gene expression. Plant Cell 2006, 18, 1292–1309. [Google Scholar] [CrossRef] [PubMed]
- Sakuma, Y.; Maruyama, K.; Qin, F.; Osakabe, Y.; Shinozaki, K.; Yamaguchi-Shinozaki, K. Dual function of an Arabidopsis transcription factor DREB2A in water-stress- and heat-stress-responsive gene expression. Proc. Natl. Acad. Sci. USA 2006, 103, 18828–18833. [Google Scholar] [CrossRef] [PubMed]
- Yoshida, T.; Fujita, Y.; Sayama, H.; Kidokoro, S.; Maruyama, K.; Mizoi, J.; Shinozaki, K.; Yamaguchi-Shinozaki, K. AREB1, AREB2, and ABF3 are master transcription factors that cooperatively regulate ABRE-dependent ABA signaling involved in drought stress tolerance and require ABA for full activation. Plant J. 2010, 61, 672–685. [Google Scholar] [CrossRef] [PubMed]
- Chang, K.N.; Zhong, S.; Weirauch, M.T.; Hon, G.; Pelizzola, M.; Li, H.; Huang, S.C.; Schmitz, R.J.; Urich, M.A.; Kuo, D.; et al. Temporal transcriptional response to ethylene gas drived growth hormone cross-regulation in Arabidopsis. Elife 2013, 2. [Google Scholar] [CrossRef]
- Chen, F.; Li, B.; Li, G.; Charron, J.; Dai, M.; Shi, X.; Deng, X.W. Arabidopsis phytochrome A directly targets numerous promoters for individualized modulation of genes in a wide range of pathways. Plant Cell 2014, 26, 1949–1966. [Google Scholar] [CrossRef] [PubMed]
- Lee, J.; He, K.; Stolc, V.; Lee, H.; Figueroa, P.; Gao, Y.; Tongprasit, W.; Zhao, H.; Lee, I.; Deng, X.W. Analysis of transcription factor HY5 genomic binding sites revealed its hierarchical role in light regulation of development. Plant Cell 2007, 19, 731–749. [Google Scholar] [CrossRef] [PubMed]
- Ouyang, X.; Li, J.; Li, G.; Li, B.; Chen, B.; Shen, H.; Huang, X.; Mo, X.; Wan, X.; Lin, R.; et al. Genome-wide binding site analysis of FAR-RED ELONGATED HYPOCOTYL3 reveals its novel function in Arabidopsis development. Plant Cell 2011, 23, 2514–2535. [Google Scholar] [CrossRef] [PubMed]
- Liu, X.; Noll, D.M.; Lieb, J.D.; Clarke, N.D. DIP-chip: Rapid and accurate determination of DNA-binding specificity. Genome Res. 2005, 15, 421–427. [Google Scholar] [CrossRef] [PubMed]
- Chattopadhyay, S.; Ang, L.H.; Puente, P.; Deng, X.W.; Wei, N. Arabidopsis bZIP protein HY5 directly interacts with light-responsive promoters in mediating light control of gene expression. Plant Cell 1998, 10, 673–683. [Google Scholar] [CrossRef] [PubMed]
- Osterlund, M.T.; Hardtke, C.S.; Wei, N.; Deng, X.W. Targeted destabilization of HY5 during light-regulated development of Arabidopsis. Nature 2000, 405, 462–466. [Google Scholar] [CrossRef] [PubMed]
- Oyama, T.; Shimura, Y.; Okada, K. The Arabidopsis HY5 gene encodes a bZIP protein that regulates stimulus-induced development of root and hypocotyl. Genes Dev. 1997, 11, 2983–2995. [Google Scholar] [CrossRef] [PubMed]
- Jiao, Y.; Lau, O.S.; Deng, X.W. Light-regulated transcriptional networks in higher plants. Nat. Rev. Genet. 2007, 8, 217–230. [Google Scholar] [CrossRef] [PubMed]
- Singh, A.; Ram, H.; Abbas, N.; Chattopadhyay, S. Molecular interactions of GBF1 with HY5 and HYH proteins during light-mediated seedling development in Arabidopsis thaliana. J. Biol. Chem. 2012, 287, 25995–26009. [Google Scholar] [CrossRef] [PubMed]
- Song, Y.H.; Yoo, C.M.; Hong, A.P.; Kim, S.H.; Jeong, H.J.; Shin, S.Y.; Kim, H.J.; Yun, D.; Lim, C.O.; Bahk, J.D.; et al. DNA-binding study identifies C-box and hybrid C/G-box or C/A-box motifs as high-affinity binding sites for STF1 and LONG HYPOCOTYL5 proteins. Plant Physiol. 2008, 146, 1862–1877. [Google Scholar] [CrossRef] [PubMed]
- Endo, Y.; Sawasaki, T. Cell-free expression systems for eukaryotic protein. Curr. Opin. Biotechnol. 2006, 17, 373–380. [Google Scholar] [CrossRef] [PubMed]
- Takai, K.; Sawasaki, T.; Endo, Y. Practical cell-free protein synthesis system using purified wheat embryos. Nat. Protoc. 2010, 5, 227–238. [Google Scholar] [CrossRef] [PubMed]
- Langmead, B.; Salzberg, S.L. Fast gapped-read alignment with Bowtie 2. Nat. Methods 2012, 9, 357–359. [Google Scholar] [CrossRef] [PubMed]
- Zhang, Y.; Liu, T.; Meyer, C.A.; Eeckhoute, J.; Johnson, D.S.; Bernstein, B.E.; Nusbaum, C.; Myers, R.M.; Brown, M.; Li, W.; et al. Model-based analysis of ChIP-Seq (MACS). Genome Biol. 2008, 9. [Google Scholar] [CrossRef]
- Li, L. GADEM: A genetic algorithm guided formation of spaced dyads coupled with an EM algorithm for motif discovery. J. Comput. Biol. 2009, 16, 317–329. [Google Scholar] [CrossRef] [PubMed]
- Mathelier, A.; Zhao, X.; Zhang, A.W.; Parcy, F.; Worsley-Hunt, R.; Arenillas, D.J.; Buchman, S.; Chen, C.Y.; Chou, A.; Ienasescu, H.; et al. JASPAR 2014: An extensively expanded and updated open-access database of transcription factor binding profiles. Nucleic Acids Res. 2014, 42, D142–D147. [Google Scholar] [CrossRef] [PubMed]
- Hieno, A.; Naznin, H.A.; Hyakumachi, M.; Sakurai, T.; Tokizawa, M.; Koyama, H.; Sato, N.; Nishiyama, T.; Hasebe, M.; Zimmer, A.D.; et al. ppdb: Plant promoter database version 3.0. Nucleic Acids Res. 2014, 42, D1188–D1192. [Google Scholar] [CrossRef] [PubMed]
- Ruckle, M.E.; DeMarco, S.M.; Larkin, R.M. Plastid signals remodel light signaling networks and are essential for efficient chloroplast biogenesis in Arabidopsis. Plant Cell 2007, 19, 3944–3960. [Google Scholar] [CrossRef] [PubMed]
- Trapnell, C.; Pachter, L.; Salzberg, S.L. TopHat: Discovering splice junctions with RNA-Seq. Bioinformatics 2009, 25, 1105–1111. [Google Scholar] [CrossRef] [PubMed]
- Trapnell, C.; Williams, B.A.; Pertea, G.; Mortazavi, A.; Kwan, G.; van Baren, M.J.; Salzberg, S.L.; Wold, B.J.; Pachter, L. Transcript assembly and quantification by RNA-Seq reveals unannotated transcripts and isoform switching during cell differentiation. Nat. Biotechnol. 2010, 28, 511–515. [Google Scholar] [CrossRef] [PubMed]
- Franco-Zorrilla, J.M.; Lopez-Vidriero, I.; Carrasco, J.L.; Godoy, M.; Vera, P.; Solano, R. DNA-binding specificities of plant transcription factors and their potential to define target genes. Proc. Natl. Acad. Sci. USA 2014, 111, 2367–2372. [Google Scholar] [CrossRef] [PubMed]
- Jolma, A.; Kivioja, T.; Toivonen, J.; Cheng, L.; Wei, G.; Enge, M.; Taipale, M.; Vaquerizas, J.M.; Yan, J.; Sillanpää, M.J.; et al. Multiplexed massively parallel SELEX for characterization of human transcription factor binding specificities. Genome Res. 2010, 20, 861–873. [Google Scholar] [CrossRef] [PubMed]
- Jolma, A.; Yan, J.; Whitington, T.; Toivonen, J.; Nitta, K.R.; Rastas, P.; Morgunova, E.; Enge, M.; Taipale, M.; Wei, G.; et al. DNA-binding specificities of human transcription factors. Cell 2013, 152, 327–339. [Google Scholar] [CrossRef] [PubMed]
- Weirauch, M.T.; Yang, A.; Albu, M.; Cote, A.G.; Montenegro-Montero, A.; Drewe, P.; Najafabadi, H.S.; Lambert, S.A.; Mann, I.; Cook, K.; et al. Determination and inference of eukaryotic transcription factor sequence specificity. Cell 2014, 158, 1431–1443. [Google Scholar] [CrossRef] [PubMed]
- Ma, L.; Sun, N.; Liu, X.; Jiao, Y.; Zhao, H.; Deng, X.W. Organ-specific expression of Arabidopsis genome during development. Plant Physiol. 2005, 138, 80–91. [Google Scholar] [CrossRef] [PubMed]
- Holm, M.; Ma, L.G.; Qu, L.J.; Deng, X.W. Two interacting bZIP proteins are direct targets of COP1-mediated control of light-dependent gene expression in Arabidopsis. Genes Dev. 2002, 16, 1247–1259. [Google Scholar] [CrossRef] [PubMed]
- Chang, C.S.; Li, Y.H.; Chen, L.T.; Chen, W.C.; Hsieh, W.P.; Shin, J.; Jane, W.N.; Chou, S.J.; Choi, G.; Hu, J.M.; et al. LZF1, a HY5-regulated transcriptional factor, functions in Arabidopsis de-etiolation. Plant J. 2008, 54, 205–219. [Google Scholar] [CrossRef] [PubMed]
- Datta, S.; Hettiarachchi, C.; Johansson, H.; Holm, M. SALT TOLERANCE HOMOLOG2, a B-box protein in Arabidopsis that activates transcription and positively regulates light-mediated development. Plant Cell 2007, 19, 3242–3255. [Google Scholar] [CrossRef] [PubMed]
- Gangappa, S.N.; Crocco, C.D.; Johansson, H.; Datta, S.; Hettiarachchi, C.; Holm, M.; Botto, J.F. The Arabidopsis B-BOX protein BBX25 interacts with HY5, negatively regulating BBX22 expression to suppress seedling photomorphogenesis. Plant Cell 2013, 25, 1243–1257. [Google Scholar] [CrossRef] [PubMed]
© 2014 by the authors; licensee MDPI, Basel, Switzerland. This article is an open access article distributed under the terms and conditions of the Creative Commons Attribution license (http://creativecommons.org/licenses/by/4.0/).
Share and Cite
Kurihara, Y.; Makita, Y.; Kawashima, M.; Hamasaki, H.; Yamamoto, Y.Y.; Matsui, M. Next-Generation Sequencing of Genomic DNA Fragments Bound to a Transcription Factor in Vitro Reveals Its Regulatory Potential. Genes 2014, 5, 1115-1131. https://doi.org/10.3390/genes5041115
Kurihara Y, Makita Y, Kawashima M, Hamasaki H, Yamamoto YY, Matsui M. Next-Generation Sequencing of Genomic DNA Fragments Bound to a Transcription Factor in Vitro Reveals Its Regulatory Potential. Genes. 2014; 5(4):1115-1131. https://doi.org/10.3390/genes5041115
Chicago/Turabian StyleKurihara, Yukio, Yuko Makita, Mika Kawashima, Hidefumi Hamasaki, Yoshiharu Y. Yamamoto, and Minami Matsui. 2014. "Next-Generation Sequencing of Genomic DNA Fragments Bound to a Transcription Factor in Vitro Reveals Its Regulatory Potential" Genes 5, no. 4: 1115-1131. https://doi.org/10.3390/genes5041115
APA StyleKurihara, Y., Makita, Y., Kawashima, M., Hamasaki, H., Yamamoto, Y. Y., & Matsui, M. (2014). Next-Generation Sequencing of Genomic DNA Fragments Bound to a Transcription Factor in Vitro Reveals Its Regulatory Potential. Genes, 5(4), 1115-1131. https://doi.org/10.3390/genes5041115