Abstract
Background/Objectives: Pothos chinensis is commonly used as traditional medicine in China and India. Codon usage analysis is a good way to understand plants’ evolution. However, there is no report about the codon usage bias of chloroplast genomes in P. chinensis. Methods: In this study, the chloroplast genome of the medicinal plant P. chinensis was newly obtained. Comparative analyses, DNA barcoding investigation, codon usage bias, and phylogenetic reconstruction were conducted to reveal the chloroplast genome characteristics of P. chinensis. Results: The length of the chloroplast genome of P. chinensis was 165,165 bp. A total of 134 genes were annotated, i.e., 90 protein-coding genes, 36 transfer RNA genes, and eight ribosomal RNA genes. Compared to its sister group Anthurium andraeanum, the length of the large single-copy region (LSC) had been expanded, while the small single-copy region (SSC) had been contracted. Within P. chinensis and P. scandens there were no obvious differences in the length of LSC, SSC, and two inverted repeat regions. Based on Pi values, seven hypervariable regions of whole plastomes were identified. The analysis of codons showed that an average frequency of the 50 candidate genes was 35.30%, and these genes preferred A/U-ending codons. The average effective number of codon (ENC) value was 45.49, which indicated weak codon usage bias. ENCs had a highly significant positive correlation with GC3. Fourteen optimal codons had been identified, 11 of which ended with A/U. The results of the neutrality plot, ENC-plot, and PR2-plot analysis indicated that natural selection might have a significant impact on codon usage patterns. Conclusions: Taken together, our study unraveled the codon usage patterns in P. chinensis and provided valuable genetic information for the genus Pothos.
1. Introduction
The angiosperm family Araceae contains eight subfamilies, 144 genera, and 3645 species [1], and distributes in tropical and temperate regions [2,3,4]. Among the eight subfamilies, Pothoideae is the second largest subfamily with approximately 1010 species [1], and divides into Tribe Potheae (including Pothos L., Pedicellarum M. Hotta, and Pothoidium Schott) and Tribe Anthurieae (only Anthurium Schott) [2,3,5]. The largest genus Pothos contains approximately 75 species, and distributes in tropical and subtropical regions of Asia, Australia, Madagascar, and Polynesia, with five species in China [6]. Importantly, Pothos holds high importance as a traditional medicine in China and India, involving significant financial transactions and thus exhibiting robust economic value [7,8,9]. P. chinensis is a traditional medicinal herb to treat rheumatic numbness, traumatic injuries, and fractures [7]. The results of the integration of network pharmacology, serum pharmacochemistry, and metabolomics to investigate the anti-inflammatory mechanism of P. chinensis demonstrated that the anti-inflammatory modulatory network of this species was related to five metabolites, three metabolic pathways, seven targets, and four active components [8]. The Indian people use an infusion of the leaves of P. scandens as a bath for curing convulsions and epilepsy [9]. Recently, phylogenetic analysis strongly supported the sister relationships of Pothos and Anthurium based on chloroplast genomes [10]. Further, a previous study compared the chloroplast genomes of P. scandens and Anthurium huixtlense, and the results showed P. scandens with a unique contraction and expansion of inverted repeats (IRs) [11]. Compared with A. huixtlense, the ratio of transition to transversion mutations of P. scandens was a little higher. So far, the chloroplast genomic composition of another herb P. chinensis is far from being known and fully understood. Therefore, it is necessary to obtain the chloroplast genomes of P. chinensis and reveal the chloroplast genome evolution within Pothos.
The chloroplast genomes have provided valuable opportunities to the development of the specific DNA barcodes within a certain genus [12,13,14]. Authors such as Zhou et al. (2024) resolved the major clades within Gastrochilus based on the whole chloroplast genomes and identified the mutation hotspots to develop specific DNA barcodes [15]. In addition, codon usage bias in chloroplast genome is a widespread phenomenon in plants [16]. Codon bias analysis can reveal natural selection, mutation pressures and evolutionary tendency in chloroplast genomes, which provide crucial insights for evolutionary biology [17]. Different plants experienced diverse environments, and they have had different codon usage patterns mainly for the influencing factors including natural selection, mutation pressure, gene function, and gene length [18,19,20,21]. For instance, the investigation of the codon usage patterns in the chloroplast genomes within five Caragana species showed that the codon usage bias had high similarity in these species, and natural selection was the primary factor on codon usage bias rather than mutation pressures [22]. Here, studying codon usage patterns in chloroplast genomes of P. chinensis would improve our understanding of gene expression status and their evolutionary dynamics.
In this study, we newly sequenced, assembled, and annotated the chloroplast genome of P. chinensis. Moreover, we conducted comparative analysis of this information with two previously released chloroplast genomes of Pothos species, and performed DNA barcoding research, phylogenetic reconstruction, and codon usage bias. The present work is aimed at (1) exploring the general features of Pothos chloroplast genomes at intraspecific and interspecific levels, and (2) revealing the codon usage patterns and its influencing factors in P. chinensis. The results are expected to identify the chloroplast evolutionary patterns of P. chinensis and provide valuable genetic information for the genus Pothos.
2. Materials and Methods
2.1. Sampling and Sequencing
The leaf samples were collected from Libo County, Guizhou Province, China (25°20′57″ N, 107°46′37″ E). The voucher specimen (accession no. ZJS_2023070) was deposited in the specimen room of Anshan Normal University (https://www.asnc.edu.cn/, accessed on 1 January 2024), Contact: Ji-Si Zhang, E-mail: zhangjisi@asnc.edu.cn). Total genomic DNA was extracted from silica gel-dried leaves using the modified CTAB method [23]. An illumina paired-end (PE) library was prepared and sequenced in the Nanjing Novogene Biotechnology Co., Ltd., Nanjing, China.
2.2. Chloroplast Genome Assembly and Annotation
Near 8 Gb of 150 bp paired-end raw reads were generated and used for chloroplast genome assembly. Trimmomatic 0.39 [24] was used to organize and trim overrepresented sequences for obtaining the clean reads. The clean reads were assembled by using GetOrganelle v1.5 [25]. The chloroplast genome of P. chinensis was annotated using GeSeq [26] and Geneious v9.1.4 (http://www.geneious.com/, accessed on 26 December 2024) with P. scandens (MN046891) and P. chinensis (PP754463) as references. The annotated complete chloroplast genome of P. chinensis was deposited in GenBank (the accession number PV938952).
2.3. Structure and Sequence Divergence Analyses
In order to detect the potential expansion and contraction at the boundaries of the inverted repeat regions (IRs), the genes across the boundary regions of LSC/IRb/SSC/IRa were visualized using IRscope v3.1 [27]. Additionally, the Mauve v1.1.3 [28] plugin in Geneious v9.1.4 was employed to conduct the collinearity analysis with default parameters, which was used to detect the gene arrangement.
2.4. Evolutionary Hotspots and Phylogenetic Analysis
The hypervariable regions of three Pothos individuals were detected on the whole chloroplast genomes. The matrix was aligned using MAFFT v7 [29] and manually adjusted in BioEdit v7.0 [30]. The Pi values were calculated in DnaSP v6.12.03 with sliding window analysis by setting the step size to 200 bp and window length to 800 bp [31].
According to the previous molecular phylogenetic studies [10,32], 50 species of Araceae were selected to reconstruct the phylogenetic tree (Table S1). The whole chloroplast genome matrix was aligned using MAFFT v7 [29] and trimmed using Gblock 0.91b (https://www.biologiaevolutiva.org/jcastresana/Gblocks.html, accessed on 5 January 2002) to remove poorly aligned positions. In the ML analysis, the GTRGAMMA model was specified and bootstrap values were calculated on 1000 bootstrap replicates by RAxML [33]. In the MP analysis, a heuristic search with 1000 random addition sequence repeats were conducted, employing TBR branch switching by PAUP 4b10 [34]. All characters were treated as equal and unordered.
2.5. Calculation of Parameters Related to Codon Usage Bias
All protein coding sequences (CDSs) were selected as follows: (1) with the start codon (ATG) and with the stop codons (TAA, TAG, or TGA), (2) no stop codons appeared prematurely within the sequences, and (3) a length greater than 300 bp. Finally, 50 protein-coding genes were chosen and analyzed for the codon usage bias in the P. chinensis chloroplast genome.
The software CodonW 1.4.2 was used to calculate the Relative Synonymous Codon Usage (RSCU) and Effective Number of Codons (ENC). RSCU represents the relative frequency of codon usage in encoding a particular amino acid. An RSCU value greater than 1 indicates high preference, an RSCU value equal to 1 indicates no preference, and an RSCU value less than 1 indicates weak preference [35,36]. The analysis data was organized and analyzed using IBM SPSS 29.0 software. The total GC content (GC_all) of each gene coding region, as well as the GC content at the 1st (GC1), 2nd (GC2), and 3rd (GC3) codon positions, were calculated using the CUSP online program (http://www.bioinformatics.nl/emboss-explorer/, accessed on 6 March 2025).
2.6. Identification of Optimal Codons
Based on the ENC values, the 5 highest (10%) and 5 lowest (10%) ENC values among the 50 candidate genes of P. chinensis were selected to form the high expression group (5 genes) and the low expression group (5 genes), respectively. The RSCU values for both the high and low expression groups were calculated, and the difference in RSCU (ΔRSCU) between the two groups was determined. Codons with ΔRSCU greater than 0.08 were considered high expression codons. The intersection of high expression codons and high frequency codons (RSCU > 1) was taken, and the common codons were identified as the optimal codons [37].
2.7. Neutrality Plot Analysis
Neutrality plot analysis is a method to measure the factors which influenced codon bias. A scatter plot is drawn with GC12 (the average of GC1 and GC2) on the Y-axis and GC3 values of each gene on the X-axis. If there is a high correlation, all the points are distributed along the diagonal, indicating that the base usage patterns at various positions are similar and that the codon usage pattern is mainly related to mutational factors. Conversely, randomly distributed points indicate differences in base usage, suggesting a strong conservation of GC content in the sample and that natural selection has a greater influence on the codon usage pattern [38,39].
2.8. ENC-Plot Analysis
ENC is an important indicator for analyzing the overall level of codon bias in a gene. Genes with high expression levels exhibit strong codon bias and have lower ENC values, while genes with low expression levels use a wider variety of rare codons and have higher ENC values. A two-dimensional scatter plot is drawn with the actual ENC values on the Y-axis and GC3 values on the X-axis, and a standard curve is plotted using the expected ENC values, where ENC = 2 + X + 29/[X2+ (1 − X)2], and X represents the GC3 value. The closer a gene point is to the standard curve, the stronger the influence of the mutation on codon usage bias; the farther a gene point is from the standard curve, the stronger the influence of natural selection on codon usage bias [40].
2.9. PR2-Bias Plot Analysis
PR2-bias plot analysis involves the screening of the base composition at the third position of codons for amino acids encoded by four codons, avoiding the mutational imbalance between A/T and C/G at the third codon position. It follows the rule that no selection or mutational bias occurs when the content of two complementary bases is equivalent [41]. A scatter plot is drawn with A3/(A3 + T3) on the Y-axis and G3/(G3 + C3) on the X-axis. The central point (where A = T and C = G) represents unbiased usage, and the position of each point relative to the center indicates the direction and extent of bias in the gene [42,43].
3. Results
3.1. Chloroplast Genome Characters of P. chinensis
The sequencing of 150 bp single-end reads generated 7.99 GB data (15.15 million reads). The chloroplast reads were used for de novo assembly and provided average coverage depths of 178.2× for P. chinensis. The length of the complete chloroplast genome of P. chinensis (PV938952) is 165,165 bp and it is a typical quadripartite structure, with a small single-copy region (SSC) of 6847 bp, a large single-copy region (LSC) of 103,234 bp, and a pair of IRs of 27,542 bp (Figure 1). There are 134 genes annotated, including 90 protein-coding genes, 36 transfer RNA (tRNAs) genes, and eight ribosomal RNA (rRNAs) genes (Table S2). Within the 134 genes, 72 were related to self-replication, including 10 genes related to the large subunit of the ribosome and 14 related to the small subunit of the ribosome. A total of 52 genes were involved in photosynthesis, including 6 related to ATP synthase, 18 to NADH dehydrogenase, 6 to the cytochrome b/f complex, 6 to the PS I system, 15 to the PS II system, and 1 associated with Rubisco. Additionally, 10 genes were annotated as having other functions (clpP, ccsA, accD, cemA, and matK) or unknown functions (ycf1, ycf2, ycf3, and ycf4). In total, 13 genes had a single intron (atpF, ndhA, ndhB, petB, petD, rpl2, rpoC1, rps12, trnAUGC, trnIGAU, trnKUUU, trnLUAA, and trnVUAC), while 2 genes (clpP and ycf3) contained two introns (Table S2).
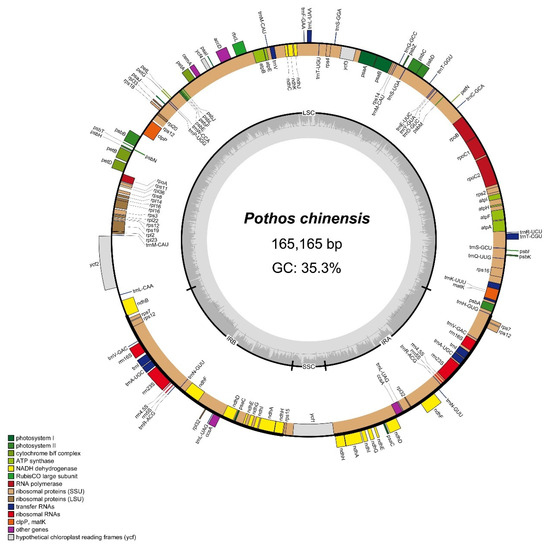
Figure 1.
Chloroplast genome map of P. chinensis. Genes positioned in the outer circle are transcribed in a counterclockwise manner, whereas genes in the inner circle are transcribed in the clockwise direction. Within the inner circle, dark gray regions correspond to segments with elevated GC content, while lighter gray areas indicate higher AT content.
3.2. Structural Variations, Sequence Divergence, and Nucleotide Diversity
The collinearity analysis revealed no gene rearrangements or inversions in the three Pothos chloroplast genomes (Figure 2A). The IR boundary map showed that the ndhB gene in three Pothos individuals spanned from LSC to IRb with 164–172 bp departed in IRb (Figure 2B). Moreover, the ndhH and rps15 genes were found adjacent to the junction between the SSC and IRb (JSB), while none of them spanned the junction. Also, ycf1 and ndhH were found adjacent to the junction between the LSC and IRa (JSA) (Figure 2B). To further explore the mutational hotspots to develop the specific DNA barcodes of Pothos species, the results of nucleotide diversity (Pi) values are shown in Figure 2C. According to the ranking of Pi values, the seven hypervariable regions of whole chloroplast genomes were identified: trnK-rps16, trnS-T, atpF-H, trnT-L, trnL-ndhB, rps15-ycf1, and ycf1.

Figure 2.
Analysis of collinearity, boundary characteristics, and nucleotide diversity of chloroplast genomes within Pothos. (A) Collinearity analysis of chloroplast genomes. The same color represents homologous segments between different chloroplast genomes and were connected by lines. (B) Four junctions in the chloroplast genomes of different Pothos species. (C) Nucleotide diversity analysis. The horizontal axis shows the nucleotide positions, and the vertical axis displays the corresponding Pi values.
3.3. Phylogenetic Analysis
Both ML and MP analyses showed that P. chinensis was a sister group of A. andraeanum (ML-BP = 100%, BI-PP = 1.00), and the sampled Pothos species formed a clade with the highest supporting values (ML-BP = 100%, BI-PP = 1.00). Among them, P. chinensis was closely related to P. scandens with strongly supported values (ML-BP = 100%, BI-PP = 1.00, Figure 3).

Figure 3.
Phylogenetic tree of Araceae based on chloroplast genomes. The numbers on branches represented the bootstrap values of ML and MP, respectively.
3.4. Codon Usage Bias and the Optimal Codons
The ENC values in the chloroplast genome of P. chinensis ranged from 34.72 (for rps18) to 54.41 (for clpP), with an average of 45.49. Among the 50 genes, only the ENC value of rps18 was less than 35, which indicated a relatively weak codon usage bias in the chloroplast genome of P. chinensis (Table S3). The overall GC content across all genes (GC_all) of P. chinensis ranged from 30.20% (for ycf1) to 44.44% (for psbC), with an average of 38.34% (Table S3). The GC content at the first, second, and third codon positions (GC1, GC2, and GC3) ranged from 32.92% (for ccsA) to 57.79% (for rbcL), 28.53% (for ycf1) to 55.40% (for rps11), and 20.59% (for rps18) to 51.94% (for ycf2), respectively (Table S3). The averages of GC1, GC2, and GC3 were 47.02%, 39.80%, and 28.20%, respectively (Table S3). GC_all showed a highly significant positive correlation with GC1, GC2, and GC3 at the 0.01 level. GC1 and GC2 were significantly positively correlated, but GC3 did not show a significant correlation with either GC1 or GC2. ENC had a highly significant positive correlation with GC3 and a significant positive correlation with GC1, yet no relevant correlation with GC2. This indicated that the codon usage bias in the chloroplast genome of P. chinensis was primarily influenced by GC3 and GC1, with relatively minor influences from GC2 (Table 1).

Table 1.
Correlation analysis of codon parameters in P. chinensis chloroplast genes.
There were 14 high-expression preferred codons with ΔRSCU ≥ 0.08 (Table 2), and 32 high-frequency codons with RSCU > 1 (Figure 4). The codons that simultaneously meet the conditions of being both high-expression preferred and high-frequency were considered the optimal codons; therefore, 14 codons were selected as the optimal codons (including GCU, AGA, CAA, AUU, UUA, UUG, AAA, CCU, AGU, UCC, UCG, ACU, GUA, and GUU). Among these codons, the GCU codon had the highest ΔRSCU value (0.80; Table 2). There were 11 codons ending with A/U and 3 codons ending with G/C, indicating a preference for optimal codons in P. chinensis to end with A/U bases.
Table 2.
Optimal codons in the chloroplast genome of P. chinensis.

Figure 4.
Analysis of relative synonymous codon usage of chloroplast genes in P. chinensis. Except for the RSCU values of methionine and tryptophan that are equal to 1, the RSCU values of the 32 codons are greater than 1, and those of 30 codons are less than 1.
3.5. Neutrality Plot Analysis
The neutrality plot of the chloroplast genome of P. chinensis (PV938952) revealed that all of the genes were distributed above the diagonal (Figure 5A). The GC3 distribution ranged from 20.59 to 35.64, while the GC12 distribution ranged from 32.74 to 55.76. Correlation analysis between GC3 and GC12 yielded a p-value of 0.2300, with a regression coefficient of 0.2718, which represented a weak relationship between them. The contribution rate of internal mutation was 27.18%, while that of natural selection was 72.82%. Moreover, the regression coefficient of P. chinensis (PP754463) was 0.2932, and that of P. scandens was 0.2649. These results indicate that natural selection might have a stronger impact on codon preference in the chloroplast genomes of the genus Pothos than internal mutational pressure.
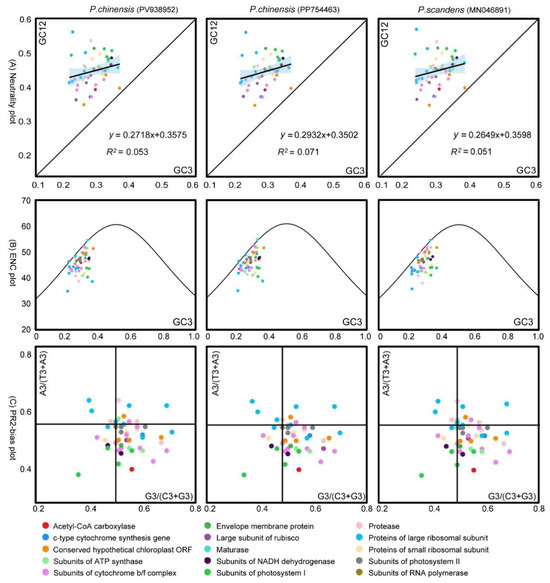
Figure 5.
Analysis of the causes of codon preference in P. chinensis. (A) Neutrality plot analysis. The black line represents the correlation trend, with the corresponding values at the bottom of the plot. (B) ENC-plot analysis. When a data point is far-distant from the standard curve, it indicates that the codon usage bias is predominantly influenced by natural selection. (C) PR2-plot analysis. The GC bias is plotted on the horizontal -axis, while the AT bias is plotted on the vertical -axis.
3.6. ENC-Plot Analysis
The results of the ENC-plot analysis of the three Pothos chloroplast genomes are shown in Figure 5B. The majority of the genes in the three plant chloroplast genomes were located below the standard curve, suggesting that the ENCobs values of these genes differ substantially from the ENCexp. A subsequent statistical analysis of the ENC ratios revealed that only 10 genes in each genome fall within the range of −0.05 to 0.05, while 40 genes exhibited ENC ratios outside this range (Figure 6). Collectively, these findings indicated that the codon preference in the three Pothos chloroplast genomes was more influenced by natural selection than internal mutational pressure.
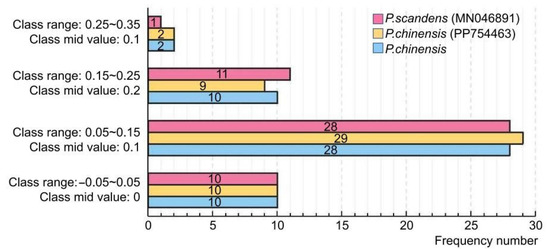
Figure 6.
Distribution of ENC ratio frequency.
3.7. Parity-Rule 2 (PR2) Bias Plot Analysis
Codon preference in the chloroplast genome was conducted through PR2-plot graphing (Figure 5C). The coding genes were unevenly distributed across the four regions of the plot, with some points farther away from the axes in all the three chloroplast genomes. There was a higher density of genes in the lower right quadrant of the plot. Specifically, there were 37 points in P. chinensis (PV938952) with G3/(G3 + C3) > 0.5 and 36 points with A3/(A3 + T3) < 0.5. In P. chinensis (PP754463), these corresponding numbers were 35 and 36, respectively. In P.scandens (MN046891), there were 34 points with G3/(G3 + C3) > 0.5 and 36 points with A3/(A3 + T3) < 0.5. These results indicated that in the three chloroplast genomes, the frequency of the third base usage in codons is U > A and G > C. This also suggests that the codon usage pattern in P. chinensis is subject to natural selection.
4. Discussion
4.1. Chloroplast Genome Evolution Within P. chinensis
In this study, we screened the chloroplast genome of P. chinensis and compared the chloroplast characters at the interspecific and intraspecific level, which provided genetic resources for understanding the evolution of chloroplast genomes in this group. The chloroplast genome of P. chinensis has a typical quadripartite structure, consisting of one LSC, one SSC, and two IR regions, which were similar to the other Araceae species and the angiosperm [10]. The lengths of LSC, SSC, and two IRs are similar within P. chinensis and P. scandens (Figure 2), which indicated that the chloroplast genome characters may be conserved within Pothos. Further, the length of the P. chinensis individual obtained in this study (PV938952, 165,165 bp) is slightly bigger than the other one (PP754463, 163,834 bp, Figure 2B), and this reflects the genetic diversity of the chloroplast genome within the different individuals of the same species. However, compared to its sister group A. andraeanum, the SSC length of P. chinensis was obviously shorter, while the LSC length was bigger. The results were similar with those among P. scandens and A. andraeanum [11].
No visible gene rearrangement was detected, and all IR boundaries were conserved without obvious expansion or contraction within the two Pothos species (Figure 2B). The genes at the boundary of JLB, JSB, JSA, and JLA show consistency, only with a slight length difference. In addition, our results detected seven hypervariable regions of whole plastomes (trnK-rps16, trnS-T, atpF-H, trnT-L, trnL-ndhB, rps15-ycf1, and ycf1) within Pothos (Figure 2C), most of which were also proposed in previous studies to resolve the phylogenetic relationships among the related species [43,44,45]. Therefore, we consider that the seven hypervariable regions of the whole chloroplast genome might be powerful DNA markers for the phylogenetic analysis of Pothos.
4.2. Natural Selection and the Codon Preference of P. chinensis Chloroplast Genome
Synonymous codons exhibit a certain degree of preference in their usage across different species and among different genes within the same species. Genes with high expression levels typically possess optimal codons and demonstrate stronger codon usage bias [46,47,48,49,50]. In this study, GC3 in the chloroplast genome of P. chinensis exhibited no significant correlation with GC1 or GC2, and the proportion of GC3 was the lowest among the three (Table 1). Furthermore, the codon usage bias in the chloroplast genome of P. chinensis was found to predominantly end with A/U nucleotides (Table 2, Figure 5C). A similar pattern was detected in other monocots, such as the Poaceae and Lilium species [51,52]. The degree of codon preference can be determined using the ENC value. When the ENC is greater than 35, it indicates that the codon preference is relatively weak and vice versa [36]. This study found that most ENC values in the chloroplast genome of P. chinensis are greater than 35, indicating a relatively weak codon usage preference in the chloroplast genome of P. chinensis.
To gain a clearer understanding of the factors influencing codon usage preference, this study conducted neutral plot, ENC-plot, and PR2-plot analyses on the chloroplast genome codons of P. chinensis (Figure 5). In the neutral plot analysis, the regression coefficient for P. chinensis was 0.2718, indicating a stronger influence by natural selection than mutation. In the ENC-plot analysis, most genes in P. chinensis were significantly distant from the standard curve, with actual ENC values differing from expected ENC values, suggesting that the codon preference characteristics of these genes are primarily constrained by natural selection. In the PR2-plot analysis, most genes in the chloroplast genome of P. chinensis were located in the lower right quadrant of the plot, indicating different usage frequencies among the four bases, specifically T > A and G > C. This also suggests that codon usage is more influenced by natural selection. These analytic data lead us to conclude that the main factor influencing codon usage preference in the chloroplast genome of P. chinensis is natural selection. This result is consistent with the studies on the codon usage preference of chloroplast genomes in some monocotyledonous plants [50,51] and dicotyledonous plants [52,53]. Furthermore, 14 optimal codons were screened using RSCU and ENC values (Figure 4 and Table 2), and most of the optimal codons ended with A or U. In future research, the reasons behind the influence of natural selection upon codon usage bias should be explored.
5. Conclusions
In this study, the whole chloroplast genome of P. chinensis was newly obtained, and its GC content and CDS content characteristics are conserved. Compared to the sister group A. andraeanum, the length of LSC and SSC in P. chinensis and P. scandens expanded and contracted, respectively. According to Pi values, seven hypervariable regions (trnK-rps16, trnS-T, atpF-H, trnT-L, trnL-ndhB, rps15-ycf1, and ycf1) were identified. Both GC content and ENC values revealed that the codon usage bias of the P. chinensis chloroplast genome was weak, and the codon usage bias was found to predominantly end with A/U. Further, the results of neutral plot, PR2-plot, and ENC-plot concluded that natural selection is the main factor influencing codon usage bias in the chloroplast genome of P. chinensis. Fourteen optimal codons were identified in the chloroplast genome of P. chinensis. These findings might play an essential role in the chloroplast evolutionary dynamics of Pothos.
Supplementary Materials
The following supporting information can be downloaded at: https://www.mdpi.com/article/10.3390/genes16091017/s1, Table S1: Taxa, voucher and GenBank accession numbers used in this study; Table S2: Group of chloroplast genome genes in P. chinensis; Table S3: Basic parameters of codon usage bias of P. chinensis chloroplast genes.
Author Contributions
H.C.: conceptualization, formal analysis, investigation, data curation, original draft preparation; J.Z.: conceptualization, investigation, data curation, funding acquisition, supervision, writing—review and editing. All authors have read and agreed to the published version of the manuscript.
Funding
This research was supported by the Funding of a Special Project for Applying for a Master’s Degree during the 14th Five-Year Plan of Anshan Normal University [sszx077].
Institutional Review Board Statement
Not applicable.
Informed Consent Statement
Not applicable.
Data Availability Statement
The data presented in this study are openly available in GenBank (National Center for Biotechnology Information) under the accession number PV938952.
Conflicts of Interest
The authors declare no conflicts of interest.
Correction Statement
This article has been republished with a minor correction to the Data Availability Statement. This change does not affect the scientific content of the article.
References
- Croat, T.B. Araceae, a family with great potential. Ann. Mo. Bot. Gard. 2019, 104, 3–9. [Google Scholar] [CrossRef]
- Cabrera, L.I.; Salazar, G.A.; Chase, M.W.; Mayo, S.J.; Bogner, J.; Dávila, P. Phylogenetic relationships of aroids and duckweeds (Araceae) inferred from coding and noncoding plastid DNA. Am. J. Bot. 2008, 95, 1153–1165. [Google Scholar] [CrossRef]
- Cusimano, N.; Bogner, J.; Mayo, S.J.; Boyce, P.C.; Wong, S.Y.; Hesse, M.; Hetterscheid, W.L.A.; Keating, R.C.; French, J.C. Relationships within the Araceae: Comparison of morphological patterns with molecular phylogenies. Am. J. Bot. 2011, 98, 654–668. [Google Scholar] [CrossRef] [PubMed]
- Nauheimer, L.; Metzler, D.; Renner, S.S. Global history of the ancient monocot family Araceae inferred with models accounting for past continental positions and previous ranges based on fossils. New Phytol. 2011, 195, 938–950. [Google Scholar] [CrossRef]
- Chartier, M.; Gibernau, M.; Renner, S.S. The evolution of pollinator-plant interaction types in the Araceae. Evolution 2014, 68, 1533–1543. [Google Scholar] [CrossRef]
- Li, H.; Boyce, P.C. Pothos. In Flora of China; Wu, Z.-Y., Raven, P.H., Hong, D.-Y., Eds.; Science Press: Beijing, China, 2010; Volume 23, pp. 6–8. [Google Scholar]
- Bi, X.-L.; Chen, X.; Jiang, J.-Y.; Liu, M.-Y.; Xu, A.-L.; Luo, W.-H.; Lin, X.-Y. Chemical constituents from Pothos chinensis. J. Chin. Med. Mater. 2017, 40, 1112–1115. [Google Scholar]
- Xiao, G.-L.; Yang, M.-J.; Zeng, Z.-H.; Tang, R.-Y.; Jiang, J.-Y.; Wu, G.-Y.; Xie, C.-H.; Jia, D.-Z.; Bi, X.-L. Investigation into the anti-inflammatory mechanism of Pothos chinensis (Raf.) Merr. By regulating TLR4/MyD88/NF-κB pathway: Integrated network pharmacology, serum pharmacochemistry, and metabolomics. J. Ethnopharmacol. 2024, 334, 118520. [Google Scholar] [CrossRef]
- Sajeesh, T.; Arunachalam, K.; Parimelazhagan, T. Antioxidant and antipyretic studies on Pothos scandens L. Asian Pac. J. Trop. Med. 2011, 4, 889–899. [Google Scholar]
- Henriquez, C.L.; Arias, T.; Pires, J.C.; Croat, T.B.; Schaal, B.A. Phylogenomics of the plant family Araceae. Mol. Phylogenet. Evol. 2014, 75, 91–102. [Google Scholar] [CrossRef] [PubMed]
- Abdullah; Henriquez, C.L.; Mehmood, F.; Carlsen, M.M.; Islam, M.; Waheed, M.T.; Poczai, P.; Croat, T.B.; Ahmed, I. Complete chloroplast genomes of Anthurium huixtlense and Pothos scandens (Pothoideae, Araceae): Unique inverted repeat expansion and contraction affect rate of evolution. J. Mol. Evol. 2020, 88, 562–574. [Google Scholar] [CrossRef] [PubMed]
- Dong, W.-P.; Xu, C.; Cheng, T.; Lin, K.; Zhou, S.-L. Sequencing angiosperm plastid genomes made easy: A complete set of universal primers and a case study on the phylogeny of Saxifragales. Genome Biol. Evol. 2013, 5, 989–997. [Google Scholar] [CrossRef]
- Xue, S.; Shi, T.; Luo, W.; Ni, X.-D.; Iqbal, S.; Ni, Z.; Huang, X.; Yao, D.; Shen, Z.-J.; Gao, Z.-H. Comparative analysis of the complete chloroplast genome among Prunus mume, P. armeniaca, and P. salicina. Hortic. Res. 2019, 6, 89. [Google Scholar] [CrossRef]
- Liu, D.-K.; Tu, X.-D.; Zhao, Z.; Zeng, M.-Y.; Zhang, S.; Ma, L.; Zhang, G.-Q.; Wang, M.-M.; Liu, Z.-J.; Lan, S.-R.; et al. Plastid phylogenomic data yield new and robust insights into the phylogeny of Cleisostoma-Gastrochilus clades (Orchidaceae, Aeridinae). Mol. Phylogenet. Evol. 2020, 145, 106729. [Google Scholar] [CrossRef]
- Zhou, P.; Lei, W.-S.; Shi, Y.-K.; Liu, Y.-Z.; Luo, Y.; Li, J.-H.; Xiang, X.-G. Plastome evolution, phylogenomics, and DNA barcoding investigation of Gastrochilus (Aeridinae, Orchidaceae), with a focus on the systematic position of Haraella retrocalla. Int. J. Mol. Sci. 2024, 25, 8500. [Google Scholar] [CrossRef]
- Fages-Lartaud, M.; Hundvin, K.; Hohmann-Marriott, M.F. Mechanisms governing codon usage bias and the implications for protein expression in the chloroplast of Chlamydomonas reinhardtii. Plant J. 2022, 112, 919–945. [Google Scholar] [CrossRef] [PubMed]
- Iriarte, A.; Lamolle, G.; Musto, H. Codon usage bias: An endless tale. J. Mol. Evol. 2021, 89, 589–593. [Google Scholar] [CrossRef]
- Xu, C.; Cai, X.-N.; Chen, Q.-Z.; Zhou, H.-X.; Cai, Y.; Ben, A.-L. Factors affecting synonymous codon usage bias in chloroplast genome of Oncidium Gower Ramsey. Evol. Bioinform. 2011, 7, 271–278. [Google Scholar] [CrossRef]
- Li, N.; Li, Y.-Y.; Zheng, C.-C.; Huang, J.-G.; Zhang, S.-Z. Genome-wide comparative analysis of the codon usage patterns in plants. Genes. Genom. 2016, 38, 723–731. [Google Scholar] [CrossRef]
- Romero, H.; Zavala, A.; Musto, H. Codon usage in Chlamydia trachomatis is the result of strand-specific mutational biases and a complex pattern of selective forces. Nucl. Acid. Res. 2000, 28, 2084–2090. [Google Scholar] [CrossRef] [PubMed]
- Duret, L. tRNA gene number and codon usage in the C. elegans genome are co-adapted for optimal translation of highly expressed genes. Trends Genet. 2000, 16, 287–289. [Google Scholar] [CrossRef]
- Li, X.-J.; Liu, L.-E.; Ren, Q.-D.; Zhang, T.; Hu, N.; Sun, J.; Zhou, W. Analysis of synonymous codon usage bias in the chloroplast genome of five Caragana. BMC Plant Biol. 2025, 25, 322. [Google Scholar] [CrossRef] [PubMed]
- Doyle, J.J.; Doyle, J.L. A rapid DNA isolation procedure for small amounts of fresh leaf tissue. Phytochem. Bull. 1987, 19, 11–15. [Google Scholar]
- Bolger, A.M.; Lohse, M.; Usadel, B. Trimmomatic: A flexible trimmer for Illumina sequence data. Bioinformatics 2014, 30, 2114–2120. [Google Scholar] [CrossRef]
- Jin, J.-J.; Yu, W.-B.; Yang, J.-B.; Song, Y.; dePamphilis, C.W.; Yi, T.-S.; Li, D.-Z. GetOrganelle: A fast and versatile toolkit for accurate de novo assembly of organelle genomes. Genome Biol. 2020, 21, 241. [Google Scholar] [CrossRef]
- Tillich, M.; Lehwark, P.; Pellizzer, T.; Ulbricht-Jones, E.S.; Fischer, A.; Bock, R.; Greiner, S. GeSeq-versatile and accurate annotation of organelle genomes. Nucl. Acid. Res. 2017, 45, 6–11. [Google Scholar] [CrossRef]
- Amiryousefi, A.; Hyvönen, J.; Poczai, P. IRscope: An online program to visualize the junction sites of chloroplast genomes. Bioinformatics 2018, 34, 3030–3031. [Google Scholar] [CrossRef]
- Darling, A.E.; Mau, B.; Perna, N.T. ProgressiveMauve: Multiple genome alignment with gene gain, loss and rearrangement. PLoS ONE 2010, 5, e11147. [Google Scholar] [CrossRef]
- Katoh, K.; Toh, H. Parallelization of the MAFFT multiple sequence alignment program. Bioinformatics 2010, 26, 1899–1900. [Google Scholar] [CrossRef]
- Hall, T.A. BioEdit: A user-friendly biological alignment editor and analysis program for Windows 95/98/NT. Nucleic Acids Symp. Ser. 1999, 41, 95–98. [Google Scholar]
- Rozas, J.; Ferrer-Mata, A.; Sánchez-DelBarrio, J.C.; Guirao-Rico, S.; Librado, P.; Ramos-Onsins, S.E.; Sánchez-Gracia, A. DnaSP 6: DNA sequence polymorphism analysis of large data sets. Mol. Biol. Evol. 2017, 34, 3299–3302. [Google Scholar] [CrossRef] [PubMed]
- Zhao, L.; Yang, Y.-Y.; Qu, X.-J.; Ma, H.; Hu, Y.; Li, H.-T.; Yi, T.-S.; Li, D.-Z. Phylotranscriptomic analyses reveal multiple whole-genome duplication events, the history of diversification and adaptations in the Araceae. Ann. Bot. 2023, 131, 199–213. [Google Scholar] [CrossRef] [PubMed]
- Stamatakis, A. RAxML version 8: A tool for phylogenetic analysis and post-analysis of large phylogenies. Bioinformatics 2014, 30, 1312–1313. [Google Scholar] [CrossRef] [PubMed]
- Swofford, D.L. PAUP*: Phylogenetic Analysis Using Parsimony (and Other Methods), Version 4.0b10; Sinauer: Sunderland, MA, USA, 2003. [Google Scholar]
- Lee, S.; Weon, S.; Lee, S.; Kang, C. Relative codon adaptation index, a sensitive measure of codon usage bias. Evol. Bioinform. 2010, 6, 47–55. [Google Scholar] [CrossRef]
- Wright, F. The ‘effective number of codons’ used in a gene. Gene 1990, 87, 23–29. [Google Scholar] [CrossRef]
- Bu, Y.-F.; Wu, X.-Y.; Sun, N.; Man, Y.; Jing, Y.-P. Codon usage bias predicts the functional MYB10 gene in Populus. J. Plant Physiol. 2021, 265, 153491. [Google Scholar] [CrossRef]
- Vicario, S.; Moriyama, E.N.; Powell, J.R. Codon usage in twelve species of Drosophila. BMC Evol. Biol. 2007, 7, 226. [Google Scholar] [CrossRef]
- Tao, P.; Dai, L.; Luo, M.-C.; Tang, F.-Q.; Tien, P.; Pan, Z.-S. Analysis of synonymous codon usage in classical swine fever virus. Virus Genes 2009, 38, 104–112. [Google Scholar] [CrossRef]
- Sueoka, N. Intrastrand parity rules of DNA base composition and usage biases of synonymous codons. J. Mol. Evol. 1995, 40, 318–325. [Google Scholar] [CrossRef]
- Sueoka, N. Translation-coupled violation of Parity Rule 2 in human genes is not the cause of heterogeneity of the DNA G+C content of third codon position. Gene 1999, 238, 53–58. [Google Scholar] [CrossRef] [PubMed]
- Sueoka, N. Near homogeneity of PR2-bias fingerprints in the human genome and their implications in phylogenetic analyses. J. Mol. Evol. 2001, 53, 469–476. [Google Scholar] [CrossRef]
- Small, R.L.; Ryburn, J.A.; Cronn, R.C.; Seelanan, T.; Wendel, J.F. The tortoise and the hare: Choosing between noncoding plastome and nuclear Adh sequences for phylogenetic reconstruction in a recently diverged plant group. Am. J. Bot. 1998, 85, 1301–1315. [Google Scholar] [CrossRef]
- Shaw, J.; Lickey, E.; Beck, J.T.; Farmer, S.B.; Liu, W.-S.; Miller, J.; Siripun, K.C.; Winder, C.T.; Schilling, E.E.; Small, R.L. The tortoise and the hare II: Relative utility of 21 noncoding chloroplast DNA sequences for phylogenetic analysis. Am. J. Bot. 2005, 92, 142–166. [Google Scholar] [CrossRef] [PubMed]
- Shaw, J.; Lickey, E.B.; Schilling, E.E.; Small, R.L. Comparison of whole chloroplast genome sequences to choose noncoding regions for phylogenetic studies in angiosperms: The tortoise and the hare III. Am. J. Bot. 2007, 94, 275–288. [Google Scholar] [CrossRef] [PubMed]
- Gustafsson, C.; Govindarajan, S.; Minshull, J. Codon bias and heterologous protein expression. Trends Biotechnol. 2004, 22, 346–353. [Google Scholar] [CrossRef]
- Ingvarsson, P.K. Gene expression and protein length influence codon usage and rates of sequence evolution in Populus tremula. Mol. Biol. Evol. 2007, 24, 836–844. [Google Scholar] [CrossRef]
- Elena, C.; Ravasi, P.; Castelli, M.E.; Peirú, S.; Menzella, H.G. Expression of codon optimized genes in microbial systems: Current industrial applications and perspectives. Front. Microbiol. 2014, 5, 21. [Google Scholar] [CrossRef]
- Gerrit, B.; Diarmaid, H. The selective advantage of synonymous codon usage bias in Salmonella. PLoS Genet. 2016, 12, e1005926. [Google Scholar]
- Zhang, Y.; Nie, X.; Jia, X.; Zhao, C.; Biradar, S.S.; Wang, L.; Du, X.; Weining, S. Analysis of codon usage patterns of the chloroplast genomes in the Poaceae family. Aust. J. Bot. 2012, 60, 461–470. [Google Scholar] [CrossRef]
- Dai, G.-N.; Shang, M.-Y.; Wang, J.-L.; Zheng, J.-M.; Liao, B.-B.; Liu, Y.-L.; Duan, B.-Z. Codon bias and phylogenesis analysis of chloroplast genome in medicinal plants of Lilium. Chin. Tradit. Herbal. Drugs. 2024, 55, 3835–3844. [Google Scholar]
- Nie, X.; Deng, P.; Feng, K.; Liu, P.; Du, X.; You, F.M.; Weining, S. Comparative analysis of codon usage patterns in chloroplast genomes of the Asteraceae family. Plant. Mol. Biol. Rep. 2014, 32, 828–840. [Google Scholar] [CrossRef]
- Zhang, R.-Z.; Zhang, L.; Wang, W.; Zhang, Z.; Du, H.-H.; Qu, Z.; Li, X.-Q.; Xiang, H. Differences in codon usage bias between photosynthesis-related genes and genetic system-related genes of chloroplast genomes in cultivated and wild Solanum species. Int. J. Mol. Sci. 2018, 19, 3142. [Google Scholar] [CrossRef] [PubMed]
Disclaimer/Publisher’s Note: The statements, opinions and data contained in all publications are solely those of the individual author(s) and contributor(s) and not of MDPI and/or the editor(s). MDPI and/or the editor(s) disclaim responsibility for any injury to people or property resulting from any ideas, methods, instructions or products referred to in the content. |
© 2025 by the authors. Licensee MDPI, Basel, Switzerland. This article is an open access article distributed under the terms and conditions of the Creative Commons Attribution (CC BY) license (https://creativecommons.org/licenses/by/4.0/).