Abstract
Background: Lycium chinense has been acknowledged for its substantial nutritional benefits. The “Mengqi No.1” variety of L. chinense is known for its high yield and exceptional quality. Methods: We screened twenty dominant endophytic bacterial genera based on OTUs from L. chinense fruits during three developmental stages. Results: Forty-three differential amino acid metabolites were selected from L. chinense fruits. Five endophytic bacteria (Enterococcus, Escherichia-Shigella, Bacteroides, Pseudomonas, and Bacillus) were dominant genera in green fruit (GF, 16–19 days after flowering), color-changing fruit (CCF, 22–25 days after flowering), and red-ripe fruit (RRF, 31–34 days after flowering). Four endophytic bacterial genera (Enterococcus, Bacillus, Pseudomonas, and Rhodanobacter) showed positive correlation with twenty different amino acid metabolites and negative correlation with seven different amino acid metabolites. Conclusions: Five genes (AST1, ltaE1, TAT1, SHMT2, and SHMT3) indicated positive correlation with seventeen different amino acid metabolites and negative correlation with eight different amino acid metabolites. AST1 gene had a major role in regulating arginine biosynthesis (ko00220); ltaE1, SHMT2, and SHMT3 genes were major in regulating glycine, serine, and threonine metabolism (ko00260); and TAT1 gene had a major role in regulating tyrosine metabolism (ko00350). These findings offer insights into the relationship between amino acid synthesis and endophytic bacteria in L. chinense fruits.
1. Introduction
Amino acids serve as key constituents in the metabolism of proteins, energy, and nitrogen within the primary metabolic processes of the plant. They act as precursors for a range of active compounds that play specific roles in plant–microbe interactions, which remain largely unexplored. It is probable that individual amino acids also participate in signaling events that occur during biotic interactions [1]. Camalexin, a sulfur-containing indolic compound with antifungal properties, is derived from tryptophan (Trp). This compound is particularly specific to the Brassicaceae family and serves as the most significant phytoalexin found in Arabidopsis [2]. Despite concentrating on amino acid-derived compounds, the specialized metabolism of plants is exceedingly intricate and possesses the capability to offer a significant degree of specificity in plant–microbe interactions [1]. Altering the structural arrangement of amino acids served as a strategy to prevent the microbial breakdown of these compounds [3]. Lysine acetylation could play a significant regulatory role in modulating the function of aminoacyl-tRNA synthetases (aaRSs) and the synthesis of proteins [4]. The process of amino acid exudation by plants necessitates transport across multiple membranes, including the apoplast and cytoplasm for exudation or uptake, as well as across the membranes of intracellular compartments involved in the synthesis, metabolism, and storage of amino acids, such as chloroplasts, mitochondria, and vacuoles [5]. Additionally, this transport occurs between various cells and plant organs to fulfill the heightened local demand resulting from interactions with microbes [1].
Endophytes that inhabit various parts of plants, including roots, stems, flowers, and fruits, obtain nutrients from their host and were well known for their mutualistic associations with host plants. They play a crucial role in enhancing plant growth and assisting in the management of abiotic stress [6]. Mycorrhizal fungi and endophytes associated with plants significantly contribute to plant health by facilitating the acquisition of essential nutrients and managing environmental stressors [7,8,9]. Both plants and microbes synthesize a variety of diverse metabolites and proteins that serve multiple functions within the context of organismal and environmental interactions [10]. The enhancement of plant growth and fitness through endophytes underscores their potential as environmentally friendly alternatives for increasing crop production while reducing reliance on synthetic fertilizers and pesticides [7], provided that current limitations in commercial applications were addressed [10]. In addition to their essential ecological functions, endophytes were increasingly recognized as valuable biological resources for the production of high-value metabolites with pharmacological significance. These organisms exhibit host mimicry through their autonomous synthesis of metabolites, which were anticipated to be promising candidates for genetic engineering applications [11].
The use of L. chinense has been widespread in addressing a range of health issues [12]. Lycium barbarum polysaccharide (LBP) has been widely reported to exhibit anti-aging, antioxidant, anti-apoptotic, and anti-inflammatory effects [13,14]. It has demonstrated significant potential in the prevention and treatment of various diseases, including adolescent depression, neuroprotection, retinal protection, and heart failure [15,16,17,18]. The vitamin C, phenols, flavonoids, and carotenoids present in L. chinense were intrinsically linked to their nutritional and health-promoting properties [13,19,20]. The extract derived from Lycium barbarum has been shown to be positively associated with anti-inflammatory responses by suppressing the expression of interleukin (IL)-1β and tumor necrosis factor (TNF)-α [21], as well as mitigating lipopolysaccharide (LPS)-induced inflammation [22]. Additionally, it exhibits antioxidant properties that may aid in the management of Parkinson’s disease, with protective effects on neurons noted in studies related to retinal ischemia and reperfusion damage [23,24]. Research indicates that goji berries were often combined with fruits such as jujube, black sesame, and walnuts to create gelatinous cakes, which provide considerable benefits for mental well-being and treatments for blood deficiency and anemia-related issues [25,26].
Research on amino acid metabolism and endophytic bacteria in L. chinense fruit remains limited. This study investigates the types and changes of amino acid metabolites during the development of L. chinense fruit and analyzes the dominant endophytic bacteria present. The results provide a scientific basis for understanding the relationship between endophytic bacteria and amino acid metabolism in L. chinense fruit.
2. Materials and Methods
2.1. Plant Materials
The cultivation of the L. chinense variety ‘Mengqi No.1’ occurred at Nuomuhong Farm in China’s Qinghai Province, which lies within the Qaidam Basin (36°23′26.84″ N, 94°26′49.04″ E; altitude: 2745 m). Characterized by aridity, prolonged sunlight exposure, and significant diurnal temperature fluctuations (peak: 35.8 °C; minimum: −31 °C), this region receives approximately 58.51 mm of annual precipitation. Fruit maturation following flowering and fertilization lasts 28–35 days. As illustrated in Figure 1, three distinct developmental phases define L. chinense fruit progression: green fruit (GF, 16–19 days post-flowering), color-changing fruit (CCF, 22–25 days post-flowering), and red-ripe fruit (RRF, 31–34 days post-flowering). All collected fruits exhibited uniform dimensions, full maturity, and no disease or pest damage. Liquid nitrogen rapidly froze specimens, which were subsequently stored at −80 °C for further analysis. Four duplicate samples collected from each fruit, GF, CCF, and RRF, for a total of twelve samples, were used for subsequent analysis.
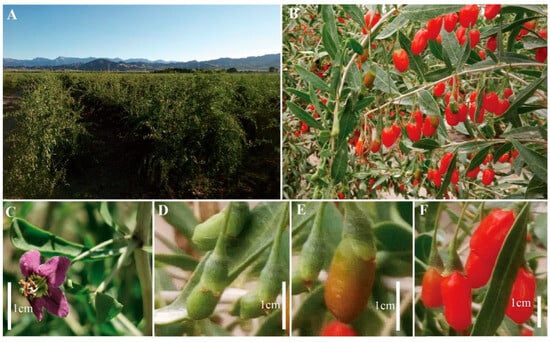
Figure 1.
Phenological stages and collection sites of L. chinense fruits. (A) Cultivation location: Nuomuhong Farm, Qaidam Basin (36°23′26.84″ N, 94°26′49.04″ E; altitude: 2745 m, Qinghai, China). (B) Fruit morphology. (C) Flowering phase. (D) Green fruit (GF, 16–19 days post-anthesis). (E) Color-changing fruit (CCF, 22–25 days post-anthesis). (F) Red-ripe fruit (RRF, 31–34 days post-anthesis). Scale bar: 1 cm.
2.2. Preparation of Samples from the Fruits of L. chinense
Fruit samples of L. chinense at three developmental stages were collected and subjected to vacuum freeze-drying. Precisely 50 mg aliquots were then mixed with 1000 μL of extraction solution (methanol:acetonitrile:water = 2:1:1). Following homogenization at 45 Hz for 10 min using a grinder, samples underwent ice-bath sonication for an additional 10 min, subsequently rested at −20 °C for 1 h, and were centrifuged (4 °C, 12,000× g, 10 min). From the resulting supernatant, 500 μL was vacuum-concentrated, reconstituted in 160 μL of 50% acetonitrile, and vortex-mixed thoroughly. After a second ice-bath incubation (10 min) and re-centrifugation (identical conditions), 120 μL of supernatant was transferred to 2 mL injection vials. A pooled QC sample, generated by combining 10 μL from each sample, was prepared for instrumental analysis.
2.3. LC-MS/MS Analysis
Liquid chromatography-tandem mass spectrometry (LC-MS/MS) was conducted utilizing a Whatsch Acquisition I-Class PLUS ultra-high-performance liquid chromatography (UHPLC) system coupled to an AB Sciex Qtrap 6500+ mass spectrometer, renowned for exceptional sensitivity. Chromatographic conditions were set as follows: a Waters Acquisition UPLC HSS-T3 column (1.8 µm, 2.1 mm × 100 mm) served as the stationary phase. The mobile phase comprised Phase A: ultrapure water containing 0.1% formic acid and 5 mM ammonium acetate; and Phase B: acetonitrile supplemented with 0.1% formic acid.
For gradient elution, the initial composition (98% A: 2% B) was maintained for 1.5 min, followed by a linear shift to 50% A/50% B over 5 min. Subsequently, the gradient transitioned to 2% A/98% B within 9 min, held for 1 min, before reverting to initial conditions (98% A/2% B) in 1 min, with equilibration extended for an additional 3 min. Operational parameters included a constant flow rate (350 μL/min) and column temperature (50 °C). Effluent was directed to an ESI-triple quadrupole-linear ion trap (QTRAP) mass spectrometer for detection.
Electrospray ionization (ESI) source parameters were configured as follows: the temperature was maintained at 550 °C; and ion spray voltage (IS) was set to 5500 V (positive mode) or −4500 V (negative mode). Curtain gas (CUR: 35 psi) and ionization gases (GSI: 50 psi; GSII: 55 psi) operated at specified pressures, with collision-activated dissociation (CAD) at medium intensity. Instrument calibration in both QQQ and LIT modes employed polypropylene glycol solutions (10 and 100 μmol/L, respectively). For QQQ scans, MRM experiments utilized nitrogen as collision gas (medium level), while declustering potential (DP) and collision energy (CE) for individual MRM transitions underwent further optimization. Throughout each elution interval, a predefined set of MRM transitions was monitored based on metabolite retention times.
2.4. Qualitative and Quantitative Analysis of Metabolites
Qualitative compound analysis leveraging the curated GB-PLANT database was conducted based on secondary spectral data, during which isotope peaks and recurring adduct signals (K+, Na+, NH4+), along with fragment ions from high-molecular-weight compounds, were systematically removed. Metabolite mass spectrometry data across diverse samples were acquired via Analyst 1.6.3 software. Peak areas for all signals were integrated, with relative abundances determined through peak area normalization. Quality control (QC), enforced by an internal standard, ensured analytical consistency; samples exhibiting metabolite RSD > 30% in QC were discarded. Identified compounds were annotated using the KEGG, HMDB, and LipidMaps databases to retrieve classification and pathway details. Based on annotation results, fold-change values were computed and assessed, while statistical significance was evaluated by t-test-derived p-values. OPLS-DA modeling implemented through the R package v3.6.1 ‘ropls’ underwent 200 permutation tests to validate robustness, with Variable Importance in Projection (VIP) values calculated via multi-round cross-validation. A combined approach incorporating the difference multiple, the p-value, and the VIP value of the OPLS-DA model was utilized to screen for differential metabolites whose concentration or abundance exhibits statistically significant changes between distinct biological states, experimental conditions, or sample groups. Screening criteria required a fold change (FC) beyond the threshold of |1| (FC > 1 or FC < −1), combined with a statistically significant p-value (<0.05) and Variable Importance in Projection (VIP) >1. Pathway enrichment significance for differential metabolites was assessed via a hypergeometric distribution test applied to KEGG annotations.
2.5. RNA-Seq Library Preparation and Sequencing
Total RNA isolation was performed adhering to the Plant RNA Extraction Kit protocol (Sangon Biotech, Shanghai, China). RNA integrity was verified through 1.5% agarose gel electrophoresis, followed by mRNA extraction using poly(A) capture bead-based kits and subsequent synthesis of double-stranded cDNA. The workflow encompassed end-repair, polyadenylation, and adapter ligation. Amplified libraries underwent purification with Hieff NGS™ DNA Selection Beads (Sangon Biotech), prior to sequencing on the Illumina HiSeq™ 2500 platform (Shanghai Bioengineering Co., Shanghai, China).
Transcriptomic data (2019) were provided by Sangon Biotech in Excel format; due to contractual restrictions (Contract No.: MRNA192916QH), raw sequences were inaccessible for public repository deposition. Consequently, analysis focused on 17 unigenes, with FPKM values and GenBank accessions summarized in Table S7.
2.6. Transcript Assembly and Analysis
Raw sequencing data (Sequenced Reads) originate from initial Illumina Hiseq™ (San Diego, CA, USA) image files, with QC metrics summarized in a FastQC report containing tabular statistics of raw/clean data and visual assessments. De novo transcript assembly was executed using Trinity (min_kmer_com2 specified; other parameters default), while functional annotations integrated multiple databases (CDD, KOG, COG, NR, NT, PFAM, SwissProt, TrEMBL) via NCBI Blast+. Gene Ontology (GO) categorization leveraged UniProt-aligned protein annotations from SwissProt/TrEMBL.
Preprocessed clean data underwent splicing and assembly generating unigenes, subsequently annotated against bioinformatic repositories. Differential expression analysis identified Unigene expression variations, facilitating functional predictions through GO databases. Ultimately, the AsA biosynthetic pathway was elucidated via GO enrichment analysis. Stage-specific genes modulating AsA metabolism were cross-compared across fruit development phases, selecting significantly altered targets at each stage for experimental validation.
Transcriptomic profiling of three L. chinense fruit stages pinpointed phase-dependent differentially expressed genes.
2.7. Gene Expression Analysis by RT-qPCR
Gene-specific primers, designed via Primer Premier 5 (Aoke Dingsheng Biotechnology, Beijing, China), were cataloged in Table S8. Total RNA was isolated from L. chinense fruits employing the FastPure® (Nanjing, China) Plant RNA Isolation Kit (effective for polysaccharide/polyphenol-rich samples), with integrity verified through 1.2% agarose gel electrophoresis and concentration quantified by BioSpecnano spectrophotometer (Shimadzu, Kyoto, Japan). Synthesized first-strand cDNA utilized Hiscript® RT-qPCR Supermax (Vazyme Biotech, Nanjing, China), with products preserved at −20 °C.
RT-qPCR (20 μL total volume) was executed using ChamQ Universal SYBR Master Mix (Vazyme Biotech, Nanjing, China) under these conditions:
Reaction system: 10 μL 2× Master Mix, 7.2 μL ddH2O, 0.4 μL each primer (Table S8), 2 μL cDNA
Cycling protocol:
- •
- 95 °C × 30 s (initial denaturation)
- •
- 40 cycles: 95 °C × 5 s → 60 °C × 30 s
- •
- Melting curve: 95 °C × 15 s → 60 °C × 50 s → 95 °C × 15 s
Normalization relied on L. chinense GAPDH (XM_060314892.1), with negative controls included. All reactions, conducted in triplicate using QuantStudio 6 Flex (Applied Biosystems, Invitrogen, Waltham, MA, USA), were instrumentally monitored.
2.8. Data Statistics and Analysis
Metabolite principal component analysis (PCA) employed R 3.6.1’s prcomp function, supported by the prcomp package with visualization implemented via factoextra and ggplot2. In PCA score plots, PC1 and PC2 were represented horizontally and vertically, respectively. QuantStudio™ (Thermo Fisher Scientific, Waltham, MA, USA) Real-time PCR software v1.7.2 derived mean values ± SEM from triplicate biological replicates—applied throughout RNA-seq and RT-qPCR datasets. SPSS v20 (IBM) conducted statistical analyses, using one-way ANOVA supplemented with Dunnett’s post hoc test. Correlations between L. chinense fruit metabolites and gene expression profiles were assessed through OmicShare tools (https://www.omicshare.com/; accessed on 10 June 2024). Three duplicate samples collected from each fruit, GF, CCF, and RRF, for a total of nine samples, were used for subsequent analysis.
2.9. DNA Extraction and High-Throughput Sequencing of Endophytic Bacteria in L. chinense Fruits
Extracted DNA samples served as templates for PCR amplification using universal 16S rDNA V3–V4 primers (F: CADACTCCTACGGGAGGC; R: ATCCTGTTTGMTMCCCVCRC), with sequencing adapters ligated to primer termini. Subsequent purification, quantification, and homogenization generated the sequencing library. Libraries passing quality control underwent Illumina NovaSeq 6000 sequencing. Raw reads underwent primary QC via Trimmomatic v0.33, followed by primer removal using Cutadapt 1.9.1 to yield adapter-free clean reads. The DADA2 pipeline (QIIME2 2020.6) performed denoising, paired-end merging, and chimera filtration, producing final valid non-chimeric sequences.
2.10. Correlation Analysis of Endophytic Bacteria with Metabolites
Correlation analysis was conducted between metabolites and endophytic bacteria. The correlation between amino acid metabolites and endophytic bacterial genera was analyzed using the OmicShare tool (https://www.omicshare.cn).
3. Results
3.1. Analysis of Amino Acid Metabolites in L. chinense Fruits Across Three Developmental Stages
Metabolites of amino acids were obtained from the fruits of L. chinense at three different stages of development: GF (green fruit, 16–19 days post-flowering), CCF (color-changing fruit, 22–25 days post-flowering), and RRF (red-ripe fruit, 31–34 days post-flowering) (Figure 1).
Non-targeted metabolomics of L. chinense fruits leveraged Principal Component Analysis (PCA) to evaluate metabolic variability across twelve samples (quadruplicate biological replicates per phenological phase). PCA delineated tight clustering of replicates within identical developmental stages, alongside marked distributional divergences between distinct phenophases (Figure 2A). Consequently, GF, CCF, and RRF samples exhibited differential segregation along PC2, with GF specimens demonstrating pronounced separation from CCF/RRF clusters along PC1.
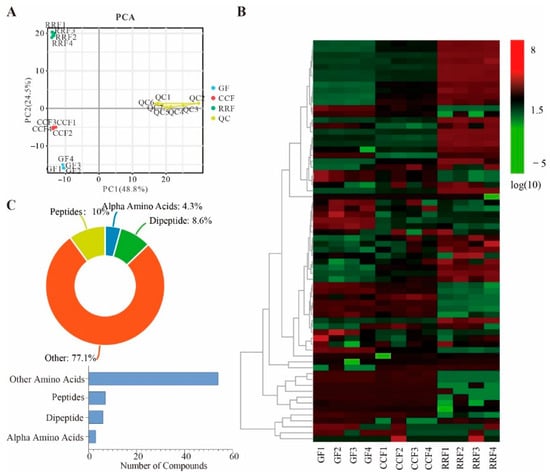
Figure 2.
PCA trajectory analysis across phenological stages (GF, CCF, RRF) with QC validation. (A) PCA trajectory analysis across phenological stages (GF (green fruit), CCF (color-changing fruit), RRF (red-ripe fruit)), with QC (Quality Control) validation. (B) A heat map depicting 600 identified metabolites revealed notable variations in accumulation patterns. The color gradient illustrated the accumulation levels of every metabolite, from low (green) to high (red). (C) The categories and proportions of 70 amino acid and related metabolites found in L. chinense fruits.
The comparison and analysis of the number of upregulated and downregulated metabolites in different L. chinense fruits were presented in Table S1. The results indicate that amino acid metabolites exhibit the highest counts of both upregulated and downregulated metabolites. This study primarily focuses on the analysis of amino acid metabolites in L. chinense fruits, all of which contribute to amino acid synthesis (Table S1). A comparative analysis reveals that there were 27 amino acid metabolites that were upregulated and 24 that were downregulated when comparing the GF and RRF stages. Additionally, between the CCF and RRF stages, 26 amino acid metabolites exhibited upregulation while 16 were downregulated. Furthermore, there were 21 upregulated and 24 downregulated amino acid metabolites observed in the comparison between the GF and CCF stages (Table S1).
In the clustering heatmap, distinct variations in the abundance patterns of 70 amino acid metabolites were observed across various fruit samples (Figure 2B). These metabolites included seven peptides, six dipeptides, three alpha amino acids, and fifty-four other metabolites. Peptides constituted 10% of the total amino acid metabolites, dipeptides 8.6%, alpha amino acids 4.3%, and other metabolites 77.1% (Figure 2C, Table S2).
3.2. Analysis of 43 Differential Amino Acid Metabolites Pathway of L. chinense Fruits Across Three Stages
To identify amino acid metabolism-associated differentially accumulated metabolites (DAMs) across L. chinense fruit phenological stages, screening criteria (fold change [FC] > 2, p < 0.05, VIP > 1) were applied. Among seventy characterized amino acid metabolites, forty-three DAMs were classified as follows: three peptides (7.0%), three dipeptides (7.0%), two α-amino acids (4.7%), and thirty-five miscellaneous compounds (81.4%) (Figure 3A; Table S3, Class II). Notably, Pyruvic Acid exhibited a 19.57-fold increase in CCF/GF, while N-Carbamoyl-DL-Aspartic Acid showed an 11.36-fold elevation in RRF/GF. Conversely, L-Phenylalanyl-L-Leucine and 3-O-Methyldopa displayed marked depletion (RRF/GF: 0.19-fold; CCF/GF: 0.00-fold) (Table S3).
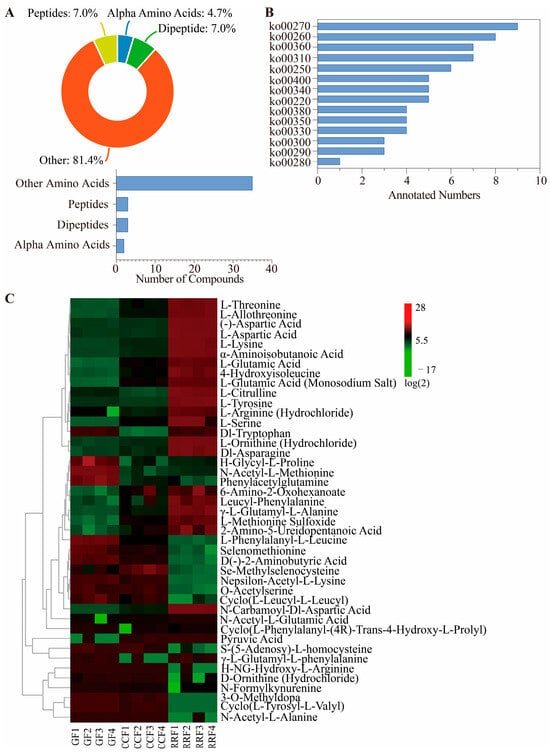
Figure 3.
The heatmap and hierarchical cluster illustrating the differentially accumulated metabolites associated with the amino acid metabolites pathway in L. chinense fruits across three developmental stages. (A) The types and proportions of differential amino acid metabolites annotated in L. chinense fruits. (B) Classification histogram of 14 amino acid metabolites in L. chinense fruit in the KEGG database (ko00220: Arginine biosynthesis; ko00250: Alanine, aspartate and glutamate metabolism; ko00260: Glycine, serine and threonine metabolism; ko00270: Cysteine and methionine metabolism; ko00280: Valine, leucine and isoleucine degradation; ko00290: Valine, leucine and isoleucine biosynthesis; ko00300: Lysine biosynthesis; ko00310: Lysine degradation; ko00330: Arginine and proline metabolism; ko00340: Histidine metabolism; ko00350: Tyrosine metabolism; ko00360: Phenylalanine metabolism; ko00380: Tryptophan metabolism; ko00400: Phenylalanine, tyrosine and tryptophan biosynthesis). (C) Stage-specific accumulation dynamics of DAMs, with color gradients indicating relative abundance (green: low, red: high).
A total of 14 categories of amino acid metabolites were successfully matched with the KEGG database (Figure 3B, Table S4). Among these categories, nine metabolites were identified as pertaining to cysteine and methionine metabolism (ko00270), eight metabolites were linked to glycine, serine, and threonine metabolism (ko00260), seven metabolites were associated with lysine degradation (ko00310), and seven metabolites were related to phenylalanine metabolism (ko003609).
The clustering heatmap revealed notable differences in the abundance patterns of 43 differential amino acid metabolites among various fruit samples (see Figure 3C). H-Glycyl-L-proline, N-Acetyl-L-Methionine, phenylacetylglutamine, and L-Methionine Sulfoxide showed high accumulation in GF, while they were low in CCF and RRF. Se-Methylselenocysteine was found to accumulate significantly in CCF, while its levels were low in GF and RRF. Conversely, L-Threonine, L-Allothreonine, (-)-Aspartic Acid, L-Aspartic Acid, L-Lysine, α-Aminoisobutanoic acid, L-Citrulline, L-Tyrosine, L-Ornithine (Hydrochloride), Dl-Asparagine, and N-Carbamoyl-Dl-Aspartic Acid exhibited high accumulation in RRF, while their levels were low in GF and CCF. The findings suggest that the 43 amino acid metabolites with differential levels exhibited unique patterns of accumulation and reduction.
3.3. Validation of the Differentially Expressed Genes in AminoAacid Metabolism of L. chinense Fruits
In this research, a total of 170 genes related to the production of amino acids and their derivatives in the fruits of L. chinense were depicted in heat maps for three different developmental phases (Figure 4A, Table S5). The findings revealed that most of these genes exhibited expression levels during the first two phases of L. chinense fruit development, which was followed by a modest reduction in gene expression during the RRF phase (Figure 4A). Interestingly, of the 170 genes, 71 were common across all three categories (Figure 4B). The uniquely identified genes comprised twenty in GF, sixteen in CCF, and three in RRF (Figure 4B).
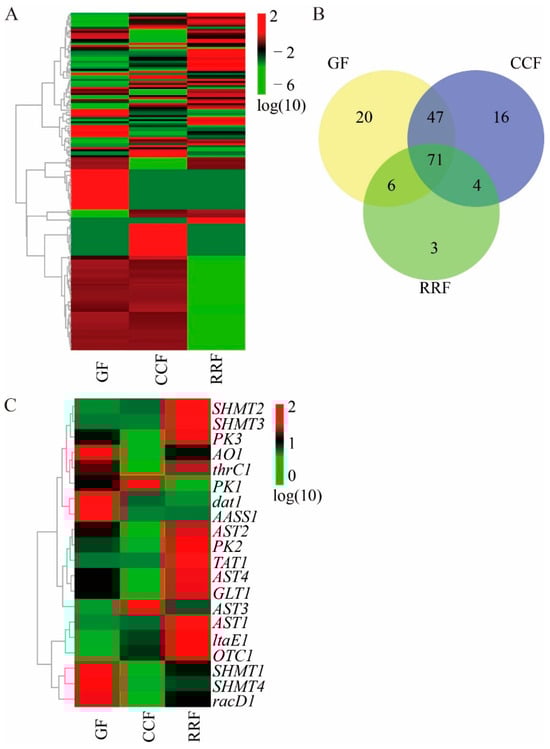
Figure 4.
One hundred and seventy amino acid-related gene heatmap, Venn map, and seventeen differentially expressed amino acid-related gene heatmap. (A) Transcriptomic heatmap of 170 amino acid biosynthesis-related genes across three phenophases, with color gradients reflecting expression dynamics (green→red: low→high). (B) Venn diagram of amino acid biosynthesis-related genes via OmicShare tools (https://www.omicshare.com/; accessed on 3 April 2025). (C) Heatmap visualization of 17 differentially expressed genes (DEGs) linked to amino acid metabolic pathways, indicating stage-specific transcript abundance (green→red).
The presence of twenty transcripts that code for twelve crucial enzyme-related genes involved in amino acid metabolism was established (see Table S6). Figure 4C illustrates that three enzymes were encoded by multiple unigenes: AST (4), PK (3), and SHMT (4). Conversely, nine essential enzymes were linked to a single unigene: AASS (1), AO (1), dat (1), GLT (1), ltaE (1), OTC (1), racD (1), TAT (1), and thrC (1) (refer to Table S6). A cluster analysis conducted on all differentially expressed genes related to amino acid metabolites across various developmental stages indicated notable differences in gene expression throughout fruit development (see Figure 4C, Table S7). The transcript expressions of AO1, dat1, AASS1, SHMT1, SHMT4, and racD1 were elevated in GF, whereas those were reduced in CCF (Figure 4C). The expressions of PK1 and AST3 were elevated in CCF, while they were lower in GF and RRF (Figure 4C). The expressions of SHMT2, SHMT3, PK3, thrC1, AST2, PK2, TAT1, AST4, GLT1, AST1, and OTC1 were elevated in RRF (Figure 4C).
To authenticate RNA-seq data reliability, eighteen amino acid metabolism-associated genes were subjected to RT-qPCR validation (Table S8). Normalization of target gene expression levels leveraged the housekeeping gene GAPDH as an endogenous reference. Consistent correlation between RT-qPCR results and transcriptomic profiles was observed across all tested genes, thereby corroborating the robustness of transcriptome data. Within the context of the amino acid metabolic pathway, RT-qPCR analysis revealed that the relative expressions of dat1 and racD1 exhibited a downward trend, while AST1, OTC1, and SHMT2 demonstrated an upward trend (refer to Figure 5). AASS1, AO1, AST2, AST4, PK1, PK2, PK3, SHMT3, SHMT4, TAT1, and thrC1 displayed an initial decline followed by a rise, in contrast to AST3, which showed an initial increase followed by a decrease (see Figure 5).
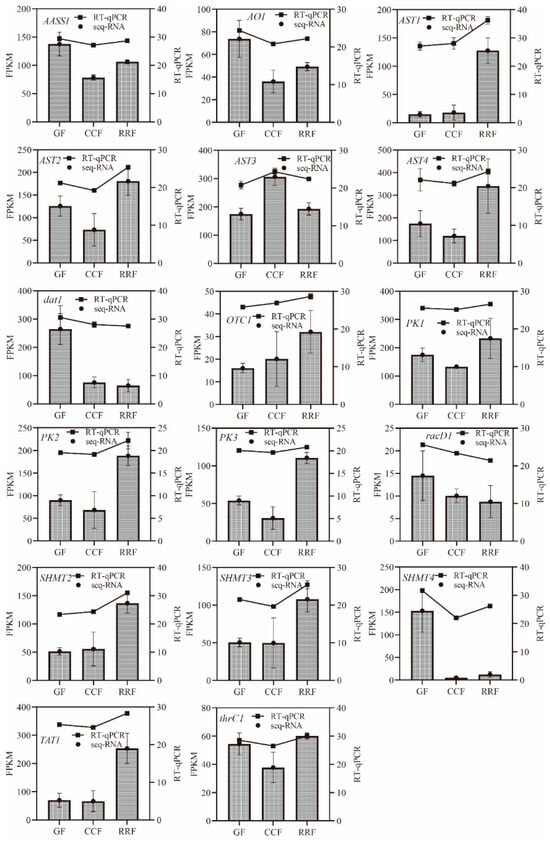
Figure 5.
Integrated profiling of amino acid metabolism-associated genes. Transcriptomic (RNA-seq, bars) and validation (RT-qPCR, line) dynamics across L. chinense phenophases (GF/CCF/RRF). The column chart displayed the FPKM values for each gene, while the line chart illustrated the relative gene expression by RT-qPCR method. Relative gene expression was calculated using the 2−ΔΔct method. Vertical bars represented means ± SD (n = 3) from three replicates. This image was produced using Prism 9.0 software.
3.4. Analysis of Alpha Diversity of Endophytic Bacteria in L. chinense Fruits at Different Developmental Stages
The α-diversity of endophytic bacterial communities was assessed via Shannon and Chao1 indices. Notably, RRF specimens exhibited reduced ACE, Shannon, and Chao1 values compared to GF/CCF cohorts, whereas Simpson indices remained statistically invariant across all groups (Table 1). As the L. chinense fruits developed, the ACE, Chao1, and Shannon indices of endophytic bacteria gradually decreased (Table 1), with particularly pronounced reductions observed in these indices from CCF to RRF.

Table 1.
Alpha diversity indices of endophytic bacteria in L. chinense fruits at three developmental stages.
Following the clustering of the samples, a Venn diagram was created. As illustrated in Figure 6A, variations in the number of endogenous OTUs across different groups were evident. The GF group exhibited the highest number of endophytic bacterial OTUs, followed by CCF, while the RRF group had the lowest number (Figure 6A).
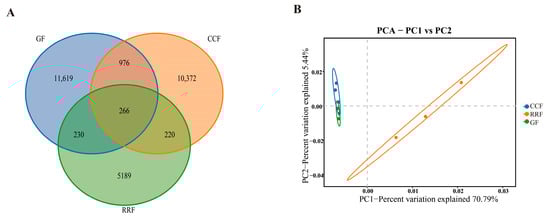
Figure 6.
The Venn diagram and PCA analysis of OTUs of endophytic bacteria in L. chinense fruits at three developmental stages. (A) The Venn diagrams of OTU numbers from endophytic bacteria at different fruits. (B) The PCA analysis of endophytic bacteria at different fruit stages.
PCA-driven sample classification accentuated inter-sample biodiversity disparities, with microbial community similarity reflected by spatial proximity within the ordination plot. The endophytic bacteria OTUs in the GF group were relatively close to those in the CCF group along the PC1 direction (Figure 6B).
3.5. Analysis of Beta Diversity of L. chinense Fruits at Different Development Stages
The combined UPGMA clustering tree and species composition histogram illustrate the relationships among endophytic bacteria in L. chinense fruit across different developmental stages. A sample clustering tree (Figure 7A) was constructed using the weighted_UniFrac distance algorithm, revealing the similarity between sample replicates. The relative abundance of species was analyzed at the genus level. In the UPGMA clustering tree for endophytic bacteria in L. chinense fruit across three developmental stages, fruits at the same stage were grouped into a single branch. Notably, in the clustering of GF and CCF, the top five genera of endophytic bacteria with the highest abundance were unclassified Lachnospiraceae, unclassified Muribaculaceae, Escherichia Shigella, Bacteroides, and Rikenellaceae rc9 gut group, indicating that the endophytic bacterial composition of L. chinense fruit remains similar during the GF and CCF periods. In RRF clustering, the top five genera of endophytic bacteria with the highest abundance were unclassified Lachnospiraceae, Enterococcus, Escherichia Shigella, Pseudomonas, and Bacillus.
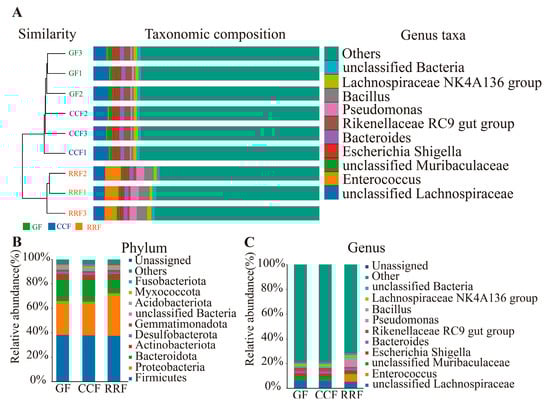
Figure 7.
(A) Endophytic β analysis of endophytic bacteria in L. chinense fruits at three developmental stages. (B) Composition and relative abundance of endophytic bacteria at different groups at the phylum level. (C) Composition and relative abundance of endophytic bacteria at different groups at the genus level.
3.6. Classification of Phyla and Genera of Endophytic Bacteria in L. chinense Fruits
To delineate endophytic compositional variation in L. chinense fruits across distinct epiphytic patterns, statistical profiling of annotated phyla and genera was conducted (Figure 7B). Ten predominant bacterial phyla, ranked by abundance, comprised Firmicutes, Proteobacteria, Bacteroidota, Actinobacteriota, Desulfobacterota, Gemmatimonadota, unclassified Bacteria, Acidobacteriota, Myxococcota, and Fusobacteriota. Among these, Firmicutes, Proteobacteria, and Bacteroidota collectively dominated, representing >80% of the total bacterial abundance. Significantly, Proteobacteria exhibited higher prevalence in RRF relative to GF and CCF cohorts.
At the genus level, the relative abundance distribution of the top 10 bacterial genera across all groups was illustrated in Figure 7C. The dominant endophytic genera primarily included unclassified Lachnospiraceae, Enterococcus, unclassified Muribaculaceae, Escherichia Shigella, Bacteroides, Rikenellaceae RC9 gut group, Pseudomonas, Bacillus, Lachnospiraceae NK4A136 group, and unclassified Bacteria. Notably, the relative abundance of Enterococcus in the RRF group was higher than that observed in the GF and CCF groups.
3.7. Analysis of Dominant Endophytic Bacteria in L. chinense Fruits at Different Developmental Stages
LEfSe-based profiling (Figure 8A) identified statistically significant biomarkers of endophytic bacterial communities across L. chinense developmental stages, revealing inter-group abundance disparities. The absolute LDA scores quantify differential species effect sizes, with higher values indicating greater taxonomic discriminative power. In the GF group, the significantly enriched taxa include the genera Prevotell, Prevotellaceae UCG 001, uncultured rumen bacteria, and the family Bacteroidales BS11 gut group. Conversely, in the CCF group, the significantly enriched taxa consist of the genera Cetobacterium, Parasutterella, Romboutsia, Desulfovibrio, Selenomonas, Ruminococcus torques_group, and Methylobacterium Methylorubrum. The families Peptostreptococcaceae, Desulfovibrionaceae, Bifidobacteriaceae, and Mycoplasmataceae were identified in RRF. Additionally, the significantly enriched taxa included genera Bacillus, Pseudomonas, Rhodanobacter, Rhodoferax, MND1, GOUTA6, Alicyclobacillus, UCG 005, Lactococcus, Pedobacter, Acidithiobacillus, Rhodoplanes, Gallionella, Ruegeria, Pseudolabrys, unclassified A21b, along with the families Bacillaceae, Pseudomonadaceae, Rhodanobacteraceae, and Sphingobacteriaceae.
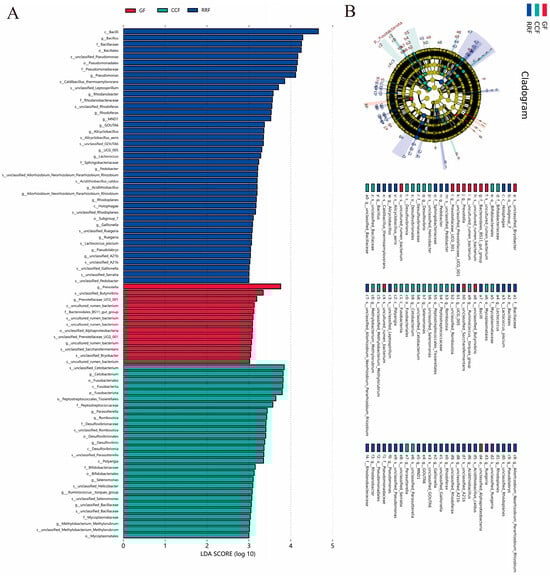
Figure 8.
LEfSe and cladogram analysis of endophytic bacterial communities in L. chinense fruits at three developmental stages. (A) LEfSe analysis of endophytic bacteria in L. chinense fruits at GF, CCF, and RRF stages. (B) Cladogram analysis of endophytic bacteria in L. chinense fruits at GF, CCF, and RRF stages.
The results (Figure 9) indicated that with the development of L. chinense fruits, there was a significant increase in diverse endophytic bacteria present in the fruits.
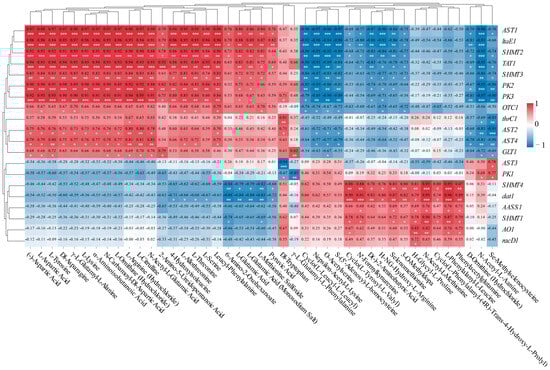
Figure 9.
Integrated correlation profiling. Associations between L. chinense fruit amino acid metabolism-associated 20 unigenes and 43 metabolites (Red: positive correlation; Blue: negative correlation). Significance thresholds: p < 0.05 (*), p < 0.01 (**), p < 0.001 (***).
3.8. Joint Analysis of Differential Amino Acid Metabolites and Their Related Genes
In order to deepen our comprehension of the molecular processes that contribute to the varying levels of amino acids in the fruits of L. chinense at different developmental phases, we investigated the relationship between the differential metabolites and the genes associated with the amino acid pathway using transcriptomic and metabolomic data (Figure 10). This study emphasized the correlation among 20 pertinent genes and 43 compounds linked to amino acids in the fruits of L. chinense (Figure 10).
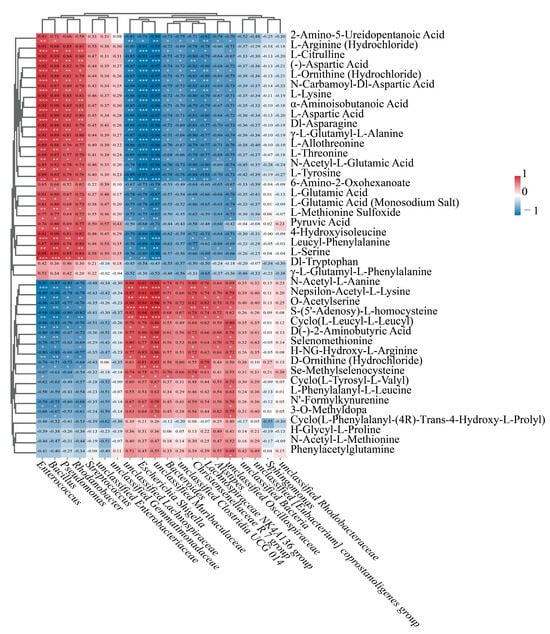
Figure 10.
Endophytic bacteria–differential amino acid metabolite correlation heatmap (Red: positive correlation; Blue: negative correlation), wherein color intensity correlates positively with association strength. Significance thresholds: p < 0.05 (*), p < 0.01 (**), p < 0.001 (***).
As shown in Figure 10, there was a notable relationship detected between the concentrations of amino acid-related compounds and the expression levels of differentially expressed genes. AST1 exhibited significantly positive correlations with 23 metabolites, while SHMT2 showed significantly positive correlations with 22 metabolites. Similarly, TAT1 demonstrated significantly positive correlations with 22 metabolites, and SHMT3 revealed significantly positive correlations with 20 metabolites. PK2 and PK3 exhibited significantly positive correlations with 20 and 21 metabolites, respectively, as well as with 14 metabolites. AST4 showed significantly positive correlations with 15 metabolites, and AST2 exhibited significantly positive correlations with 14 metabolites. SHMT4 and dat1 demonstrated significantly positive correlations with the same 10 metabolites. GLT1 showed significantly positive correlations with 10 metabolites. Finally, SHMT1 exhibited significantly positive correlations with nine metabolites (Figure 10).
In our study, the gene expressions of AST1 and ltaE1 exhibited significantly positive correlations with 23 compounds, with relative indices ranging from 0.76 to 0.98 (p < 0.05, p < 0.01, p < 0.001). Similarly, SHMT2 and TAT1 demonstrated significantly positive correlations with 22 distinct compounds, showing relative indices between 0.69 and 0.94 (p < 0.05, p < 0.01, p < 0.001). Furthermore, SHMT3 displayed significantly positive correlations with 20 different compounds, with relative indices from 0.72 to 0.85 (p < 0.05, p < 0.01). Consequently, AST1, ltaE1, TAT1, SHMT2, and SHMT3 were identified as key regulatory genes involved in the synthesis of amino acids. Notably, the majority of amino acids that exhibited positive correlations with these five genes were polar amino acids, including L-Aspartic Acid, L-Tyrosine, L-Lysine, L-Threonine, L-Serine, and L-Glutamic Acid. L-Citrulline was identified as a non-essential amino acid, which were amino acids that can be synthesized by the human body from metabolic intermediates. Among these, the essential amino acids—a group of amino acids that cannot be synthesized by the human body and must be obtained exclusively through dietary sources to maintain normal physiological functions, including protein synthesis, tissue repair, and metabolic regulation—were L-Lysine and L-Threonine. These results suggest that the expression of the AST1, ltaE1, TAT1, SHMT2, and SHMT3 genes was positively associated with the synthesis of these seven amino acids.
3.9. Joint Analysis of Differential Amino Acid Metabolites and Dominant Endophytic Bacteria
Elucidating the relationship between the fruit endophytic bacteria of L. chinense and their metabolites at various developmental stages was crucial for understanding these endophytic bacteria.
This research investigated the relationship between metabolites and microorganisms, focusing on their relative abundance and content. We assessed the correlations among the 20 most abundant genera of endophytic bacteria and 43 metabolites that play a role in the differential synthesis of amino acids in L. chinense fruits. Our results indicated that 13 out of the 20 most prevalent genera of endophytic bacteria in L. chinense fruits demonstrated highly significant correlations with the differential metabolites of amino acids (p < 0.05, p < 0.01, p < 0.001, Figure 10).
Among the various endophytic bacteria, the four genera Enterococcus, Bacillus, Pseudomonas, and Rhodanobacter showed a strong positive association with twenty distinct differential amino acid metabolites, while they displayed a noteworthy negative correlation with seven unique differential amino acid metabolites (p < 0.05, p < 0.01, p < 0.001, Figure 10). Furthermore, the genera unclassified Lachnospiraceae, Escherichia Shigella, and unclassified Muribaculaceae showed a significant positive correlation with eight identical differential amino acid metabolites and a significant negative correlation with twenty-two identical differential amino acid metabolites (p < 0.05, p < 0.01, p < 0.001, Figure 10).
The non-essential amino acid L-Citrulline, along with the polar amino acids L-Aspartic Acid, L-Tyrosine, L-Lysine, L-Threonine, L-Serine, and L-Glutamic Acid, exhibited a positive correlation with the four genera Enterococcus, Bacillus, Pseudomonas, and Rhodanobacter.
These findings suggest that the relative abundance of the genera Enterococcus, Bacillus, Pseudomonas, and Rhodanobacter was significantly correlated with the relative content of these seven amino acids.
4. Discussion
Lu et al. [27] analyzed the composition and content of amino acids in jujube (Ziziphus jujuba Mill.) fruits at four different ripening stages, identifying a total of 26 free amino acids, whose overall content diminished progressively as the fruit matured. Li et al. [28] observed that the concentrations of organic acids and amino acids in developing apple (Malus domestica L. Borkh.) fruit declined, with the exception of proline and methionine. The levels of free amino acids were primarily constrained by a decreased availability of precursors derived from glycolysis and the TCA cycle [29]. Glycine betaine (GB) has been found to mitigate chilling injury in peach (Prunus persica Batsch.) fruit stored under cold conditions post-harvest, and it has been demonstrated to enhance arginine metabolism in peaches, consequently elevating proline levels [29]. Wang et al. [30] investigated the sensory impacts of varying concentrations of cysteine (Cys)—specifically 0%, 0.01%, 0.05%, and 0.10%—on wolfberry (Lycium Barbarum L.) fruits preserved at 4 °C with a relative humidity (RH) of 90% over a span of 10 days. Their research revealed that the application of 0.05% Cys significantly increased the levels of proline (Pro) and taurine (Tau), while not notably affecting the amounts of cysteine, glutamic acid (Glu), or gamma-aminobutyric acid (GABA). Marta Vazquez-Vilar et al. [31] successfully created an herbicide-tolerant variant of the commonly expressed acetolactate synthase (mSlALS) gene in tomatoes by incorporating all relevant coding and regulatory DNA components from the tomato genome. This modified tomato exhibited significantly elevated concentrations of leucine (twenty-one times above wild-type levels), valine (nine times above), and isoleucine (three times above) [31].
In Rubus chingii (R. chingii), leucine, lysine, and phenylalanine emerged as the most abundant amino acids, highlighting their significant presence throughout the growth cycle. The proportion of essential amino acids, relative to the total amino acid content in R. chingii, exhibited a notable trajectory of change throughout its developmental stages [32].
L. chinense fruits at the RRF stage demonstrated a greater accumulation of amino acid metabolites compared to other stages. We identified 43 differential amino acid metabolites, 21 of which exhibited an increase in content (log2(FC) > 1) during the CCF and RRF stages of L. chinense fruit compared to the GF stage (Table S3). For instance, N-Carbamoyl-Dl-Aspartic Acid, α-Aminoisobutanoic acid, and γ-L-Glutamyl-L-phenylalanine showed significant increases in the RRF stage, with increases of 11.36 times, 7.07 times, and 7.42 times, respectively, compared to those in the GF stage (Table S3).
Yan et al. [33] found that red LED irradiation induced the expression of genes encoding AST in harvested broccoli, maintained amino acid content, and promoted amino acid anabolism, resulting in a delay in broccoli senescence. When Sweet orange ‘Newhall’ (C. sinensis) was grafted onto two different rootstocks, Poncirus trifoliata (CT) and Citrus. junos Siebold ex Tanaka (CJ), the expression levels of both the AST and PK genes in the peel were altered [34]. In citrus peel [35], the upregulation of SHMT gene expression may be associated with oleocellosis and lead to the accumulation of glutamate, valine, glycine, and threonine in citrus fruits. Xin et al. [36] proposed that TAT plays an important role in 1-deoxynojirimycin (DNJ) biosynthesis in mulberry (Morus alba L.) seeds.
In our study, AST1, ltaE1, TAT1, SHMT2, and SHMT3 were identified as key regulatory genes involved in the synthesis of amino acids, exhibiting a positive correlation with L-Aspartic Acid, L-Tyrosine, L-Lysine, L-Threonine, L-Serine, L-Glutamic Acid, and L-Citrulline.
Numerous studies have demonstrated that endophytic bacteria enhance drought resistance in host plants by regulating the concentration of osmoregulatory substances and the activity of the antioxidant system [37]. Additionally, these bacteria increase the activity of peroxidases, such as ascorbate peroxidase (APX) and antioxidant oxidase (AO), thereby fortifying the plant’s antioxidant system [37,38]. Furthermore, certain endophytic bacteria can elevate the concentrations of ascorbic acid and glutathione in plants exposed to drought conditions [39].
Among the endophytic bacteria that exhibited a significant correlation with differential metabolites of amino acids, the genera Enterococcus and Bacillus emerged as the most frequently utilized microorganisms as probiotics in various non-dairy products [40]. Moreover, prebiotic components such as polyphenols [41] could have a beneficial impact on gut health. Additionally, the Bacillus genus, which was naturally found on fruit surfaces, can be employed in fermentation methods [42]. In fruits subjected to four pretreatments with Pseudomonas fluorescens ZX, the levels of hesperidin, sinensetin, nobiletin, synephrine, and pectin increased by approximately 26.0%, 31.3%, 44.8%, 19.7%, and 23.1%, respectively, compared to the untreated control group. Overall, these findings suggest that utilizing P. fluorescens ZX as a biostimulant through preharvest application represents an effective, cost-efficient, and environmentally friendly strategy for enhancing citrus crop production [43]. Furthermore, inducing blackberry (Rubus sp.) plants through root application of P. fluorescens N21.4 resulted in enhanced expression of specific flavonoid biosynthetic genes and a concomitant increase in the levels of certain flavonoids within the fruits. This phenomenon may be linked to the ability of plant growth-promoting rhizobacteria (PGPR) to stimulate flavonoid synthesis as part of an induced systemic response (ISR), highlighting the significant role this pathway plays in plant defense, which results in elevated concentrations of flavonoids in the fruit [44]. In soybean cultures, compared with uninoculated soybeans, Bacillus subtilis increased the amounts of leucine and phenylalanine; B. velezensis increased the amounts of leucine, phenylalanine, and tyrosine; and B. licheniformis increased the amounts of alanine, glutamic acid, tyrosine, and ornithine and dramatically decreased the amount of arginine [45]. Enterococci provide fermentable amino acids, including leucine and ornithine, which increase Clostridioides difficile fitness in the antibiotic-perturbed gut [46].
In our study, the endophytic bacterial genera Enterococcus, Bacillus, and Pseudomonas exhibited significant positive correlations with numerous differential amino acid metabolites. The function prediction of Bacillus included global and overview maps, such as amino acid metabolism. These endophytic bacteria may be closely associated with the metabolism of amino acids in L. chinense fruit.
5. Conclusions
This article analyzes the three developmental stages of L. chinense fruit—green fruit (GF), color-changing fruit (CCF), and red-ripe fruit (RRF)—through the lenses of metabolomics, transcriptomics, and microbiology. A total of 43 differential amino acid metabolites were identified in L. chinense fruits across these three developmental stages. Among the genes related to amino acid synthesis, six were found to be involved in the arginine biosynthesis pathway (ko00220), six in glycine, serine, and threonine metabolism (ko00260), and five in alanine, aspartate, and glutamate metabolism (ko00250). Key regulatory genes associated with amino acid synthesis, specifically AST1, ltaE1, TAT1, SHMT2, and SHMT3, were identified. Furthermore, Bacillus, Enterococcus, Rhodanobacter, and Pseudomonas were recognized as the primary endophytic bacterial genera in L. chinense fruit. These genera exhibited a positive correlation with seven amino acids (L-Aspartic Acid, L-Tyrosine, L-Lysine, L-Threonine, L-Serine, L-Glutamic Acid, and L-Citrulline), influencing their metabolism within the fruit. These findings provide insights into the relationship between amino acid synthesis and endophytic bacteria in L. chinense fruit.
Supplementary Materials
The following supporting information can be downloaded at: https://www.mdpi.com/article/10.3390/genes16070836/s1, Table S1: The number of differentially metabolites in L. chinense fruits among three stages; Table S2: 70 Identified Amino acids in L. chinense fruits; Table S3: 43 differential metabolites of Amino acids in L. chinense fruits among three stages; Table S4: 14 Amino Acid Metabolites Categories of L. chinense Fruit in KEGG database; Table S5: 170 genes associated with the synthesis of amino acids in L. chinense fruit; Table S6: 20 Unigenes in differential Amino acid metabolism of L. chinense fruits; Table S7: FPKM of 20 Unigenes; Table S8: Primers and Sequences For RT-qPCR.
Author Contributions
F.Q. designed the experiments; H.X. and G.G. prepared the plant samples; X.Y. and L.Z. conducted the experiments and analyzed the data; C.Y. conducted most experiments and wrote the manuscript; F.Q. revised the manuscript. All authors have read and agreed to the published version of the manuscript.
Funding
This research was funded by the Science and Technology Department of Qinghai Province (2025-ZJ-718 to F.Q.). Metabolic formation mechanism and high-value utilization team of plateau characteristic biological resources in Qinghai Normal University.
Institutional Review Board Statement
Not applicable.
Informed Consent Statement
Not applicable.
Data Availability Statement
In our study, GenBank Numbers of 17 unigenes were in Table S8. Endophytic bacteria data are available at https://dataview.ncbi.nlm.nih.gov/object/PRJNA1210065?reviewer=smg856b1kvspn80gmr2gqe3ev0 (accessed on 26 June 2025).
Acknowledgments
Qinghai South of Qilian Mountain Forest Ecosystem Observation and Research Station, Huzhu 810500, China; National Forestry Grassland Qinghai Tibet Plateau Characteristic Forest and Grassland Germplasm Resources Protection and Utilization Engineering Technology Research Center, China.
Conflicts of Interest
The authors declare that they have no known competing financial interests or personal relationships that could have appeared to influence the work reported in this paper.
Abbreviations
The following abbreviations are used in this manuscript:
| AASS | Alpha-aminoadipic semialdehyde synthase |
| AO | Acetylornithine deacetylase |
| AST | Aspartate aminotransferase |
| dat | D-alanine transaminase |
| GLT | Glutamate synthase |
| ltaE | Threonine aldolase |
| OTC | Ornithine carbamoyltransferase |
| PK | Pyruvate kinase |
| racD | Aspartate racemase |
| SHMT | Serine hydroxymethyltransferase |
| thrC | Threonine synthase |
| TAT | Tyrosine aminotransferase |
References
- Moormann, J.; Heinemann, B.; Hildebrandt, T.M. News about Amino Acid Metabolism in Plant–Microbe Interactions. Trends Biochem. Sci. 2022, 47, 839–850. [Google Scholar] [CrossRef] [PubMed]
- Glawischnig, E. Camalexin. Phytochemistry 2007, 68, 401–406. [Google Scholar] [CrossRef] [PubMed]
- Fagundes, M.A. Investigation of Methionine and Lysine Derivatives as a Source of Rumen-Protected Amino Acids for Lactating Dairy Cows. Ph.D. Thesis, Utah State University, Logan, UT, USA, 2021. [Google Scholar]
- Umehara, T.; Kosono, S.; Soll, D.; Tamura, K. Lysine Acetylation Regulates Alanyl-tRNA Synthetase Activity in Escherichia coli. Genes 2018, 9, 473. [Google Scholar] [CrossRef] [PubMed]
- Yao, X.; Nie, J.; Bai, R.; Sui, X. Amino Acid Transporters in Plants: Identification and Function. Plants 2020, 9, 972. [Google Scholar] [CrossRef] [PubMed]
- Kim, D.-R.; Kwak, Y.-S. Endophytic Streptomyces Population Induced by L-Glutamic Acid Enhances Plant Resilience to Abiotic Stresses in Tomato. Front. Microbiol. 2023, 14, 1180538. [Google Scholar] [CrossRef] [PubMed]
- Chitnis, V.R.; Suryanarayanan, T.S.; Nataraja, K.N.; Prasad, S.R.; Oelmüller, R.; Shaanker, R.U. Fungal Endophyte-Mediated Crop Improvement: The Way Ahead. Front. Plant Sci. 2020, 11, 561007. [Google Scholar] [CrossRef] [PubMed]
- Tedersoo, L.; Bahram, M.; Zobel, M. How Mycorrhizal Associations Drive Plant Population and Community Biology. Science 2020, 367, eaba1223. [Google Scholar] [CrossRef] [PubMed]
- Tiwari, P.; Bajpai, M.; Singh, L.K.; Yadav, A.N.; Bae, H. Portraying Fungal Mechanisms in Stress Tolerance: Perspective for Sustainable Agriculture. In Recent Trends in Mycological Research: Volume 1: Agricultural and Medical Perspective; Yadav, A.N., Ed.; Springer International Publishing: Cham, Switzerland, 2021; pp. 269–291. ISBN 978-3-030-60659-6. [Google Scholar]
- Tiwari, P.; Kang, S.; Bae, H. Plant-Endophyte Associations: Rich yet under-Explored Sources of Novel Bioactive Molecules and Applications. Microbiol. Res. 2023, 266, 127241. [Google Scholar] [CrossRef] [PubMed]
- Hettiarachchige, I.K.; Elkins, A.C.; Reddy, P.; Mann, R.C.; Guthridge, K.M.; Sawbridge, T.I.; Forster, J.W.; Spangenberg, G.C. Genetic Modification of Asexual Epichloë Endophytes with the perA Gene for Peramine Biosynthesis. Mol. Genet. Genomics 2019, 294, 315–328. [Google Scholar] [CrossRef] [PubMed]
- Yang, C.-C.; Chien, J.-Y.; Chou, Y.-Y.; Ciou, J.-W.; Huang, S.-P. The Effects of Lycium chinense, Cuscuta chinensis, Senna tora, Ophiopogon japonicus, and Dendrobium nobile Decoction on a Dry Eye Mouse Model. Med. Kaunas Lith. 2022, 58, 1134. [Google Scholar] [CrossRef] [PubMed]
- Teixeira, F.; Silva, A.M.; Delerue-Matos, C.; Rodrigues, F. Lycium barbarum Berries (Solanaceae) as Source of Bioactive Compounds for Healthy Purposes: A Review. Int. J. Mol. Sci. 2023, 24, 4777. [Google Scholar] [CrossRef] [PubMed]
- Fu, Y.-W.; Peng, Y.-F.; Huang, X.-D.; Yang, Y.; Huang, L.; Xi, Y.; Hu, Z.-F.; Lin, S.; So, K.-F.; Ren, C.-R. Lycium barbarum Polysaccharide-Glycoprotein Preventative Treatment Ameliorates Aversive. Neural Regen. Res. 2021, 16, 543. [Google Scholar] [CrossRef] [PubMed]
- Wang, Y.; Wei, W.; Guo, M.; Li, S.; Chai, Z.; Ma, C.; Jiang, Y.; Song, L.; Yu, J. Lycium barbarum Polysaccharide Promotes M2 Polarization of BV2 Microglia Induced by LPS via Inhibiting the TLR4/NF-κB Signaling Pathway. Xi Bao Yu Fen Zi Mian Yi Xue Za Zhi Chin. J. Cell. Mol. Immunol. 2021, 37, 1066–1072. [Google Scholar]
- Li, X.; Mo, X.; Liu, T.; Shao, R.; Teopiz, K.; McIntyre, R.; So, K.-F.; Lin, K. Efficacy of Lycium barbarum Polysaccharide in Adolescents with Subthreshold Depression: Interim Analysis of a Randomized Controlled Study. Neural Regen. Res. 2022, 17, 1582. [Google Scholar] [CrossRef] [PubMed]
- Liang, R.; Zhao, Q.; Zhu, Q.; He, X.; Gao, M.; Wang, Y. Lycium barbarum Polysaccharide Protects ARPE-19 Cells against H2O2-induced Oxidative Stress via the Nrf2/HO-1 Pathway. Mol. Med. Rep. 2021, 24, 769. [Google Scholar] [CrossRef] [PubMed]
- Pan, H.; Niu, L.; Wu, Y.; Chen, L.; Zhou, X.; Zhao, Y. Lycium barbarum Polysaccharide Protects Rats and Cardiomyocytes against Ischemia/Reperfusion Injury via Nrf2 Activation through Autophagy Inhibition. Mol. Med. Rep. 2021, 24, 778. [Google Scholar] [CrossRef] [PubMed]
- Qiao, F.; Zhang, K.; Zhou, L.; Qiu, Q.-S.; Chen, Z.; Lu, Y.; Wang, L.; Geng, G.; Xie, H. Analysis of Flavonoid Metabolism during Fruit Development of Lycium chinense. J. Plant Physiol. 2022, 279, 153856. [Google Scholar] [CrossRef] [PubMed]
- Yin, C.; Xie, H.; Geng, G.; Li, Z.; Ma, J.; Wu, X.; Qiu, Q.-S.; Qiao, F. Identification of Key Enzymes and Genes Modulating L-Ascorbic Acid Metabolism During Fruit Development of Lycium chinense by Integrating Metabolome, Transcriptome, and Physiological Analysis. Int. J. Mol. Sci. 2024, 25, 11394. [Google Scholar] [CrossRef] [PubMed]
- Ding, H.; Wang, J.; Zhang, X.-Y.; Yin, L.; Feng, T. Lycium barbarum Polysaccharide Antagonizes LPS-Induced Inflammation by Altering the Glycolysis and Differentiation of Macrophages by Triggering the Degradation of PKM2. Biol. Pharm. Bull. 2021, 44, 379–388. [Google Scholar] [CrossRef] [PubMed]
- Yin, R.; Xue, J.; Tan, Y.; Fang, C.; Hu, C.; Yang, Q.; Mei, X.; Qi, D. The Positive Role and Mechanism of Herbal Medicine in Parkinson’s Disease. Oxid. Med. Cell. Longev. 2021, 2021, 9923331. [Google Scholar] [CrossRef] [PubMed]
- Wu, I.-H.; Chan, S.-M.; Lin, C.-T. The Neuroprotective Effect of Submicron and Blended Lycium barbarum for Experiment Retinal Ischemia and Reperfusion Injury in Rats. J. Vet. Med. Sci. 2020, 82, 1719–1728. [Google Scholar] [CrossRef] [PubMed]
- Tian, X.; Liang, T.; Liu, Y.; Ding, G.; Zhang, F.; Ma, Z. Extraction, Structural Characterization, and Biological Functions of Lycium barbarum Polysaccharides: A Review. Biomolecules 2019, 9, 389. [Google Scholar] [CrossRef] [PubMed]
- Xu, L.; Yang, L.; Xu, H.; Li, Y.; Peng, F.; Qiu, W.; Tang, C. Lycium barbarum Glycopeptide Ameliorates Motor and Visual Deficits in Autoimmune Inflammatory Diseases. Phytomedicine Int. J. Phytother. Phytopharm. 2024, 129, 155610. [Google Scholar] [CrossRef] [PubMed]
- Lakshmanan, Y.; Wong, F.S.Y.; So, K.-F.; Chan, H.H.-L. Lycium barbarum Glycopeptide Promotes Neuroprotection in ET-1 Mediated Retinal Ganglion Cell Degeneration. J. Transl. Med. 2024, 22, 727. [Google Scholar] [CrossRef] [PubMed]
- Lu, Y.; Bao, T.; Mo, J.; Ni, J.; Chen, W. Research Advances in Bioactive Components and Health Benefits of Jujube (Ziziphus jujuba Mill.) Fruit. J. Zhejiang Univ.-Sci. B 2021, 22, 431–449. [Google Scholar] [CrossRef] [PubMed]
- Li, M.; Li, D.; Feng, F.; Zhang, S.; Ma, F.; Cheng, L. Proteomic Analysis Reveals Dynamic Regulation of Fruit Development and Sugar and Acid Accumulation in Apple. J. Exp. Bot. 2016, 67, 5145–5157. [Google Scholar] [CrossRef] [PubMed]
- Jia, Z.; Wang, Y.; Wang, L.; Zheng, Y.; Jin, P. Amino Acid Metabolomic Analysis Involved in Flavor Quality and Cold Tolerance in Peach Fruit Treated with Exogenous Glycine Betaine. Food Res. Int. Ott. Ont. 2022, 157, 111204. [Google Scholar] [CrossRef] [PubMed]
- Wang, J.; Wei, L.; Yan, L.; Zheng, H.; Liu, C.; Zheng, L. Effects of Postharvest Cysteine Treatment on Sensory Quality and Contents of Bioactive Compounds in Goji Fruit. Food Chem. 2022, 366, 130546. [Google Scholar] [CrossRef] [PubMed]
- Vazquez-Vilar, M.; Fernandez-del-Carmen, A.; Garcia-Carpintero, V.; Drapal, M.; Presa, S.; Ricci, D.; Diretto, G.; Rambla, J.L.; Fernandez-Muñoz, R.; Espinosa-Ruiz, A.; et al. Dually Biofortified Cisgenic Tomatoes with Increased Flavonoids and Branched-chain Amino Acids Content. Plant Biotechnol. J. 2023, 21, 2683–2697. [Google Scholar] [CrossRef] [PubMed]
- Luo, Y.; Hua, Y.; Chen, S.; Qian, X.; Ruan, H.; Pan, P.; Chen, H. Widely Untargeted Metabolomics Profiling Combined with Transcriptome Analysis Provides New Insight into Amino Acid Biosynthesis at Different Developmental Stages of Rubus chingii Hu (Chinese Raspberry). J. Med. Food 2024, 27, 993–1003. [Google Scholar] [CrossRef] [PubMed]
- Yan, Z.; Xu, D.; Yue, X.; Yuan, S.; Shi, J.; Gao, L.; Wu, C.; Zuo, J.; Wang, Q. Whole-Transcriptome RNA Sequencing Reveals Changes in Amino Acid Metabolism Induced in Harvested Broccoli by Red LED Irradiation. Food Res. Int. Ott. Ont. 2023, 169, 112820. [Google Scholar] [CrossRef] [PubMed]
- Xiong, B.; Li, Q.; Yao, J.; Zheng, W.; Ou, Y.; He, Y.; Liao, L.; Wang, X.; Deng, H.; Zhang, M.; et al. Transcriptome and UPLC-MS/MS Reveal Mechanisms of Amino Acid Biosynthesis in Sweet Orange “Newhall” after Different Rootstocks Grafting. Front. Plant Sci. 2023, 14, 1216826. [Google Scholar] [CrossRef] [PubMed]
- Xie, J.; Deng, B.; Wang, W.; Zhang, H. Changes in Sugar, Organic Acid and Free Amino Acid Levels and the Expression of Genes Involved in the Primary Metabolism of Oleocellosis in Citrus Peels. J. Plant Physiol. 2023, 280, 153877. [Google Scholar] [CrossRef] [PubMed]
- Xin, X.; Jiang, X.; Thomas, A.; Niu, B.; Zhang, M.; Xu, X.; Zhang, R.; Li, H.; Gui, Z. Studies on 1-Deoxynojirimycin Biosynthesis in Mulberry (Morus alba L.) Seeds through Comparative Transcriptomics. Nat. Prod. Res. 2024, 38, 2585–2594. [Google Scholar] [CrossRef] [PubMed]
- Govindasamy, V.; George, P.; Kumar, M.; Aher, L.; Raina, S.K.; Rane, J.; Annapurna, K.; Minhas, P.S. Multi-Trait PGP Rhizobacterial Endophytes Alleviate Drought Stress in a Senescent Genotype of Sorghum [Sorghum bicolor (L.) Moench]. 3 Biotech 2020, 10, 13. [Google Scholar] [CrossRef] [PubMed]
- Husna, H.; Hussain, A.; Shah, M.; Hamayun, M.; Iqbal, A.; Qadir, M.; Asim, S.; Lee, I.-J. Stemphylium lycopersici and Stemphylium solani Improved Antioxidant System of Soybean under Chromate Stress. Front. Microbiol. 2022, 13, 1001847. [Google Scholar] [CrossRef] [PubMed]
- Cao, J.-L.; He, W.-X.; Zou, Y.-N.; Wu, Q.-S. An Endophytic Fungus, Piriformospora indica, Enhances Drought Tolerance of Trifoliate Orange by Modulating the Antioxidant Defense System and Composition of Fatty Acids. Tree Physiol. 2023, 43, 452–466. [Google Scholar] [CrossRef] [PubMed]
- Cosme, F.; Inês, A.; Vilela, A. Consumer’s Acceptability and Health Consciousness of Probiotic and Prebiotic of Non-Dairy Products. Food Res. Int. Ott. Ont. 2022, 151, 110842. [Google Scholar] [CrossRef] [PubMed]
- Vilela, A.; Cosme, F.; Inês, A. Wine and Non-Dairy Fermented Beverages: A Novel Source of pro- and Prebiotics. Fermentation 2020, 6, 113. [Google Scholar] [CrossRef]
- Kimura, K.; Yokoyama, S. Trends in the Application of Bacillus in Fermented Foods. Curr. Opin. Biotechnol. 2019, 56, 36–42. [Google Scholar] [CrossRef] [PubMed]
- Wang, Z.; Chen, X.; Zhong, T.; Li, B.; Yang, Q.; Du, M.; Zalán, Z.; Kan, J. Bioeffector Pseudomonas Fluorescens ZX Elicits Biosynthesis and Accumulation of Functional Ingredients in Citrus Fruit Peel: A Promising Strategy for a More Sustainable Crop. J. Agric. Food Chem. 2021, 69, 13810–13820. [Google Scholar] [CrossRef] [PubMed]
- Garcia-Seco, D.; Zhang, Y.; Gutierrez-Mañero, F.J.; Martin, C.; Ramos-Solano, B. Application of Pseudomonas Fluorescens to Blackberry under Field Conditions Improves Fruit Quality by Modifying Flavonoid Metabolism. PLoS ONE 2015, 10, e0142639. [Google Scholar] [CrossRef] [PubMed]
- Seo, S.; Jeong, D.-W.; Sul, S.; Lee, J.-H. Specificity of Amino Acid Profiles Produced in Soybean Fermentations by Three Bacillus spp. J. Microbiol. Biotechnol. 2024, 35, e2411038. [Google Scholar] [CrossRef] [PubMed]
- Smith, A.B.; Jenior, M.L.; Keenan, O.; Hart, J.L.; Specker, J.; Abbas, A.; Rangel, P.C.; Di, C.; Green, J.; Bustin, K.A.; et al. Enterococci Enhance Clostridioides Difficile Pathogenesis. Nature 2022, 611, 780–786. [Google Scholar] [CrossRef] [PubMed]
Disclaimer/Publisher’s Note: The statements, opinions and data contained in all publications are solely those of the individual author(s) and contributor(s) and not of MDPI and/or the editor(s). MDPI and/or the editor(s) disclaim responsibility for any injury to people or property resulting from any ideas, methods, instructions or products referred to in the content. |
© 2025 by the authors. Licensee MDPI, Basel, Switzerland. This article is an open access article distributed under the terms and conditions of the Creative Commons Attribution (CC BY) license (https://creativecommons.org/licenses/by/4.0/).