Article

Genome-Wide Runs of Homozygosity Reveal Inbreeding Levels and Trait-Associated Candidate Genes in Diverse Sheep Breeds

Frontiers Science Center for Molecular Design Breeding (MOE), State Key Laboratory of Animal Biotech Breeding, College of Animal Science and Technology, China Agricultural University, Beijing 100193, China
*
Author to whom correspondence should be addressed.
These authors contributed equally to this work.
Genes 2025, 16(3), 316; https://doi.org/10.3390/genes16030316
Submission received: 24 January 2025 / Revised: 20 February 2025 / Accepted: 27 February 2025 / Published: 7 March 2025
(This article belongs to the Special Issue Functional Genomics and Breeding of Animals)

Abstract

:
Background: Quantifying and controlling the inbreeding level in livestock populations is crucial for the long-term sustainability of animal husbandry. However, the extent of inbreeding has not been fully understood in sheep populations on a global scale. Methods: Here, we analyzed high-depth genomes of 210 sheep from 20 worldwide breeds to identify the pattern and distribution of genome-wide runs of homozygosity (ROH) and detect candidate selected genes in ROH islands for agronomic and phenotypic traits. Results: Leveraging whole-genome sequencing data, we found a large number of short ROH (e.g., <1.0 Mb) in all breeds and observed the overall higher values of ROH statistics and inbreeding coefficient in European breeds than in Asian breeds and Dorper sheep. We identified some well-known candidate genes (e.g., CAMK4, HOXA gene family, ALOX12, FGF11, and MTOR) and 40 novel genes (e.g., KLHL1, FGFRL1, WDR62, GDF6, KHDRBS2, and PAX1) that are functionally associated with fecundity, body size, and wool-related traits in sheep. Based on the candidate genes, we revealed different genetic bases for the fecundity traits of European and Asian sheep. Conclusions: This study improves the resolution of ROH detection and provides new insights into genomic inbreeding and trait architecture in sheep as well as useful markers for future breeding practice.

1. Introduction

Sheep (Ovis aries) are one of the most important livestock, and they have provided daily necessities such as meat, wool, and milk to humans since the Neolithic Age. Following their domestication from Asiatic mouflon (Ovis orientalis) in the Fertile Crescent ~11,000 years ago [1,2], sheep have adapted to a variety of environments across the world and were subjected to human-implemented genetic improvements under different agroecosystems. During this process, sheep evolved diverse phenotypic (e.g., small body size) and agronomic (e.g., high fecundity) traits under long-term natural and artificial selection. Because only a few elite individuals with outstanding performance were selected to reproduce generation by generation, the selection scheme inevitably led to an increase in the inbreeding level in sheep populations. Inbreeding can impose an adverse effect on all sorts of traits, such as those related to fitness (e.g., fecundity), production (e.g., wool fineness), and morphology (e.g., body size) [3,4,5]. Also, inbreeding may cause a loss of genetic diversity and a decline of effective population size, which could be harmful to future breeding programs of sheep. In this context, assessing and controlling the inbreeding level is crucial for the long-term sustainability of the sheep industry. However, most of the previous genomic investigations of inbreeding in sheep only involved a single breed, one trait, or limited loci [6,7,8], leaving the extent of inbreeding not fully understood for multiple traits in different breeds on a global scale.
The conventional method for quantifying inbreeding level was based on pedigree-based data, but pedigree information is not always available and accurate in livestock populations [9,10]. With the development of genomic technologies, alternative methods based on SNP chip or genome-wide sequencing data have been employed to estimate inbreeding levels, among which a prevalent and efficient method is runs of homozygosity (ROH)-based inbreeding coefficient (FROH) [11]. ROH are continuous homozygous segments inherited from identical haplotypes of parents and are common in human and animal populations [12,13]. Because inbreeding is one of the direct causes of the occurrence of ROH, ROH are considered as a suitable measure of inbreeding level [14]. In addition, the history of inbreeding can be inferred based on the length of ROH fragments. Long ROH fragments are usually produced by inbreeding of recent generations, as there are not enough generations for recombination to interrupt these ROH fragments. On the contrary, shorter ROH fragments are generated by inbreeding in history [8]. Recently, ROH detection throughout the whole genome has been widely used to evaluate genomic inbreeding (FROH) of various livestock species, including sheep [8,15,16,17,18,19,20,21,22,23,24,25,26,27]. On the other hand, ROH are useful indicators for identifying selective signatures in the genome [28]. Genomic regions under strong artificial and natural selections can exhibit increased homozygosity around the target selected region [29,30], therefore causing the formation of ROH. ROH islands, which refer to the regions with high ROH frequency in a population, are frequently overlapped with genomic regions with selective signatures [29]. In this regard, ROH islands can be used to identify candidate genes related to important traits in livestock populations [31]. For example, Liu et al. [32] performed ROH detection among five Chinese sheep breeds with different tail types and identified candidate gene PDGFD in the ROH islands. Additionally, ROH also help to understand genetic diversity, population structure, and demographic history of livestock species [31].
Here, we utilized whole-genome sequencing data of 20 sheep breeds (210 individuals) genetically originating from three continents (Figure 1a and Supplementary Table S1) to investigate the occurrence and distribution of genome-wide ROH in worldwide sheep populations. Based on the ROH, we aimed to (i) assess genetic status such as inbreeding coefficient, effective population size (Ne), and linkage disequilibrium (LD); (ii) identify candidate genes associated with phenotypic and agronomic traits in ROH islands. Particularly, we paid attention to previously under-studied traits (e.g., small body size) and compared genetic differences underlying the same trait (e.g., high fecundity) from sheep breeds in different continents. This study will improve our understanding of the genetic structure and demographic history of sheep breeds worldwide. Genes identified in ROH islands can be applied as genetic markers in future molecular breeding of sheep.

2. Materials and Methods

2.1. Whole-Genome Sequence Data

Whole-genome sequences of 210 sheep samples were obtained from our previous studies [33,34,35], including 11 breeds from Asia, 8 breeds from Europe, and the Dorper sheep from Africa according to their breed origin (i.e., genetic origin) (Figure 1a and Supplementary Table S1). In particular, the sheep samples represent breeds from different geographic regions of the world and with various morphological and production traits such as small body size, high fecundity, wool fineness, and dairy and meat production.

2.2. Read Alignment and SNP Calling

The raw sequences for each sample were ~83.93 Gb (76.43–109.87 Gb), with an average depth of 20.15× (16.73–28.01×) for clean reads (Supplementary Table S1). The raw Illumina reads were filtered to remove adapters and low-quality sequences using Trimmomatic (v0.36) [36] with parameters ‘SLIDINGWINDOW:4:15 MINLEN:50′. The clean reads were mapped to the sheep reference genome Oar_rambouillet_v1.0 (NCBI accession GCA_002742125.1) using the Burrows–Wheeler aligner (BWA-MEM) v.0.7.17-r1188 [37] with default parameters. Alignments were then transferred into BAM format via SAMtools v.1.11 [38], and duplicates were removed using GATK v.4.1.9.0 [39].
After mapping, SNP was called from the bam files by the HaplotypeCaller module implemented in GATK v.4.1.9.0 [39]. Raw GVCFs of individual samples were merged using the CombineGVCFs module and called for SNPs using the GenotypeGVCFs module. Subsequently, the candidate SNPs were identified by the SelectVariants module, and false-positive and nonbiallelic SNPs were filtered out via the VariantFiltering module with parameters “QUAL < 30.0‖QD < 2.0‖MQ < 40.0‖FS > 60.0‖SOR > 3.0‖ReadPosRankSum < −8.0”. In addition, SNPs with missing rates ≥ 0.1 and minor allele frequencies (MAF) < 0.05 were also filtered out from further analysis. After all the quality control procedures, a total of 29,468,844 SNPs remained in the downstream analysis.

2.3. Population Genetic Analysis

To investigate the population structure of the sheep samples used in this study, principal component analysis (PCA) was performed using PLINK v1.9 [40] based on three datasets (i.e., the whole samples, the Asian samples, and the European samples). Also, an approximately-maximum-likelihood phylogenetic tree was constructed for all samples using the FastTree v2.1.11 [41] with default parameters. The final tree was visualized via the online tool iTOL [42]. In addition, PopLDdecay v3.42 [43] was used to calculate linkage disequilibrium (LD) coefficients between all pairwise SNPs for each breed with the default parameter. LD decay was then plotted against the distance between two loci using the R program v4.1.0 [44]. To reveal the recent population demographic history of each breed, SNeP v1.1 [45] software was used to estimate the effective population size (Ne) of recent generations for each population with default parameters.

2.4. Identification of ROH

PLINK v1.9 [40] was used to identify runs of homozygosity (ROH) for each individual with a sliding window approach. The parameters defining the ROH were set as follows: (i) the minimum length of ROH was set to 500 kb; (ii) five missing SNPs and up to two possible heterozygous genotypes were allowed in a sliding window; (iii) the minimum number of SNPs that constituted the ROH was set to 100; (iv) the minimum SNP density in the ROH was set to one SNP every 50 kb; (v) the maximum gap between consecutive homozygous SNPs was 1000 kb; and (vi) the number of SNPs in a sliding window was set to 50. The average number (MNROH) and average length (ALROH) of ROH for each breed were calculated. The total length and total number of ROH for each individual were calculated, and the relationship between the two indicators was exhibited by a scatter plot. In order to better dissect the distribution of ROH among sheep breeds, we classified ROH into four categories as 0.5 Mb–1.0 Mb, 1.0 Mb–1.5 Mb, 1.5 Mb–2.0 Mb, and >2.0 Mb according to the length of the ROH. For each of the four categories, the mean sum of the ROH for each breed was calculated by summing all ROH in that category and dividing by the sample size of each breed. In addition, we also counted the number of ROH in each chromosome for each breed to reveal the difference in chromosomal distribution among breeds.

2.5. Calculation of Inbreeding Coefficient

The inbreeding coefficient based on ROH (FROH) for each individual was calculated according to the following formula [46]:
FROH = LROH/Lau
where LROH is the total length of all the ROH in an individual, and Lau is the total length of the autosomal genome covered by SNPs (i.e., 2655.59 Mb in this study). A violin plot was drawn to reveal the difference in inbreeding levels among sheep breeds. Also, we used another measure (FHOM) to compute the genomic inbreeding coefficient based on the observed and expected number of homozygous genotypes using PLINK v1.9 [40]. Pearson’s correlation between FROH and FHOM was estimated.

2.6. Detection of ROH Islands and Candidate Genes for Various Traits

To determine the ROH hotspots for each breed, the percentage of each SNP occurring in the ROH in each breed was calculated. For an SNP in a specific breed, the number of times this SNP was involved in the ROH was counted and then divided by the sample size of this breed. In this study, breeds with similar traits and from the same geographic region were combined to perform ROH hotspot analysis. Specifically, we identified ROH hotspots for the breeds with four different phenotypic or production traits: (i) high fecundity trait in Asian sheep using the merged data of Wadi sheep (WDS, n = 20), Hu sheep (HUS, n = 10), and Small-tailed Han sheep (SXW, n = 10); (ii) high fecundity trait in European sheep using the merged data of Finnsheep (FIN, n = 10) and Gotland sheep (GOT, n = 10); (iii) wool fineness trait based on the merged data of Chinese Merino sheep (fine wool) (MFW, n = 10) and Chinese Merino sheep (super fine wool) (MSF, n = 10); and (iv) small body size trait based on the data of Ouessant sheep (OUE, n = 10). The top 0.5% of the highest occurrence SNPs observed in the ROH in the breed/breeds with a particular trait was selected as the threshold for determining the ROH hotspots. A series of adjacent SNPs that exceeded this threshold were combined to form the ROH islands, which were visualized by plotting against the position of the SNPs along the chromosomes via a Manhattan plot. To identify the genes in the ROH islands and reveal their association with the corresponding trait, SNPs in the ROH islands were annotated according to the genomic annotation file of Oar_rambouillet_v1.0 (https://ftp.ncbi.nlm.nih.gov/genomes/all/GCF/002/742/125/GCF_002742125.1_Oar_rambouillet_v1.0/GCF_002742125.1_Oar_rambouillet_v1.0_genomic.gtf.gz, accessed on 2 January 2020). Functional enrichment analysis of candidate genes associated with the investigated traits in specific sheep breeds was conducted through the PANTHER v19.0 classification system [47]. The functions of the candidate genes in the ROH islands were also investigated using literature and the NCBI database.

3. Results

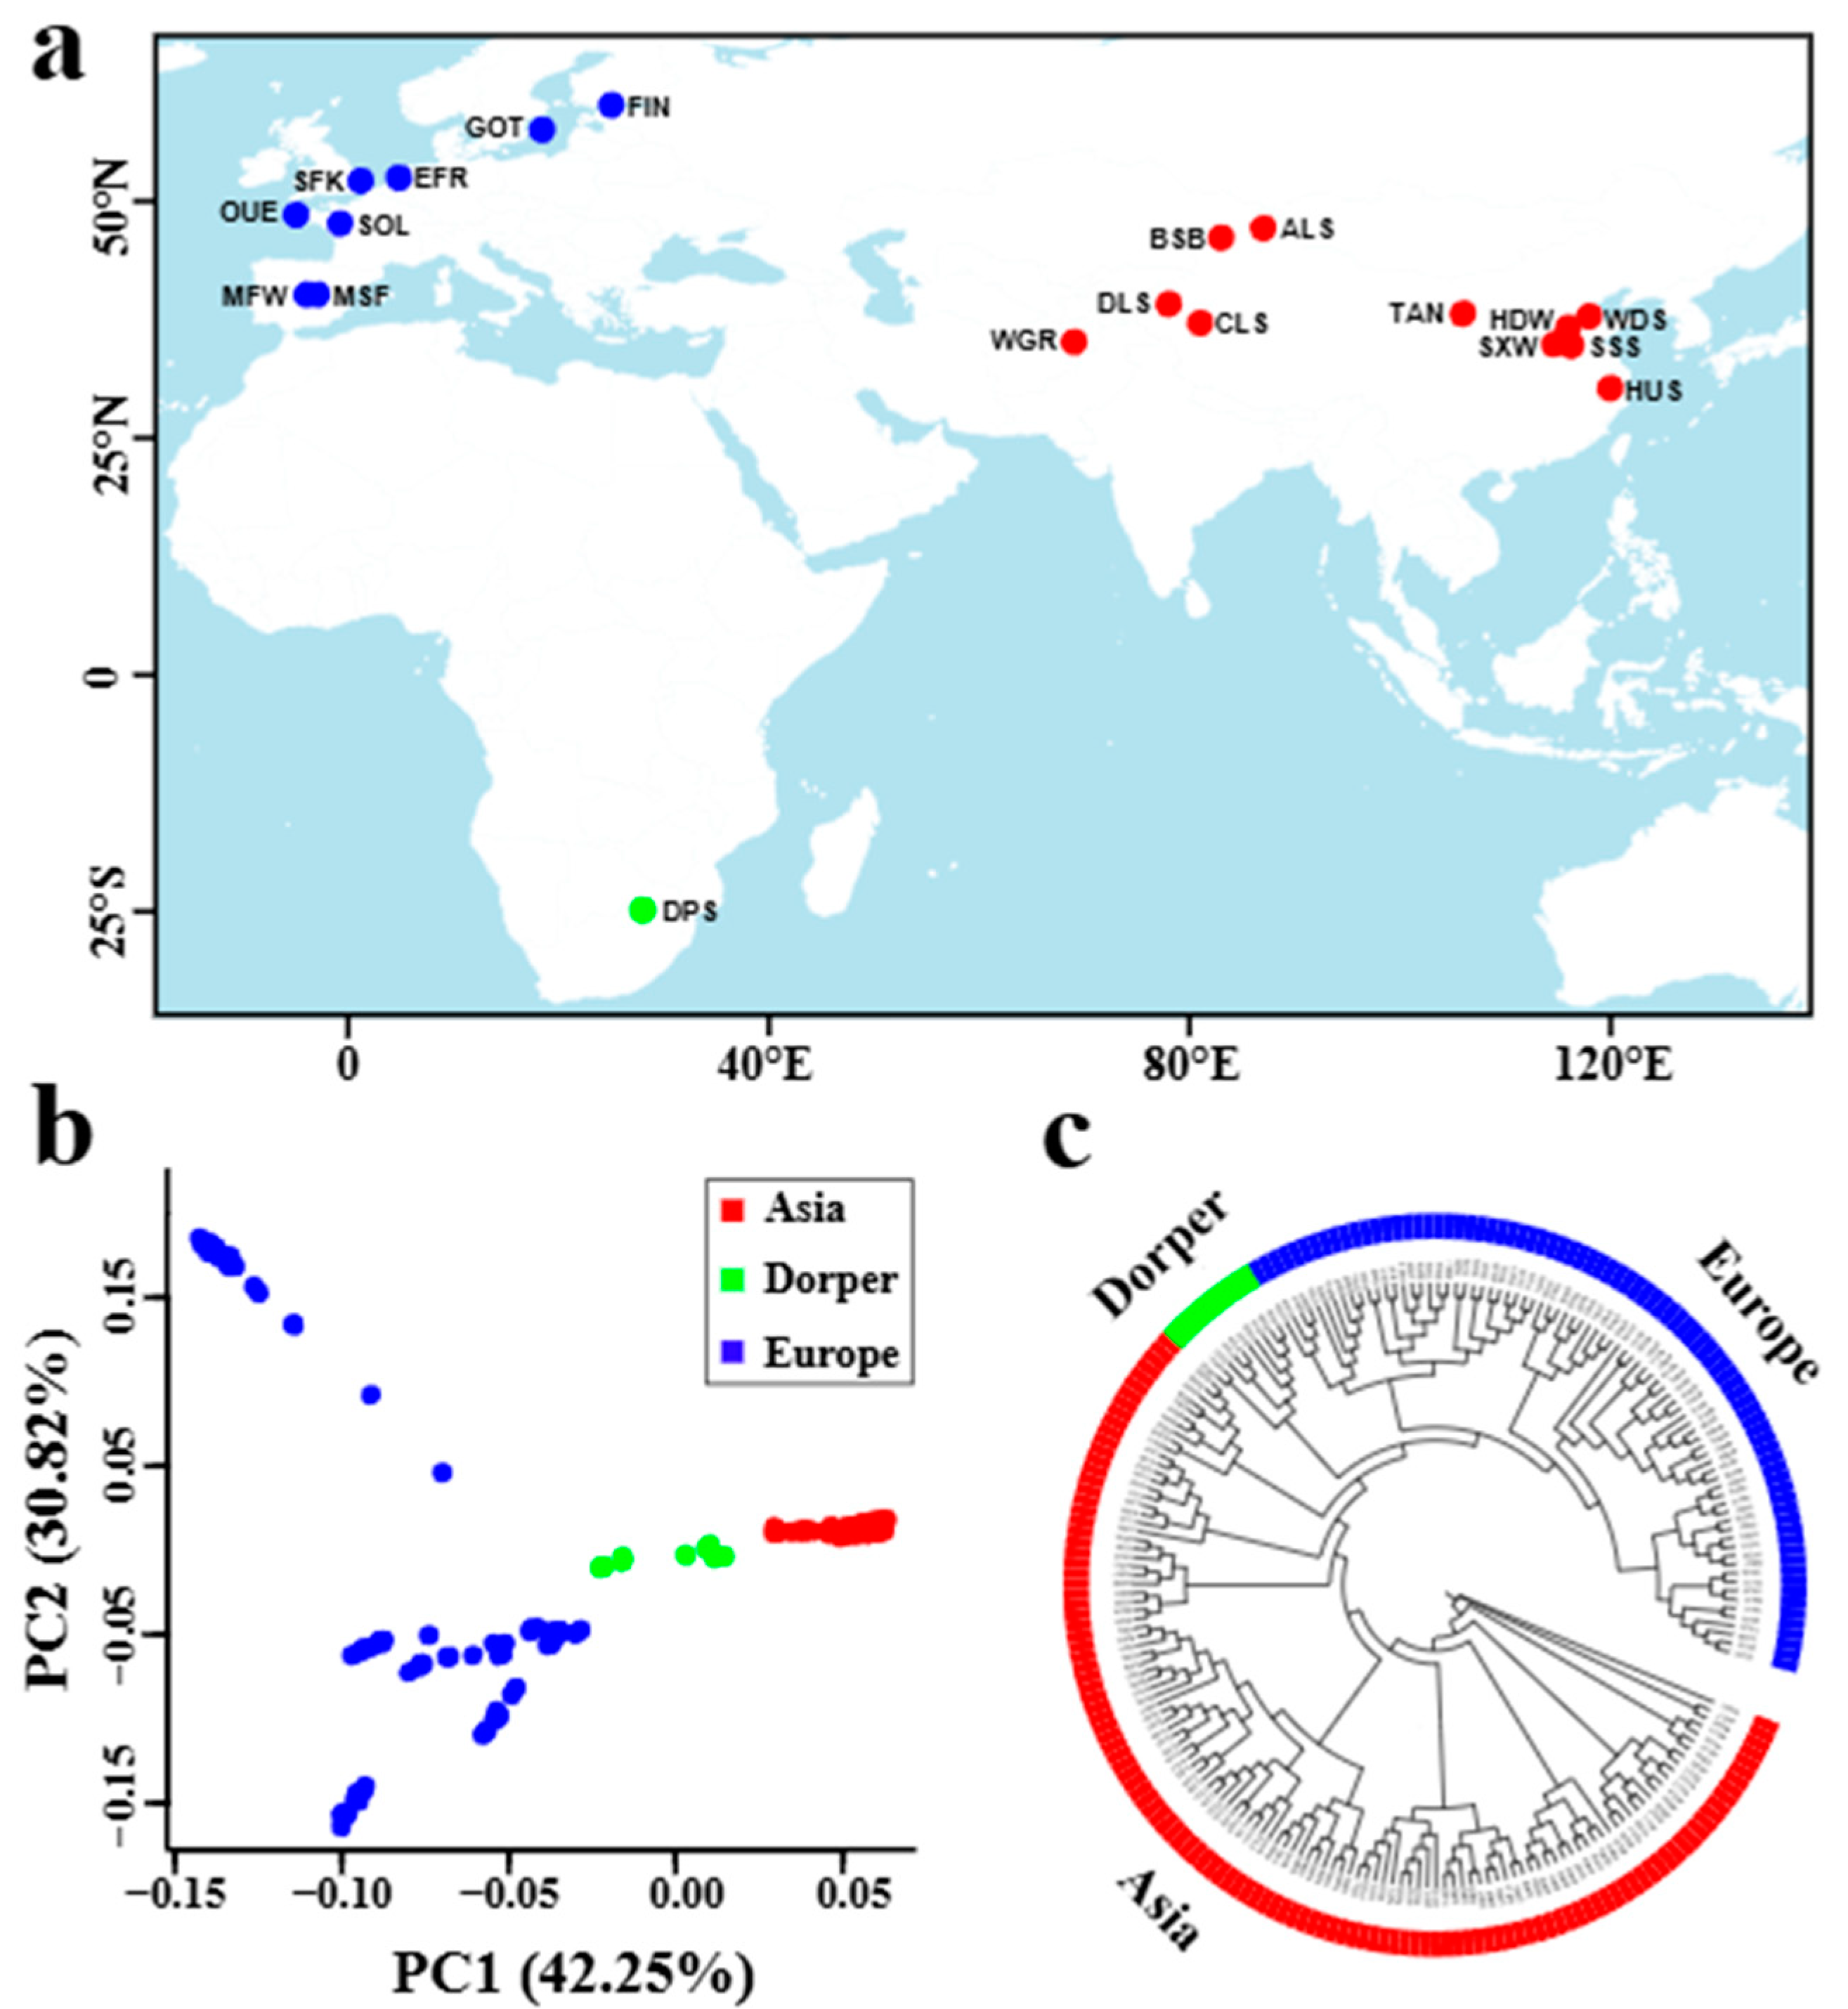
3.1. Population Structure

Using the 29,468,844 high-quality SNPs obtained from the genomes of 210 sheep samples worldwide (Figure 1a), we constructed a phylogenetic tree that divided the 20 studied sheep breeds into three subgroups of Asian, European, and Dorper sheep lineages (Figure 1c). Within each lineage, sheep samples from the same breed were well clustered into an independent branch, except that the samples from two Merino sheep populations (i.e., fine wool population and super fine wool population) were mixed and clustered together (Figure 1c). Principal component analysis (PCA) for all samples confirmed the geographic subdivision of Asian, European sheep, and Dorper sheep, and the samples of Asian sheep or Dorper sheep were clustered much more closely than that of European sheep (Figure 1b). PCA within Asian sheep and European sheep further revealed an overall obvious separation among different breeds, though the samples of several breeds (e.g., Altay sheep from Asia, super fine wool Merino sheep from Europe) were clustered loosely (Supplementary Figure S1).

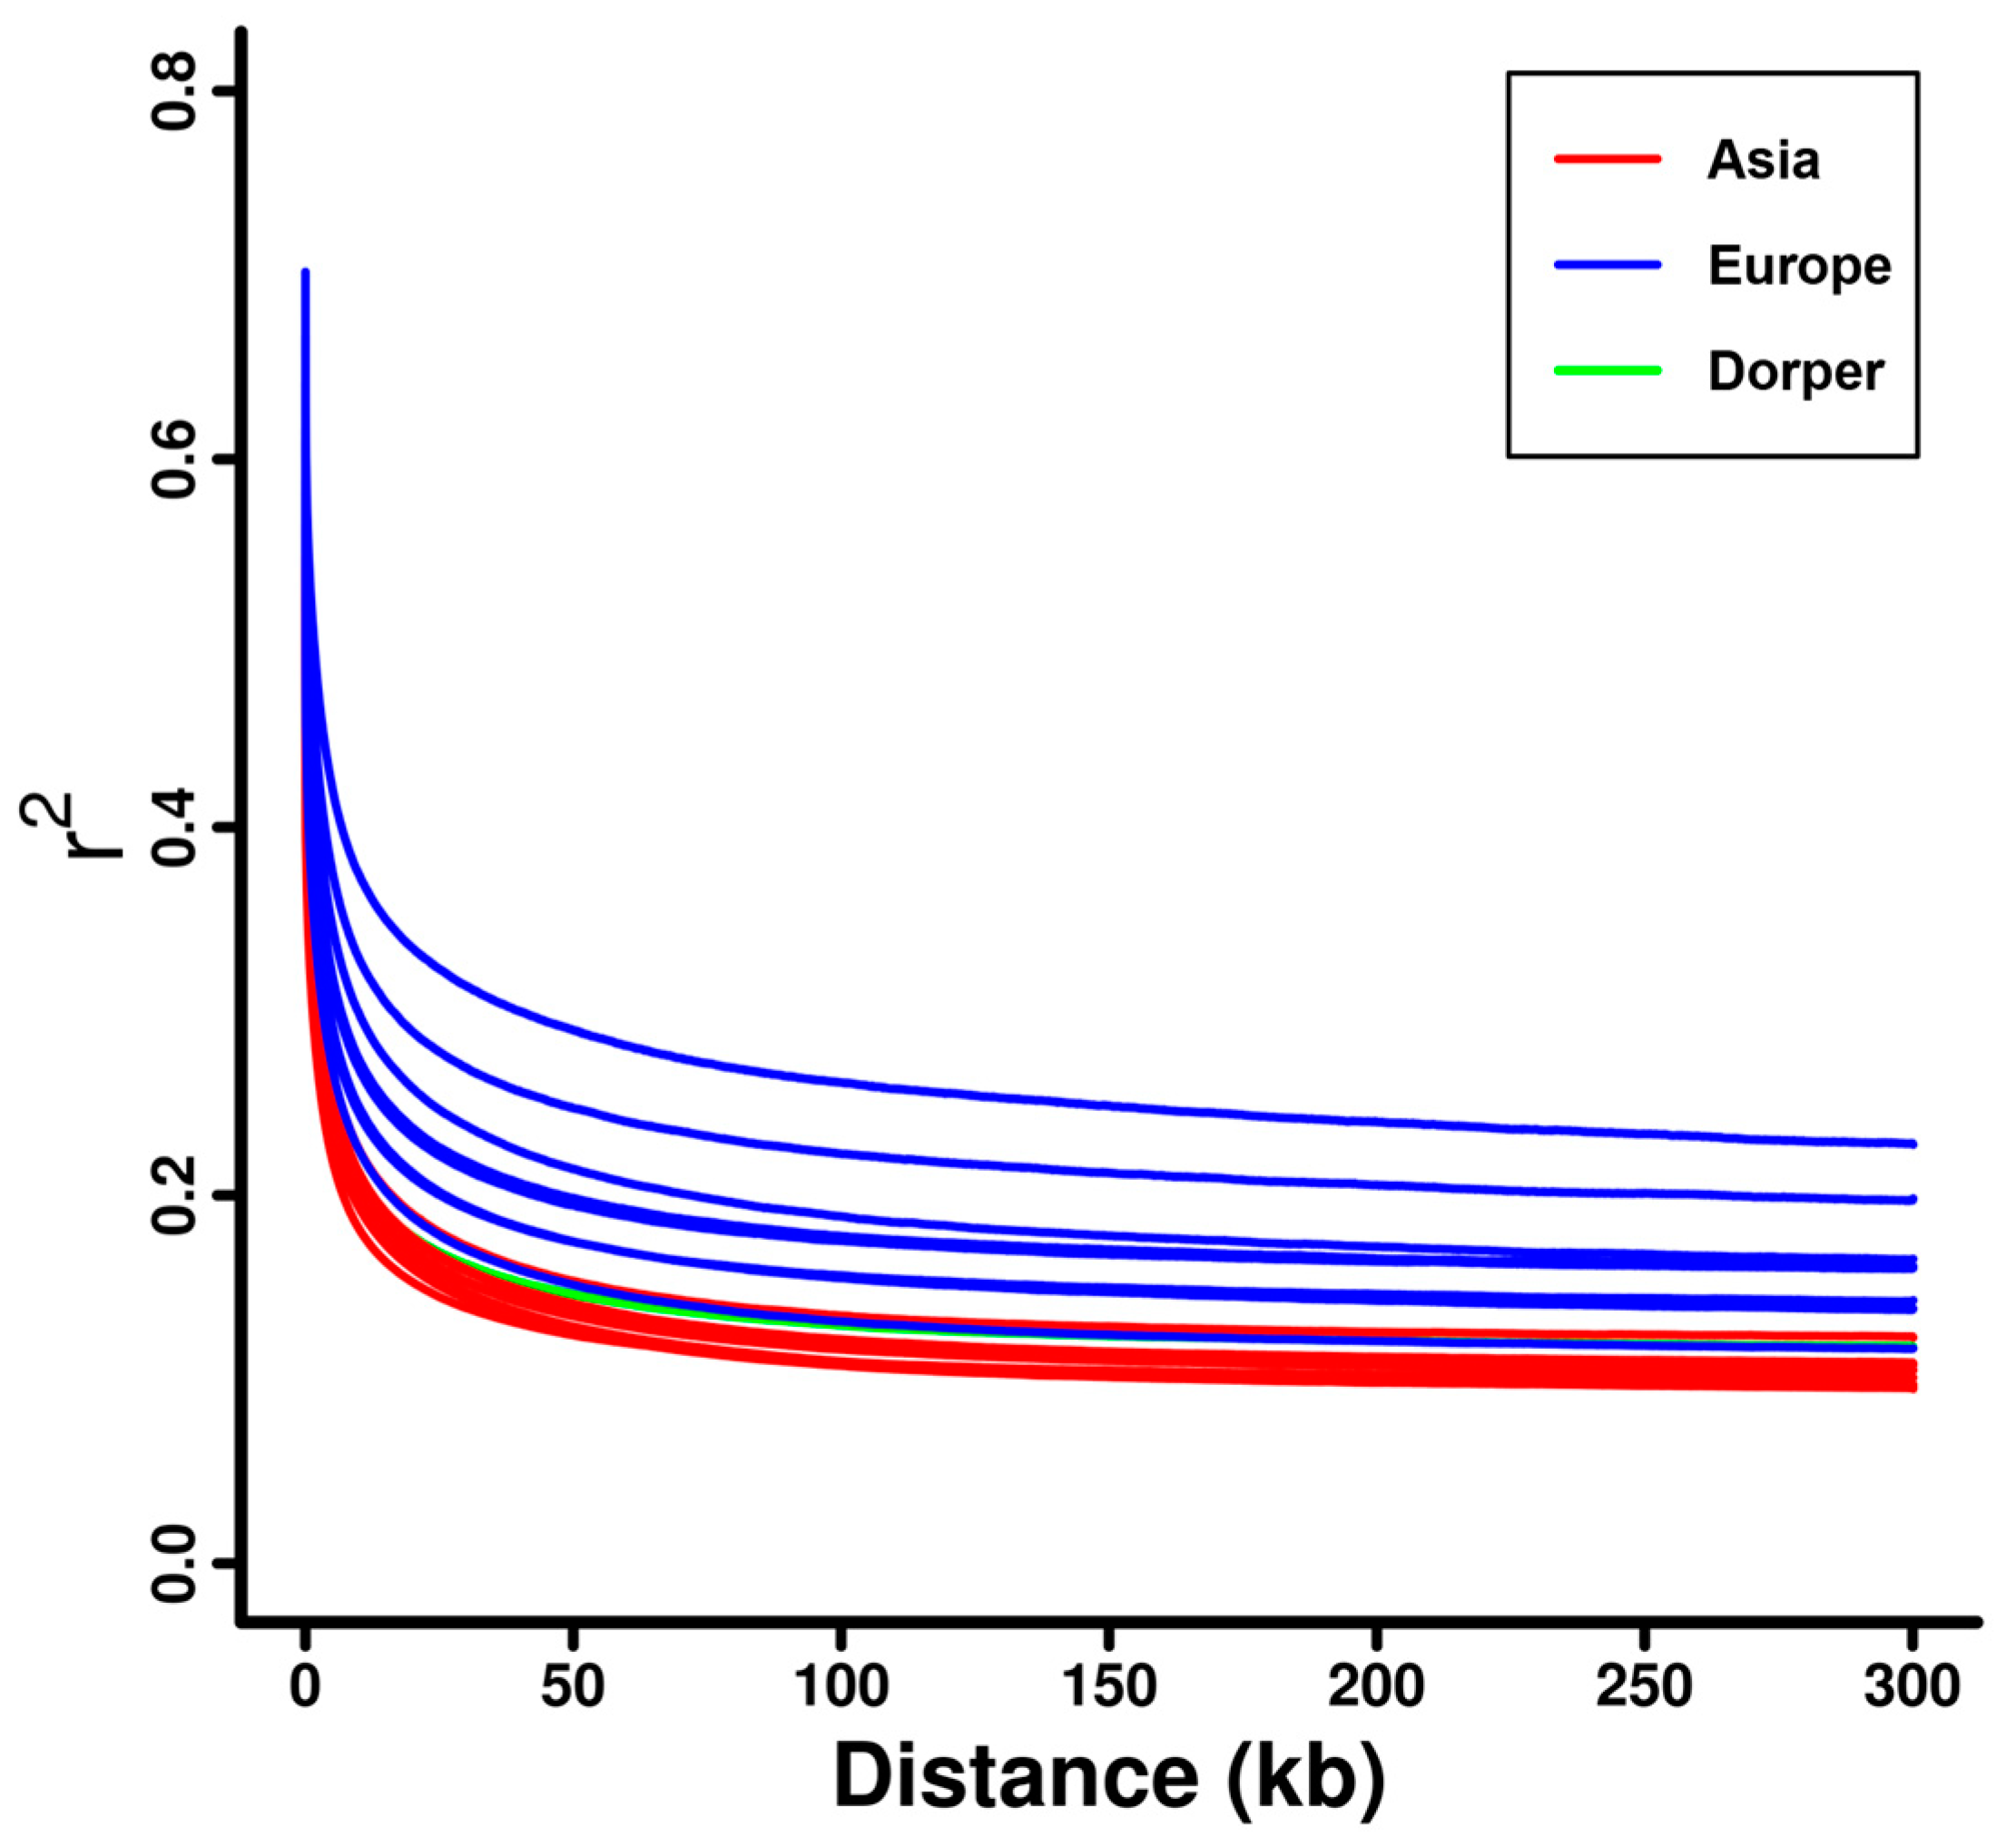
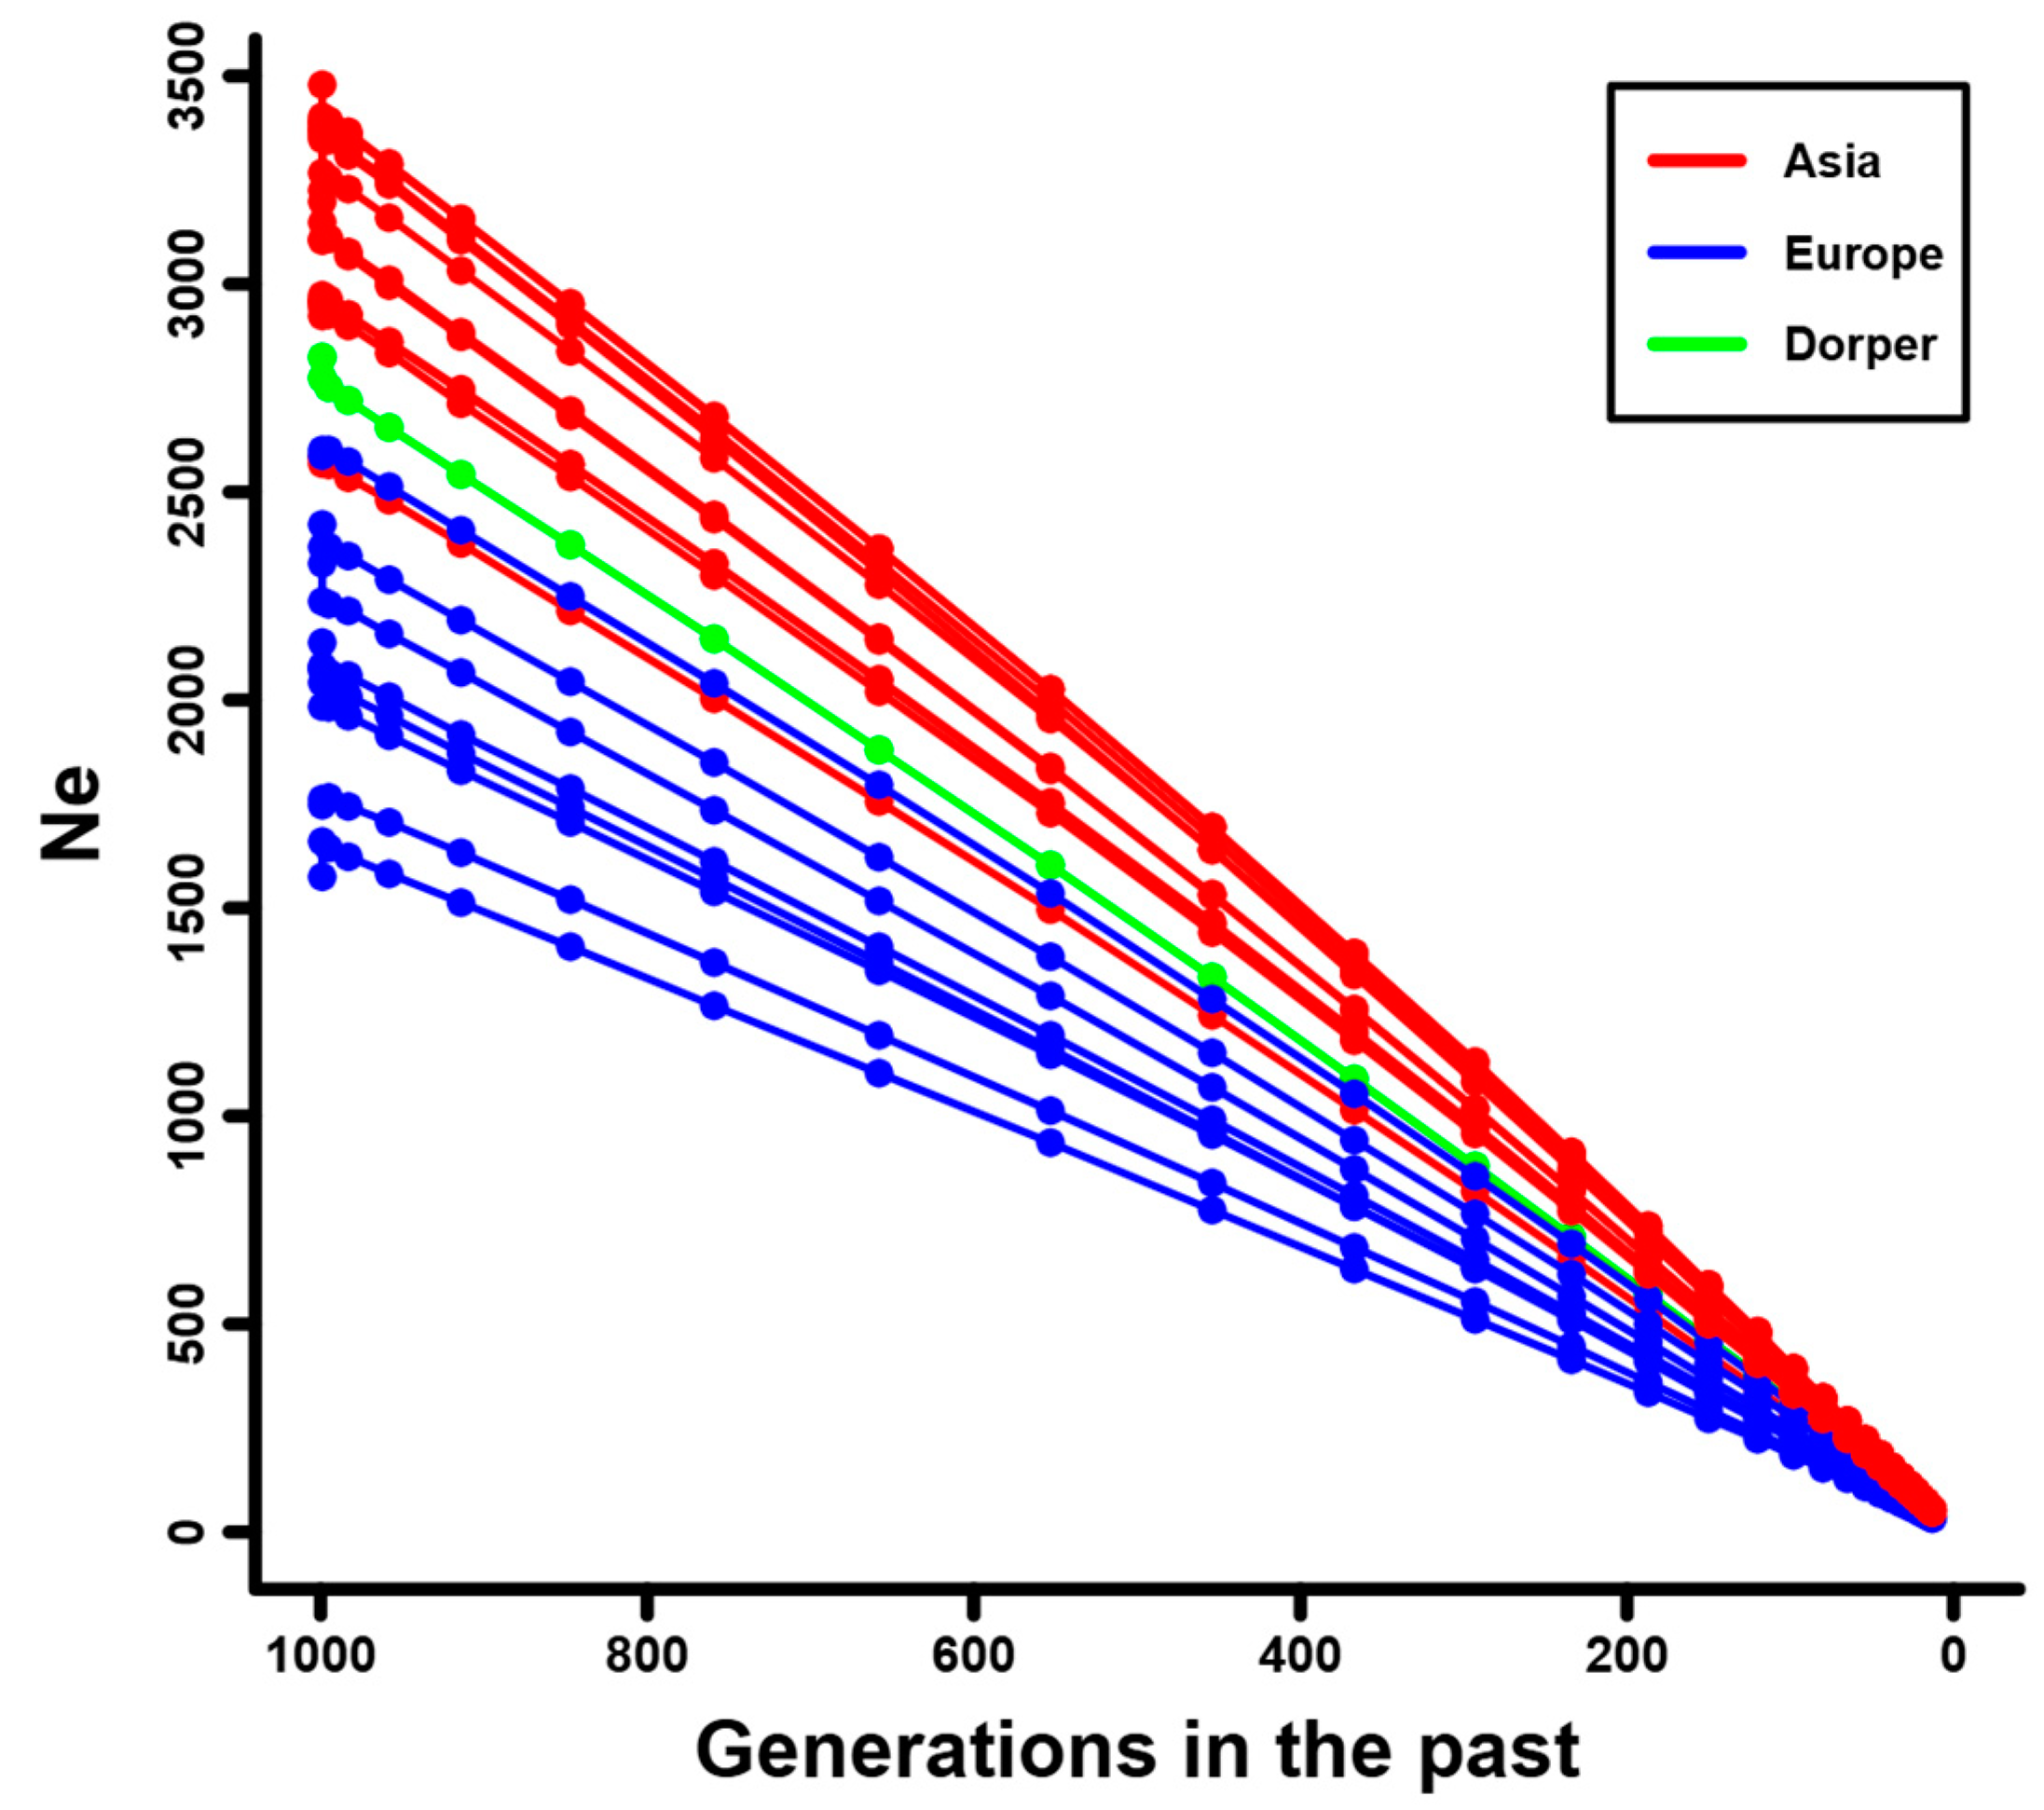
3.2. Linkage Disequilibrium and Effective Population Size

The decay of linkage disequilibrium (LD) against genomic distance among the 20 domestic sheep breeds showed that European sheep (e.g., Ouessant, Solognote, and Gotland sheep) had a higher level of LD than that in Dorper sheep and Asian sheep (e.g., Hu, Wadi, and Small-tailed Han sheep) (Figure 2 and Supplementary Figure S2). For individual breeds, Ouessant sheep had the highest level of LD, followed by Solognote and Gotland sheep (Supplementary Figure S2). The estimated Ne for the domestic sheep breeds in the past 1000 generations exhibited a similar trend of decline over time (Supplementary Figure S3). At specific generations tested (e.g., 1000 generations ago), Ne estimates were obviously larger in Asian sheep (e.g., Hu, Wadi, and Small-tailed Han sheep) than that in Dorper sheep and European sheep (e.g., Ouessant, Solognote, and Gotland sheep) (Figure 3 and Supplementary Figure S3). This pattern was inversely correlated with the pattern of LD level in the domestic sheep breeds. Ouessant, Solognote, and Gotland sheep had the smallest Ne (Supplementary Figure S3).

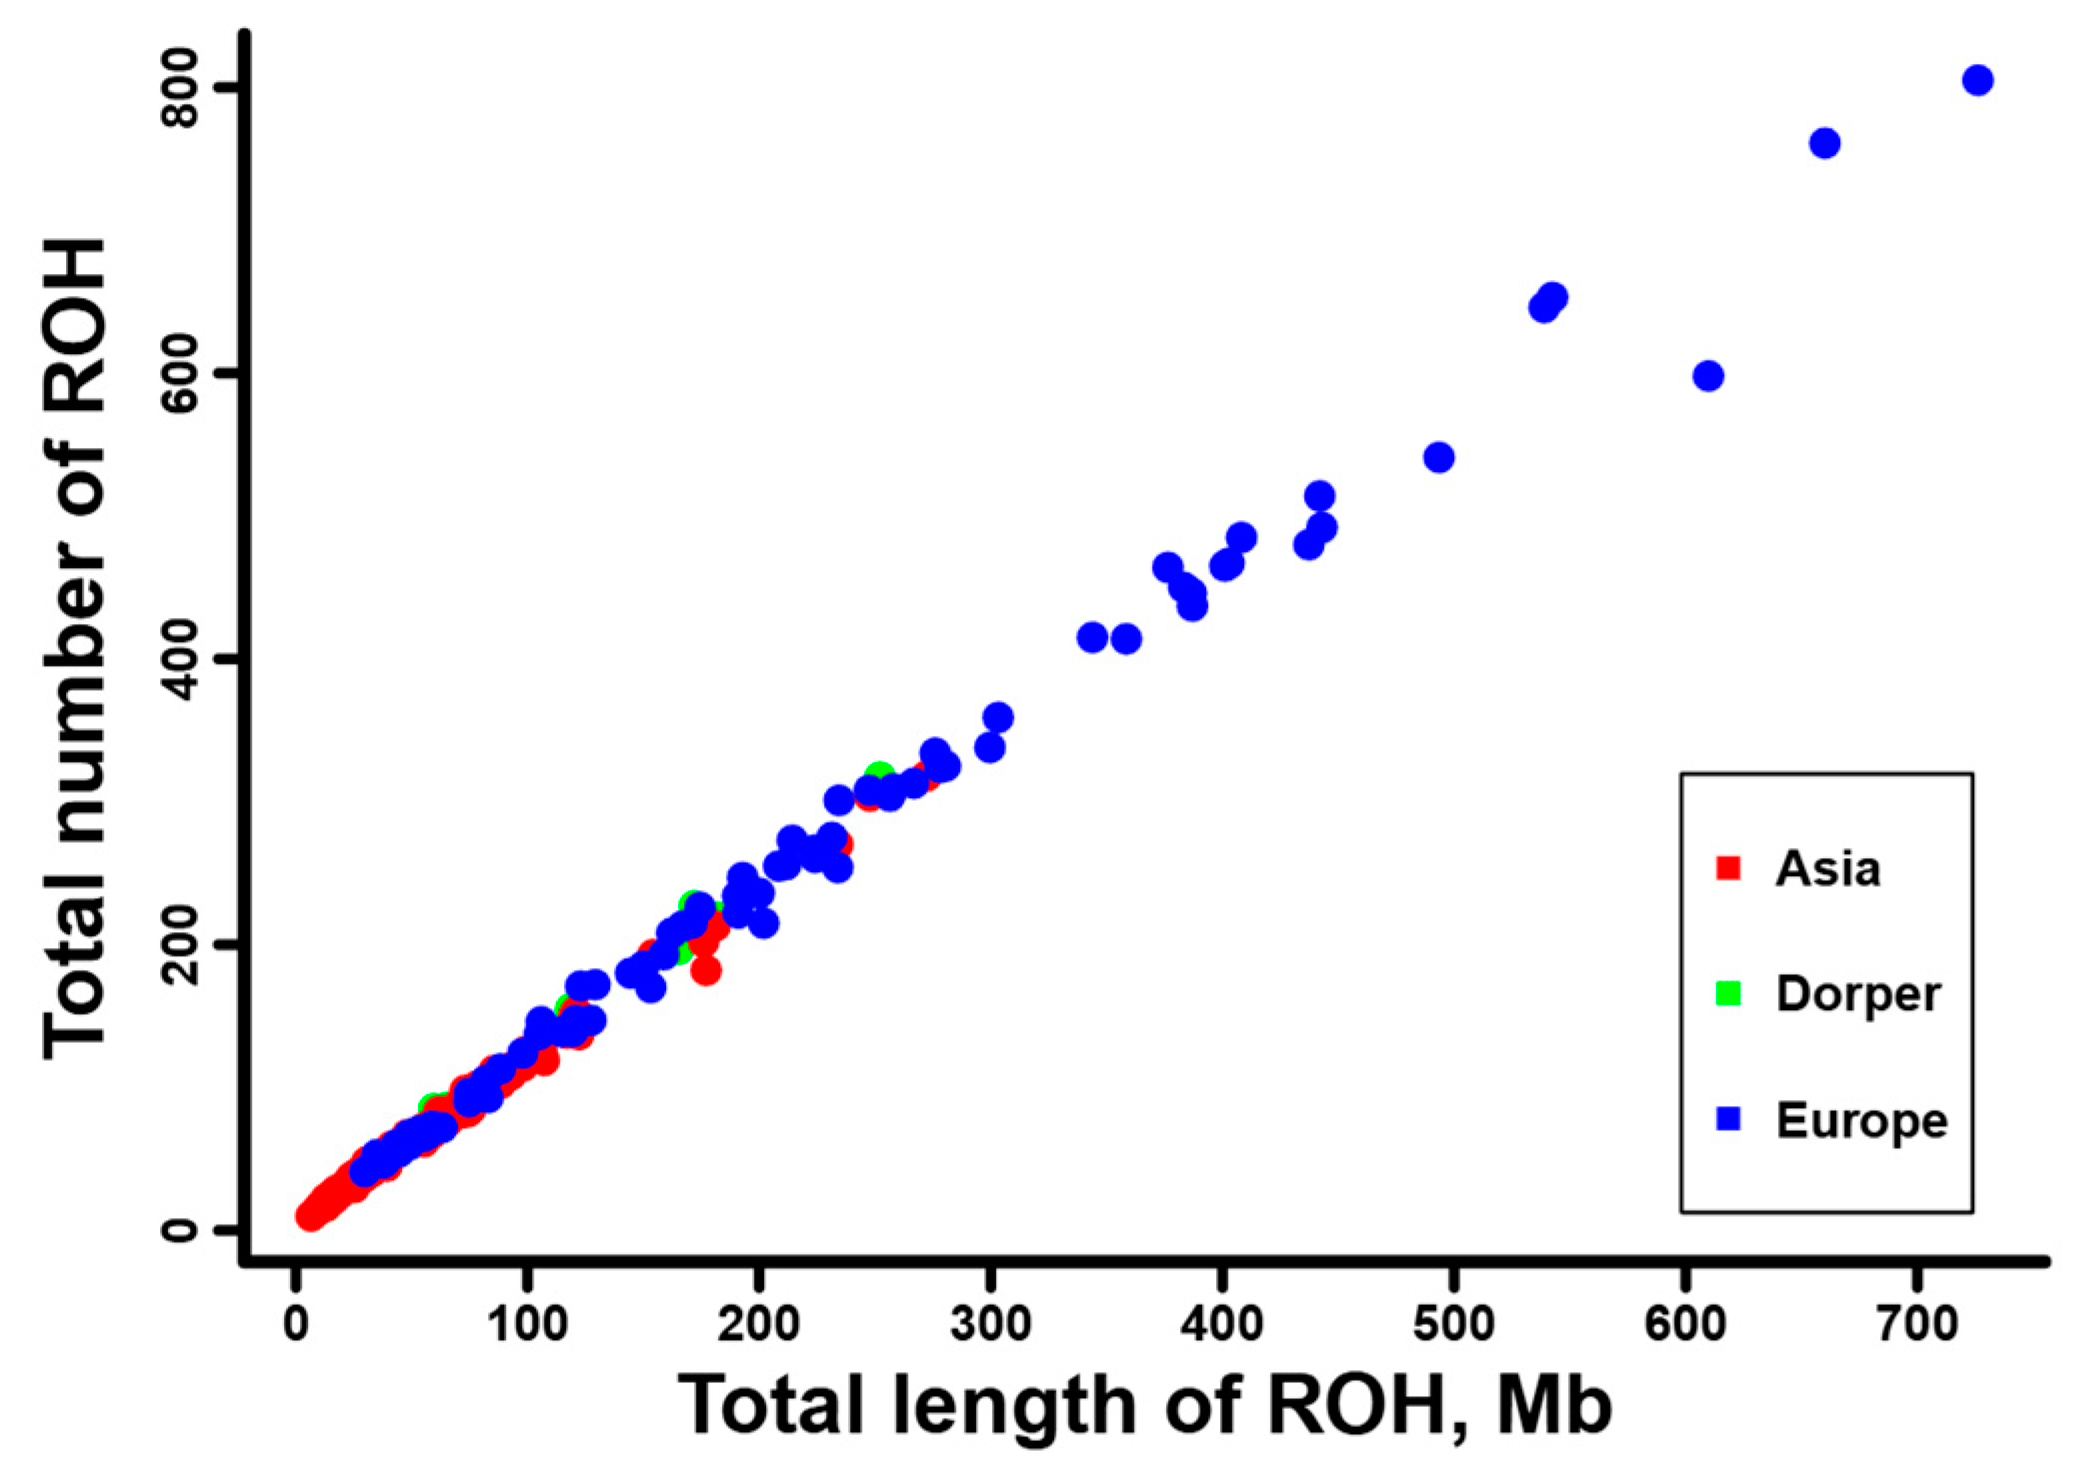
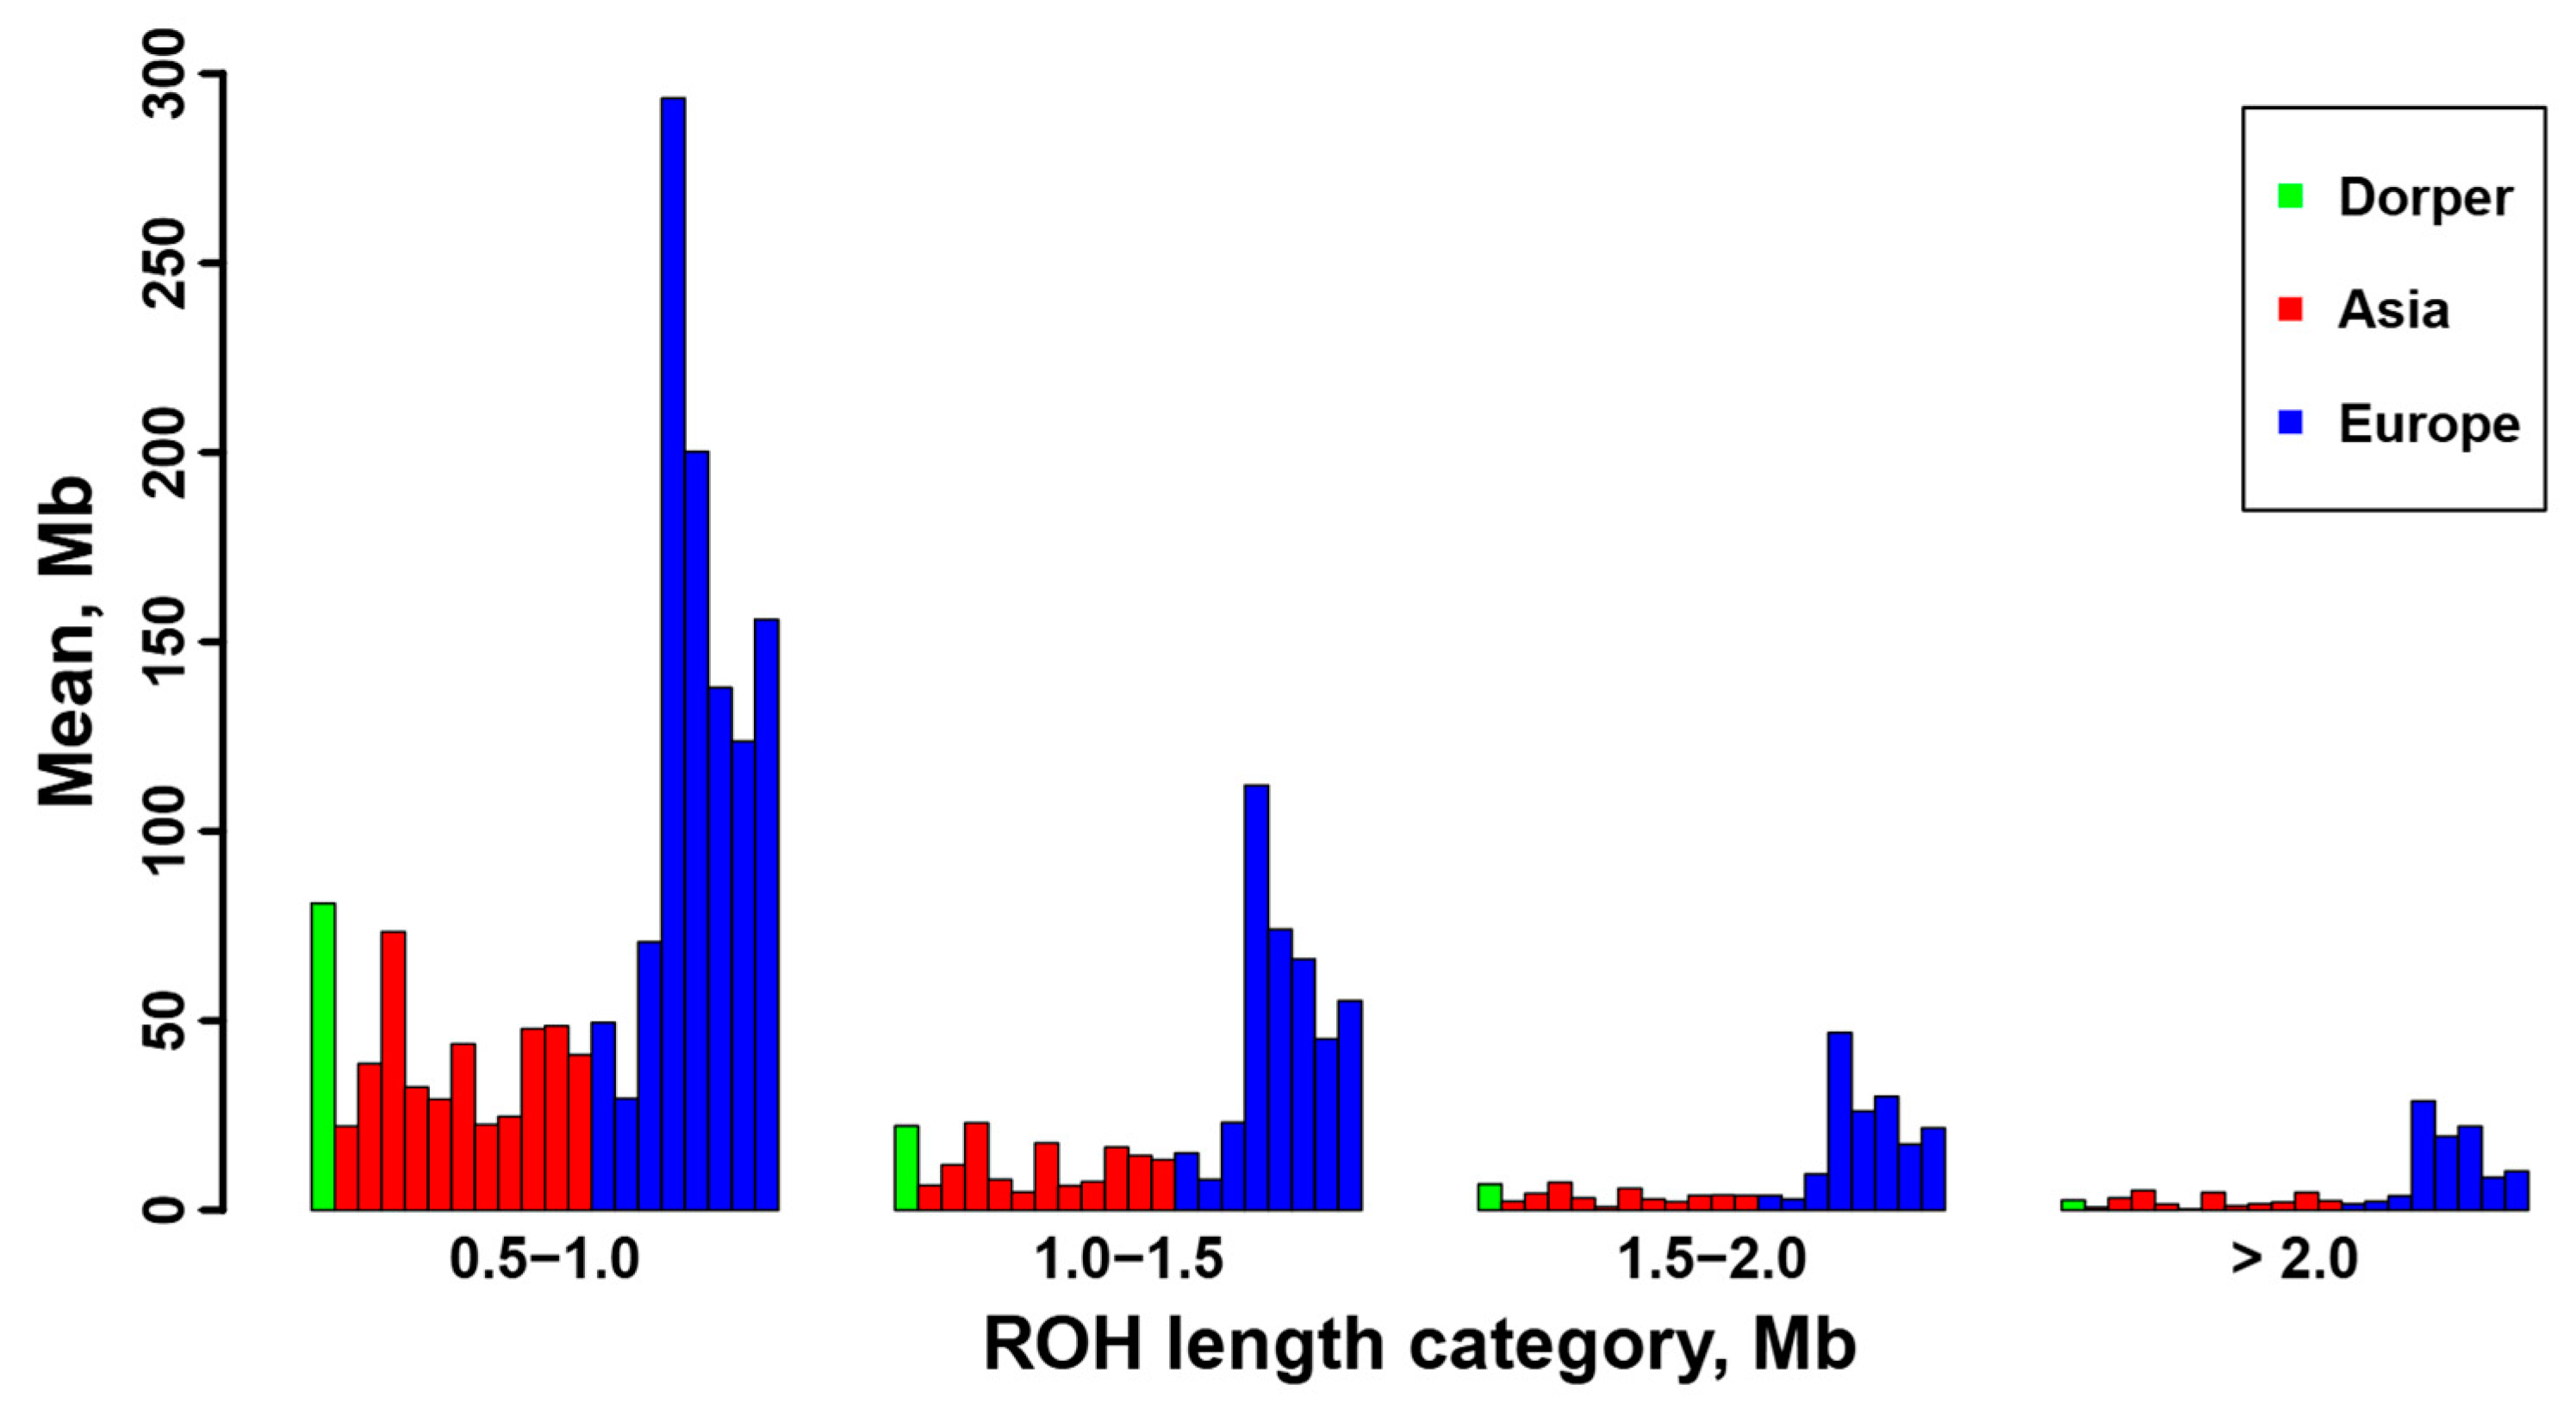
3.3. Genomic Characterization of ROH

To characterize genome-wide ROH in the studied sheep breeds, we first examined the average number of total ROH and the average length per ROH for each sheep breed. As shown in Table 1, the average ROH numbers ranged from 41.5 in Small-tailed Han sheep to 559.5 in Ouessant sheep. The top three highest average ROH numbers were found in three European breeds, Ouessant (559.5), Solognote (377.6), and Gotland sheep (293.8), and the first three lowest average ROH numbers were observed in three Asian breeds, Small-tailed Han (41.5), Altay (42.3), and Bashibai sheep (45.9) (Table 1). Regarding the average length per ROH, the pattern among the studied sheep breeds was similar to the average number of total ROH. The highest and lowest values of the average ROH length were still found in European breeds (e.g., 0.909 Mb in East Friesian Dairy sheep, 0.86 Mb in Ouessant sheep, and 0.847 Mb in Solognote sheep) and Asian breeds (e.g., 0.708 Mb in Hu sheep, 0.762 Mb in Small-tailed Han sheep, and 0.764 Mb in Large-tailed Han sheep), respectively (Table 1).
Furthermore, we calculated the total number and total length of the ROH for each individual, and they are displayed in Supplementary Figure S4. A positive and strong correlation was observed between the total ROH number and the total ROH length across individuals. Consistent with the results at breed level (Table 1), sheep individuals from Europe (e.g., Ouessant, East Friesian Dairy, Gotland, and Solognote individuals) exhibited the highest values of both the total number and total length of ROH (Figure 4 and Supplementary Figure S4). As for the mean sum of the ROH in the four length categories, short ROH segments of 0.5–1.0 Mb accounted for the largest percentage (53.8–83.5%) of the whole ROH length in all breeds, followed by segments of 1.0–1.5 Mb (13.4–25.9%), 1.5–2.0 Mb (2.4–11.7%), and greater than 2.0 Mb (0.6–8%) (Figure 5). European breeds had higher values of the mean sum of the ROH than Asian breeds and Dorper sheep in all length categories, and Ouessant sheep from Europe showed the highest mean sum values (Figure 5 and Supplementary Figure S5). Regarding the relationship between ROH segment length and generations of inbreeding events, the expected length of ROH theoretically follows an exponential distribution with a mean equal to 1/2 g Morgans, where g is the number of generations since the common ancestor. Based on this formula, ROH segments of 0.5–1.0 Mb, 1.0–1.5 Mb, 1.5–2.0 Mb, and >2.0 Mb correspond to 100–50 generations, 50–33.3 generations, 33.3–25 generations, and <25 generations of inbreeding events, respectively. In addition, we found a similar trend for the number of ROH among different chromosomes across breeds (Supplementary Figure S6). Generally, the number of ROH per chromosome tended to reduce with the decrease of chromosomal length. In most breeds, the highest and lowest number of ROH were detected on chromosome 1, and the highest percentage of total ROH length relative to chromosomal size was observed on chromosome 2 (Figure 6).

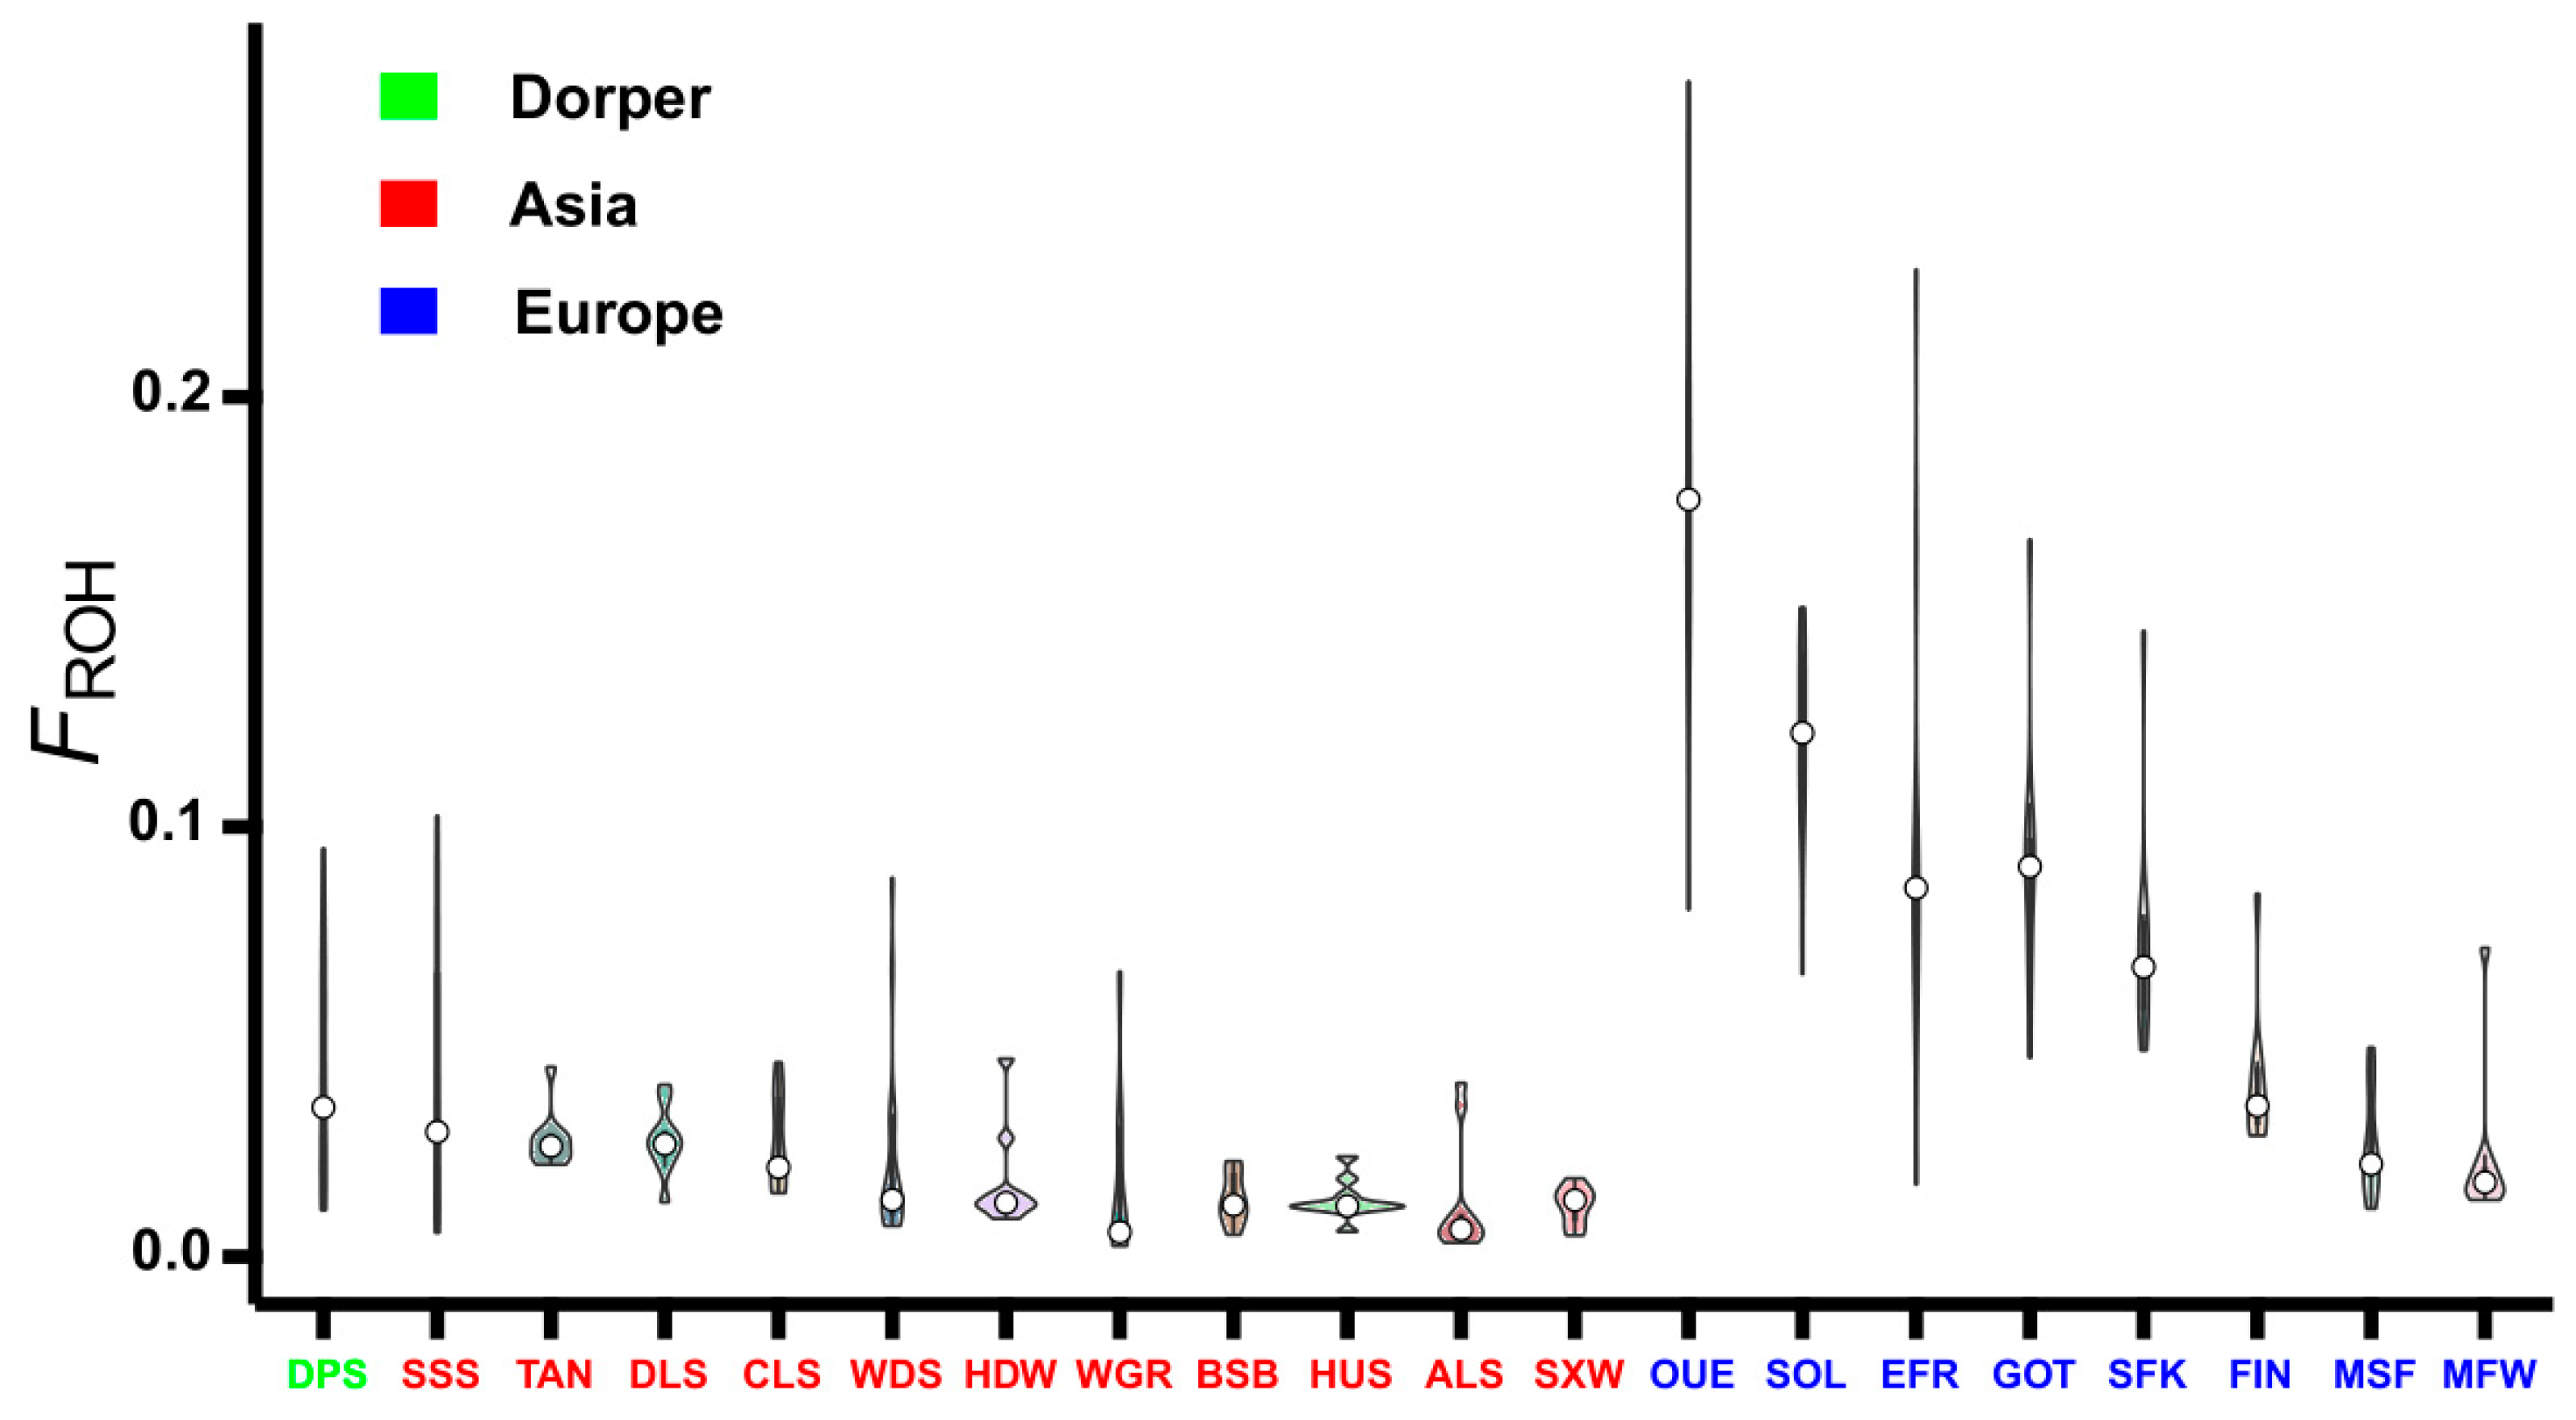
3.4. Inbreeding Coefficient Based on ROH

Based on the total length of the ROH, the inbreeding coefficient FROH was estimated for each individual, and then the mean value of FROH was calculated for each sheep breed. Overall, the FROH values varied obviously among different breeds and different geographic regions (Figure 7 and Table 1). For example, most European breeds had a significantly higher level of FROH than Asian breeds and Dorper sheep. The top three highest values of FROH were found in Ouessant (0.1812), Solognote (0.1204), and East Friesian Dairy sheep (0.0965) from Europe, while the first three lowest values were detected in Small-tailed Han (0.0119), Altay (0.0124), and Hu sheep (0.0131) from Asia.
The other estimated inbreeding coefficient, FHOM, generally exhibited higher values than FROH in almost all sheep breeds except Bashibai sheep and fine wool Merino sheep (Table 1). The FHOM value was only negative in Bashibai sheep and ranged from −0.0013 in Bashibai sheep to 0.3467 in Ouessant sheep (Table 1). The Pearson’s correlations between FROH and FHOM in the studied sheep breeds were from 0.595 in Solognote sheep to 0.995 in Sishui Fur sheep, and the average correlation coefficient across all breeds was 0.952 (Table 1).

3.5. ROH Islands and Candidate Genes for Various Traits

To identify genomic regions subjected to selection from the perspective of ROH, we examined the ROH islands in the sheep populations with the traits of high fecundity, wool fineness, and small body size (see Section 2.6). Particularly, we separately investigated the high fecundity trait of European and Asian sheep, which were under different livestock production systems. We estimated the occurrence of SNPs in the ROH and selected the top 0.5% of the highest occurrence SNPs as the threshold of the ROH islands for each trait. The ROH islands were illustrated through Manhattan plots of SNP occurrence against SNP locations along the chromosome (Figure 8). In total, we identified 18, 33, 27, and 42 ROH islands (14, 25, 20, and 32 islands containing annotated protein-coding genes) for the high fecundity trait of European sheep and Asian sheep, wool fineness trait, and small body size trait, respectively. The different number and different chromosomal distribution of ROH islands among the investigated traits may reveal distinct breeding history and selective pressure of each trait in the studied breeds. Detailed information about the identified ROH islands, such as the genomic location of ROH islands and the number of SNPs and candidate genes within ROH islands, is shown in Table 2.
Through the annotation of the SNPs in the ROH islands according to the genomic annotation file of Oar_rambouillet_v1.0 (NCBI accession GCF_002742125.1), we obtained 79 and 211 candidate genes for the fecundity trait of European sheep and Asian sheep, 174 candidate genes for the wool-related trait, and 325 candidate genes for the body size trait (Tables S2–S5). Notably, the functions of some candidate genes for the fecundity trait (e.g., CAMK4, KLHL1, WDR36, LTBP4, EGLN2, CAPNS1, WDR62, ATRN, HSPA12B, SPEF1, CENPB, CDC25B, SMOX, AGTR1, CPA3, and ZNF146 in European sheep; CAMK4, KLHL1, WDR36, FGFRL1, RNF212, HOXA gene family, EVX1, TTLL4, PLCD4, SLC11A1, AAMP, SPAG16, FSIP2, ABHD16B, NPBWR2, MYT1, GNRH2, OXT, AVP, RNPEP, PTPN7, CRYL1, IFT88, IL17D, STAG1, ADCY10, CXCR1, CXCR2, and PHLDA3 in Asian sheep) have been reported to be associated with reproduction, such as oocyte maturation, embryo development, spermatogenesis, pregnancy, litter size, and ovarian disease [48,49,50,51,52,53,54,55,56]. Most of the fecundity-associated candidate genes in European sheep (59 of 79) and Asian sheep (191 of 211) were different, probably indicating distinct genetic bases for the fecundity trait in the two sheep groups from different agroecosystems. Moreover, we found that candidate genes for the wool-related trait (e.g., SHCBP1, HOXA10, MTOR, MC1R, and TCF25) were functionally involved in hair follicle induction, morphogenesis and cycling, the formation of white wool, apoptosis of hair follicle stem cells, and coat color [57,58,59,60,61], while candidate genes for the body size trait (e.g., GDF6, KHDRBS2, PAX1, PTPN7, ALOX12, FGF11, TP53, KDM6B, CHD3, HES7, RPL26, PIK3R6, PIK3R5, NTN1, and TOM1L2) were functionally relevant to skeletal patterning, small or large body size, physical morphology, and tall stature phenotype [62,63,64,65,66,67]. Functional enrichment analysis of the candidate genes in Panther revealed significant (p < 0.05) and biologically important GO terms and pathways for investigated traits (Supplementary Table S6). For instance, two biological process GO terms (Reproductive process and Reproductive structure development) and one pathway (Vasopressin synthesis) were associated with the fecundity trait of Asian sheep.

4. Discussion

We examined genome-wide ROH patterns in worldwide sheep populations using high-depth sequencing data (i.e., an average sequencing depth of ~20.15×) of 210 sheep from 20 diverse sheep breeds. Compared to SNP chips, the use of whole-genome sequencing data can cover the entire genome and achieve greater resolution and accuracy for ROH detection, and subsequently provide a deeper understanding of genomic inbreeding and trait-associated candidate selected genes [12,31].
The results from the phylogenetic tree and PCA consistently showed that sheep breeds were largely classified into clusters according to their genetic origin (i.e., Asia, Europe, and Africa) and breed attribution (Figure 1b,c and Supplementary Figure S1), which was in line with previous findings on sheep population structure [33,35]. This could reflect the reliability of the genomic data of investigated sheep individuals. The linkage disequilibrium (LD) decay and effective population size (Ne) analysis revealed distinct demographic histories among the 20 sheep breeds. European breeds, such as Ouessant, Solognote, and Gotland sheep, exhibited higher levels of LD (e.g., higher r2 values), while Asian breeds and Dorper sheep displayed lower levels of LD (e.g., lower r2 values) (Figure 2 and Supplementary Figure S2). This finding was congruent with recent studies investigating sheep breeds from different continents [35], and may be attributed to small effective population sizes (Figure 3 and Supplementary Figure S3) [68] and extensive breeding practices in European sheep populations [69].
We found a non-uniform distribution of ROH among different sheep breeds. The average number of total ROH was 143.81, ranging from 41.5 ± 13.54 in Small-tailed Han sheep from Asia to 559.5 ± 159.06 in Ouessant sheep from Europe (Table 1). This quantity of ROH was much higher than previous reports in sheep (e.g., 23.8 ± 13.8) [8] and other livestock (e.g., cattle, 82.3 ± 9.83) [70] based on SNP chip data. With regard to different ROH length categories, a vast majority of the ROH belonged to short ROH segments of 0.5–1.0 Mb (53.8–83.5%) and 1.0–1.5 Mb (13.4–25.9%) (Figure 5). Compared to former studies, which detected a considerable number of long ROH (e.g., >4.0 Mb) from SNP chips [8,32], our high-depth whole-genome sequencing data greatly improved the resolution of short ROH, especially for those shorter than 1.0 Mb. The above results illustrate the advantage of whole-genome sequencing data for accurate and efficient identification of genomic ROH. Despite the aforementioned differences in detailed ROH statistics between this study and previous SNP chip-based research, our results revealed a similar ROH pattern for sheep breeds from different geographic regions. European breeds showed an overall higher ROH number and higher mean sum of ROH length than Asian breeds and Dorper sheep in all ROH length categories (Figure 4 and Figure 5, Supplementary Figures S4 and S5), indicating a high level of inbreeding in European populations [8]. In addition, the chromosomal distribution of ROH (Figure 6 and Supplementary Figure S6) was in agreement with previous studies that the number of ROH and the percentage of ROH length relative to chromosomal size are correlated with the chromosome length [71,72].
The FROH ranged from 0.0119 in Small-tailed Han sheep from Asia to 0.1812 in Ouessant sheep from Europe, and the level of FROH was significantly higher in European breeds than those in Asian breeds and Dorper sheep (Figure 7 and Table 1). These results were similar to previous sheep studies [8,32] and implied that Asian sheep and Dorper sheep populations are less inbred and possess higher levels of genetic diversity as compared to European sheep populations. We also estimated another genomic inbreeding coefficient, FHOM, which revealed analogous inbreeding patterns among the 20 sheep breeds and had a high correlation with FROH. This indicated the reliability of FROH as an effective measure of the inbreeding coefficient. Interestingly, Ouessant sheep had the highest values in ROH statistics, inbreeding coefficient, and LD level, as well as the smallest Ne. Ouessant sheep are famous for their extremely small size and are mainly distributed on Ouessant island, separated from the European continent [73]. The isolated environments restrict the genetic exchange between OUE sheep and other European sheep breeds [74], thus leading to a specific breeding history and genetic characteristics for this breed.
We identified 79 genes in 18 ROH islands, 211 genes in 33 ROH islands, 174 genes in 27 ROH islands, and 325 genes in 42 ROH islands across the sheep genome in corresponding breeds for the fecundity trait of European sheep and Asian sheep, wool-related trait, and body size trait, respectively (Table 2). Regarding the fecundity trait, we observed a large proportion of different candidate genes for Asian (191 out of 211 genes) and European prolificacy sheep (59 out of 79 genes), indicating a potential distinct genetic basis underlying their high fertility [75]. Among the candidate genes, we detected some important genes (e.g., CAMK4, HOXA gene family, GNRH2, FSIP2, and CRYL1), which have been reported to be associated with reproduction in sheep. For example, CAMK4 was found to be related to reproduction in Hu sheep [48] and the main factor regulating the reproductive behavior in Angus cattle [76]. The HOXA gene family (e.g., HOXA1-HOXA5, HOXA9-HOXA11, and HOXA13) has been linked to fertility in Hu sheep [55] and can enhance myometrial cell contractility and regulate female reproductive tract development in humans [77,78] and control cell differentiation and morphogenesis during mouse embryonic development [79,80]. GNRH2 has been documented to be associated with fertility in Hu sheep [55]. FSIP2 is a potential biomarker to assess the quality of frozen–thawed ram sperm [54]. CRYL1 is associated with sexual behavior in Rasa Aragonesa rams [81] and is a useful diagnostic target for intrauterine growth restriction in sheep [82]. Notably, we revealed 30 novel candidate genes (KLHL1, WDR36, FGFRL1, RNF212, EVX1, TTLL4, PLCD4, AAMP, SPAG16, ABHD16B, NPBWR2, RNPEP, PTPN7, IL17D, STAG1, ADCY10, CXCR1, CXCR2, and PHLDA3 in Asian sheep; KLHL1, WDR36, LTBP4, EGLN2, CAPNS1, WDR62, ATRN, HSPA12B, SPEF1, CDC25B, AGTR1, CPA3, and ZNF146 in European sheep) which were reported to be related to reproduction in humans or other animals but previously not known to associate with the sheep fecundity trait. For instance, KLHL1 is involved in oocyte maturation in humans [49]. FGFRL1 is related to the prolificacy trait in goats [53]. The expression of PHLDA3 in ovarian cortical tissues is associated with primary ovarian insufficiency in humans [56]. LTBP4 can regulate stromal and thecal cells during bovine ovarian development [50]. WDR62 is required for both oocyte meiotic maturation and spermatogenesis in mice [83,84]. The interaction of CDC25B with YWHAH can affect mouse oogenesis and oocyte maturation [85]. ZNF146 can regulate cell cycle progression in human ovarian cancer cells [52]. For the body size trait, we discovered 5 previously known (ALOX12, FGF11, RPL26, PIK3R5, and NTN1) [64,65,86] and 10 novel candidate genes (GDF6, KHDRBS2, PAX1, PTPN7, TP53, KDM6B, CHD3, HES7, PIK3R6, and TOM1L2) associated with sheep physical morphology and stature. Of the novel genes, PTPN7 can affect height in infancy and early childhood in humans [63]. GDF6 can determine multiple joint and skeletal patterning [62], and PAX1 can affect facial and other physical morphology [87] in mice. KDM6B and CHD3 were found to be associated with body size traits in pigs [66]. PIK3R6 showed direct functional associations with body size and height in cattle [67]. For wool-related traits, we identified several famous genes that have been well-known to control proliferation and apoptosis of hair follicle stem cells (MTOR) [60], wool quality (SHCBP1) [61], and wool color (HOXA10, MC1R, and TCF25) [57,58,59] in sheep.
Apart from the above findings, the present study has potential limitations. First, this study did not include information about the gender of the sheep individuals. Thus, the sex-based difference in ROH statistics and inbreeding levels cannot be addressed. Second, the sample size of each sheep breed is relatively small. As sampling may affect the results of ROH, LD, and Ne, future studies with a larger sample size are needed to verify the findings here and further enhance our understanding of ROH and genetic diversity in sheep populations. Third, the genomic inbreeding was analyzed using FROH and FHOM but not compared with additional measures such as those based on identical by descent (IBD) segment [88,89].

5. Conclusions

In conclusion, we used high-depth whole-genome sequencing data to reveal genome-wide ROH patterns, genomic breeding, and the genetic architecture of various traits in 20 sheep breeds. We found that most European breeds (six of eight breeds) have a larger total number and a longer total length of ROH, higher inbreeding levels, and smaller effective population sizes than Asian breeds. Notably, our results significantly improved the resolution of ROH detection by discerning much shorter ROH less than 1 Mb, which account for 53.8–83.5% of total ROH in different breeds. Based on ROH islands, we identified 270, 325, and 174 candidate genes associated with fecundity, body size, and wool-related traits. We also disclosed a large majority of different candidate genes between European (59 of 79 genes, 74.7%) and Asian (191 of 211 genes, 90.5%) prolificacy sheep, indicating a potentially different genetic basis for their fecundity traits. Importantly, we discovered 30 and 10 novel genes responsible for sheep fecundity and body size traits, respectively. Our study contributes to a deeper understanding of sheep population genetics and provides valuable new markers for future molecular breeding.

Supplementary Materials

The following supporting information can be downloaded at https://www.mdpi.com/article/10.3390/genes16030316/s1, Figure S1. Principal component analysis for Asian and European sheep breeds. (a) Principal component analysis for Asian sheep breeds. (b) Principal component analysis for European sheep breeds; Figure S2. LD decay across genomic distance in the 20 sheep breeds; Figure S3. Estimates of Ne for the 20 sheep breeds (or their ancestral populations) from 1000 years ago to today; Figure S4. Total number of ROH and total length of ROH segments per individual for each sheep breed; Figure S5. The mean sum of ROH length in Mb per individual for each sheep breed within each ROH length category; Figure S6. Number of ROH per chromosome in the 20 sheep breeds. Table S1. Summary of samples used in this study; Table S2. The candidate genes for European high fecundity trait in the ROH islands in FIN and GOT sheep; Table S3. The candidate genes for Asian high fecundity trait in the ROH islands in HUS, WDS, and SXW sheep; Table S4. The candidate genes for the wool-related trait in the ROH islands in MFW and MSF sheep; Table S5. The candidate genes for the body size trait in the ROH islands in OUE sheep; Table S6. The enrichment analysis results obtained using Panther.

Author Contributions

Conceptualization and supervision, J.Y.; methodology, R.M. and J.L.; formal analysis, R.M. and J.L.; writing—original draft preparation, R.M., J.L., and X.M.; writing—review and editing, J.Y.; funding acquisition, J.Y. All authors have read and agreed to the published version of the manuscript.

Funding

This study was financially supported by grants from the National Key Research and Development Program of China (Nos. 2022YFE0113300 and 2021YFF1000703) and the National Natural Science Foundation of China (No. 32272845).

Institutional Review Board Statement

This study was approved by the Institutional Animal Care and Use Committee of China Agricultural University (CAU20160628-2) (1 October 2023) and the local animal research ethics committee.

Informed Consent Statement

Not applicable.

Data Availability Statement

The whole genome re-sequence data used for the study are publicly available under the project numbers listed in Table S1. All scripts used for this work were performed using open-source software tools and are available from the corresponding authors upon request.

Acknowledgments

We thank the High-performance Computing Platform of China Agricultural University for providing computing resources.

Conflicts of Interest

The authors declare no conflicts of interest.

References

  1. Baird, D.; Fairbairn, A.; Jenkins, E.; Martin, L.; Middleton, C.; Pearson, J.; Asouti, E.; Edwards, Y.; Kabukcu, C.; Mustafaoglu, G.; et al. Agricultural origins on the Anatolian plateau. Proc. Natl. Acad. Sci. USA 2018, 115, E3077–E3086. [Google Scholar] [CrossRef]
  2. Zeder, M.A. Domestication and early agriculture in the Mediterranean Basin: Origins, diffusion, and impact. Proc. Natl. Acad. Sci. USA 2008, 105, 11597–11604. [Google Scholar] [CrossRef]
  3. Doekes, H.P.; Bijma, P.; Windig, J.J. How Depressing Is Inbreeding? A Meta-Analysis of 30 Years of Research on the Effects of Inbreeding in Livestock. Genes 2021, 12, 926. [Google Scholar] [CrossRef] [PubMed]
  4. Charlesworth, B.; Charlesworth, D. The genetic basis of inbreeding depression. Genet. Res. 1999, 74, 329–340. [Google Scholar] [CrossRef]
  5. Bjelland, D.W.; Weigel, K.A.; Vukasinovic, N.; Nkrumah, J.D. Evaluation of inbreeding depression in Holstein cattle using whole-genome SNP markers and alternative measures of genomic inbreeding. J. Dairy Sci. 2013, 96, 4697–4706. [Google Scholar] [CrossRef] [PubMed]
  6. Antonios, S.; Rodríguez-Ramilo, S.T.; Aguilar, I.; Astruc, J.M.; Legarra, A.; Vitezica, Z.G. Genomic and pedigree estimation of inbreeding depression for semen traits in the Basco-Bearnaise dairy sheep breed. J. Dairy Sci. 2021, 104, 3221–3230. [Google Scholar] [CrossRef]
  7. Tao, L.; He, X.Y.; Wang, X.Y.; Di, R.; Chu, M.X. Litter Size of Sheep (Ovis aries): Inbreeding Depression and Homozygous Regions. Genes 2021, 12, 109. [Google Scholar] [CrossRef] [PubMed]
  8. Nosrati, M.; Nanaei, H.A.; Javanmard, A.; Esmailizadeh, A. The pattern of runs of homozygosity and genomic inbreeding in world-wide sheep populations. Genomics 2021, 113, 1407–1415. [Google Scholar] [CrossRef]
  9. Wright, S. Coefficients of inbreeding and relationship. Am. Nat. 1922, 56, 330–338. [Google Scholar] [CrossRef]
  10. Oliehoek, P.A.; Bijma, P. Effects of pedigree errors on the efficiency of conservation decisions. Genet. Sel. Evol. 2009, 41, 9. [Google Scholar] [CrossRef]
  11. McQuillan, R.; Leutenegger, A.L.; Abdel-Rahman, R.; Franklin, C.S.; Pericic, M.; Barac-Lauc, L.; Smolej-Narancic, N.; Janicijevic, B.; Polasek, O.; Tenesa, A.; et al. Runs of Homozygosity in European Populations. Am. J. Hum. Genet. 2008, 83, 359–372. [Google Scholar] [CrossRef] [PubMed]
  12. Ceballos, F.C.; Joshi, P.K.; Clark, D.W.; Ramsay, M.; Wilson, J.F. Runs of homozygosity: Windows into population history and trait architecture. Nat. Rev. Genet. 2018, 19, 220–234. [Google Scholar] [CrossRef] [PubMed]
  13. Gibson, J.; Morton, N.E.; Collins, A. Extended tracts of homozygosity in outbred human populations. Hum. Mol. Genet. 2006, 15, 789–795. [Google Scholar] [CrossRef] [PubMed]
  14. Curik, I.; Ferencakovic, M.; Sölkner, J. Inbreeding and runs of homozygosity: A possible solution to an old problem. Livest. Sci. 2014, 166, 26–34. [Google Scholar] [CrossRef]
  15. Saravanan, K.A.; Panigrahi, M.; Kumar, H.; Bhushan, B.; Dutt, T.; Mishra, B.P. Genome-wide analysis of genetic diversity and selection signatures in three Indian sheep breeds. Livest. Sci. 2021, 243, 104367. [Google Scholar] [CrossRef]
  16. Caivio-Nasner, S.; López-Herrera, A.; González-Herrera, L.G.; Rincón, J.C. Diversity analysis, runs of homozygosity and genomic inbreeding reveal recent selection in Blanco Orejinegro cattle. J. Anim. Breed. Genet. 2021, 138, 613–627. [Google Scholar] [CrossRef]
  17. Schiavo, G.; Bovo, S.; Ribani, A.; Moscatelli, G.; Bonacini, M.; Prandi, M.; Mancin, E.; Mantovani, R.; Dall’Olio, S.; Fontanesi, L. Comparative analysis of inbreeding parameters and runs of homozygosity islands in 2 Italian autochthonous cattle breeds mainly raised in the Parmigiano-Reggiano cheese production region. J. Dairy Sci. 2022, 105, 2408–2425. [Google Scholar] [CrossRef]
  18. Ziegler, T.E.; Molina, A.; Ramón, M.; Sanchez, M.; Muñoz-Mejias, E.; Antonini, A.; Demyda-Peyrás, S. Analysis of the genomic landscape of inbreeding in two divergent groups of Spanish Florida goats. J. Anim. Breed. Genet. 2023, 140, 316–329. [Google Scholar] [CrossRef]
  19. Xiong, J.K.; Bao, J.J.; Hu, W.P.; Shang, M.Y.; Zhang, L. Whole-genome resequencing reveals genetic diversity and selection characteristics of dairy goat. Front. Genet. 2023, 13, 1044017. [Google Scholar] [CrossRef]
  20. Schiavo, G.; Bovo, S.; Muñoz, M.; Ribani, A.; Alves, E.; Araújo, J.P.; Bozzi, R.; Candek-Potokar, M.; Charneca, R.; Fernandez, A.; et al. Runs of homozygosity provide a genome landscape picture of inbreeding and genetic history of European autochthonous and commercial pig breeds. Anim. Genet. 2021, 52, 155–170. [Google Scholar] [CrossRef]
  21. Szmatola, T.; Jasielczuk, I.; Semik-Gurgul, E.; Szyndler-Nedza, M.; Blicharski, T.; Szulc, K.; Skrzypczak, E.; Gurgul, A. Detection of runs of homozygosity in conserved and commercial pig breeds in Poland. J. Anim. Breed. Genet. 2020, 137, 571–580. [Google Scholar] [CrossRef] [PubMed]
  22. Talebi, R.; Szmatola, T.; Mészáros, G.; Qanbari, S. Runs of Homozygosity in Modern Chicken Revealed by Sequence Data. G3-Genes Genomes Genet. 2020, 10, 4615–4623. [Google Scholar] [CrossRef]
  23. Wang, H.L.; Wang, Q.; Tan, X.D.; Wang, J.; Zhang, J.; Zheng, M.Q.; Zhao, G.P.; Wen, J. Estimation of genetic variability and identification of regions under selection based on runs of homozygosity in Beijing-You Chickens. Poult. Sci. 2023, 102, 102342. [Google Scholar] [CrossRef] [PubMed]
  24. Chen, C.J.; Zhu, B.; Tang, X.W.; Chen, B.; Liu, M.; Gao, N.; Li, S.; Gu, J.J. Genome-Wide Assessment of Runs of Homozygosity by Whole-Genome Sequencing in Diverse Horse Breeds Worldwide. Genes 2023, 14, 1211. [Google Scholar] [CrossRef] [PubMed]
  25. Criscione, A.; Mastrangelo, S.; D’Alessandro, E.; Tumino, S.; Di Gerlando, R.; Zumbo, A.; Marletta, D.; Bordonaro, S. Genome-wide survey on three local horse populations with a focus on runs of homozygosity pattern. J. Anim. Breed. Genet. 2022, 139, 540–555. [Google Scholar] [CrossRef]
  26. Letko, A.; Hédan, B.; Snell, A.; Harris, A.C.; Jagannathan, V.; Andersson, G.; Holst, B.S.; Ostrander, E.A.; Quignon, P.; André, C.; et al. Genomic Diversity and Runs of Homozygosity in Bernese Mountain Dogs. Genes 2023, 14, 650. [Google Scholar] [CrossRef]
  27. Sams, A.J.; Boyko, A.R. Fine-Scale Resolution of Runs of Homozygosity Reveal Patterns of Inbreeding and Substantial Overlap with Recessive Disease Genotypes in Domestic Dogs. G3-Genes Genomes Genet. 2019, 9, 117–123. [Google Scholar] [CrossRef] [PubMed]
  28. Zhang, Q.Q.; Guldbrandtsen, B.; Bosse, M.; Lund, M.S.; Sahana, G. Runs of homozygosity and distribution of functional variants in the cattle genome. BMC Genom. 2015, 16, 542. [Google Scholar] [CrossRef]
  29. Pemberton, T.J.; Absher, D.; Feldman, M.W.; Myers, R.M.; Rosenberg, N.A.; Li, J.Z. Genomic Patterns of Homozygosity in Worldwide Human Populations. Am. J. Hum. Genet. 2012, 91, 275–292. [Google Scholar] [CrossRef]
  30. Smith, J.M.; Haigh, J. The hitch-hiking effect of a favourable gene. Genet. Res. 2007, 89, 391–403. [Google Scholar] [CrossRef]
  31. Peripolli, E.; Munari, D.P.; Silva, M.; Lima, A.L.F.; Irgang, R.; Baldi, F. Runs of homozygosity: Current knowledge and applications in livestock. Anim. Genet. 2017, 48, 255–271. [Google Scholar] [CrossRef] [PubMed]
  32. Liu, J.X.; Shi, L.Y.; Li, Y.; Chen, L.; Garrick, D.; Wang, L.X.; Zhao, F.P. Estimates of genomic inbreeding and identification of candidate regions that differ between Chinese indigenous sheep breeds. J. Anim. Sci. Biotechnol. 2021, 12, 95. [Google Scholar] [CrossRef] [PubMed]
  33. Li, X.; Yang, J.; Shen, M.; Xie, X.L.; Liu, G.J.; Xu, Y.X.; Lv, F.H.; Yang, H.; Yang, Y.L.; Liu, C.B.; et al. Whole-genome resequencing of wild and domestic sheep identifies genes associated with morphological and agronomic traits. Nat. Commun. 2020, 11, 2815. [Google Scholar] [CrossRef] [PubMed]
  34. Deng, J.; Xie, X.L.; Wang, D.F.; Zhao, C.; Lv, F.H.; Li, X.; Yang, J.; Yu, J.L.; Shen, M.; Gao, L.; et al. Paternal Origins and Migratory Episodes of Domestic Sheep. Curr. Biol. 2020, 30, 4085–4095. [Google Scholar] [CrossRef]
  35. Lv, F.H.; Cao, Y.H.; Liu, G.J.; Luo, L.Y.; Lu, R.; Liu, M.J.; Li, W.R.; Zhou, P.; Wang, X.H.; Shen, M.; et al. Whole-Genome Resequencing of Worldwide Wild and Domestic Sheep Elucidates Genetic Diversity, Introgression, and Agronomically Important Loci. Mol. Biol. Evol. 2022, 39, msab353. [Google Scholar] [CrossRef]
  36. Bolger, A.M.; Lohse, M.; Usadel, B. Trimmomatic: A flexible trimmer for Illumina sequence data. Bioinformatics 2014, 30, 2114–2120. [Google Scholar] [CrossRef]
  37. Li, H.; Durbin, R. Fast and accurate short read alignment with Burrows-Wheeler transform. Bioinformatics 2009, 25, 1754–1760. [Google Scholar] [CrossRef]
  38. Danecek, P.; Bonfield, J.K.; Liddle, J.; Marshall, J.; Ohan, V.; Pollard, M.O.; Whitwham, A.; Keane, T.; McCarthy, S.A.; Davies, R.M.; et al. Twelve years of SAMtools and BCFtools. GigaScience 2021, 10, giab008. [Google Scholar] [CrossRef]
  39. DePristo, M.A.; Banks, E.; Poplin, R.; Garimella, K.V.; Maguire, J.R.; Hartl, C.; Philippakis, A.A.; del Angel, G.; Rivas, M.A.; Hanna, M.; et al. A framework for variation discovery and genotyping using next-generation DNA sequencing data. Nat. Genet. 2011, 43, 491–498. [Google Scholar] [CrossRef]
  40. Purcell, S.; Neale, B.; Todd-Brown, K.; Thomas, L.; Ferreira, M.A.R.; Bender, D.; Maller, J.; Sklar, P.; de Bakker, P.I.W.; Daly, M.J.; et al. PLINK: A tool set for whole-genome association and population-based linkage analyses. Am. J. Hum. Genet. 2007, 81, 559–575. [Google Scholar] [CrossRef]
  41. Price, M.N.; Dehal, P.S.; Arkin, A.P. FastTree: Computing Large Minimum Evolution Trees with Profiles instead of a Distance Matrix. Mol. Biol. Evol. 2009, 26, 1641–1650. [Google Scholar] [CrossRef] [PubMed]
  42. Letunic, I.; Bork, P. Interactive tree of life (iTOL) v3: An online tool for the display and annotation of phylogenetic and other trees. Nucleic Acids Res. 2016, 44, W242–W245. [Google Scholar] [CrossRef]
  43. Zhang, C.; Dong, S.S.; Xu, J.Y.; He, W.M.; Yang, T.L. PopLDdecay: A fast and effective tool for linkage disequilibrium decay analysis based on variant call format files. Bioinformatics 2019, 35, 1786–1788. [Google Scholar] [CrossRef]
  44. R Core Team. R: A Language and Environment for Statistical Computing; R Foundation for Statistical Computing: Vienna, Austria, 2021; Available online: https://www.R-project.org/ (accessed on 10 April 2024).
  45. Barbato, M.; Orozco-TerWengel, P.; Tapio, M.; Bruford, M.W. SNeP: A tool to estimate trends in recent effective population size trajectories using genome-wide SNP data. Front. Genet. 2015, 6, 6. [Google Scholar] [CrossRef] [PubMed]
  46. Mastrangelo, S.; Ciani, E.; Sardina, M.T.; Sottile, G.; Pilla, F.; Portolano, B.; BiOvIta, C. Runs of homozygosity reveal genome-wide autozygosity in Italian sheep breeds. Anim. Genet. 2018, 49, 71–81. [Google Scholar] [CrossRef] [PubMed]
  47. Thomas, P.D.; Ebert, D.; Muruganujan, A.; Mushayahama, T.; Albou, L.P.; Mi, H. PANTHER: Making genome-scale phylogenetics accessible to all. Protein Sci. 2022, 31, 8–22. [Google Scholar] [CrossRef]
  48. Zhao, L.M.; Yuan, L.; Li, F.D.; Zhang, X.X.; Tian, H.B.; Ma, Z.W.; Zhang, D.Y.; Zhang, Y.K.; Zhao, Y.; Huang, K.; et al. Whole-genome resequencing of Hu sheep identifies candidate genes associated with agronomic traits. J. Genet. Genom. 2024, 51, 866–876. [Google Scholar] [CrossRef]
  49. Liu, Q.L.; Sun, Y.X.; Guan, L.J.; Chen, X.N.; Zhou, J.; Liu, P.; Huo, B. Detection of the effect of microvibrational stimulation on human discarded immature oocytes by single-cell transcriptome sequencing technology. J. Assist. Reprod. Genet. 2023, 40, 1773–1781. [Google Scholar] [CrossRef]
  50. Hatzirodos, N.; Hummitzsch, K.; Irving-Rodgers, H.F.; Breen, J.; Perry, V.E.A.; Anderson, R.A.; Rodgers, R.J. Transcript abundance of stromal and thecal cell related genes during bovine ovarian development. PLoS ONE 2019, 14, e0213575. [Google Scholar] [CrossRef]
  51. Ietta, F.; Wu, Y.H.; Winter, J.; Xu, L.; Wang, J.X.; Post, M.; Caniggia, I. Dynamic HIF1A regulation during human placental development. Biol. Reprod. 2006, 75, 112–121. [Google Scholar] [CrossRef]
  52. Zhao, R.X.; Song, N.N.; Ning, X.; Chen, X.H.; Ma, R. ZNF146 regulates cell cycle progression via TFDP1 and DEPDC1B in ovarian cancer cells. Reproduction 2024, 168, e230484. [Google Scholar] [CrossRef] [PubMed]
  53. Sun, Z.P.; Hong, Q.H.; Liu, Y.F.; Ren, C.H.; He, X.Y.; Jiang, Y.T.; Ouyang, Y.N.; Chu, M.X.; Zhang, Z.J. Oviduct Transcriptomic Reveals the Regulation of mRNAs and lncRNAs Related to Goat Prolificacy in the Luteal Phase. Animals 2022, 12, 2823. [Google Scholar] [CrossRef] [PubMed]
  54. Zang, S.Q.; Yang, X.R.; Ye, J.F.; Mo, X.H.; Zhou, G.B.; Fang, Y. Quantitative phosphoproteomics explain cryopreservation-induced reductions in ram sperm motility. J. Proteom. 2024, 298, 105153. [Google Scholar] [CrossRef]
  55. Zhao, F.P.; Xie, R.; Fang, L.Z.; Xiang, R.D.; Yuan, Z.H.; Liu, Y.; Wang, L.X. Analysis of 206 whole-genome resequencing reveals selection signatures associated with breed-specific traits in Hu sheep. Evol. Appl. 2024, 17, e13697. [Google Scholar] [CrossRef]
  56. Yao, G.D.; He, J.H.; Kong, Y.; Zhai, J.; Xu, Y.J.; Yang, G.; Kong, D.Q.; Dong, F.L.; Shi, S.L.; Yang, Q.L.; et al. Transcriptional profiling of long noncoding RNAs and their target transcripts in ovarian cortical tissues from women with normal menstrual cycles and primary ovarian insufficiency. Mol. Reprod. Dev. 2019, 86, 847–861. [Google Scholar] [CrossRef]
  57. Zhang, W.T.; Jin, M.L.; Lu, Z.K.; Li, T.T.; Wang, H.H.; Yuan, Z.H.; Wei, C.H. Whole Genome Resequencing Reveals Selection Signals Related to Wool Color in Sheep. Animals 2023, 13, 3265. [Google Scholar] [CrossRef]
  58. Rochus, C.M.; Sunesson, K.W.; Jonas, E.; Mikko, S.; Johansson, A.M. Mutations in ASIP and MC1R: Dominant black and recessive black alleles segregate in native Swedish sheep populations. Anim. Genet. 2019, 50, 712–717. [Google Scholar] [CrossRef]
  59. Tian, D.H.; Han, B.Y.; Li, X.; Liu, D.H.; Zhou, B.C.; Zhao, C.C.; Zhang, N.; Wang, L.; Pei, Q.B.; Zhao, K. Genetic diversity and selection of Tibetan sheep breeds revealed by whole-genome resequencing. Anim. Biosci. 2023, 36, 991–1002. [Google Scholar] [CrossRef] [PubMed]
  60. Yu, M.Q.; Li, L.L.; Liu, M.; Wang, L.; Gao, X.X.; Zhou, L.S.; Liu, N.; He, J.N. miR-27a Targeting PIK3R3 Regulates the Proliferation and Apoptosis of Sheep Hair Follicle Stem Cells. Animals 2023, 13, 141. [Google Scholar] [CrossRef]
  61. Ma, G.W.; Wang, S.Z.; Wang, N.; Li, H.; Yang, H. A Study of Combined Genotype Effects of SHCBP1 on Wool Quality Traits in Chinese Merino. Biochem. Genet. 2023, 61, 551–564. [Google Scholar] [CrossRef]
  62. Settle, S.H.; Rountree, R.B.; Sinha, A.; Thacker, A.; Higgins, K.; Kingsley, D.M. Multiple joint and skeletal patterning defects caused by single and double mutations in the mouse Gdf6 and Gdf5 genes. Dev. Biol. 2003, 254, 116–130. [Google Scholar] [CrossRef] [PubMed]
  63. Kim, H.N.; Lee, E.J.; Jung, S.C.; Lee, J.Y.; Chung, H.W.; Kim, H.L. Genetic variants that affect length/height in infancy/early childhood in Vietnamese-Korean families. J. Hum. Genet. 2010, 55, 681–690. [Google Scholar] [CrossRef]
  64. Signer-Hasler, H.; Burren, A.; Ammann, P.; Drgemller, C.; Flury, C. Runs of homozygosity and signatures of selection: A comparison among eight local Swiss sheep breeds. Anim. Genet. 2019, 50, 512–525. [Google Scholar] [CrossRef] [PubMed]
  65. Kominakis, A.; Hager-Theodorides, A.L.; Zoidis, E.; Saridaki, A.; Antonakos, G.; Tsiamis, G. Combined GWAS and ‘guilt by association’-based prioritization analysis identifies functional candidate genes for body size in sheep. Genet. Sel. Evol. 2017, 49, 41. [Google Scholar] [CrossRef] [PubMed]
  66. Liu, H.T.; Song, H.L.; Jiang, Y.F.; Jiang, Y.; Zhang, F.X.; Liu, Y.B.; Shi, Y.; Ding, X.D.; Wang, C.D. A Single-Step Genome Wide Association Study on Body Size Traits Using Imputation-Based Whole-Genome Sequence Data in Yorkshire Pigs. Front. Genet. 2021, 12, 629049. [Google Scholar] [CrossRef]
  67. Vanvanhossou, S.F.U.; Scheper, C.; Dossa, L.H.; Yin, T.; Brügemann, K.; König, S. A multi-breed GWAS for morphometric traits in four Beninese indigenous cattle breeds reveals loci associated with conformation, carcass and adaptive traits. BMC Genom. 2020, 21, 783. [Google Scholar] [CrossRef]
  68. Prieur, V.; Clarke, S.M.; Brito, L.F.; McEwan, J.C.; Lee, M.A.; Brauning, R.; Dodds, K.G.; Auvray, B. Estimation of linkage disequilibrium and effective population size in New Zealand sheep using three different methods to create genetic maps. BMC Genet. 2017, 18, 68. [Google Scholar] [CrossRef]
  69. Peter, C.; Bruford, M.; Perez, T.; Dalamitra, S.; Hewitt, G.; Erhardt, G.; Consortium, E. Genetic diversity and subdivision of 57 European and Middle-Eastern sheep breeds. Anim. Genet. 2007, 38, 37–44. [Google Scholar] [CrossRef]
  70. Marras, G.; Gaspa, G.; Sorbolini, S.; Dimauro, C.; Ajmone-Marsan, P.; Valentini, A.; Williams, J.L.; Macciotta, N.P.P. Analysis of runs of homozygosity and their relationship with inbreeding in five cattle breeds farmed in Italy. Anim. Genet. 2015, 46, 110–121. [Google Scholar] [CrossRef]
  71. Mastrangelo, S.; Tolone, M.; Sardina, M.T.; Sottile, G.; Sutera, A.M.; Di Gerlando, R.; Portolano, B. Genome-wide scan for runs of homozygosity identifies potential candidate genes associated with local adaptation in Valle del Belice sheep. Genet. Sel. Evol. 2017, 49, 84. [Google Scholar] [CrossRef]
  72. Islam, R.; Li, Y.F.; Liu, X.X.; Berihulay, H.; Abied, A.; Gebreselassie, G.; Ma, Q.; Ma, Y.H. Genome-Wide Runs of Homozygosity, Effective Population Size, and Detection of Positive Selection Signatures in Six Chinese Goat Breeds. Genes 2019, 10, 938. [Google Scholar] [CrossRef] [PubMed]
  73. Conrad, L.; Hoerl, J.; Henke, M.; Luick, R.; Schoof, N. Sheep in the Vineyard: Suitability of Different Breeds and Potential Breeding Objectives. Animals 2022, 12, 2575. [Google Scholar] [CrossRef]
  74. Rochus, C.M.; Jonas, E.; Johansson, A.M. Population structure of five native sheep breeds of Sweden estimated with high density SNP genotypes. BMC Genet. 2020, 21, 27. [Google Scholar] [CrossRef] [PubMed]
  75. Xu, S.S.; Gao, L.; Xie, X.L.; Ren, Y.L.; Shen, Z.Q.; Wang, F.; Shen, M.; Eypórsdóttir, E.; Hallsson, J.H.; Kiseleva, T.; et al. Genome-Wide Association Analyses Highlight the Potential for Different Genetic Mechanisms for Litter Size Among Sheep Breeds. Front. Genet. 2018, 9, 118. [Google Scholar] [CrossRef]
  76. Huang, Y.W.; Yuan, C.F.; Zhao, Y.; Li, C.J.; Cao, M.S.; Li, H.B.; Zhao, Z.J.; Sun, A.; Basang, W.D.; Zhu, Y.B.; et al. Identification and Regulatory Network Analysis of Genes Related to Reproductive Performance in the Hypothalamus and Pituitary of Angus Cattle. Genes 2022, 13, 965. [Google Scholar] [CrossRef] [PubMed]
  77. Liu, L.L.; Li, H.L.; Dargahi, D.; Shynlova, O.; Slater, D.; Jones, S.J.M.; Lye, S.J.; Dong, X.S. HoxA13 Regulates Phenotype Regionalization of Human Pregnant Myometrium. J. Clin. Endocrinol. Metab. 2015, 100, E1512–E1522. [Google Scholar] [CrossRef]
  78. Cunha, G.R.; Robboy, S.J.; Kurita, T.; Isaacson, D.; Shen, J.; Cao, M.; Baskin, L.S. Development of the human female reproductive tract. Differentiation 2018, 103, 46–65. [Google Scholar] [CrossRef]
  79. Chojnowski, J.L.; Trau, H.A.; Masuda, K.; Manley, N.R. Temporal and spatial requirements for Hoxa3 in mouse embryonic development. Dev. Biol. 2016, 415, 33–45. [Google Scholar] [CrossRef]
  80. Donaldson, I.J.; Amin, S.; Hensman, J.J.; Kutejova, E.; Rattray, M.; Lawrence, N.; Hayes, A.; Ward, C.M.; Bobola, N. Genome-wide occupancy links Hoxa2 to Wnt-β-catenin signaling in mouse embryonic development. Nucleic Acids Res. 2012, 40, 3990–4001. [Google Scholar] [CrossRef]
  81. Lakhssassi, K.; Sarto, M.P.; Lahoz, B.; Alabart, J.L.; Folch, J.; Serrano, M.; Calvo, J.H. Blood transcriptome of Rasa Aragonesa rams with different sexual behavior phenotype reveals CRYL1 and SORCS2 as genes associated with this trait. J. Anim. Sci. 2023, 101, skad098. [Google Scholar] [CrossRef]
  82. Wang, W.N.; Chen, S.J.; Qiao, L.Y.; Zhang, S.Y.; Liu, Q.X.; Yang, K.J.; Pan, Y.Y.; Liu, J.H.; Liu, W.Z. Four Markers Useful for the Distinction of Intrauterine Growth Restriction in Sheep. Animals 2023, 13, 3305. [Google Scholar] [CrossRef] [PubMed]
  83. Wang, Y.S.; Chen, C.; Ahmad, M.J.; Chen, F.; Ding, Z.M.; Yang, S.J.; Chen, Y.W.; Duan, Z.Q.; Liu, M.; Liang, A.X.; et al. WDR62 regulates mouse oocyte meiotic maturation related to p-JNK and H3K9 trimethylation. Int. J. Biochem. Cell Biol. 2022, 144, 106169. [Google Scholar] [CrossRef] [PubMed]
  84. Ho, U.Y.; Feng, C.W.A.; Yeap, Y.Y.; Bain, A.L.; Wei, Z.; Shohayeb, B.; Reichelt, M.E.; Homer, H.; Khanna, K.K.; Bowles, J.; et al. WDR62 is required for centriole duplication in spermatogenesis and manchette removal in spermiogenesis. Commun. Biol. 2021, 4, 645. [Google Scholar] [CrossRef]
  85. Eisa, A.A.; De, S.; Detwiler, A.; Gilker, E.; Ignatious, A.C.; Vijayaraghavan, S.; Kline, D. YWHA (14-3-3) protein isoforms and their interactions with CDC25B phosphatase in mouse oogenesis and oocyte maturation. BMC Dev. Biol. 2019, 19, 20. [Google Scholar] [CrossRef] [PubMed]
  86. He, S.G.; Di, J.; Han, B.; Chen, L.; Liu, M.J.; Li, W.R. Genome-Wide Scan for Runs of Homozygosity Identifies Candidate Genes Related to Economically Important Traits in Chinese Merino. Animals 2020, 10, 524. [Google Scholar] [CrossRef]
  87. Qian, Y.; Xiong, Z.; Li, Y.; Kayser, M.; Liu, L.; Liu, F. The effects of Tbx15 and Pax1 on facial and other physical morphology in mice. FASEB bioAdvances 2021, 3, 1011–1019. [Google Scholar] [CrossRef]
  88. Lencz, T.; Lambert, C.; DeRosse, P.; Burdick, K.E.; Morgan, T.V.; Kane, J.M.; Kucherlapati, R.; Malhotra, A.K. Runs of homozygosity reveal highly penetrant recessive loci in schizophrenia. Proc. Natl. Acad. Sci. USA 2007, 104, 19942–19947. [Google Scholar] [CrossRef]
  89. Meyermans, R.; Gorssen, W.; Buys, N.; Janssens, S. How to study runs of homozygosity using PLINK? A guide for analyzing medium density SNP data in livestock and pet species. BMC Genom. 2020, 21, 94. [Google Scholar] [CrossRef]
Figure 1. Breed origin and genetic structure of the studied sheep breeds from Asia (11 breeds) and Europe (8 breeds), along with the Dorper sheep from Africa. (a) The geographic distribution of the 20 sheep breeds. ALS, Altay; BSB, Bashibai; CLS, Cele Black; DLS, Duolang; DPS, Dorper; EFR, East Friesian Dairy; FIN, Finnsheep; GOT, Gotland; HDW, Large-tailed Han; HUS, Hu; MFW, Chinese Merino (fine wool); MSF, Chinese Merino (super-fine wool); OUE, Ouessant; SFK, Suffolk; SOL, Solognote; SSS, Sishui Fur; SXW, Small-tailed Han; TAN, Tan; WDS, Wadi; and WGR, Waggir. (b) Plots of principal components 1 and 2 for 210 individuals from the 20 breeds. (c) Maximum-likelihood tree construction for the 20 sheep breeds.
Genes 16 00316 g001
Figure 2. LD decay for the sheep breeds from Asia and Europe, as well as the Dorper sheep (an African breed).
Genes 16 00316 g002
Figure 3. Estimated effective population sizes (Ne) for the sheep breeds from Asia and Europe, as well as the Dorper sheep (an African breed). The Ne is the historical effective population size of the studied sheep breeds or their ancestral populations.
Genes 16 00316 g003
Figure 4. The total number and total length of ROH per individual for the sheep breeds from Asia and Europe, as well as the Dorper sheep (an African breed).
Genes 16 00316 g004
Figure 5. The mean sum of ROH length per individual for the sheep breeds from Asia and Europe, as well as the Dorper sheep (an African breed).
Genes 16 00316 g005
Figure 6. The number of ROH per chromosome for the sheep breeds from Asia and Europe, as well as the Dorper sheep (an African breed).
Genes 16 00316 g006
Figure 7. Distribution of inbreeding coefficient FROH in the 20 sheep breeds. ALS, Altay; BSB, Bashibai; CLS, Cele Black; DLS, Duolang; DPS, Dorper; EFR, East Friesian Dairy; FIN, Finnsheep; GOT, Gotland; HDW, Large-tailed Han; HUS, Hu; MFW, Chinese Merino (fine wool); MSF, Chinese Merino (super-fine wool); OUE, Ouessant; SFK, Suffolk; SOL, Solognote; SSS, Sishui Fur; SXW, Small-tailed Han; TAN, Tan; WDS, Wadi; and WGR, Waggir.
Genes 16 00316 g007
Figure 8. Manhattan plot of SNP occurrence within ROH regions along the chromosome for the investigated traits. The horizontal red line represents the threshold to define the ROH islands.
Genes 16 00316 g008
Table 1. Summary statistics for ROH and genomic inbreeding coefficients.
BreedsROH Number (Mean ± SD)ROH Length, Mb (Mean ± SD)FROH (Mean ± SD)FHOM (Mean ± SD)r(FROH − FHOM)
DPS143.80 ± 93.370.784 ± 0.2970.0425 ± 0.02880.0730 ± 0.05230.913
SXW41.50 ± 13.540.762 ± 0.3180.0119 ± 0.00430.0271 ± 0.01480.724
WDS71.65 ± 60.100.809 ± 0.3790.0218 ± 0.02090.0539 ± 0.03500.922
SSS135.20 ± 116.950.805 ± 0.3560.0410 ± 0.03780.0849 ± 0.06980.995
HDW59.00 ± 32.740.764 ± 0.3220.0170 ± 0.01140.0411 ± 0.01810.928
HUS49.30 ± 15.870.708 ± 0.2320.0131 ± 0.00470.0469 ± 0.00910.718
TAN85.30 ± 19.710.843 ± 0.3870.0271 ± 0.00650.0489 ± 0.01110.893
ALS42.30 ± 38.790.779 ± 0.3320.0124 ± 0.01350.0154 ± 0.02500.985
BSB45.90 ± 17.740.785 ± 0.3350.0136 ± 0.0059-0.0013 ± 0.03190.837
CLS88.00 ± 35.690.798 ± 0.3090.0264 ± 0.01130.0518 ± 0.02290.988
DLS88.20 ± 22.350.810 ± 0.3570.0269 ± 0.00770.0407 ± 0.01200.952
MFW75.80 ± 56.170.798 ± 0.3340.0228 ± 0.01750.0160 ± 0.04350.979
MSF90.40 ± 44.410.773 ± 0.2940.0263 ± 0.01270.0285 ± 0.03810.956
WGR54.00 ± 61.410.789 ± 0.3510.0161 ± 0.02050.0355 ± 0.04880.934
FIN130.50 ± 50.170.821 ± 0.3540.0403 ± 0.01670.0856 ± 0.03050.971
OUE559.50 ± 159.060.860 ± 0.3920.1812 ± 0.05520.3467 ± 0.06890.713
SOL377.60 ± 75.300.847 ± 0.3850.1204 ± 0.02570.2167 ± 0.02580.595
EFR281.90 ± 155.490.909 ± 0.4490.0965 ± 0.05990.1517 ± 0.07850.937
SFK234.80 ± 81.660.830 ± 0.3550.0734 ± 0.02750.1350 ± 0.05030.956
GOT293.80 ± 85.050.827 ± 0.3580.0915 ± 0.03180.2005 ± 0.04600.817
all143.81 ± 149.000.830 ± 0.3710.0450 ± 0.04950.0835 ± 0.09140.952
p-value2 × 10−163.23 × 10−142 × 10−162 × 10−16/
Note: The significance of differences in ROH statistics between sheep breeds was tested using multivariate analysis of variance in R v4.1.0 [44]. ALS, Altay; BSB, Bashibai; CLS, Cele Black; DLS, Duolang; DPS, Dorper; EFR, East Friesian Dairy; FIN, Finnsheep; GOT, Gotland; HDW, Large-tailed Han; HUS, Hu; MFW, Chinese Merino (fine wool); MSF, Chinese Merino (super-fine wool); OUE, Ouessant; SFK, Suffolk; SOL, Solognote; SSS, Sishui Fur; SXW, Small-tailed Han; TAN, Tan; WDS, Wadi; and WGR, Waggir.
Table 2. List of ROH islands identified in the studied breeds with different traits.
TraitsChromosomeNumber of SNPsStart (bp)End (bp)Number of Genes
Fecundity (European breeds)13568260,516,400261,008,5013
27869125,362,089125,929,3112
24788133,972,981134,262,3530
2258134,368,535134,393,0560
51810116,823,462117,482,8463
10140528,356,52928,915,2466
10341439,546,23140,127,3041
10732440,690,15341,457,0312
10439045,284,98845,892,5720
1012545,893,70845,917,4330
1011,55546,066,65147,479,0083
1190341,691,55141,766,8084
13173651,484,74452,073,5933
1396653,029,76953,185,6431
13372253,185,98753,789,15514
1358353,789,30453,954,9642
14456449,339,95549,705,67122
14230752,590,70352,871,92314
Fecundity (Asian breeds)11264127,784,437128,112,8265
11409245,349,451245,668,6870
14564275,364,067276,000,8266
212,148125,310,139126,205,8923
213,140133,294,917134,500,7124
2476230,125,601230,160,7801
22246234,992,972235,522,24624
4249275,493,73875,983,09017
5552488,822,80389,607,3652
51030116,948,615117,463,1643
619,45286,306,95687,351,7181
648187,513,61587,568,3360
626587,568,65987,587,6630
6455988,034,85488,359,4401
6388389,450,09990,010,9750
62309129,274,460129,779,42820
9285085,450,25886,050,9424
1093908,565,2659,194,0431
10134928,371,80128,939,7076
1051637,585,36337,879,3218
1022337,884,09537,921,9372
10340239,546,88140,127,3041
10570240,239,68141,017,7662
10198043,965,01144,184,3940
1084644,247,49444,336,7640
10354845,367,43945,879,5180
10397946,456,61746,999,9922
1065647,185,53447,220,1620
12298183,917,39584,495,50120
13295151,181,39652,061,6873
13182654,104,79854,613,93928
13267655,938,38956,804,83441
20169254,679,43955,249,6416
Wool27568133,087,142133,777,8505
34451138,495,186138,938,8364
3287138,939,171138,994,7230
31226138,995,024139,160,1393
4278475,441,56975,983,09018
44650110,595,183111,105,9733
7260852,547,86753,015,5097
7265391,870,69292,062,9313
7426192,063,09892,595,74016
8950224,759,80125,746,2664
8430626,532,53827,109,3980
835727,973,98228,000,8080
9703811,737,25612,244,9910
101744,162,92244,165,1230
1068345,412,63645,501,8890
12375845,584,09246,097,35310
1218455,301,86355,390,6583
12465661,885,51362,419,2972
13186254,104,58854,637,80528
14108013,410,34413,668,2061
14263213,894,45814,142,1597
14509414,142,38615,078,39023
14915,078,54015,079,3770
14303015,082,92015,649,58024
1449115,652,18515,715,7411
1551131,112,1831,642,9149
224365220,584750,4485
Body size21254229,295,362229,454,9031
32332146,197,096146,567,91212
3343146,568,243146,632,6433
3992146,714,711146,842,5365
3166146,892,649146,927,8161
3368146,927,959146,985,1363
42033111,126,770111,331,6384
6361224,489,90124,762,9690
6257647,322,44947,501,1030
7703381,665,95282,295,7102
71699,468,63199,556,3370
7161399,603,07899,736,7020
9493388,768,17889,181,4446
1043228,371,26428,503,4463
10300533,282,85533,815,5887
11291928,211,58028,765,97614
11450234,884,45635,764,74055
1176635,764,81636,145,25931
1166736,145,45936,464,03132
1159236,464,53336,602,22511
1122037,050,09837,095,2731
12845276,867,18277,507,53411
12407583,728,66484,298,25118
13120923,661,78723,938,7412
13548936,077,86336,646,9136
13614339,564,44240,266,37419
13658240,266,72740,995,07410
13276340,995,70341,369,0243
1327941,582,31941,607,8380
13382641,608,13542,271,8868
1372445,752,80345,820,7850
13286747,100,99547,377,9990
13240647,378,39047,619,1330
13703447,619,18248,644,66314
13191751,441,81952,093,0353
131452,093,27152,095,6470
13193672,541,47272,890,36612
15360855,819,10756,435,85811
1846419,405,28219,474,3560
20336298,697646,7804
22201425,467,53825,974,81518
2399730,189,19030,308,0042
Disclaimer/Publisher’s Note: The statements, opinions and data contained in all publications are solely those of the individual author(s) and contributor(s) and not of MDPI and/or the editor(s). MDPI and/or the editor(s) disclaim responsibility for any injury to people or property resulting from any ideas, methods, instructions or products referred to in the content.

