Abstract
Background/Objectives: Miscanthus Andersson, a genus of perennial grasses that includes wild relatives of key crop species, remains poorly characterized in terms of genetic diversity and evolutionary relationships. The aim of this study was to elucidate the phylogenetic structure of Miscanthus through comparative genomic analysis of the chloroplast genomes of six Korean species. Methods: Complete chloroplast genomes were assembled and analyzed for six Miscanthus species. Informative nucleotide motifs and their associated gene locations were identified as potential markers, and their phylogenetic relationships with related crops were examined. Results: The chloroplast genomes exhibited a conserved quadripartite structure, with genome sizes and GC contents within typical ranges. Analysis of codon usage showed a preference for A/U-ending codons, consistent with patterns in other angiosperms. Simple sequence repeats and long repeats demonstrated non-random distributions, indicating their value as molecular markers for phylogenetic and population studies. Comparative analyses confirmed structural conservation across Miscanthus species, whereas variation in non-coding regions provided important phylogenetic signals. Phylogenetic reconstruction based on 21 chloroplast genomes revealed four major clades, corroborating previous findings and highlighting complex evolutionary relationships within Miscanthus, including close affinities between African and Himalayan species and the genus Saccharum L. Conclusions: This study provides complete chloroplast genomes of six Miscanthus species, contributing to enhanced understanding of the relationships within the subtribe Saccharinae. The findings support the inclusion of Miscanthus species in the Korea Crop Wild Relatives inventory and highlight their potential as a genetic resource for breeding programs aimed at enhancing crop resilience to environmental stress.
1. Introduction
Agriculture is highly vulnerable to a range of disasters and crises, including climate change, extreme weather conditions, and pest outbreaks. These challenges continue to threaten global food security, underscoring the urgent need for effective resilience strategies, particularly in crop management, to ensure a stable and sustainable food supply that can meet the demands of a growing population [1]. In this regard, Crop Wild Relatives (CWRs)—wild species genetically related to domesticated crops—represent a critical genetic reservoir for enhancing crop traits such as resilience, yield, and adaptability under changing climatic and environmental conditions [2,3,4]. Emerging research continues to highlight the essential role of CWRs in breeding climate-resilient crop varieties [5,6,7,8]. Genetic diversity from CWRs can be introduced into crops, thereby enhancing their ability to cope with future environmental stresses.
The family Poaceae is the fifth largest group of angiosperms and the second largest group of monocots, with approximately 700 genera and between 11,000 and 12,000 species [9,10,11,12]. The genus Miscanthus Andersson is native to East and Southeast Asia, and is primarily distributed in temperate and subtropical regions, showing adaptability to diverse habitats and a survival ability at high altitudes [13,14,15]. Traditionally, the genus has been valued for its domestic uses, including livestock feed, green manure, and roofing material for traditional homes [15]. Furthermore, Miscanthus has recently attracted significant industrial attention owing to its potential in bioenergy production and its ability to enhance agricultural resilience [16,17]. Notably, within the same tribe, Andropogoneae, key crops such as maize (corn), sorghum, and sugarcane highlight the agricultural and industrial significance of this lineage. Nevertheless, the phylogenetic relationships among Miscanthus species remain ambiguous, limiting efforts to systematically harness their genetic diversity.
The structure of the chloroplast genome is generally well conserved across plant species, comprising a circular, double-stranded DNA molecule [18,19]. This genome is typically organized into four distinct regions: a large single-copy (LSC) region of approximately 80–90 kb, a small single-copy (SSC) region ranging from 16 to 27 kb, and a pair of inverted repeat (IR) regions, each measuring approximately 20–28 kb [20,21,22,23]. Owing to its unique characteristics, such as its predominantly maternal inheritance pattern across angiosperms, the chloroplast genome serves as a powerful tool for investigating plant evolutionary history and reconstructing phylogenetic relationships [24,25,26,27,28].
This research focused on constructing and characterizing the chloroplast genomes of Miscanthus species native to South Korea while also updating the Korea Crop Wild Relatives (KCWRs) inventory. Specifically, this study involved the de novo assembly and functional annotation of chloroplast genomes, followed by phylogenetic assessments to investigate both intra-genus relationships and connections with the closely allied taxa. Our findings on the chloroplast genome structure, genetic variability, and phylogenetic relationships in Miscanthus offer valuable information to guide the conservation and utilization of wild relatives of crops.
2. Materials and Methods
2.1. Plant Materials
Among the species of Miscanthus distributed in Korea [29], six species, M. sinensis var. gracillimus, M. sinensis f. chejuensis, M. sacchariflorus, M. sinensis, M. × longiberbis, and M. sinensis, were analyzed in the study (Figure 1, Table 1). Seeds of each species were sown, and young leaves from germinated individuals were collected for analyses. The seeds and DNA have been deposited in the Baekdudaegan National Arboretum Seed Bank and are stored in a deep freezer.
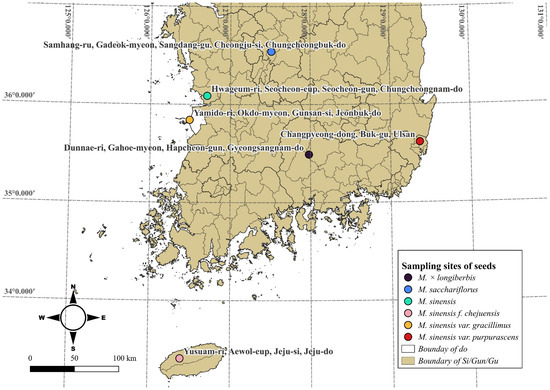
Figure 1.
Miscanthus seed collection sites. Each species is marked in color, and the collection sites are labeled with brief location descriptions.

Table 1.
List of Miscanthus samples and corresponding accession numbers used for chloroplast genome analysis.
2.2. Methods for DNA Isolation and Chloroplast Genome Assembly
Genomic DNA was isolated from plant tissues using the NucleoSpin Plant II Kit (Macherey-Nagel, Duren, Germany) following the manufacturer’s guidelines. The integrity and concentration of the extracted DNA were evaluated using a NanoDrop 2000 spectrophotometer (Thermo, Wilmington, DE, USA) and Qubit 3.0 Fluorimeter (Invitrogen, Carlsbad, CA, USA). Library preparation for paired-end sequencing was carried out with the TruSeq Nano DNA Kit (Illumina, San Diego, CA, USA), and sequencing was performed using the NovaSeq platform. On average, 3.0–3.6 Gb of raw reads were generated per sample (19.7–23.8 million paired-end reads), resulting in more than 100× coverage of the chloroplast genome. The sequencing quality was high, with Q20 values of 97.2–97.9% and Q30 values of 92.2–94.5% across samples. Raw reads were quality-filtered by removing adapter sequences and discarding those with Phred scores below 20. The chloroplast genomes were assembled using CLC Assembly Cell v4.2.1 (CLC Inc., Aarhus, Denmark). Annotation of coding and non-coding regions was performed with GeSeq [30], and annotation errors were manually corrected using Geneious Prime v2025.1.2 (Biomatters Ltd., Auckland, New Zealand) [31]. A circular map of the chloroplast genome was visualized using OGDRAW v1.31. [32]. All resulting chloroplast genome sequences have been deposited in the GenBank databases (NCBI and K-BDS).
2.3. Comprehensive Genome Analysis of Miscanthus Species
The codon usage bias, expressed as Relative Synonymous Codon Usage (RSCU) values, was analyzed using protein-coding sequences in MEGA 12.0.11 [33]. RSCU values provide a measure of codon bias, where values below 1 indicate under-representation, values near 1 suggest random usage, and values above 1 reflect preferential usage. In this study, codons with RSCU < 0.6 were considered extremely underrepresented, whereas those with RSCU > 1.6 were regarded as highly preferred [34,35]. Using MISA-web [36,37] simple sequence repeats (SSRs) were screened under predefined thresholds: 10 copies for mononucleotides, 5 for dinucleotides, 4 for trinucleotides, and 3 for higher-order motifs (tetra- to hexanucleotides). Additionally, REPuter [38] was employed to search for forward (F), palindromic (P), reverse (R), and complementary (C) repeats within a length range of 20–50 bp by applying a Hamming distance threshold of 3 (https://bibiserv.cebitec.uni-bielefeld.de/reputer, accessed on 12 May 2025). In angiosperms, inverted repeats (IR) in chloroplast genomes are highly conserved and play a role in genome stability, with IR boundary expansion and contraction being key mechanisms driving genome size variation [39]. The IR region boundaries across six Miscanthus species were visualized using the IRscope server (https://irscope.shinyapps.io/irapp/, accessed on 14 May 2025) [40]. To identify regions of high nucleotide diversity (π) within the chloroplast genome, we employed DnaSP v5 [41], with a sliding window analysis configured at a 600 bp window size and a 200 bp step size. MAFFT v7.490 [42,43] was used to align the sequences, which were edited in Geneious Prime v2025.1.2 (https://www.geneious.com). This approach effectively facilitated the detection of conserved and variable regions. Divergence among six Miscanthus species was analyzed using the mVISTA tool (http://genome.lbl.gov/vista/mvista/submit.shtml, accessed on 15 May 2025) [44,45]. Using the LAGAN algorithm [46] sequences were aligned against the reference chloroplast genome of Saccharum officinarum (GenBank accession Number: MZ328080).
2.4. Phylogenetic Relationships Among Miscanthus Species
Chloroplast genomes of six Miscanthus species were analyzed, alongside five Saccharum species and two Zea species (included as outgroups), to clarify phylogenetic relationships within Miscanthus. The genomic data were sourced from NCBI GenBank (https://www.ncbi.nlm.nih.gov/, accessed on 26 January 2025). Species categorization (including CWRs, landraces, and cultivated types) was based on GRIN-Global [47]. Using PhyloSuite v1.2.3 [48], we obtained the protein-coding gene sequences required for further analysis. Sequence alignments were generated using MAFFT v7.490 [42,43] and further analyzed using Geneious Prime v2025.1.2 (https://www.geneious.com). A concatenated alignment of all protein-coding genes was constructed and used to generate a phylogenetic tree with the ML method in IQ-TREE [49]. The software selected K3Pu+F+I as the best-fitting model, and node reliability was tested with 1000 ultrafast bootstrap replicates.
3. Results
3.1. Structural and Genomic Characteristics of the Chloroplast Genomes
The complete chloroplast genomes of the six Miscanthus species displayed high levels of conservation in terms of gene content, overall genome length, and GC composition (Figure 2, Table 2). The total genome sizes ranged from 141,313 bp to 141,377 bp. They possessed a quadripartite structure, consisting of LSC regions (83,116–83,182 bp), IR regions (22,798–22,799 bp), and SSC regions (12,557–12,659 bp). The GC content of all chloroplast genomes was 38.4%. The consistent GC content across all species reflects the generally AT-rich composition characteristic of chloroplast genomes. A noticeable increase in GC content, ranging from 43.9% to 44.1%, was observed in the IR region, contrasting with the lower GC contents in the LSC (36.2%) and SSC (32.7–32.8%). This pattern suggests greater stability in the IR region [50].
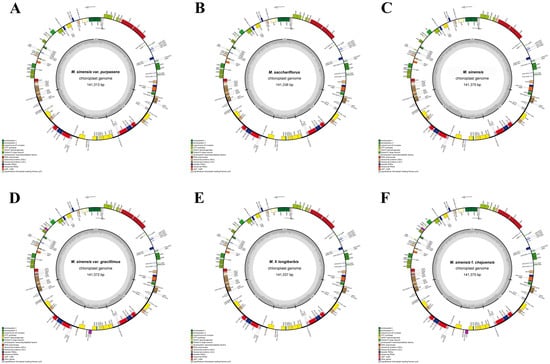
Figure 2.
Circular maps of the complete chloroplast genomes of (A) M. sinensis var. purpurascens, (B) M. sacchariflorus, (C) M. sinensis, (D) M. sinensis var. gracillimus, (E) M. × longiberbis, and (F) M. sinensis f. chejuensis. Functional gene categories are indicated by distinct color codes. Gene transcription directions are represented by arrows, with those positioned on the outer and inner sides of the circular genome map transcribed in the clockwise and counterclockwise directions, respectively.
Table 2.
Overview of the complete chloroplast genomes of six Miscanthus species: (A) M. sinensis var. purpurascens, (B) M. sacchariflorus, (C) M. sinensis, (D) M. sinensis var. gracillimus, (E) M. × longiberbis, and (F) M. sinensis f. chejuensis. Values in parentheses represent the number of distinct genes, with redundant copies (e.g., within IR regions) excluded.
In total, 135 genes were annotated in each genome, comprising 89 protein-coding genes, 38 tRNA genes, and 8 rRNA genes (Table 2 and Table 3). The genes within the chloroplast genome were divided into 18 functional categories. Among these, 10 protein-coding genes (ycf73, ycf2, ycf15, rps7, rps19, rps15, rps12, rpl2m rpl23, and ndhB), 8 tRNA genes (trnAUGC, trnHGUG, trnIGAU, trnLCAA, trnNGUU, trnRACG, trnICAU, and trnVGAC), and 4 rRNA genes (rrn16, rrn23, rrn4.5, and rrn5) were duplicated in the IR regions. The rps12 gene was trans–spliced, with its 5′ exon positioned in the LSC region and its 3′ exon situated in the IR region. The matK gene was located within the intron of trnKUUU.
Table 3.
List of annotated genes in chloroplast genomes of six Miscanthus species.
3.2. Analysis of Relative Synonymous Codon Usage (RSCU) Patterns
For each species, RSCU values were derived based on the chloroplast genome’s protein-coding genes, which included 64 codons representing 21 amino acids (Figure 3). The total codon counts were 18,959 for M. sinensis var. gracillimus, M. sinensis f. chejuensis, and M. sinensis; 18,960 for M. sacchariflorus, and M. × longiberbis; and 18,981 for M. sinensis var. purpurascens. Leucine (Leu), encoded by UUA, UUG, CUU, CUC, CUA, and CUG, was the most abundant amino acid, with 2071–2078 codons (10.87–10.89%). In the six species analyzed, 32 codons had RSCU values higher than 1, and another 32 codons had values lower than 1. The UUA codon had the highest RSCU value at 2.03, whereas the CUG codon had the lowest, ranging from 0.32 to 0.33. Both AUG (Met) and UGC (Trp) displayed an RSCU value of 1, indicating unbiased codon usage. Codons with A or U as the terminal base (GCU, AGA, UUA, UCU, and ACU) exhibited RSCU values exceeding 1.6, indicating high bias. Conversely, 22 codons (GCG, CGC, CGG, AGG, AAC, GAC, UGC, CAG, GAG, GGC, CAC, AUC, CUC, CUG, AAG, CCG, UCG, AGC, ACG, UAC, GUC, and GUG) displayed markedly low biases, with RSCU values under 0.6.
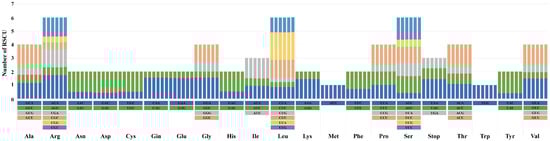
Figure 3.
Relative synonymous codon usage (RSCU) patterns for amino acids encoded by the chloroplast protein-coding genes of six Miscanthus species. Species are presented from left to right as follows: M. × longiberbis, M. sacchariflorus, M. sinensis, M. sinensis f. chejuensis, M. sinensis var. gracillimus, and M. sinensis var. purpurascens.
3.3. Analysis of SSR Motifs and Large Repeats
The presence and distribution of SSRs were analyzed within the chloroplast genomes of six Miscanthus species (Figure 4). Mononucleotide repeats, accounting for 60.5–66.7% of the SSR motifs, ranged from 26 to 31 in number. In total, 5 di-, 1 tri-, 9 tetra-, 1 penta-, and 1 hexanucleotide repeats were found. Notably, the hexanucleotide motif was absent only in M. sinensis var. purpurascens (Figure 4A). In total, 43–48 SSRs were identified, with the lowest number (43) recorded in M. × longiberbis and the highest (48) in M. sinensis var. gracillimus and M. sinensis f. chejuensis. The LSC region exhibited the highest SSR frequency, containing 33–38 SSRs, followed by the SSC region, which contributed 6 SSRs. The IRa and IRb regions displayed relatively low and consistent SSR counts, with 2 SSRs each (Figure 4B). The SSR motifs predominantly consisted of A/T repeats, with the majority of motifs exclusively composed of these bases (Figure 4C).
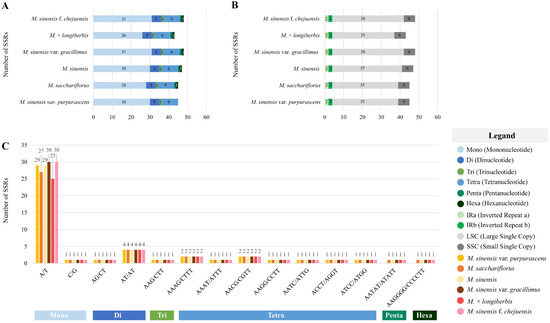
Figure 4.
Distribution and classification of simple sequence repeats (SSRs) in the chloroplast genomes of six Miscanthus species. The x-axis represents SSR types and species, whereas the y-axis indicates SSR counts. (A) Total number and classification of SSR types. (B) Genomic region-specific distribution of SSRs. (C) Relative frequency of SSRs categorized by repeat unit type.
Analysis of long repeat sequences indicated that forward and palindromic repeats were more frequently observed than reverse repeats, whereas no complementary repeats were identified across the six Miscanthus species (Figure 5). Among these long-repeat sequences, the majority were concentrated within the 30–39 bp range, accounting for 59.2% of the total, with 27–29 repeats identified in this size category (Figure 5A). In total, 49 long-repeat sequences were identified across the complete chloroplast genomes of six Miscanthus species, comprising 34–37 forward (F), 10–12 palindromic (P), and 3–5 reverse (R) repeats. Notably, reverse repeats were absent from the genomes of M. sinensis, M. sinensis f. chejuensis, and M. sinensis var. gracillimus (Figure 5B). Further analyses of these repeats could facilitate the development of molecular markers for species identification.
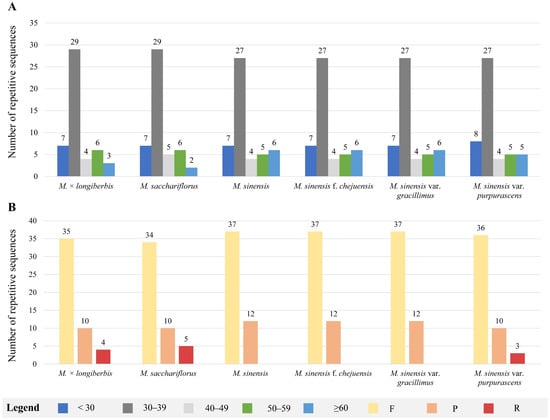
Figure 5.
Distribution of long-repeat sequences identified in the chloroplast genomes of six Miscanthus species. (A) Frequency of repeat types categorized by repeat length. (B) Total counts of each repeat type: forward (F), reverse (R), and palindromic (P) repeats.
3.4. Comparison of Chloroplast Genome Sequences and Assessment of Nucleotide Diversity
IR regions may expand or contract over time, leading to structural alterations in the chloroplast genome, including changes in gene copy number and the formation of pseudogenes at the junction boundaries (Figure 6). These structural variants are often considered valuable markers in evolutionary studies [51,52]. IRscope was employed to investigate the boundary regions and adjacent genes of the chloroplast genomes in six Miscanthus species, with particular attention to the contraction of junction sites. The IR regions among Miscanthus species displayed a high degree of conservation, with lengths ranging narrowly from 22,798 to 22,799 bp. This minimal variation suggests structural stability of the IR regions across the genus. Boundary analysis of the chloroplast genomes revealed that the genes rpl22, rps19, ndhF, ndhH, rps15, and psbA were consistently positioned at the four junction sites: LSC–IRb (JLB), SSC–IRb (JSB), SSC–IRa (JSA), and LSC–IRa (JLA). Notably, ndhF was located across the SSC–IRb boundary. The conserved gene arrangement at these junctions, together with the uniform IR length, reflects the overall structural integrity of the chloroplast genomes within the Miscanthus genus.
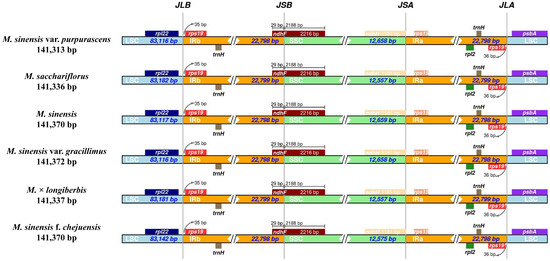
Figure 6.
Comparative visualization of junction boundaries between the LSC, SSC, and IR regions in the chloroplast genomes of Miscanthus species. Genes adjacent to each boundary are illustrated as boxes, with the distances between genes and boundary regions indicated in base pairs.
Several highly variable loci were detected through nucleotide diversity analysis, offering valuable targets for species-level discrimination and evolutionary studies (Figure 7). Nucleotide diversity (π) values within the six Miscanthus species ranged from 0 to 0.015. The analysis primarily focused on intronic regions, where the majority of the observed variability was concentrated. In the LSC and SSC regions, three chloroplast gene regions exhibited high diversity (π > 0.006), comprising trnCGCA, trnLUUA–trnFGAA, and trnLUAG–ccsA. Conversely, no significant diversity (π > 0.006) was detected in the IR regions.
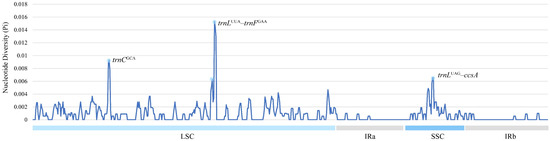
Figure 7.
Nucleotide diversity (π) across the chloroplast genomes of six Miscanthus species, as revealed by sliding window analysis. Nucleotide diversity is plotted on the y-axis, and the x-axis reflects the genomic coordinates.
To assess DNA sequence variability in these species relative to those in other crops, we performed a comparative analysis of the chloroplast genomes from six Miscanthus species using mVISTA, with S. officinarum serving as a reference (Figure 8). Although the coding regions were generally conserved across the six Miscanthus chloroplast genomes, considerable sequence divergence was found in non-coding regions, particularly between trnGGCC-trnGUCC, atpI-atpH, atpA-rps14, and rpl14-rps3. This analysis facilitated a precise examination of sequence variation, revealing minimal variation in chloroplast genes and concentrated variability in non-coding regions.
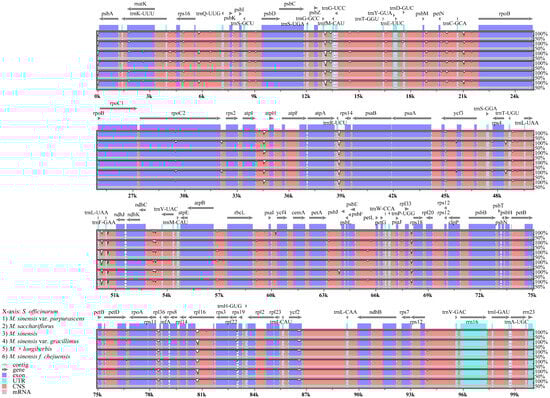
Figure 8.
Comparative analysis of chloroplast genomes from six Miscanthus species using mVISTA, with Saccharum officinarum as the reference. Gray arrows indicate gene orientation and position. Coding regions and conserved non-coding sequences (CNS) are denoted by red, light blue, and blue blocks.
3.5. Phylogenetic Analysis
A maximum likelihood (ML) phylogenetic tree was constructed using 20 complete chloroplast genome sequences, including 13 Miscanthus species—comprising nine CWRs, three landraces, and one modern cultivar—along with five Saccharum L. species (2 CWRs and 3 modern cultivars) and two Zea L. species, to enhance phylogenetic resolution (Figure 9). This analysis was conducted to refine our understanding of relationships within Miscanthus, identify closely related crop taxa, and support the integration of target species into the KCWR inventory. The phylogenetic analysis revealed four major clades with high bootstrap value support (96.7/84, 88.6/78, 100/100, and 99.8/99). M. sinensis var. purpurascens, M. sinensis, M. sinensis var. gracillimus, and M. sinensis f. chejuensis clustered in Clade 3, with a bootstrap support value of 100/100. Meanwhile, M. × longiberbis and M. sacchariflorus were grouped in Clade 4, supported by a bootstrap value of 99.8/99. A notable finding is that certain Miscanthus species formed a distinct clade that was more closely related to the Saccharum clade than to Clades 3–4, which comprised the majority of Miscanthus species.
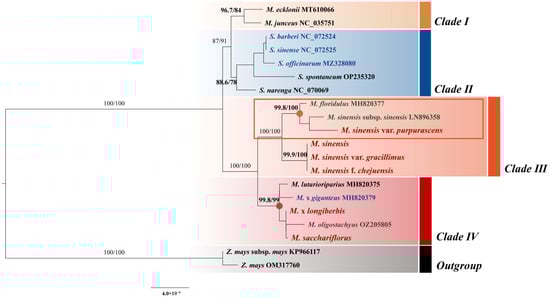
Figure 9.
Maximum likelihood phylogenetic tree based on the complete chloroplast genome sequences of Miscanthus species. Bootstrap support values (based on 1000 replicates) are shown at each node. Tip labels are color-coded to indicate genetic categories: black for CWRs, green for landraces (local traditional varieties), red for the six Miscanthus species analyzed in this study, and blue for modern cultivars, as designated by GRIN–Global. The scale bar represents 0.0004 nucleotide substitutions per site.
4. Discussion
In this study, we successfully assembled and analyzed the complete chloroplast genomes of six Miscanthus species native to Korea, providing a detailed analysis of structural variation, codon usage patterns, SSR distributions, and phylogenetic relationships. Notably, we identified three Miscanthus species (M. sinensis var. gracillimus, M. sinensis f. chejuensis, and M. × longiberbis) that have not yet been registered in the NCBI database. A conserved quadripartite structure—comprising the LSC, SSC, and two IR regions—was observed across all six chloroplast genomes, consistent with the general architecture of land plant chloroplasts. The genome sizes ranged from 141,313 bp to 141,377 bp, with a GC content of 38.4%, which aligns with the typical values reported in other species in the family Poaceae [53,54]. A higher GC content was observed in the IR regions, ranging from 43.9% to 44.1%, compared with that in the LSC and SSC regions. Such enrichment in GC bases is commonly associated with genomic stability. Furthermore, the stable chloroplast genome sizes, which showed only minor variations, indicate a shared evolutionary lineage among these species.
Codon usage analysis of the chloroplast genomes revealed a marked preference for codons ending in A or U, a bias frequently reported in angiosperms [55,56,57]. The preference for A/U–ending codons may enhance the efficiency of gene translation and stabilize the genome by reducing mutations associated with other nucleotide types [58,59]
SSRs—short, repetitive DNA sequences—are widely distributed in the genomes of higher eukaryotes and account or a considerable portion of their non-coding regions [60]. These elements are highly polymorphic and codominant, making them valuable markers in population genetics and phylogenetic research [61,62,63]. In various chloroplast genomes, SSRs are distributed in a non-random manner, predominantly consisting of mononucleotide repeats, with adenine (A) and thymine (T) bases being most common. Long repeat sequences are divided into five groups, ranging from 20 to more than 60 base pairs, as observed in this study. These long repeats may contribute to structural variation within the genome [64,65]. The repetitive sequences discovered in this research may serve as molecular markers for future investigations of the genus Miscanthus. These SSRs could be applied to distinguish closely related Miscanthus species and to support marker-assisted selection in breeding programs, as demonstrated in related crops such as sugarcane [66,67,68]. Thus, the markers identified expand genomic resources and provide practical tools for conservation and crop improvement.
Previous studies [53,69,70,71] have evaluated the evolution of the chloroplast genome structure in Poaceae, showing that the LSC/IR boundary underwent expansion, causing the rps19 and trnH genes to shift into the IR region. The IRb/SSC junction in the six Miscanthus genomes intersected the ndhF gene due to its partial duplication, with both rps19 and ndhF consistently occupying IR boundary positions, reflecting the genomic organization observed in other Poaceae species [53,69,70,71]. Although the expansion and contraction of IR regions are common evolutionary events in plants, contributing to genome evolution and structural diversity, the minimal variation observed among the six Miscanthus species highlights the remarkable conservation of their chloroplast genomes.
Nucleotide diversity (π) analysis highlighted hotspots of sequence variability in the LSC and SSC portions of the chloroplast genome, whereas the IR regions demonstrated little to no genetic divergence. Coding sequences exhibited substantial conservation across species, whereas non-coding regions displayed markedly higher levels of sequence divergence. Collectively, these results highlight the importance of specific regions as potential genetic markers for evolutionary and phylogenetic studies [72,73,74]. The identified polymorphisms contribute to a deeper understanding of Miscanthus chloroplast genome evolution and provide a critical resource for ongoing and future research into the genetic diversity of the genus.
A phylogenetic analysis of 20 chloroplast genomes, including eight Miscanthus species, two Zea species, and five Saccharum species, revealed four major clades with high bootstrap support. These results are consistent with those of previous studies [63], which identified M. sacchariflorus and M. lutarioriparius as the most closely related species to M. sinensis and M. floridulus. Together, they constitute a prominent group, determined by molecular markers from chloroplast genome sequences and ITS regions. These markers have demonstrated efficacy in clarifying phylogenetic relationships within the genus. Supporting evidence for the inferred phylogeny of Miscanthus was also obtained through cytogenetic investigations using fluorescence and comparative genomic in situ hybridization [75]. Molecular and cytogenetic data collectively contribute to a deeper understanding of the evolutionary history of the genus Miscanthus, thereby bolstering the credibility of the reconstructed phylogenetic relationships. Interestingly, certain Miscanthus species formed a distinct clade that was more closely related to the Saccharum clade than to Clades 3 or 4, suggesting complex evolutionary relationships within the genus. These results align with those of previous studies [13], which reported that Miscanthus species originating from eastern and southeastern Asia (M. sinensis, M. sacchariflorus, and M. lutarioriparius) form a monophyletic group.
In contrast, those from Africa and the Himalayas (M. violaceus, M. junceus, and M. sorghum) are more distantly related, indicating biogeographic divergence. This phylogeographic pattern supports the hypothesis that the genus Miscanthus has undergone multiple diversification events associated with geographic isolation and other factors. Although African and Himalayan Miscanthus species occupy more basal positions in the phylogeny, some genetic similarities with the Saccharum lineage have been observed, which may reflect ancient hybridization or reticulate evolution events within the Saccharinae subtribe, as documented in a previous study [76]. Chloroplast data alone cannot fully resolve complex reticulate processes; however, the phylogenetic signals observed in the present study provide indirect evidence of historical gene flow and aid in elucidating broader relationships within the Saccharinae. Future studies incorporating nuclear and mitochondrial data will further refine these evolutionary interpretations [77,78,79].
Furthermore, four Miscanthus species, including three landraces and one modern cultivar, were closely related to M. sacchariflorus, M. sinensis var. purpurascens, and M. × longiberbis. These findings facilitate the identification of closely related crop species and substantially advance efforts to establish the KCWR inventory. Beyond taxonomic clarification, the chloroplast genomes characterized here provide valuable genomic resources that can be directly utilized in future studies. The genomic diversity identified in this study provides a basis for developing molecular markers for stress tolerance and biomass traits [80], which, as noted in previous studies [51,81], demonstrate the utility of chloroplast genome resources in breeding programs and genetic engineering to enhance climate resilience in related crops. In addition to clarifying key aspects of phylogenetic structure and genetic diversity in Miscanthus, this study highlights the importance of this genus for breeding strategies aimed at adapting agriculture to environmental challenges.
5. Conclusions
This study successfully sequenced and characterized the chloroplast genomes of six Miscanthus species native to Korea, expanding genomic resources by including three species not previously registered in public databases. The genomes demonstrated high structural conservation with minimal variation, particularly within coding and IR regions, whereas non-coding regions showed higher variability suitable for genetic marker development. Codon usage bias and SSR distribution patterns were consistent with those observed in other Poaceae members, reflecting evolutionary constraints and genome stability. Phylogenetic analyses revealed four well-supported clades, clarifying the complex evolutionary relationships within Miscanthus. Notably, East Asian species exhibited a close sister-group relationship with the Saccharum genus, whereas African and Himalayan species formed distinct basal clades. This structure is consistent with previous hypotheses of reticulate evolution in the subtribe Saccharinae. These findings provide critical insights into the taxonomy and genetic diversity of Miscanthus, establishing a foundation for future conservation and breeding programs. Although several chloroplast genome studies of Miscanthus have been published previously, Korean taxa remain underrepresented in public genomic databases, have rarely been included in comparative phylogenetic analyses, and largely overlooked in CWR research. In this study, we generated complete chloroplast sequences for six Korean Miscanthus species, including three taxa not previously deposited. By incorporating both previously uncharacterized and newly characterized species, this study expands genomic resources, provides unique insights into germplasm, and directly supports the KCWR inventory, thereby contributing to future crop breeding initiatives.
Author Contributions
Conceptualization, J.E.K. and C.S.N.; methodology, J.E.K.; software, J.E.K.; investigation, G.Y.C., H.J.C., C.-G.J. and H.J.K.; resources, Y.S.K.; data curation, J.E.K.; writing—original draft preparation, J.E.K.; writing—review and editing, J.E.K. and C.S.N.; visualization, J.E.K.; supervision, C.S.N.; project administration, C.S.N.; funding acquisition, C.S.N. All authors have read and agreed to the published version of the manuscript.
Funding
This research was funded by the “R&D Program for Forest Science Technology (Project No. RS-2021-KF001796)” supported by the Korea Forest Service (Korea Forestry Promotion Institute).
Institutional Review Board Statement
Not applicable.
Informed Consent Statement
Not applicable.
Data Availability Statement
All data used in this study are included in the manuscript and have been deposited in NCBI GenBank (https://www.ncbi.nlm.nih.gov/, accessed on 16 September 2025) and K-BDS (https://kbds.re.kr/, accessed on 16 September 2025) under the accession numbers PX334449–PX334454 (NCBI GenBank) and SN01000028–SN01000033 (K-BDS).
Conflicts of Interest
The authors declare no conflicts of interest.
Abbreviations
The following abbreviations are used in this manuscript:
| CWR | crop wild relative |
| LSC | large single-copy |
| IR | inverted repeat |
| RSCU | relative synonymous codon usage |
| SSC | small single-copy |
References
- Markova, G.; Baas, S.; Conforti, P.; Ahmed, S. 2017: The Impact of Disasters and Crises on Agriculture and Food Security; Food and Agriculture Organization of the United Nations (FAO): Rome, Italy, 2018. [Google Scholar]
- Heywood, V.; Casas, A.; Ford-Lloyd, B.; Kell, S.; Maxted, N. Conservation and sustainable use of crop wild relatives. Agric. Ecosyst. Environ. 2007, 121, 245–255. [Google Scholar] [CrossRef]
- Vincent, H.; Wiersema, J.; Kell, S.; Fielder, H.; Dobbie, S.; Castañeda-Álvarez, N.P.; Guarino, L.; Eastwood, R.; Leόn, B.; Maxted, N. A prioritized crop wild relative inventory to help underpin global food security. Biol. Conserv. 2013, 167, 265–275. [Google Scholar] [CrossRef]
- Dempewolf, H.; Baute, G.; Anderson, J.; Kilian, B.; Smith, C.; Guarino, L. Past and future use of wild relatives in crop breeding. Crop Sci. 2017, 57, 1070–1082. [Google Scholar] [CrossRef]
- Nevo, E.; Chen, G. Drought and salt tolerances in wild relatives for wheat and barley improvement. Plant Cell Environ. 2010, 33, 670–685. [Google Scholar] [CrossRef]
- Yan, Z.; Pérez-de-Castro, A.; Díez, M.J.; Hutton, S.F.; Visser, R.G.; Wolters, A.-M.A.; Bai, Y.; Li, J. Resistance to tomato yellow leaf curl virus in tomato germplasm. Front. Plant Sci. 2018, 9, 1198. [Google Scholar] [CrossRef]
- Abdul Aziz, M.; Masmoudi, K. Insights into the transcriptomics of crop wild relatives to unravel the salinity stress adaptive mechanisms. Int. J. Mol. Sci. 2023, 24, 9813. [Google Scholar] [CrossRef]
- El Haddad, N.; Sanchez-Garcia, M.; Visioni, A.; Jilal, A.; El Amil, R.; Sall, A.T.; Lagesse, W.; Kumar, S.; Bassi, F.M. Crop wild relatives crosses: Multi-location assessment in durum wheat, barley, and lentil. Agronomy 2021, 11, 2283. [Google Scholar] [CrossRef]
- Clayton, D.; Renvoize, S. Genera Graminum: Grasses of the World; Royal Botanic Gardens, Kew: London, UK, 1986; Volume 13. [Google Scholar]
- Lee, J.-H.; Kim, K.-J.; Kim, B.-Y.; Kim, Y.-D. Molecular systematics of Poaceae based on eight chloroplast markers, emphasizing the phylogenetic positions of Korean taxa. Korean J. Plant Taxon. 2022, 52, 127–143. [Google Scholar] [CrossRef]
- Watson, L.; Dallwitz, M.J. The Grass Genera of the World; C.A.B. International: Wallingford, UK, 1992. [Google Scholar]
- Soreng, R.J.; Peterson, P.M.; Romaschenko, K.; Davidse, G.; Teisher, J.K.; Clark, L.G.; Barberá, P.; Gillespie, L.J.; Zuloaga, F.O. A worldwide phylogenetic classification of the Poaceae (Gramineae) II: An update and a comparison of two 2015 classifications. J. Syst. Evol. 2017, 55, 259–290. [Google Scholar] [CrossRef]
- Hodkinson, T.R.; Chase, M.W.; Lledó, D.M.; Salamin, N.; Renvoize, S.A. Phylogenetics of Miscanthus, Saccharum and related genera (Saccharinae, Andropogoneae, Poaceae) based on DNA sequences from ITS nuclear ribosomal DNA and plastid trnL intron and trnL-F intergenic spacers. J. Plant Res. 2002, 115, 381–392. [Google Scholar] [CrossRef]
- Heaton, E.A.; Dohleman, F.G.; Miguez, A.F.; Juvik, J.A.; Lozovaya, V.; Widholm, J.; Zabotina, O.A.; Mcisaac, G.F.; David, M.B.; Voigt, T.B. Miscanthus: A promising biomass crop. Adv. Bot. Res. 2010, 56, 75–137. [Google Scholar] [CrossRef]
- Anzoua, K.G.; Yamada, T.; Henry, R.J. Wild Crop Relatives: Genomic and Breeding Resources: Industrial Crops; Springer: Berlin/Heidelberg, Germany, 2011; pp. 157–164. [Google Scholar]
- Lewandowski, I.; Schmidt, U. Nitrogen, energy and land use efficiencies of miscanthus, reed canary grass and triticale as determined by the boundary line approach. Agric. Ecosyst. Environ. 2006, 112, 335–346. [Google Scholar] [CrossRef]
- Clifton-brown, J.C.; Stampfl, P.F.; Jones, M.B. Miscanthus biomass production for energy in Europe and its potential contribution to decreasing fossil fuel carbon emissions. Glob. Change Biol. 2004, 10, 509–518. [Google Scholar] [CrossRef]
- Palmer, J.D. Plastid chromosomes: Structure and evolution. Mol. Biol. Plast. 1991, 5–53. [Google Scholar]
- Raubeson, L.A.; Jansen, R.K. Chloroplast Genomes of Plants; CABI Publishing: Wallingford, UK, 2005; pp. 45–68. [Google Scholar]
- Park, S.; Park, S. Comparative and Adaptive Analyses of the Complete Chloroplast Genome Diversity in Sium serra. Genes 2024, 15, 1567. [Google Scholar] [CrossRef] [PubMed]
- Jansen, R.K.; Raubeson, L.A.; Boore, J.L.; DePamphilis, C.W.; Chumley, T.W.; Haberle, R.C.; Wyman, S.K.; Alverson, A.J.; Peery, R.; Herman, S.J. Methods for obtaining and analyzing whole chloroplast genome sequences. In Methods in Enzymology; Elsevier: Amsterdam, The Netherlands, 2005; Volume 395, pp. 348–384. [Google Scholar]
- Sheng, J.; Yan, M.; Wang, J.; Zhao, L.; Zhou, F.; Hu, Z.; Jin, S.; Diao, Y. The complete chloroplast genome sequences of five Miscanthus species, and comparative analyses with other grass plastomes. Ind. Crops Prod. 2021, 162, 113248. [Google Scholar] [CrossRef]
- Palmer, J.D. Comparative organization of chloroplast genomes. Annu. Rev. Genet. 1985, 19, 325–354. [Google Scholar] [CrossRef]
- Greiner, S.; Sobanski, J.; Bock, R. Why are most organelle genomes transmitted maternally? Bioessays 2015, 37, 80–94. [Google Scholar] [CrossRef]
- Park, H.-S.; Lee, W.K.; Lee, S.-C.; Lee, H.O.; Joh, H.J.; Park, J.Y.; Kim, S.; Song, K.; Yang, T.-J. Inheritance of chloroplast and mitochondrial genomes in cucumber revealed by four reciprocal F1 hybrid combinations. Sci. Rep. 2021, 11, 2506. [Google Scholar] [CrossRef]
- Feng, Z.; Zheng, Y.; Jiang, Y.; Pei, J.; Huang, L. Phylogenetic relationships, selective pressure and molecular markers development of six species in subfamily Polygonoideae based on complete chloroplast genomes. Sci. Rep. 2024, 14, 9783. [Google Scholar] [CrossRef]
- Jiang, L.-Q.; Drew, B.T.; Arthan, W.; Yu, G.-Y.; Wu, H.; Zhao, Y.; Peng, H.; Xiang, C.-L. Comparative plastome analysis of Arundinelleae (Poaceae, Panicoideae), with implications for phylogenetic relationships and plastome evolution. BMC Genom. 2024, 25, 1016. [Google Scholar] [CrossRef]
- Tao, K.; Tang, L.; Luo, Y.; Li, L. Complete chloroplast genome of eight Phaius (Orchidaceae) species from China: Comparative analysis and phylogenetic relationship. BMC Plant Biol. 2025, 25, 37. [Google Scholar] [CrossRef] [PubMed]
- Korea National Arboretum. Checklist of Vascular Plants in Korea; Korea National Arboretum: Pocheon, Republic of Korea, 2017. [Google Scholar]
- Tillich, M.; Lehwark, P.; Pellizzer, T.; Ulbricht-Jones, E.S.; Fischer, A.; Bock, R.; Greiner, S. GeSeq–versatile and accurate annotation of organelle genomes. Nucleic Acids Res. 2017, 45, W6–W11. [Google Scholar] [CrossRef] [PubMed]
- Kearse, M.; Moir, R.; Wilson, A.; Stones-Havas, S.; Cheung, M.; Sturrock, S.; Buxton, S.; Cooper, A.; Markowitz, S.; Duran, C. Geneious Basic: An integrated and extendable desktop software platform for the organization and analysis of sequence data. Bioinformatics 2012, 28, 1647–1649. [Google Scholar] [CrossRef]
- Greiner, S.; Lehwark, P.; Bock, R. OrganellarGenomeDRAW (OGDRAW) version 1.3. 1: Expanded toolkit for the graphical visualization of organellar genomes. Nucleic Acids Res. 2019, 47, W59–W64. [Google Scholar] [CrossRef] [PubMed]
- Kumar, S.; Stecher, G.; Suleski, M.; Sanderford, M.; Sharma, S.; Tamura, K. MEGA12: Molecular Evolutionary Genetic Analysis version 12 for adaptive and green computing. Mol. Biol. Evol. 2024, 41, msae263. [Google Scholar] [CrossRef]
- Xiao, M.; Hu, X.; Li, Y.; Liu, Q.; Shen, S.; Jiang, T.; Zhang, L.; Zhou, Y.; Li, Y.; Luo, X. Comparative analysis of codon usage patterns in the chloroplast genomes of nine forage legumes. Physiol. Mol. Biol. Plants 2024, 30, 153–166. [Google Scholar] [CrossRef]
- Wong, E.H.; Smith, D.K.; Rabadan, R.; Peiris, M.; Poon, L.L. Codon usage bias and the evolution of influenza A viruses. Codon Usage Biases of Influenza Virus. BMC Evol. Biol. 2010, 10, 253. [Google Scholar] [CrossRef]
- Beier, S.; Thiel, T.; Münch, T.; Scholz, U.; Mascher, M. MISA-web: A web server for microsatellite prediction. Bioinformatics 2017, 33, 2583–2585. [Google Scholar] [CrossRef]
- Thiel, T.; Michalek, W.; Varshney, R.; Graner, A. Exploiting EST databases for the development and characterization of gene-derived SSR-markers in barley (Hordeum vulgare L.). Theor. Appl. Genet. 2003, 106, 411–422. [Google Scholar] [CrossRef]
- Kurtz, S.; Choudhuri, J.V.; Ohlebusch, E.; Schleiermacher, C.; Stoye, J.; Giegerich, R. REPuter: The manifold applications of repeat analysis on a genomic scale. Nucleic Acids Res. 2001, 29, 4633–4642. [Google Scholar] [CrossRef] [PubMed]
- Palmer, J.D.; Thompson, W.F. Chloroplast DNA rearrangements are more frequent when a large inverted repeat sequence is lost. Cell 1982, 29, 537–550. [Google Scholar] [CrossRef] [PubMed]
- Amiryousefi, A.; Hyvönen, J.; Poczai, P. IRscope: An online program to visualize the junction sites of chloroplast genomes. Bioinformatics 2018, 34, 3030–3031. [Google Scholar] [CrossRef] [PubMed]
- Rozas, J.; Ferrer-Mata, A.; Sánchez-DelBarrio, J.C.; Guirao-Rico, S.; Librado, P.; Ramos-Onsins, S.E.; Sánchez-Gracia, A. DnaSP 6: DNA sequence polymorphism analysis of large data sets. Mol. Biol. Evol. 2017, 34, 3299–3302. [Google Scholar] [CrossRef]
- Katoh, K.; Misawa, K.; Kuma, K.i.; Miyata, T. MAFFT: A novel method for rapid multiple sequence alignment based on fast Fourier transform. Nucleic Acids Res. 2002, 30, 3059–3066. [Google Scholar] [CrossRef]
- Katoh, K.; Standley, D.M. MAFFT Multiple Sequence Alignment Software Version 7: Improvements in Performance and Usability. Mol. Biol. Evol. 2013, 30, 772–780. [Google Scholar] [CrossRef]
- Mayor, C.; Brudno, M.; Schwartz, J.R.; Poliakov, A.; Rubin, E.M.; Frazer, K.A.; Pachter, L.S.; Dubchak, I. VISTA: Visualizing global DNA sequence alignments of arbitrary length. Bioinformatics 2000, 16, 1046–1047. [Google Scholar] [CrossRef]
- Frazer, K.A.; Pachter, L.; Poliakov, A.; Rubin, E.M.; Dubchak, I. VISTA: Computational tools for comparative genomics. Nucleic Acids Res. 2004, 32, W273–W279. [Google Scholar] [CrossRef]
- Brudno, M.; Do, C.B.; Cooper, G.M.; Kim, M.F.; Davydov, E.; Green, E.D.; Sidow, A.; Batzoglou, S.; Program, N.C.S. LAGAN and Multi-LAGAN: Efficient tools for large-scale multiple alignment of genomic DNA. Genome Res. 2003, 13, 721–731. [Google Scholar] [CrossRef]
- Postman, J.; Hummer, K.; Ayala-Silva, T.; Bretting, P.; Franko, T.; Kinard, G.; Bohning, M.; Emberland, G.; Sinnott, Q.; Mackay, M. GRIN-Global: An international project to develop a global plant genebank information management system. In Proceedings of the International Symposium on Molecular Markers in Horticulture 859, Corvallis, ON, USA, 29 July–1 August 2009; pp. 49–55. [Google Scholar]
- Zhang, D.; Gao, F.; Jakovlić, I.; Zou, H.; Zhang, J.; Li, W.X.; Wang, G.T. PhyloSuite: An integrated and scalable desktop platform for streamlined molecular sequence data management and evolutionary phylogenetics studies. Mol. Ecol. Resour. 2020, 20, 348–355. [Google Scholar] [CrossRef]
- Nguyen, L.-T.; Schmidt, H.A.; Von Haeseler, A.; Minh, B.Q. IQ-TREE: A fast and effective stochastic algorithm for estimating maximum-likelihood phylogenies. Mol. Biol. Evol. 2015, 32, 268–274. [Google Scholar] [CrossRef]
- Cui, M.; Liu, C.; Yang, X.; Li, M.; Liu, L.; Jia, K.; Li, W. Comparative and Phylogenetic Analysis of the Chloroplast Genomes of Four Wild Species of the Genus Prunus. Genes 2025, 16, 239. [Google Scholar] [CrossRef]
- Daniell, H.; Lin, C.-S.; Yu, M.; Chang, W.-J. Chloroplast genomes: Diversity, evolution, and applications in genetic engineering. Genome Biol. 2016, 17, 1–29. [Google Scholar] [CrossRef] [PubMed]
- Yan, K.; Lu, X.; Li, W.; Sun, C.; Zhou, X.; Wang, Y. Chloroplast Genome Diversity and Molecular Evolution in Hypericaceae: New Insights from Three Hypericum Species. Int. J. Mol. Sci. 2025, 26, 323. [Google Scholar] [CrossRef] [PubMed]
- Li, S.; Tian, C.; Hu, H.; Yang, Y.; Ma, H.; Liu, Q.; Liu, L.; Li, Z.; Wu, Z. Characterization and Comparative Analysis of Complete Chloroplast Genomes of Four Bromus (Poaceae, Bromeae) Species. Genes 2024, 15, 815. [Google Scholar] [CrossRef] [PubMed]
- Skuza, L.; Androsiuk, P.; Gastineau, R.; Achrem, M.; Paukszto, Ł.; Jastrzębski, J.P. The First Complete Chloroplast Genome Sequence of Secale strictum subsp. africanum Stapf (Poaceae), the Putative Ancestor of the Genus Secale. Curr. Issues Mol. Biol. 2025, 47, 64. [Google Scholar] [CrossRef]
- Yang, Q.; Xin, C.; Xiao, Q.-S.; Lin, Y.-T.; Li, L.; Zhao, J.-L. Codon usage bias in chloroplast genes implicate adaptive evolution of four ginger species. Front. Plant Sci. 2023, 14, 1304264. [Google Scholar] [CrossRef]
- Shen, L.; Chen, S.; Liang, M.; Qu, S.; Feng, S.; Wang, D.; Wang, G. Comparative analysis of codon usage bias in chloroplast genomes of ten medicinal species of Rutaceae. BMC Plant Biol. 2024, 24, 424. [Google Scholar] [CrossRef]
- Geng, X.; Huang, N.; Zhu, Y.; Qin, L.; Hui, L. Codon usage bias analysis of the chloroplast genome of cassava. S. Afr. J. Bot. 2022, 151, 970–975. [Google Scholar] [CrossRef]
- Altuvia, S.; Zhang, A.; Argaman, L.; Tiwari, A.; Storz, G. The Escherichia coli OxyS regulatory RNA represses fhlA translation by blocking ribosome binding. EMBO J. 1998, 17, 6069–6075. [Google Scholar] [CrossRef]
- Kinkar, E.; Kinkar, A.; Saleh, M. AU richness within the 5′ coding region of the Escherichia coli heat-stable enterotoxin b MRNA affects toxin secretion. Heliyon 2020, 6, e05330. [Google Scholar] [CrossRef]
- Mason, A.S. SSR Genotyping; Springer: New York, NY, USA, 2015; pp. 77–89. [Google Scholar]
- Ali, A.; Pan, Y.-B.; Wang, Q.-N.; Wang, J.-D.; Chen, J.-L.; Gao, S.-J. Genetic diversity and population structure analysis of Saccharum and Erianthus genera using microsatellite (SSR) markers. Sci. Rep. 2019, 9, 395. [Google Scholar] [CrossRef]
- Singh, R.B.; Mahenderakar, M.D.; Jugran, A.K.; Singh, R.K.; Srivastava, R.K. Assessing genetic diversity and population structure of sugarcane cultivars, progenitor species and genera using microsatellite (SSR) markers. Gene 2020, 753, 144800. [Google Scholar] [CrossRef]
- Fu, T.; Lu, Y.; Xiao, L.; Xue, S.; Yi, Z.; Li, M.; Hou, W. Phylogenetic analysis of the genus Miscanthus and its relative genera (Poaceae) in China. Ind. Crops Prod. 2023, 192, 116113. [Google Scholar] [CrossRef]
- Weng, M.L.; Ruhlman, T.A.; Jansen, R.K. Expansion of inverted repeat does not decrease substitution rates in Pelargonium plastid genomes. New Phytol. 2017, 214, 842–851. [Google Scholar] [CrossRef] [PubMed]
- Xu, S.; Teng, K.; Zhang, H.; Gao, K.; Wu, J.; Duan, L.; Yue, Y.; Fan, X. Chloroplast genomes of four Carex species: Long repetitive sequences trigger dramatic changes in chloroplast genome structure. Front. Plant Sci. 2023, 14, 1100876. [Google Scholar] [CrossRef] [PubMed]
- Jiang, H.; Waseem, M.; Wang, Y.; Basharat, S.; Zhang, X.; Li, Y.; Liu, P. Development of simple sequence repeat markers for sugarcane from data mining of expressed sequence tags. Front. Plant Sci. 2023, 14, 1199210. [Google Scholar] [CrossRef]
- Yook, M.J.; Lim, S.-H.; Song, J.-S.; Kim, J.-W.; Zhang, C.-J.; Lee, E.J.; Ibaragi, Y.; Lee, G.-J.; Nah, G.; Kim, D.-S. Assessment of genetic diversity of Korean Miscanthus using morphological traits and SSR markers. Biomass Bioenergy 2014, 66, 81–92. [Google Scholar] [CrossRef]
- Ahmad, A.; Wang, J.-D.; Pan, Y.-B.; Sharif, R.; Gao, S.-J. Development and use of simple sequence repeats (SSRs) markers for sugarcane breeding and genetic studies. Agronomy 2018, 8, 260. [Google Scholar] [CrossRef]
- Liu, K.; Wang, R.; Guo, X.-X.; Zhang, X.-J.; Qu, X.-J.; Fan, S.-J. Comparative and phylogenetic analysis of complete chloroplast genomes in Eragrostideae (Chloridoideae, Poaceae). Plants 2021, 10, 109. [Google Scholar] [CrossRef]
- Huang, Y.-Y.; Cho, S.-T.; Haryono, M.; Kuo, C.-H. Complete chloroplast genome sequence of common bermudagrass (Cynodon dactylon (L.) Pers.) and comparative analysis within the family Poaceae. PLoS ONE 2017, 12, e0179055. [Google Scholar] [CrossRef]
- Somaratne, Y.; Guan, D.-L.; Abbood, N.N.; Zhao, L.; Wang, W.-Q.; Xu, S.-Q. Comparison of the complete Eragrostis pilosa chloroplast genome with its relatives in Eragrostideae (Chloridoideae; Poaceae). Plants 2019, 8, 485. [Google Scholar] [CrossRef] [PubMed]
- Akhunov, E.D.; Akhunova, A.R.; Anderson, O.D.; Anderson, J.A.; Blake, N.; Clegg, M.T.; Coleman-Derr, D.; Conley, E.J.; Crossman, C.C.; Deal, K.R. Nucleotide diversity maps reveal variation in diversity among wheat genomes and chromosomes. BMC Genom. 2010, 11, 702. [Google Scholar] [CrossRef] [PubMed]
- Choi, S.-J.; Kim, Y.; Choi, C. Chloroplast genome-based hypervariable markers for rapid authentication of six Korean Pyropia species. Diversity 2019, 11, 220. [Google Scholar] [CrossRef]
- Dong, W.; Liu, J.; Yu, J.; Wang, L.; Zhou, S. Highly variable chloroplast markers for evaluating plant phylogeny at low taxonomic levels and for DNA barcoding. PLoS ONE 2012, 7, e35071. [Google Scholar] [CrossRef]
- Tang, Y.-M.; Xiao, L.; Iqbal, Y.; Liao, J.-F.; Xiao, L.-Q.; Yi, Z.-L.; She, C.-W. Molecular cytogenetic characterization and phylogenetic analysis of four Miscanthus species (Poaceae). Comp. Cytogenet. 2019, 13, 211. [Google Scholar] [CrossRef]
- Kim, C.; Wang, X.; Lee, T.-H.; Jakob, K.; Lee, G.-J.; Paterson, A.H. Comparative analysis of Miscanthus and Saccharum reveals a shared whole-genome duplication but different evolutionary fates. Plant Cell 2014, 26, 2420–2429. [Google Scholar] [CrossRef]
- Chen, K.; Liu, Y.-C.; Huang, Y.; Wu, X.-K.; Ma, H.-Y.; Peng, H.; Li, D.-Z.; Ma, P.-F. Reassessing the phylogenetic relationships of Pseudosorghum and Saccharinae (Poaceae) using plastome and nuclear ribosomal sequences. Plant Divers. 2025, 47, 382–393. [Google Scholar] [CrossRef]
- Mason-Gamer, R.J.; White, D.M. The phylogeny of the Triticeae: Resolution and phylogenetic conflict based on genomewide nuclear loci. Am. J. Bot. 2024, 111, e16404. [Google Scholar] [CrossRef]
- Lloyd Evans, D.; Joshi, S.V.; Wang, J. Whole chloroplast genome and gene locus phylogenies reveal the taxonomic placement and relationship of Tripidium (Panicoideae: Andropogoneae) to sugarcane. BMC Evol. Biol. 2019, 19, 33. [Google Scholar] [CrossRef]
- Kumar, A.; Rajasekaran, R.; Krishnamoorthy, I.; Alagarswamy, S.; Chandrakumar, K.; Pulapet, S.; Markkandan, K.; Kanagarajan, S.; Narayanan, M.B. Comparative chloroplast genomics of wild-type Panicum miliaceum cv. ATL1 and its M4 mutant line: Insights for molecular breeding applications. BMC Plant Biol. 2025, 25, 1023. [Google Scholar] [CrossRef]
- Brozynska, M.; Furtado, A.; Henry, R.J. Genomics of crop wild relatives: Expanding the gene pool for crop improvement. Plant Biotechnol. J. 2016, 14, 1070–1085. [Google Scholar] [CrossRef]
Disclaimer/Publisher’s Note: The statements, opinions and data contained in all publications are solely those of the individual author(s) and contributor(s) and not of MDPI and/or the editor(s). MDPI and/or the editor(s) disclaim responsibility for any injury to people or property resulting from any ideas, methods, instructions or products referred to in the content. |
© 2025 by the authors. Licensee MDPI, Basel, Switzerland. This article is an open access article distributed under the terms and conditions of the Creative Commons Attribution (CC BY) license (https://creativecommons.org/licenses/by/4.0/).