Article

Genetic Heterogeneity in Cowpea Genotypes (Vigna unguiculata L. Walp) Using DArTseq (GBS)-Derived Single Nucleotide Polymorphisms

by
Goitsemang Mahlomola Hendry Dikane
and
Moosa Mahmood Sedibe
*
Department of Agriculture, Faculty of Health and Environmental Sciences, Central University of Technology, Private Bag x20529, Bloemfontein 9301, South Africa
*
Author to whom correspondence should be addressed.
Genes 2024, 15(6), 764; https://doi.org/10.3390/genes15060764
Submission received: 15 May 2024 / Revised: 31 May 2024 / Accepted: 7 June 2024 / Published: 11 June 2024
(This article belongs to the Special Issue Genetics and Breeding of Legume Crops)

Abstract

:
Cowpeas (Vigna unguiculata L. Walp) have been credible constituents of nutritious food and forage in human and animal diets since the Neolithic era. The modern technique of Diversity Array Technology (DArTseq) is both cost-effective and rapid in producing thousands of high-throughputs, genotyped, single nucleotide polymorphisms (SNPs) in wide-genomic analyses of genetic diversity. The aim of this study was to assess the heterogeneity in cowpea genotypes using DArTseq-derived SNPs. A total of 92 cowpea genotypes were selected, and their fourteen-day-old leaves were freeze-dried for five days. DNA was extracted using the CTAB protocol, genotyped using DArTseq, and analysed using DArTsoft14. A total of 33,920 DArTseq-derived SNPs were recalled for filtering analysis, with a final total of 16,960 SNPs. The analyses were computed using vcfR, poppr, and ape in R Studio v1.2.5001-3 software. The heatmap revealed that the TVU 9596 (SB26), Orelu (SB72), 90K-284-2 (SB55), RV 403 (SB17), and RV 498 (SB16) genotypes were heterogenous. The mean values for polymorphic information content, observed heterozygosity, expected heterozygosity, major allele frequency, and the inbreeding coefficient were 0.345, 0.386, 0.345, 0.729, and 0.113, respectively. Moreover, they validated the diversity of the evaluated cowpea genotypes, which could be used for potential breeding programmes and management of cowpea germplasm.

1. Introduction

Cowpea (Vigna unguiculata (L.) Walp.) is a pulse crop grown in the wet and dry agro-ecologies of the tropics, primarily where there is a lack of protein sources for human consumption [1]. It is a source of inexpensive protein, vitamins, and minerals in both rural and urban areas and is a meat protein substitute that is rich in stable carbohydrates [2]. The bulk producer of cowpea grains in sub-Saharan Africa is Nigeria, with approximately 3.6 million metric tons produced in 2021, while consuming more than 3.6 million metric tons [3]. In South Africa, smallholder farmers produce a yield of less than 500 kg per hectare for subsistence demands [2]. The FAO [3] reported a production of approximately 4.87 thousand metric tons in South Africa in 2021.
The productivity of cowpeas (mainly cultivated in semi-arid tropics) may be impeded by irregular rainfall patterns, despite being the most drought-tolerant crop [1]. Heat can severely affect the yield of sensitive varieties because of poor pollen development, which causes flower abortion when temperatures reach 35 °C at night and results in poor seed and pod set [4]. Production is also hampered by soils that lack organic matter and have low phosphorus levels [5].
Cowpeas contain phenolic acids, flavonoids, and tannins, which carry bioactive antioxidant, anti-inflammatory, and anti-carcinogenic compounds that provide health benefits to humans and animals [4]. The use of flavonoids and tannin-rich forages has yielded improved ruminant health and productivity through increased resistance to gastrointestinal nematodes, reduced bloating, and improved nutrition via the presence of high-quality proteins in the small intestines [4]. Cowpea seeds are also said to have cardio-protective potency effects and prevent cardiovascular diseases [4]. Infused seeds treat amenorrhea when taken orally, and, according to the indigenous people of South Africa, crushed roots (when eaten with porridge) are believed to treat painful menstruation, epilepsy, and chest pain [4].
Modern DNA marker technology has been applied to cowpea research programmes for the molecular classification of germplasm, genetic development, and quantitative trait loci (QTL) mapping [6]. Forty-four genotypes from four different subgenera of the genus Vigna have been classed using restriction fragment length polymorphism (RFLP) markers [6]. Both wild and cultivated relatives have been further genetically classed for diversity studies using the following markers: random amplified polymorphic DNA (RAPD), inter-simple sequence repeats (ISSRs), amplified fragment length polymorphisms (AFLPs), and simple sequence repeats (SSRs) [6]. Landraces from across the globe and African wild ancestral cowpeas have been collected and genotyped using 1200 single nucleotide polymorphism (SNP) markers to reveal and class gene pools [6]. Recently, SNPs have been discovered with next-generation sequencing (NGS) technologies using genotyping-by-sequencing (GBS) to appropriate genetic diversity, phylogenetic interactions, and population structures [6].
More recently, a high-throughput GBS technology platform known as Diversity Array Technology sequencing (DArTseq) has been used to identify SNPs [7]. It enables high-throughput, whole-genome profiling of crops, without requiring previous DNA sequence information, by using microarray hybridisations that detect present and absent individual fragments in the genomic profile [7]. DArTseq allows for the selection of appropriate complexity-reduction methods for each organism, application, and selected genome assays and has been used for the molecular analyses of the large garlic germplasm bank [8]. Identification of new gene sources for the development of better-performing cowpea breeding lines would require the use of DArTseq molecular screening of existing germplasm and improve breeding lines that are currently available. The main objectives of this study were to assess the genetic diversity of select cowpea genotypes using DArTseq (SNPs) and to identify heterogeneous genotypes and their genomic profiles that could be used for breeding programmes and crop improvements.

2. Materials and Methods

2.1. Plant Material and Sampling Procedure

Ninety-two genotypes that are commonly used in Nigeria and South Africa for breeding programmes based on their yield potential, seed colour, germination period, and abiotic and biotic stress performance were selected from the germplasm collection at the Agricultural Research Council-Grain Crops (ARC-GC). Four seeds from each cowpea genotype were planted using potting soil and covered by a thin layer of vermiculite to retain moisture in a 200 × 5 cm2 pot. The pots were labelled with their genotypes and placed in a greenhouse during the autumn season at the ARC-GC, Potchefstroom, South Africa. Minimum temperatures ranged from 8 °C to 14 °C and the maximum temperatures ranged from 20 °C to 28 °C in a glasshouse. After 13 days of propagation, young trifoliate, fresh, and succulent leaves were excised from four plants and bulked into a single sample from each genotype, totalling to 368 plants. The leaf samples were placed in sterile centrifuge tubes and freeze-dried at −21 °C for five days using a freeze-drying machine. Leaf samples were labelled with their corresponding genotype sample code (Table 1), stored at −81 °C for 10 days, and sent to the Integrated Genotyping Service and Support (IGSS), Bioscience Eastern and Central Africa Hub-International Livestock Research Institute (BecA-ILRI), Nairobi, Kenya, for DNA extraction, DArT sequencing, and SNP analysis.

2.2. DNA Extraction

DNA extraction and sequencing were performed using the DArTseq™ protocol (Diversity Arrays Technology Pty Ltd., Canberra, Australia). Approximately 1 g of young leaf tissue from each accession was used for genomic DNA extraction. Genomic DNA was isolated from frozen leaves using a modified cetyltrimethyl ammonium bromide (CTAB)/chloroform/isoamylalcohol method [9]. Frozen leaf tissue was ground and mixed with 2% pre-warmed (60 °C) CTAB isolation buffer containing 1.4 M NaCl, 100 mM Tris pH 8.0, and 20 mM EDTA (Sigma, Saint Louis, MO, USA). The mixture was then transferred to a 2 mL microcentrifuge tube and incubated at 60 °C for one hour. DNA was extracted once with chloroform–isoamyl alcohol (Chl/IAA, 24:1) (Sigma, Saint Louis, MO, USA) and precipitated using two volumes of isopropanol. The obtained pellet was washed with 70% EtOH, dried and dissolved in 100 µL TE buffer with 50 µg/mL RNAse A (Sigma, Saint Louis, MO, USA). The extracted DNA was quantified using 0.8% agarose gel electrophoresis, which was adjusted to 50 ng/μL for DArT and SNP genotyping.

2.3. DArTseq Analysis

DNA was processed in digestion/ligation reactions as reported by Kilian [10] by replacing a single PstI-compatible adaptor with two different adaptors corresponding to two different restriction enzymes (REs) as follows: PstI- and SphI-compatible adaptors. The PstI-compatible adapter was designed to incorporate an Illumina flow-cell attachment sequence with staggered sequences of varying length barcode regions, like the sequence reported by Elshire [11]. The reverse adapter contained a flow-cell attachment region with an SphI-compatible overhang sequence. Only mixed fragments (PstI-SphI) were effectively amplified in 30 rounds of PCR using the following reaction conditions: 94 °C for 1 min, then 30 cycles at 94 °C for 20 s, 58 °C for 30 s, 72 °C for 45 s, and 72 °C for 7 min. Following PCR, equimolar amounts of amplification products from each sample of the 96-well microtiter plate were bulked and applied to a c-Bot (Illumina) bridge PCR followed by sequencing on Illumina Hiseq2500 (Illumina, San Diego, CA, USA). The sequencing (single read) was run for 77 cycles.
Sequences generated from every lane were processed using proprietary DArT analytical pipelines (PLs). In the primary pipeline analysis, fragments of poor-quality sequences with reproducibility below 90% and a read depth lower than 3.5 for SNPs or 5 for the presence or absence markers were filtered out. More stringent selection criteria were applied to the barcode region compared with the remainder of the sequences. The assignments of the sequences to specific samples carried within the barcode split step were extremely reliable [12]. No samples were dropped because of low coverage across loci; however, individual sequences were removed if they did not meet the above criteria. Approximately 2.5 million sequences per barcode/sample were identified and used in marker calling. The average browse depth across loci was 9.2 reads per individual per locus for reference alleles and 6.5 for SNP alleles. Finally, identical sequences were collapsed into fastqcoll files. The fastqcoll files were groomed using DArT PL’s proprietary algorithm, which corrects a low-quality base from a singleton tag into a correct base using collapsed tags with multiple members as a template. The groomed fastqcoll files were used in the secondary pipeline for DArT PL’s proprietary SNP and SilicoDArT (presence/absence of restriction fragments in representation; PA markers) calling algorithms using DArTsoft14 (Diversity Arrays Technology Pty Ltd., Canberra, Australia). Two types of DArTseq markers were scored, SilicoDArT markers and SNP markers, which were both scored in a binary fashion for presence/absence (1 and 0, respectively) of the restriction fragment with the marker sequence as the genomic representation of the sample. Both SilicoDArT and SNP markers were aligned to the reference genomes of Vunguiculata_469_v1.0 to identify chromosome positions.

2.4. SNP Calling

SNP calling was conducted for all tags from all libraries enclosed within the DArTsoft14 analysis and clustered using DArT PL’s C++ algorithm program at a brink distance of 3. Parsing of the clusters into separate SNP loci was completed by employing a technique called the balance of read counts for the allelic pairs [11]. Additional choice criteria were further added to the algorithm program and supported by an analysis of roughly 1000 controlled cross-populations. Testing for deviations from the Hardy–Weinberg equilibrium of alleles in these populations was conducted to facilitate the selection of technical parameters to effectively discriminate true allelic variants from paralogous sequences. In addition, multiple samples were processed from the DNA to allelic calls as technical replicates and scoring consistency was used as the main selection criteria for high-quality/low-error rate markers. Calling quality was assured by a high average browse depth per locus (the average across all markers was over 30 reads/locus), and DNA was diluted to 50 ng/µL for the GBS analysis [12].

2.5. Data Analysis

Statistical R Studio software (v1.2.5001-3) packages, including vcfR, poppr, ape, tidyr, and ggplot, were used to generate the unweighted pair group method with arithmetic mean (UPGMA) dendrogram, principal component analysis, and a hierarchical heatmap. All genetic parameters, including microsatellite loci scoring, were calculated using R Studio (R software version 3.4) for each locus allele frequency (MAF), heterozygosity (observed; Ho, and expected; He), polymorphic information content (PIC), and inbreeding coefficient (FIS) [12].

3. Results

Ninety-two cowpea genotypes were sequenced using SilicoDArT markers (indicating present/absent fragments in DArT genomic representations) and SNP data. A total of 33,920 DArTseq-derived SNPs were recalled for analysis, with only 16,960 reserved for further computed analyses.

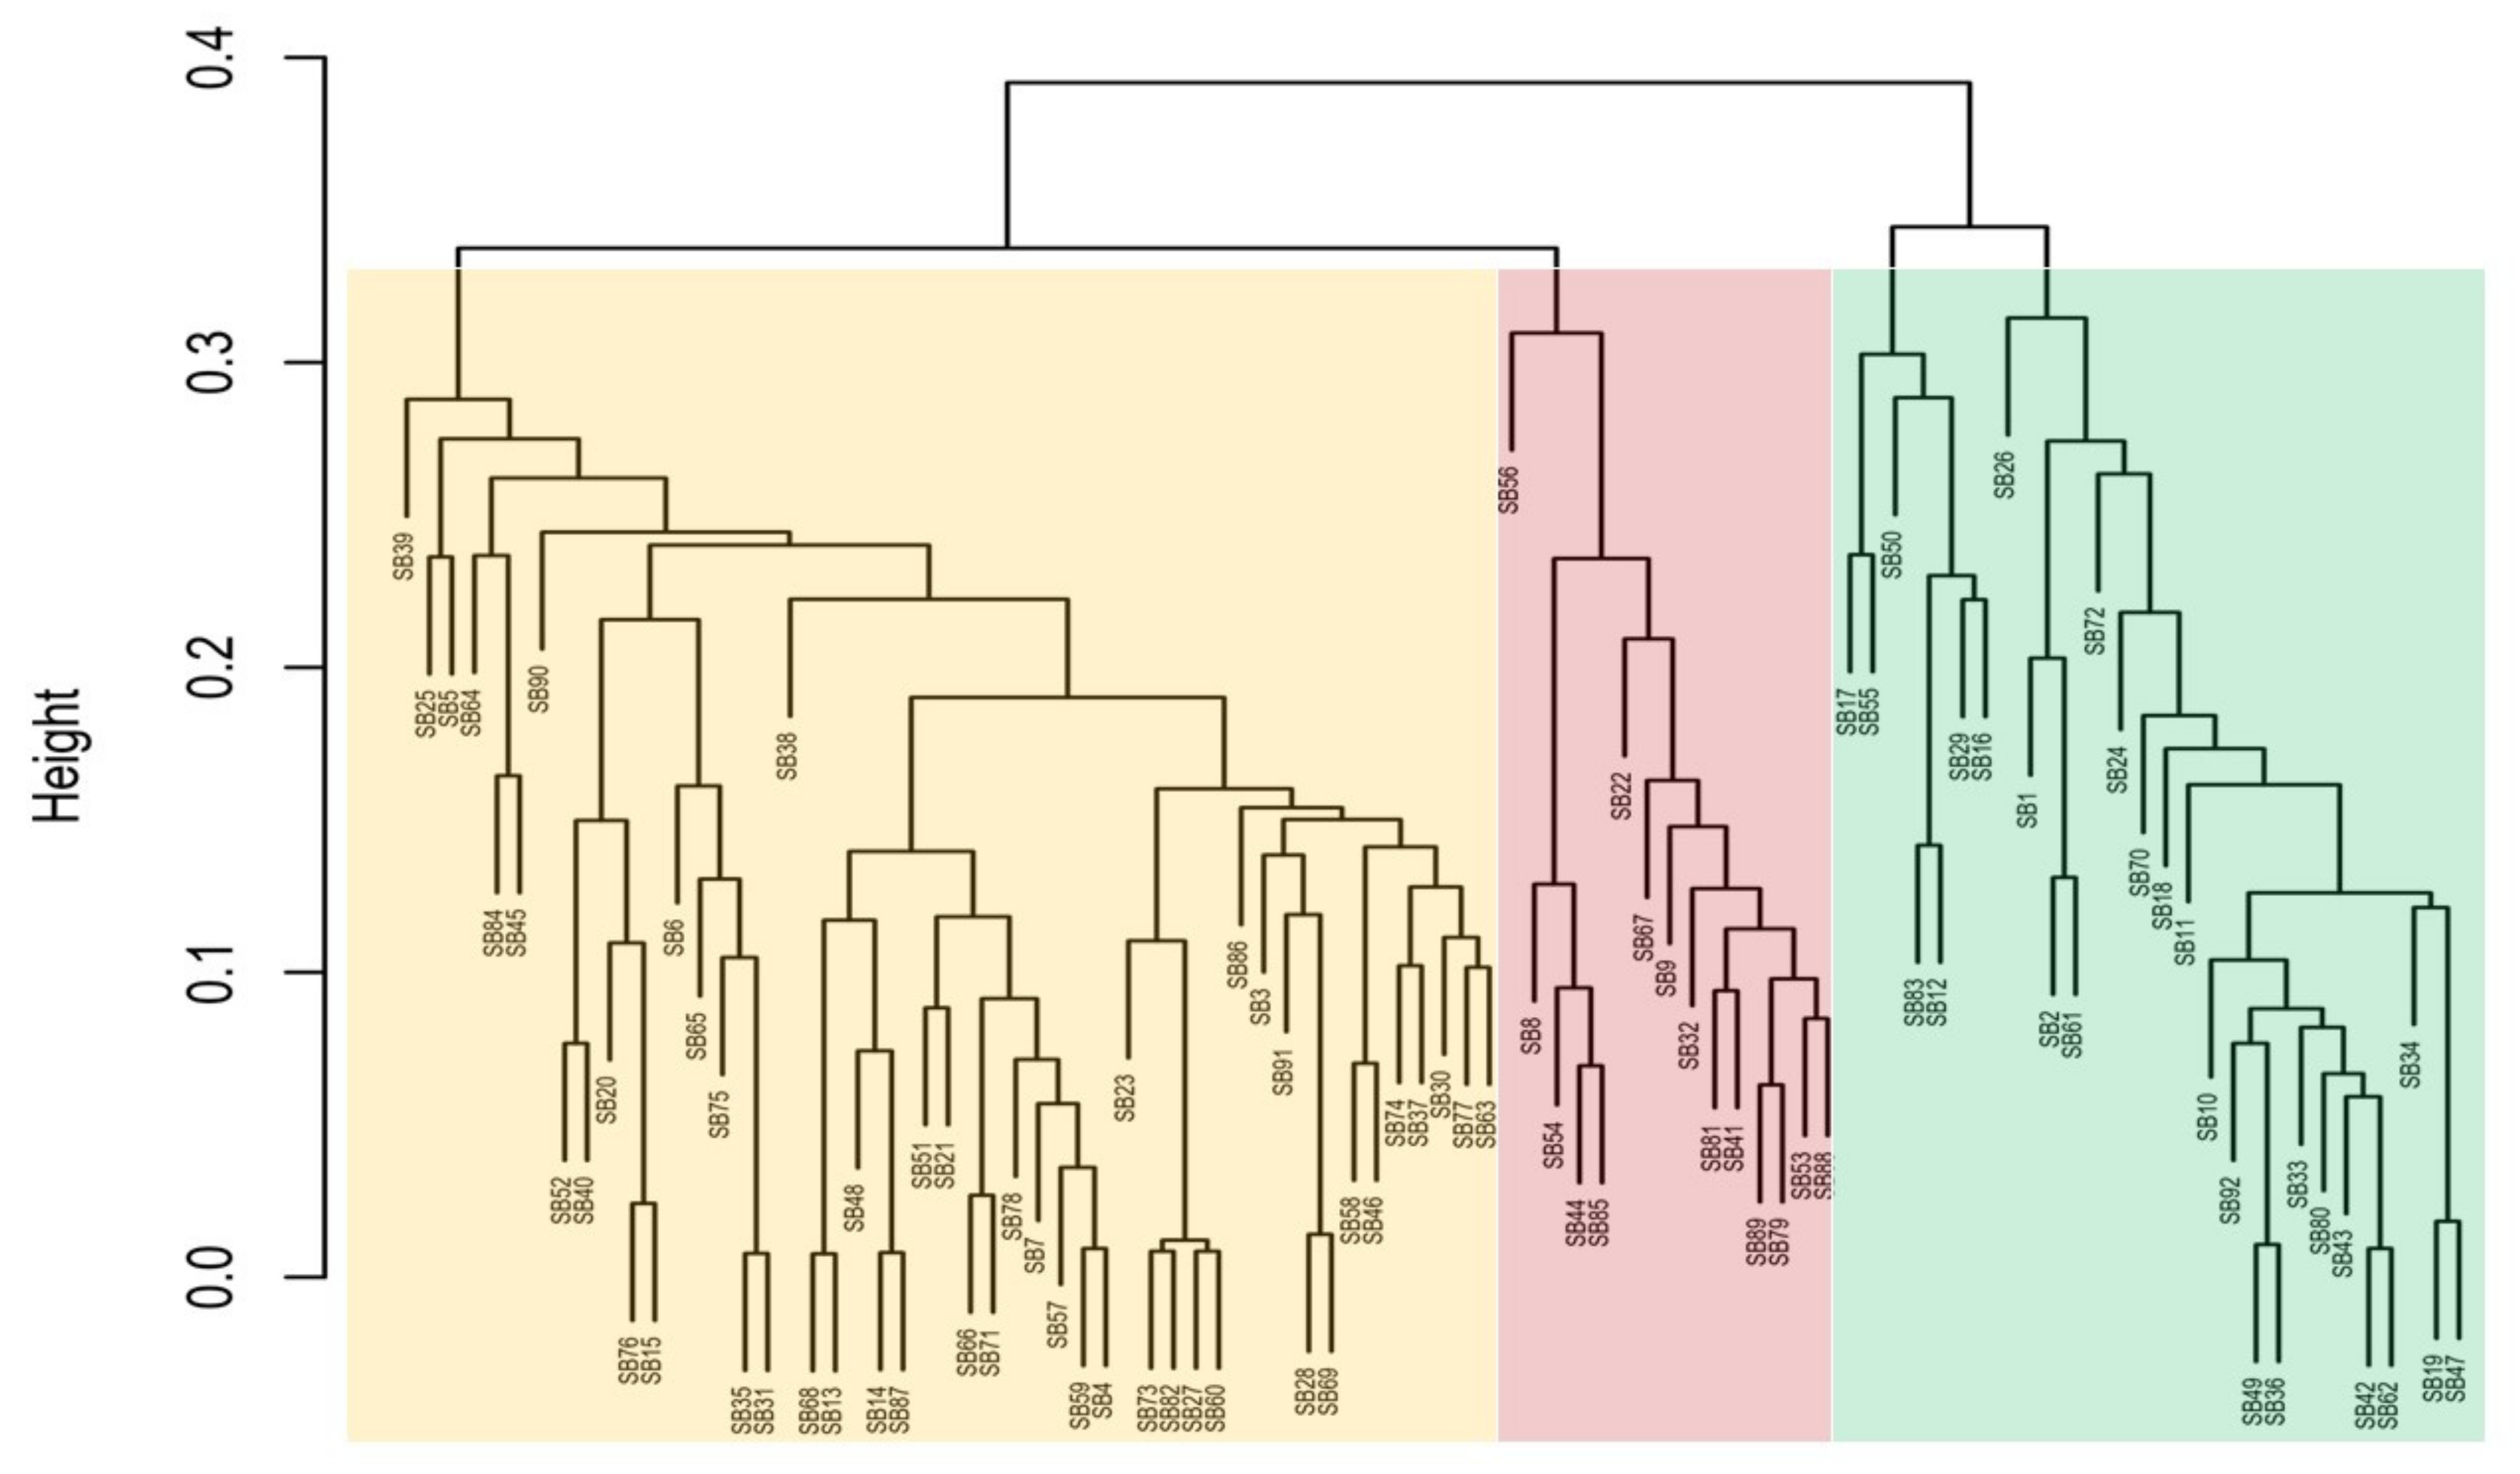
3.1. Cluster Dendrogram (UPGMA)

The UPGMA (unweighted pair method with arithmetic mean) cluster dendrogram results in Figure 1 illustrate three main clusters (indicated by three shaded colours) of genetic distances among 92 genotype SNPs. The first branch of the dendrogram (cluster 1, in yellow) shows the genotypes TVU 13778 (SB39), TVU 12637 (SB25), TVU 3416 (SB5), and Dr Saunders (SB46) to be the most genetically distant within this cluster. Cluster 2 (indicated with a pink colour) shows the genotypes RV 553 (SB56), RV 194 (SB8), and CH-14 (SB22) to be the most genetically distant among genotypes found in the same cluster. Cluster 3 (indicated by a green colour) shows the genotypes RV 403 (SB17), 90K-284-2 (SB55), RV 411 (SB50), TVU 9596 (SB26), TVU 14190 (SB1), and Orelu (SB72) to be the most genetically distant. A general assessment of the 92 branched genotypes indicated that SB39, SB56, and SB26 were the most distantly related genotypes (Figure 1).

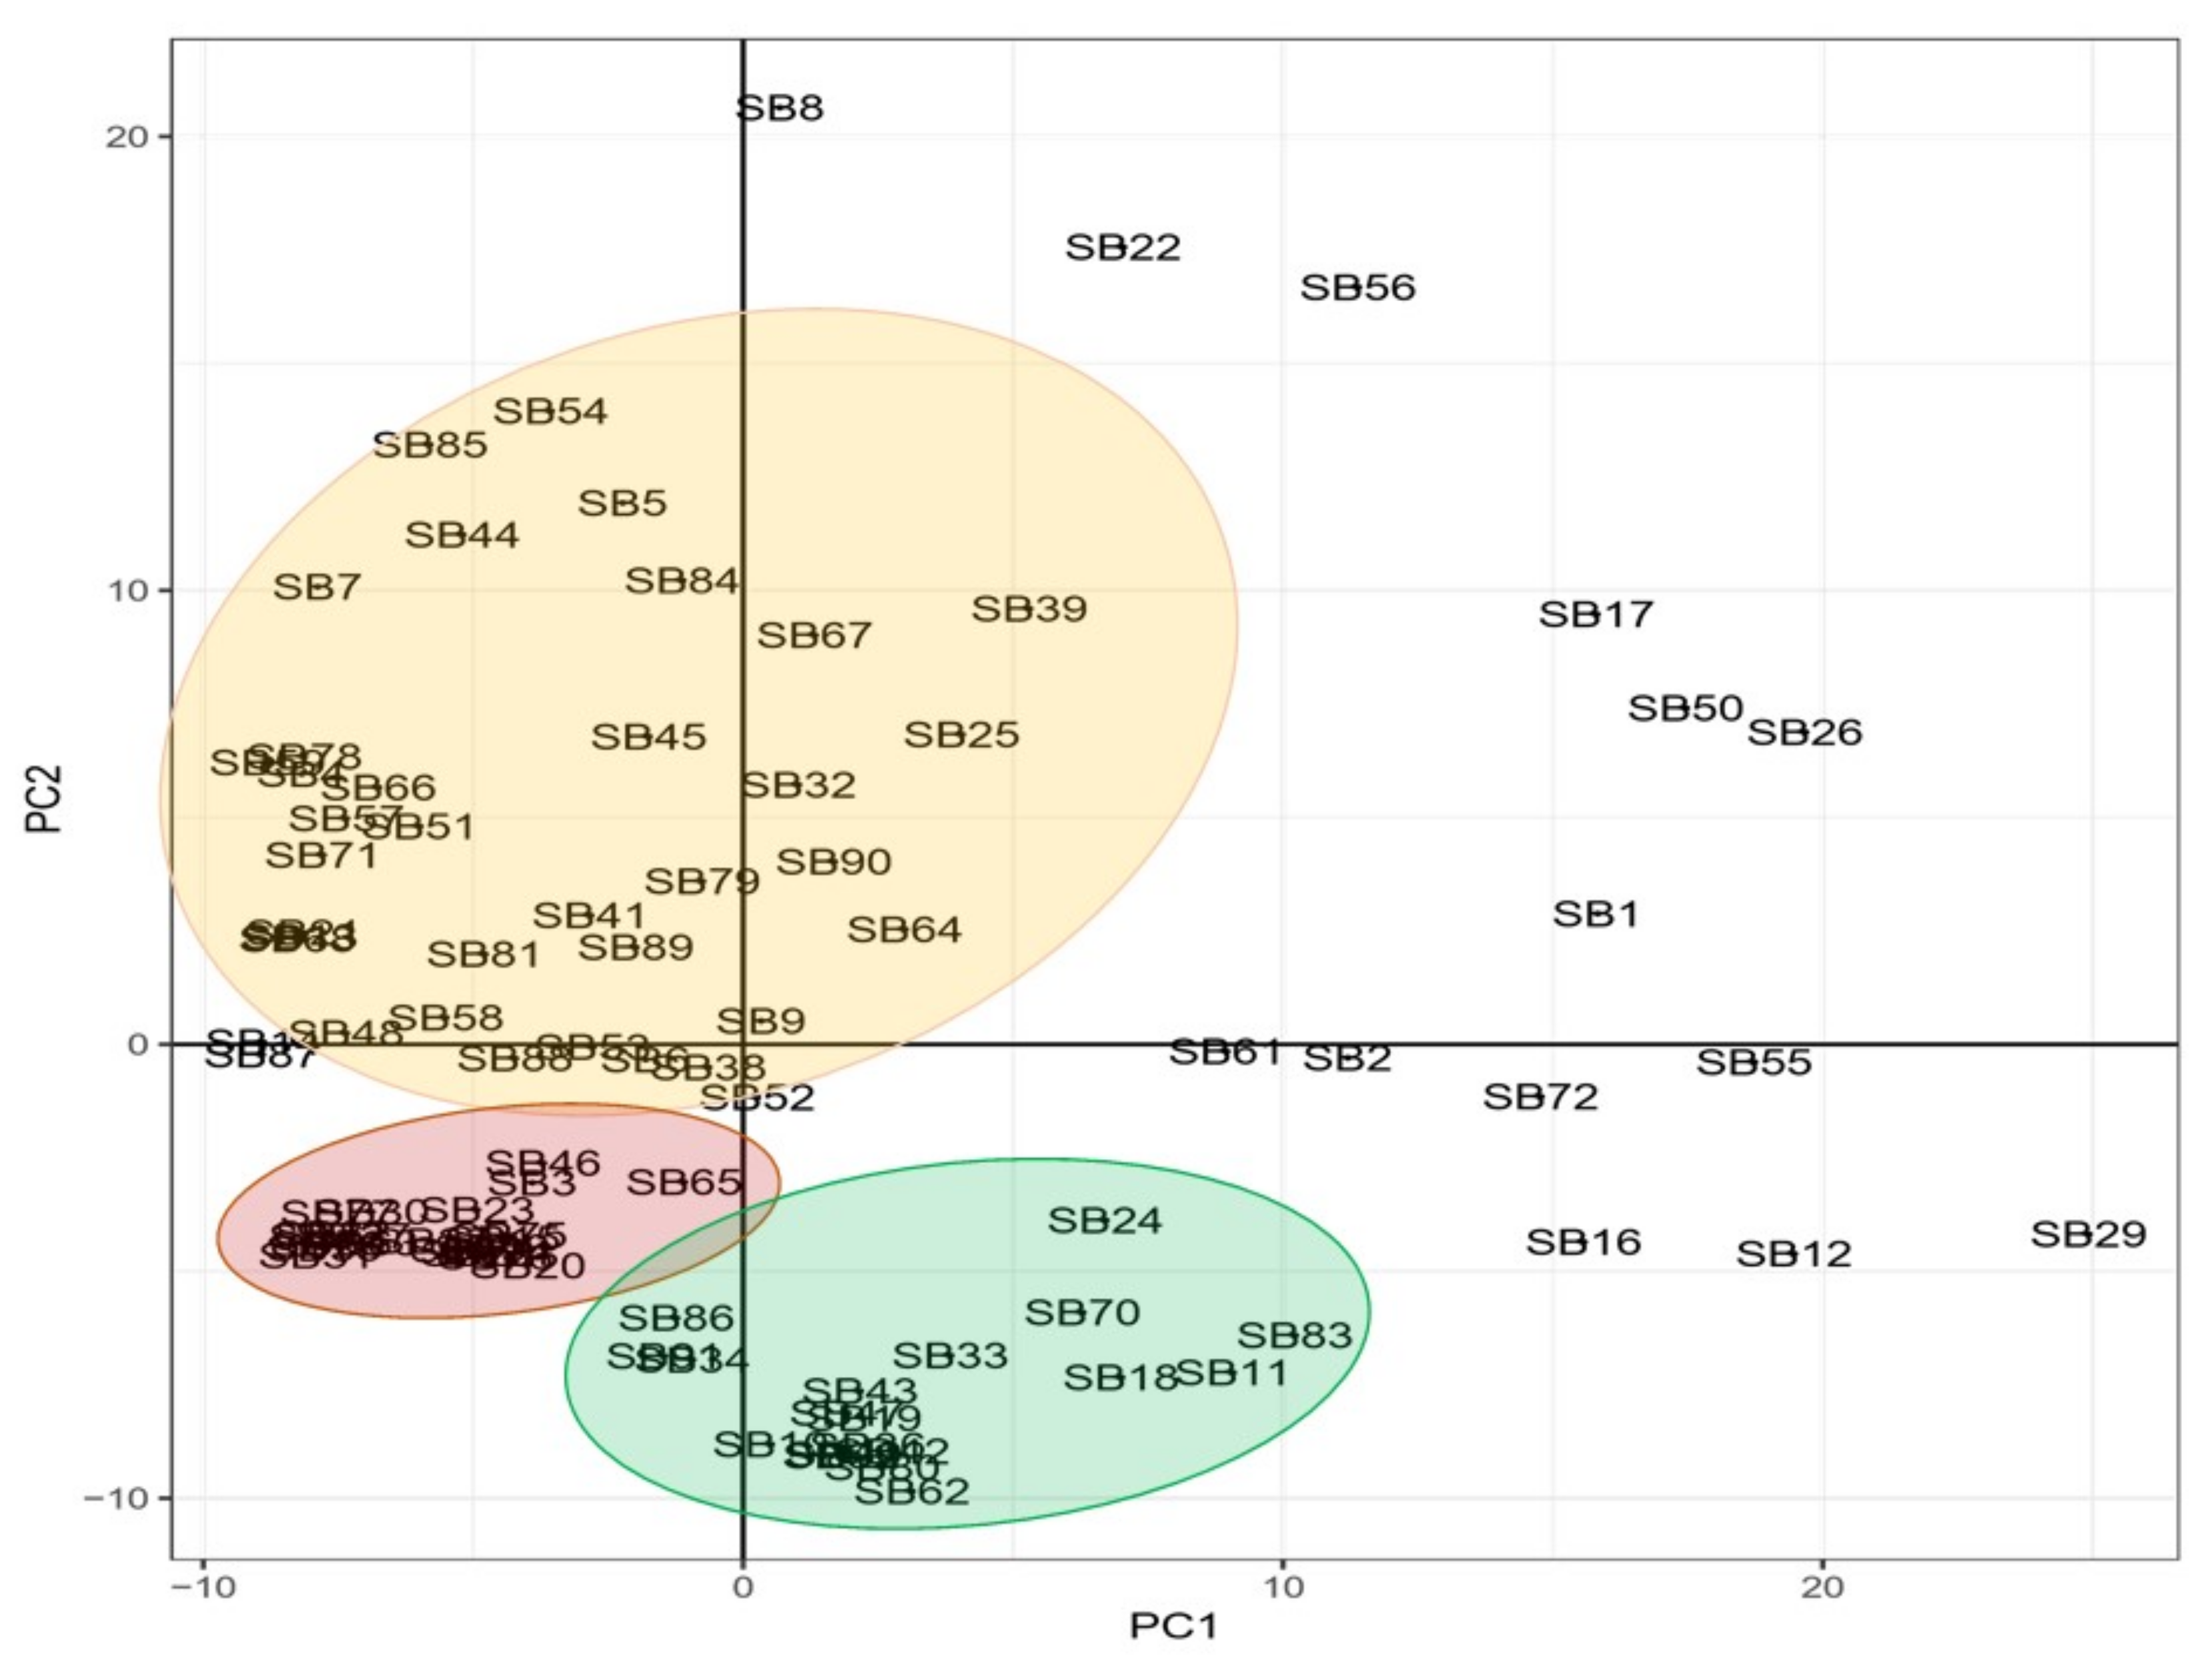
3.2. Principal Component Analysis

A principal component analysis (PCA) was used to illustrate the grouping and scattering of genotypes based on their genetic relation, as shown in Figure 2. There are three groups of cowpea genotypes situated on the first, third, and fourth quadrants of the two-dimensional PCA, showing genetic similarities by distance. Accessions RV 194 (SB8), CH-14 (SB22), RV 553 (SB56), RV 403 (SB17), RV 411 (SB50), TVU 9596 (SB26), and TVU 14190 (SB1) are genetically distant from the outlined groups, and mainly situated in the second quadrant. Accessions Orelu (SB72), 90K-284-2 (SB55), RV 503 (SB2), RV 442 (SB12), 97K-499-35 (SB29), RV 502 (SB61), and RV 498 (SB16) are genetically distant from the outlined groups and primarily in the 4th quadrant (Figure 2).

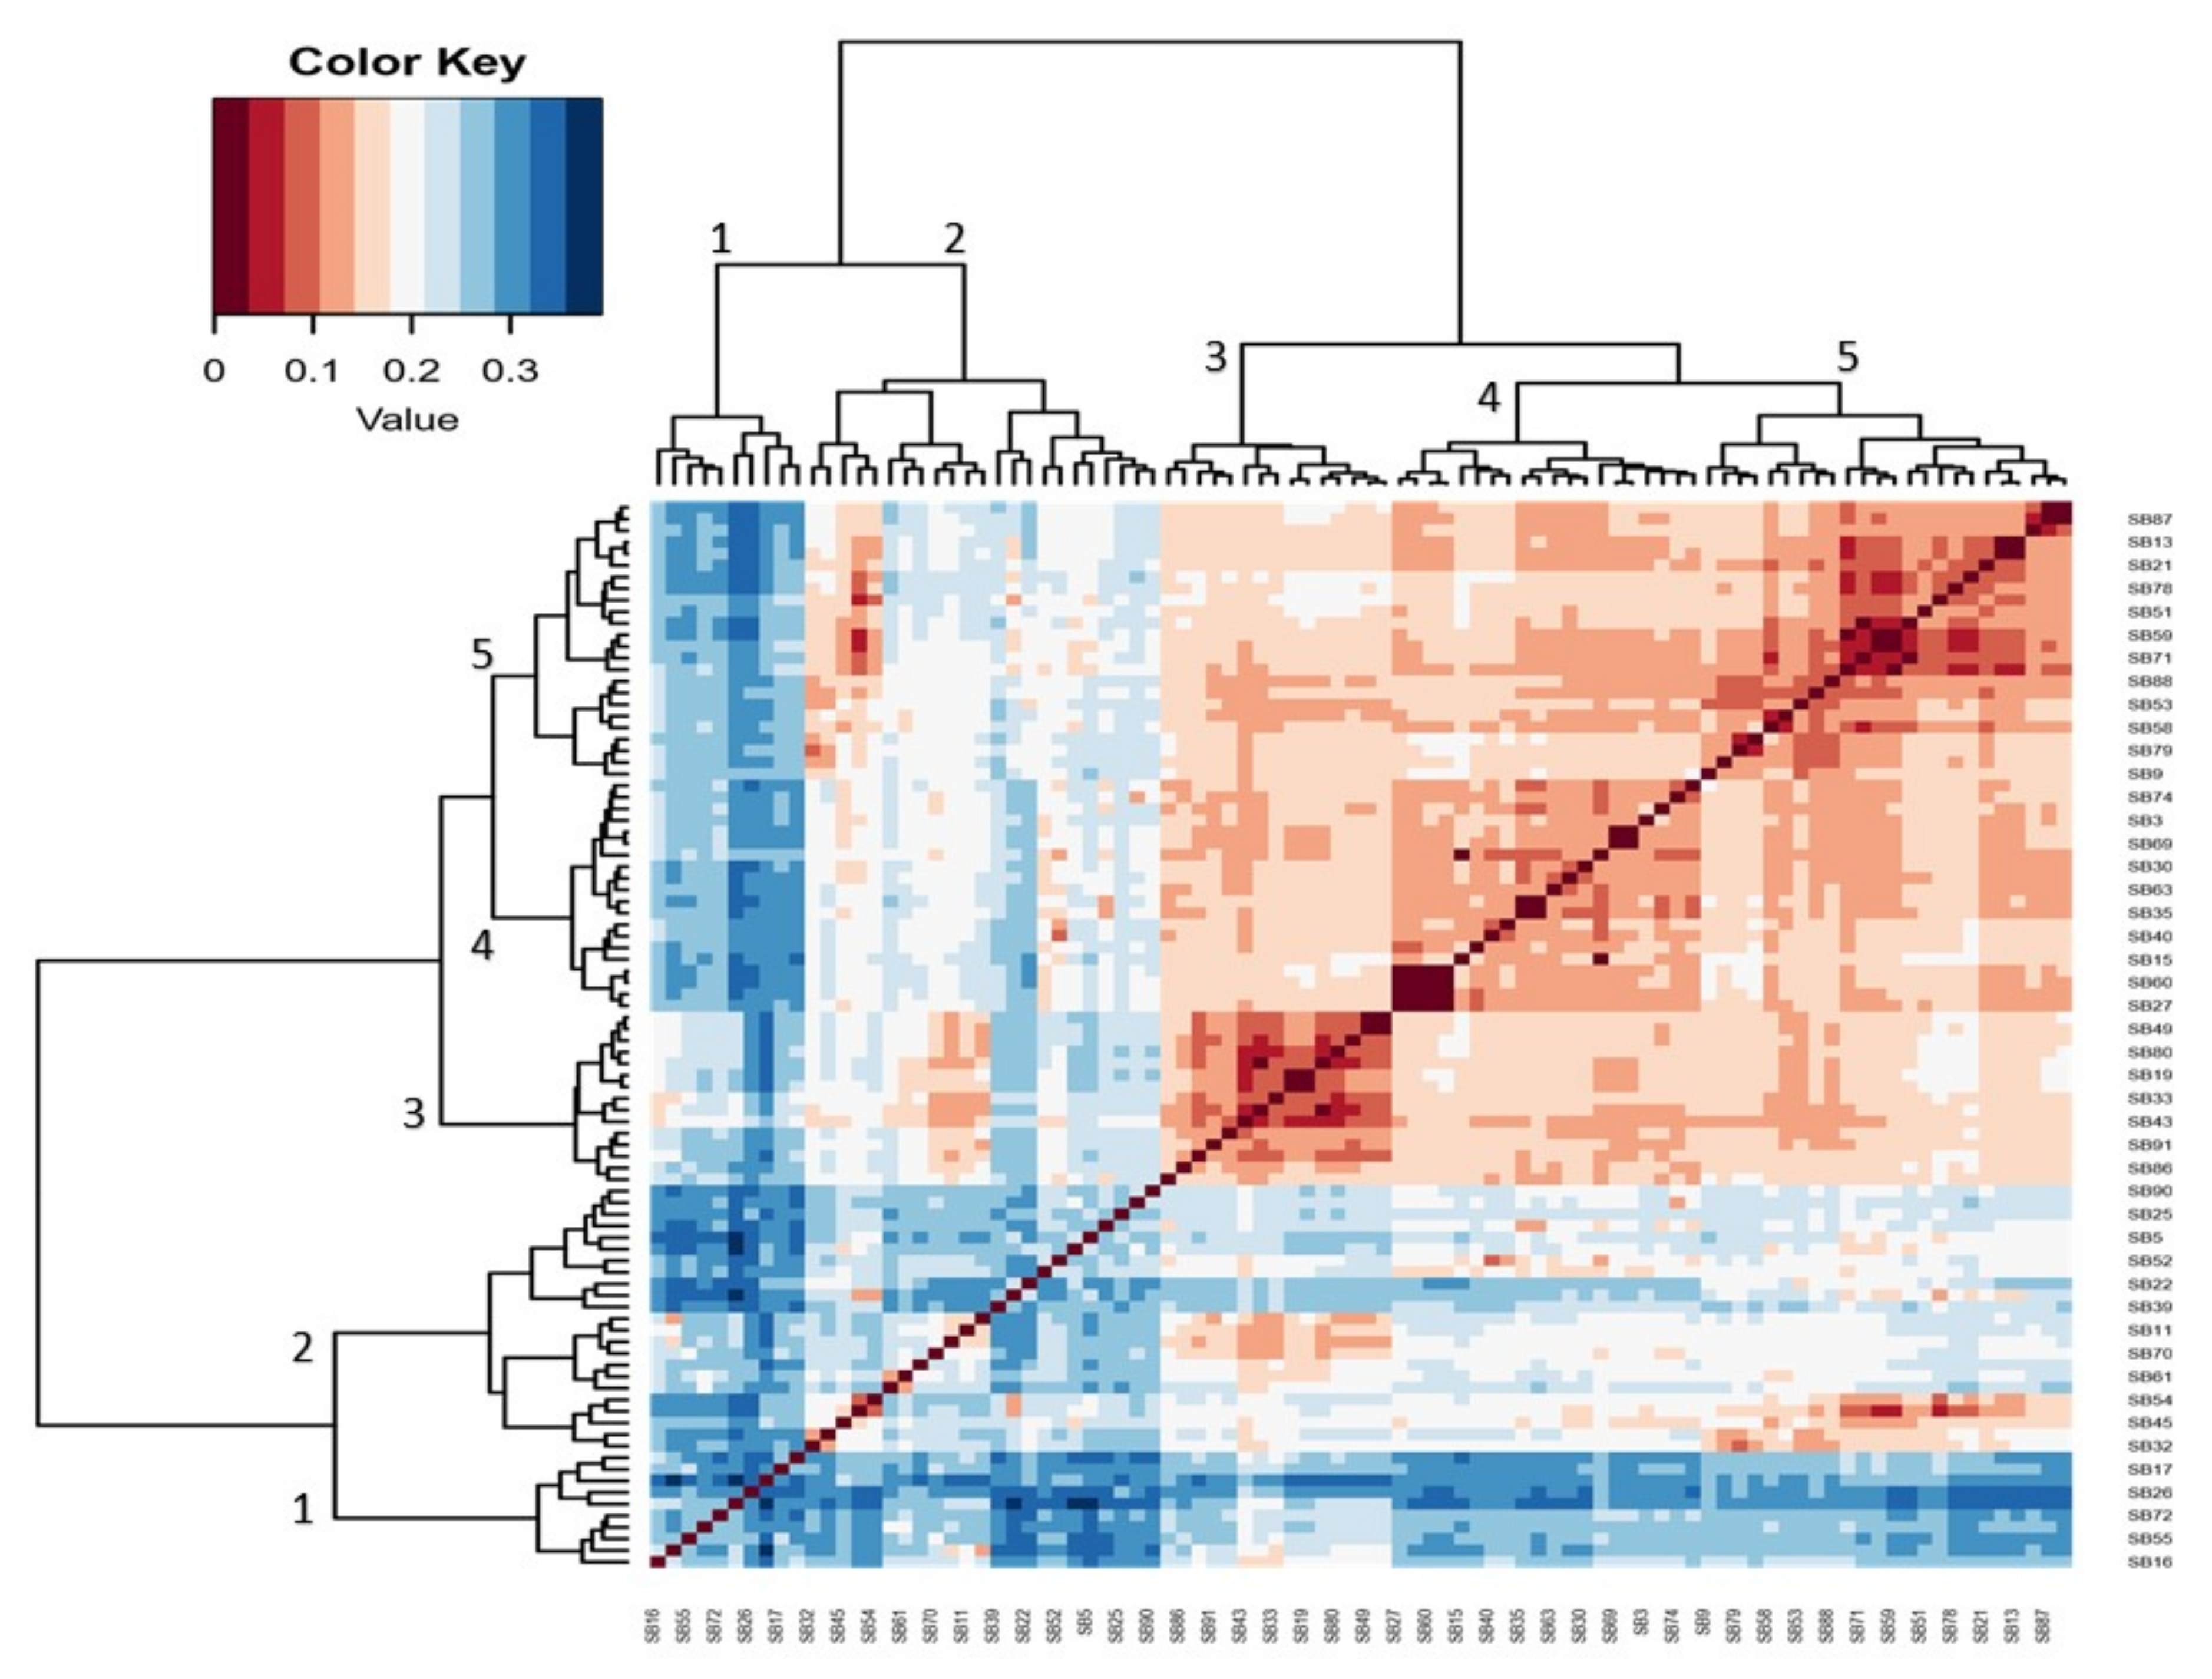
3.3. Hierarchical Heatmap

The hierarchical heatmap shown in Figure 3 further classed five main clusters of 46 genotypes that were more genetically distant among the 92 genotypes illustrated in Figure 1. Values below 0.2 show less genetic distance and those above 0.2 show more genetic distance among the genotypes. The genotypes with moderate genetic distances shown in cluster 2 are CH-14 (SB22), TVU 13778 (SB39), TVU 3416 (SB5), RV 500 (SB90), RV 502 (SB61), and TVU 12637 (SB25) (Figure 3). The genotypes with more genetic distance shown in cluster 1 are TVU 9596 (SB26), Orelu (SB72), 90K-284-2 (SB55), RV 403 (SB17), and RV 498 (SB16).

3.4. Heterogeneity Analysis

Ninety-two cowpea genotypes were sequenced to attain single-nucleotide polymorphic base pairs that were equi-frequent at a specific genomic locus on a chromosome. Gene diversity among cowpea genotypes was assessed (Table 2) using major allele frequencies (MAFs), which yielded an average of 0.729 (range 0.719–0.739). Observed heterozygosity (Ho) averaged 0.386 with a range of 0.358–0.413. Expected heterozygosity (He) averaged 0.345 (range 0.345–0.346), and polymorphic information content (PIC) averaged 0.345 with a range of 0.333–0.354. The inbreeding coefficient (FIS) averaged −0.113 with a range of −0.167 to −0.052, as indicated in the table below (Table 2).

4. Discussion

The DArTseq-SNP data were analysed by computing a UPGMA dendrogram, which uncovered three major clusters with clear genetic diversity among the selected genotypes. The analysis also revealed significant genetic distance relations, both individually and in populations, that can be used in germplasm selection for breeding objectives and germplasm maintenance (Figure 1). The PCA confirmed some of the distinct genotypes indicated in the previous analysis (Figure 2). The heatmap analysis illustrated half of the genotypes that possessed the greatest genetic distance to narrow down the selection of divergent parental genotypes (Figure 3). Genotypes were grouped into clusters based on their genetic distances. The most divergent parental genotypes were TVU 9596 (SB26), Orelu (SB72), 90K-284-2 (SB55), RV 403 (SB17), and RV 498 (SB16). These findings agree with Malik [13] and indicate that PCAs can be successfully used to classify and measure patterns of genetic diversity in germplasm. Moreover, PCA has been effective in assessing genetic diversity for agro-morphological traits in chickpea genotypes [14].
A marker possessing two or more alleles with 99% frequency is qualitatively referred to as polymorphic [15]. The extent of polymorphism is quantitatively measured by heterozygosity and the polymorphism information content (PIC) value [15]. Polymorphisms can be classed into three categories as applied in simple-sequence repeats (SSRs) studies including PIC > 0.5 (highly informative), 0.5 < PIC > 0.25 (moderately informative), and PIC < 0.25 (slightly informative) [16]. This study demonstrated the genetic diversity of genomic DArTseq-SNPs distributed among eleven chromosomal loci of ninety-two cowpea genotypes, with a mean PIC value of 0.345 and a range of 0.333–0.354 (moderately informative polymorphism). This observation could have been caused by low mutations and the bi-allelic nature of SNPs [17]. In population genetic analyses, major and minor allele frequencies are determined at a particular locus in a population to indicate genetic diversity [12]. Our study focused on the most common alleles for given DArTseq-SNPs in a population. The major allele frequency had a significant mean value of 0.729 with a range of 0.719–0.739. The result inferences are based on frequencies that are MAF ≥ 0.5% [18]. Inferences with values close to 1 predict a better distribution of allele frequencies at a given locus in the observed population [12]. The inbreeding coefficient (FIS) was also used as a measure of the non-random association of alleles in individuals in a population. This study recorded a FIS mean value of −0.113 with a range of −0.167 to −0.052. Negative FIS values indicate the presence of heterozygotes within individuals in a population [19].
Heterozygosity is the most important parameter used to estimate genetic diversity in a population. Gene diversity, also known as expected heterozygosity (He), outlines expected genotypes that are heterozygous under Hardy–Weinberg equilibrium [16]. The recorded mean value of He was 0.345 (range 0.358–0.345) and the observed heterozygosity (Ho) mean value was 0.386 with a range of 0.358–0.413. Both mean observed and expected heterozygosity showed moderate genetic variation, as supported by a mean negative inbreeding degree. The mean He was relatively equal to the PIC, and both were less than Ho. This could be a result of the evenness of allele frequencies, indicating individuals that could have identical heterozygote genotypes [17].
Genetic variability in plant material is the basic information needed for breeders to improve crops by adopting an appropriate method of selection [20]. This study highlights the DArTseq platform as an approach for genome complexity reduction. The platform provides whole-genome sequencing, which covers adequate genomic information per locus, improved genotype calling, and the ability to sequence more samples for a lower cost [21]. The system can be applied without available reference genomes using double-digest restriction fragment sequencing, which appropriates evolutionary genetic studies in the bio-system [21]. DArTseq is a cost-effective genotyping platform used for maintaining, profiling, ascertaining, and managing available biodiversity in germplasm banks. DArTseq sequences can be used to develop DArTseq markers and other molecular markers such as SNPs or SSRs, which can be used in other germplasm banks [8]. This information can be further used in association-of-trait-of-interest and marker-assisted breeding.
The DArTseq GBS platform was used by the CIMMYT on their seeds of discovery project, which profiled more than 40,000 wheat gene bank genotypes, as reported by Li [22]. The DArTseq platform produces high throughput molecular markers that help to discriminate the gene pools of cowpeas by detecting substantial genetic variation among genotypes [12]. DArTseq SNPs are important in the selection of diverse parental genotypes in crosses because of their capability to discriminate gene pools. Breeding programmes can narrow the genetic variation in crops. Thus, cowpea germplasm that is introduced and moved to a new environment could increase genetic variation. While arable land for farming is limited because of globalisation, this propels the genotypic advancements of crops with improved genetic variation to guide breeding programmes [6].

5. Conclusions

DArTseq provided high throughput SNP markers that illustrate the heterogeneity in the selected cowpea genotypes from the ARC-GC cowpea germplasm collection. DArTseq SNPs provided whole genome information with a good distribution of major allele frequencies on observed genotypes, which is beneficial when selecting parents with novel genes from the current collection with known agronomic traits. This technology has also supplied negative inbreeding coefficients among individual genotypes in a population within a short time. The SNPs could be further used to construct high-resolution novel gene mapping experiments and to identify genes responsible for traits of interest that can be used in genomic-wide association studies.
Genotypes TVU 9596 (SB26), Orelu (SB72), 90K-284-2 (SB55), RV 403 (SB17), and RV 498 (SB16) could be used as divergent parents in breeding programmes. Furthermore, the overall genetic heterogeneity in the selected genotypes indicated moderately informative polymorphisms. These cowpea genotypes are recommended for use in the development of cowpea markers, and they have pre-recorded, agro-morphological attributes that can qualify them for the improvement and characterisation of other genotypes that are not genetically screened in the ARC-GC germplasm collection.

Author Contributions

Conceptualization, G.M.H.D. and M.M.S.; methodology, M.M.S.; software, G.M.H.D.; validation, G.M.H.D. and M.M.S.; formal analysis, M.M.S.; investigation, G.M.H.D.; resources, M.M.S.; data curation, G.M.H.D.; writing—original draft preparation, G.M.H.D.; writing—review and editing, G.M.H.D.; visualization, M.M.S.; supervision, M.M.S.; project administration, G.M.H.D.; funding acquisition, M.M.S. All authors have read and agreed to the published version of the manuscript.

Funding

This research was funded by the Central University of Technology Research Development and Postgraduate grant, the National Research Foundation, and Food and Beverage SETA. The APC was funded by the Central University of Technology, Free State.

Informed Consent Statement

Not applicable.

Data Availability Statement

The data are contained within this article.

Acknowledgments

We thank Rian Pierneef for helping with the figure designs and the Agricultural Research Council Grain Crops for availing their germplasm for this research project.

Conflicts of Interest

The authors declare no conflicts of interest.

References

  1. Da Silva, D.O.M.; Santos, C.A.F.; Boiteux, L.S. Adaptability and stability parameters of total seed yield and protein content in cowpea (Vigna unguiculata) genotypes subjected to semi-arid conditions. Aust. J. Crop Sci. 2016, 10, 1164–1169. [Google Scholar] [CrossRef]
  2. Nkoana, D.K.; Gerrano, A.S.; Gwata, E.T. Agronomic performance and genetic variability of cowpea (Vigna unguiculata) accessions. Legume Res. Int. J. 2019, 42, 757–762. [Google Scholar] [CrossRef]
  3. FAO. World Food and Agriculture—Statistical Yearbook 2021; FAO: Rome, Italy, 2022; ISBN 978-9-5-134332-6. [Google Scholar] [CrossRef]
  4. Mohamed, H.I.; El-Beltagi, H.S.; Yousef, H.N.; Fawzi, E.M. Biological and Pharmacological Activities of Cowpea (Vigna unguiculata L.) and Its Bioactive Components. In Cowpea: Research Progress and Management Challenges; Nikolic, B.A., Ed.; Nova Science Publishers: New York, NY, USA, 2018; Chapter 4; ISBN 978-1-53614-282-2. [Google Scholar]
  5. Mohammed, S.B.; Mohammad, I.F.; Pangirayi, T.B.; Vernon, G.; Dzidzienyo, D.K.; Umar, M.L.; Umar, S. Farmers’ knowledge, perception, and use of phosphorus fertilization for cowpea production in Northern Guinea Savannah of Nigeria. Heliyon 2020, 6, e05207. [Google Scholar] [CrossRef] [PubMed]
  6. Boukar, O.; Belko, N.; Chamarth, S.; Togola, A.; Batieno, J.; Owusu, E.; Haruna, M.; Diallo, S.; Umar, M.L.; Olufajo, O.; et al. Cowpea (Vigna unguiculata): Genetics, genomics, and breeding. Plant Breed. 2018, 138, 415–424. [Google Scholar] [CrossRef]
  7. Xiong, H.; Shi, A.; Mou, B.; Qin, J.; Motes, D.; Lu, W.; Ma, J.; Weng, Y.; Yang, W.; Wu, D. Genetic diversity and population structure of cowpea (Vigna unguiculata L. Walp). PLoS ONE 2016, 11, e0160941. [Google Scholar] [CrossRef]
  8. Egea, L.A.; Merida-Garcia, R.; Kilian, A.; Hernandez, P.; Dorado, G. Assessment of genetic diversity and structure of large garlic (Allium sativum) germplasm bank, by Diversity Arrays Technology “Genotyping-by-Sequencing” platform (DArTseq). Front. Genet. 2017, 8, 98. [Google Scholar] [CrossRef] [PubMed]
  9. Doyle, J.J.; Doyle, J.L. A rapid DNA isolation procedure for small quantities of fresh leaf tissue. Phytochem. Bull. 1987, 19, 11–15. [Google Scholar]
  10. Kilian, A.; Sanewski, G.; Ko, L. The application of DArTseq technology to pineapple. Int. Soc. Hortic. Sci. 2016, 1111, 181–188. [Google Scholar] [CrossRef]
  11. Elshire, R.J.; Glaubitz, J.C.; Sun, Q.; Poland, J.A.; Kawamoto, K.; Buckler, E.S.; Mitchell, S.E. A robust, simple Genotyping-by-Sequencing (GBS) approach for high diversity species. PLoS ONE 2011, 6, e19379. [Google Scholar] [CrossRef] [PubMed]
  12. Pojskić, N. iMAF—Index of Major Allele Frequency. Genet. Appl. 2018, 2, 78–81. [Google Scholar] [CrossRef]
  13. Malik, S.R.; Shabbir, G.; Zubir, M.; Iqbal, S.M.; Ali, A. Genetic diversity of morpho-genetic traits in Desi Chickpea (Cicer arietinum). Int. J. Agric. Biol. 2014, 16, 956–960. [Google Scholar]
  14. Nilah, K.; Adak, M.S. Associations of some characters with grain yield in chickpea (Cicer arietinum L.). Pak. J. Bot. 2012, 44, 267–272. [Google Scholar]
  15. Shete, S.; Tiwari, H.; Elston, R.C. On estimating the heterozygosity and polymorphism information content value. Theor. Popul. Biol. 2000, 57, 265–271. [Google Scholar] [CrossRef] [PubMed]
  16. Zhang, M.; Mao, W.; Zhang, G.; Wu, F. Development and characterization of Polymorphic EST-SSR and Genomic SSR Markers for Tibetan Annual Wild Barley. PLoS ONE 2014, 9, e94881. [Google Scholar] [CrossRef] [PubMed]
  17. Luo, Z.; Brock, J.; Dyer, J.M.; Kutchan, T.; Schachtman, D.; Augustin, M.; Ge, Y.; Fahlgren, N.; Abdel-Haleem, H. Genetic Diversity and Population Structure of a Camelina sativa Spring Panel. Front. Plant Sci. 2019, 10, 184. [Google Scholar] [CrossRef] [PubMed]
  18. Park, J.H.; Gail, M.H.; Weinberg, C.R.; Carroll, R.J.; Chung, C.C.; Wang, Z.; Chanock, S.J.; Fraumeni, J.F.; Chatterjee, N. Distribution of allele frequencies and effect sizes and their interrelationships for common genetic susceptibility variants. Proc. Natl. Acad. Sci. USA 2011, 108, 18026–18031. [Google Scholar] [CrossRef] [PubMed]
  19. Shahsavarani, H.; Rahimi-Mianji, G. Analysis of genetic diversity and estimation of inbreeding coefficient within Caspian horse population using microsatellite markers. Afr. J. Biotechnol. 2010, 9, 293–299. [Google Scholar]
  20. Huynh, O.A.; Hofinger, B.J.; Beshir, M.M.; Jankowicz-Cieslak, J.; Guo, H.; Forster, B.P.; Till, B.J. Do-it-yourself molecular biology for plant breeding: Low-cost tools for developing countries. In Proceedings of the Plant Genetics and Breeding Technologies, Vienna, Austria, 18–20 February 2013; pp. 33–36. [Google Scholar]
  21. Melville, J.; Haines, M.L.; Boysen, K.; Hodkinson, L.; Kilian, A.; Smith Date, K.L.; Potvin, D.A.; Parris, K.M. Identifying hybridization and admixture using SNPs: Application of the DArTseq platform in phylogeographic research on vertebrates. R. Soc. Open Sci. 2017, 4, 161061. [Google Scholar] [CrossRef] [PubMed]
  22. Li, H.; Vikram, P.; Singh, R.P.; Kilian, A.; Carling, J.; Song, J.; Burgueno-Ferreira, J.A.; Bhavani, S.; Huerta-Espino, J.; Payne, T.; et al. A high density GBS map of bread wheat and its application for dissecting complex disease resistance traits. BMC Genom. 2015, 16, 216. [Google Scholar] [CrossRef] [PubMed]
Figure 1. Cluster dendrogram (UPGMA) illustrating the genetic distances of 92 cowpea genotypes. Clusters are illustrated with pale orange, red and green colours.
Genes 15 00764 g001
Figure 2. Principal component analysis illustrating the genetic populations of 92 cowpea genotypes. The clustering of genotypes is illustrating by pale orange, red and green colours.
Genes 15 00764 g002
Figure 3. Hierarchical heatmap (correlation matrix) illustrating heterogeneity among the most diverse cowpea genotypes.
Genes 15 00764 g003
Table 1. List of cowpea genotypes used for DArTseq genotyping and genetic diversity analysis.
Genotype Sample CodeGenotype NameOrigin Genotype Sample CodeGenotype NameOrigin Genotype Sample CodeGenotype NameOrigin
SB1TVU 14190NigeriaSB32RV 351South AfricaSB63ARC 039South Africa
SB2RV 503South AfricaSB3398K-503-1NigeriaSB64ARC 022South Africa
SB3TVU 2095NigeriaSB34RV 126South AfricaSB65ARC 029South Africa
SB4BECHUANA WHITESouth AfricaSB35TVU 11424NigeriaSB66AGRINAWASouth Africa
SB5TVU 3416NigeriaSB36RV 447South AfricaSB67RV 343South Africa
SB6PAN 311South AfricaSB37RV 558South AfricaSB68ARC 012South Africa
SB7RV 204South AfricaSB38TVU 11986NigeriaSB69ARC 020South Africa
SB8RV 194South AfricaSB39TVU 13778NigeriaSB70RV 327South Africa
SB9RV 438South AfricaSB4098D-1399NigeriaSB71ARC 040South Africa
SB1095K-589-2NigeriaSB41RV 341South AfricaSB72ORELUNigeria
SB11RV 416South AfricaSB42RV 440South AfricaSB73RV 315South Africa
SB12RV 442South AfricaSB43OLOYINNigeriaSB74RV 417South Africa
SB13RV 207South AfricaSB44RV 202South AfricaSB75ARC 037South Africa
SB14ARC 045South AfricaSB45ENCORE 349South AfricaSB76RV 439South Africa
SB15ARC 024South AfricaSB46DR SAUNDERSSouth AfricaSB77ARC 009South Africa
SB16RV 498South AfricaSB47RV 568South AfricaSB78ARC 004South Africa
SB17RV 403South AfricaSB48RV 554South AfricaSB79RV 352South Africa
SB1898K-476-8NigeriaSB49RV 446South AfricaSB80RV 457South Africa
SB19IT93K-1294NigeriaSB50RV 411South AfricaSB81RV 361South Africa
SB20RV 329South AfricaSB51ARC 006South AfricaSB82ARC 013South Africa
SB 21RV 157South AfricaSB5283S-911NigeriaSB83ARC 026South Africa
SB22CH 14South AfricaSB53RV 342South AfricaSB84TVU 13953Nigeria
SB23TVU 12746South AfricaSB54ARC 008South AfricaSB85TVU 13998Nigeria
SB24TVU 9443South AfricaSB5590K-284-2NigeriaSB86IT00K-1263Nigeria
SB25TVU 12637South AfricaSB56RV 553South AfricaSB87RV 555South Africa
SB26TVU 9596South AfricaSB57RV 213South AfricaSB88RV 344South Africa
SB27ARC 014South AfricaSB58GLENDASouth AfricaSB89CH 47South Africa
SB2886D-1010NigeriaSB59ARC 005South AfricaSB90RV 500South Africa
SB2997K-499-35NigeriaSB60RV 320South AfricaSB9198K-506-1Nigeria
SB30RV 321South AfricaSB61RV 502South AfricaSB9297K-207-15Nigeria
SB3199K-494-6NigeriaSB62ARC 025South Africa
Table 2. Heterogeneity assessment of 92 cowpea genotypes using DArTseq-derived SNPs.
Chromosome No. No. of SNPsMAFHeHoPICFIS
15180.72838530.34624230.38564410.3462469−0.10820243
24990.73005590.34624240.38044040.3428320−0.10128670
310160.73578950.34624250.37833860.3433586−0.09397598
47290.71894960.34624260.39227070.3538314−0.10568182
56540.72527930.34624270.40371930.3439191−0.16628110
66800.72396140.34624280.40542830.3518747−0.14416821
78820.73279580.34624290.36675730.3469722−0.05202273
86300.72349170.34624300.41329670.3522159−0.16792216
95630.73297300.34624310.38953560.3357911−0.15095750
106870.73189180.34624320.37707330.3453611−0.08789979
116390.73934920.34624330.35776120.3331006−0.06902656
Mean681.54550.72935660.34504270.38638780.3450458−0.1134023
SE46.09030.0018151760.0019490460.0050666840.0019489860.01172541
Note: MAF = major allele frequency, Ho = observed heterozygosity, He = expected heterozygosity (genetic diversity), PIC = polymorphic information content, FIS = inbreeding coefficient, No. of SNPs = number of single nucleotide polymorphisms, SE = standard error.
Disclaimer/Publisher’s Note: The statements, opinions and data contained in all publications are solely those of the individual author(s) and contributor(s) and not of MDPI and/or the editor(s). MDPI and/or the editor(s) disclaim responsibility for any injury to people or property resulting from any ideas, methods, instructions or products referred to in the content.

