Article

Genome-Wide Association Study Reveals Additive and Non-Additive Effects on Growth Traits in Duroc Pigs

1
College of Animal Science and Technology, China Agricultural University, Beijing 100193, China
2
School of Life Science and Engineering, Foshan University, Foshan 528231, China
3
Jiangxi Zhengbang Breeding Co., Ltd., Nanchang 330096, China
4
College of Animal Science and Technology, Huazhong Agricultural University, Wuhan 430070, China
*
Authors to whom correspondence should be addressed.
These authors contributed equally to this work.
Genes 2022, 13(8), 1454; https://doi.org/10.3390/genes13081454
Submission received: 20 July 2022 / Revised: 12 August 2022 / Accepted: 13 August 2022 / Published: 16 August 2022
(This article belongs to the Special Issue Quantitative Genetics and Bioinformatics Method in Animals)

Abstract

:
Growth rate plays a critical role in the pig industry and is related to quantitative traits controlled by many genes. Here, we aimed to identify causative mutations and candidate genes responsible for pig growth traits. In this study, 2360 Duroc pigs were used to detect significant additive, dominance, and epistatic effects associated with growth traits. As a result, a total number of 32 significant SNPs for additive or dominance effects were found to be associated with various factors, including adjusted age at a specified weight (AGE), average daily gain (ADG), backfat thickness (BF), and loin muscle depth (LMD). In addition, the detected additive significant SNPs explained 2.49%, 3.02%, 3.18%, and 1.96% of the deregressed estimated breeding value (DEBV) variance for AGE, ADG, BF, and LMD, respectively, while significant dominance SNPs could explain 2.24%, 13.26%, and 4.08% of AGE, BF, and LMD, respectively. Meanwhile, a total of 805 significant epistatic effects SNPs were associated with one of ADG, AGE, and LMD, from which 11 sub-networks were constructed. In total, 46 potential genes involved in muscle development, fat deposition, and regulation of cell growth were considered as candidates for growth traits, including CD55 and NRIP1 for AGE and ADG, TRIP11 and MIS2 for BF, and VRTN and ZEB2 for LMD, respectively. Generally, in this study, we detected both new and reported variants and potential candidate genes for growth traits of Duroc pigs, which might to be taken into account in future molecular breeding programs to improve the growth performance of pigs.

1. Introduction

Pork is a major meat resource for humans, constituting over 31% of all meat consumed worldwide in 2020 (https://www.fao.org/3/cb1993en/cb1993en_meat.pdf, accessed on 20 July 2022). The huge demand for pork has greatly increased the global production of pork. There is a positive correlation between pig growth rate and meat production, which can be directly used to improve meat production in pig breeding [1]. In pig breeding programs, traits such as adjusted age at a specified weight (AGE), average daily gain (ADG), backfat thickness (BF), and loin muscle depth (LMD) are usually used to measure growth rate and carcass performance, as they are direct indicators of productivity [2]. Thus, understanding the genetic mechanisms of these traits might provide valuable information for marker-assisted selection in pigs. Fortunately, all the growth traits mentioned above have moderate to high heritabilities [3], which indicates that an effective breeding method could directly improve these traits.
The economic traits of animals are often controlled by multiple loci with additive, dominance, epistasis, and environmental interaction effects. Dominance refers to a relationship between two alleles or variants of the same gene, whereas epistasis refers to a relationship between alleles of two different genes. Both of them are known as non-additive effects which result in non-linear effects that control variation in phenotypes. Identification of non-additive effects associated with economic traits is an effective approach to understand the genetic architecture that underlies the complex variation of traits [4,5].
With the advance of whole-genome sequencing and high-throughput genotyping technology, genome-wide association study (GWAS), as effective methods for detecting causative mutations associated with economic traits, have been more and more widely used in humans [6] and domestic animals [7,8]. Several GWASs have been performed to search for QTL and candidate genes for growth traits in many species [9,10,11], especially in pigs [2,12,13,14]. However, most studies have focused on additive genetic effects and ignored non-additive effects. Interestingly, significant dominance effects accounted for 6% of the total phenotypic variance in average daily gain, which were detached in a Duroc population, emphasizing the importance of non-additive genetic effects [15]. Meanwhile, it has been suggested that the effects of dominance and/or epistasis should not be ignored in predicting phenotypes [5,16], as these would provide new insights into the genetic architecture of complex economic traits.
Duroc boars, due to their maximized production performance, are commonly used as terminal boars in modern three-way crossbreeding production systems (Duroc × Landrace × Yorkshire, DLY), which fully utilize heterosis from both maternal and paternal sides. This is the most efficient way to boost the genetic improvement of growth traits, and this study aimed to detect additive and non-additive effects on growth traits to find causative variants and potential candidate genes for growth-related traits.

2. Materials and Methods

2.1. Animals and Phenotype Data

The data used in this study were all from a nucleus breeding farm in the Jiangxi province of China. After data cleaning, a total number of 2360 Duroc pigs born from 2014 to 2021, including 1559 males and 801 females, were used in our study. Pedigrees can be traced back for three generations. Regarding phenotypes, there were 1854 records for AGE and ADG, 1847 records for BF, and 1651 records for LMD, respectively.
ADG and AGE for each individual was calculated with information provided by automated feeding stations. Daily weights were collected from 30 to 100 kg of body weight, and they were used to calculate AGE and ADG. Phenotypes of BF and LMD were measured individually alive at around 100 kg body weight using Aloka 500 V real-time B-mode ultrasound, according to the Chinese national pig performance testing standard. The ultrasound images were taken from the dorsum at a distance of 5 cm from the dorsal midline in the middle of the last third and fourth ribs of each pig. All phenotypes in this study were adjusted to 100 kg using the formulas shown below:
(1) AGE:
AGE 100 = AGE t e s t + ( 100 w t ) × ( AGE t e s t A w t )
where AGE t e s t represents measured age, w t represents measured weight, and A is the correction coefficient for sire and dam; A s i r e = 50.775 and A d a m = 46.415 .
(2) BF:
BF 100 = BF t e s t + ( 100 w t ) ( BF t e s t w t B )
where BF t e s t represents measured BF, w t represents measured weight, and B is the correction coefficient for sire and dam; B s i r e = 7.277 and B d a m = 9.440 .
(3) ADG
ADG 100 = 100   kg AGE 100
(4) LMD
LMD 100 = LMD t e s t × C C + [ D × ( w t 100   kg ) ]
where LMD t e s t represents measured LMD, w t represents measured weight, and C and D are the correction coefficients for boars and dam respectively; C s i r e = 50.52 , C d a m = 52.01 , and D = 0.228 .
Descriptive information for the phenotypes is presented in Table 1.

2.2. Genotype Data and Quality Control

A total number of 2360 Duroc pigs born from 2016 to 2022 were genotyped using Illumina Porcine SNP50 BeadChip (Illumina, San Diego, USA). Data quality control was conducted using the PLINK (version: 1.90, Christopher C Chang, San Jose, USA) software [17]. The genotype data were filtered by the following procedures: (1) individuals with call rate < 0.95, (2) SNP call rate < 0.95, (3) minor allele frequency < 0.01, (4) Hardy–Weinberg equilibrium p-value < 10−6, and (5) SNPs located in sex chromosomes or unmapped to the reference genome. After the quality control, there were 31,372 high-quality SNPs and 2360 pigs left. Then, missing genotypes were further imputed by Beagle v5.2 software [18].

2.3. Statistical Analyses

The estimated breeding values (EBV) for AGE, ADG, BF, and LMD traits were estimated according to average information restricted maximum likelihood using the pedigree-based best linear unbiased prediction (PBLUP) method and the DMUAI module of DMU software [19], as described below:
y c = X b + Z a + e
where y c was the vector of corrected phenotypic values; X and Z were the incidence matrices of b and a , respectively; b was the vector of fixed effects, including farm, sex, year–season of birth; and e was the vector of residuals with a normal distribution of e ~ N ( 0 , I σ e 2 ) , I being an identity matrix and σ e 2 the residual variance. In the PBLUP model, a was the vector of additive genetic effects with a normal distribution of a ~ N ( 0 , A σ a 2 ) , σ a 2 being additive genetic variance and A being a pedigree-based additive genetic relationship matrix. Subsequently, the deregressed EBVs (DEBVs) were obtained with the formula DEBV = g i / r i 2 , g i being the EBV of the i th individual and r i 2 being the square of estimated accuracies for the i th individual [20], which were calculated using the blupADC [21] R package.
Then, a linear mixed model, including additive and non-additive SNP effects, was generated by GMAT software [22], which can be written as:
y d E B V = 1 n μ + Z M a a a + Z M d a d + Z M a a a a a + Z M a d a a d + Z M d d a d d + e
where y d E B V is the vector of DEBV; 1 n is a vector of ones; μ is the overall mean; vectors a a , a d , a a a , a a d , and a d d are additive, dominance, additive-by-additive (A × A), additive-by-dominance (A × D), and dominance-by-dominance (D × D) SNP effects, respectively; vector e is a collection of residual effects; Z is a design matrix for all the random model effects; and M a , M d , M a a , M a d , and M d d are additive, dominance, A × A, A × D, and D × D SNP matrixes, respectively.
Then, Bonferroni correction was implemented to define the significant threshold. To avoid missing the true hints of linkage, the genome-wide significant and suggestive levels were set as p = 0.05/N = 1.59 × 10⁻⁶ and p = 1/N = 3.19 × 10⁻⁵, respectively, where N is the number of analyzed SNPs. The proportion of DEBV variance explained by significant SNPs was calculated according to [23]. The p-values of the epistatic effects were Bonferroni-corrected for multiple testing, which resulted in p < 1.03 × 10⁻⁹ as a significance threshold.

2.4. SNP–SNP Network and Linkage Disequilibrium (LD) Analysis

Interaction effects between every two SNPs across the whole genome for growth traits were calculated using GMAT (version: 1.01, Chao Ning, Beijing China) software [22]. Then, the SNP–SNP networks with significant epistatic effects for the studied traits were drawn using the epiNet option within epiSNP (version: 4.2, Yang Da, St. Paul, MN, USA) software [24].
The solid spine method in Haploview software (version: 4.2, Mark Daly, Cambridge, UK) [25] was used to predict the independent LD block.

2.5. Identification of Candidate Genes

Functional genes within 1 Mbp centered on each significant SNP were annotated as candidate genes. Identified potential genes were searched using the Ensemble Sus scrofa 11.1 reference genome [26]. Pig QTLdb [27] was used to annotate significant SNPs located in previously mapped QTLs in pigs. Additionally, the GeneCards [28] and NCBI [29] databases were used to query gene functions and determine promising candidates.

3. Results

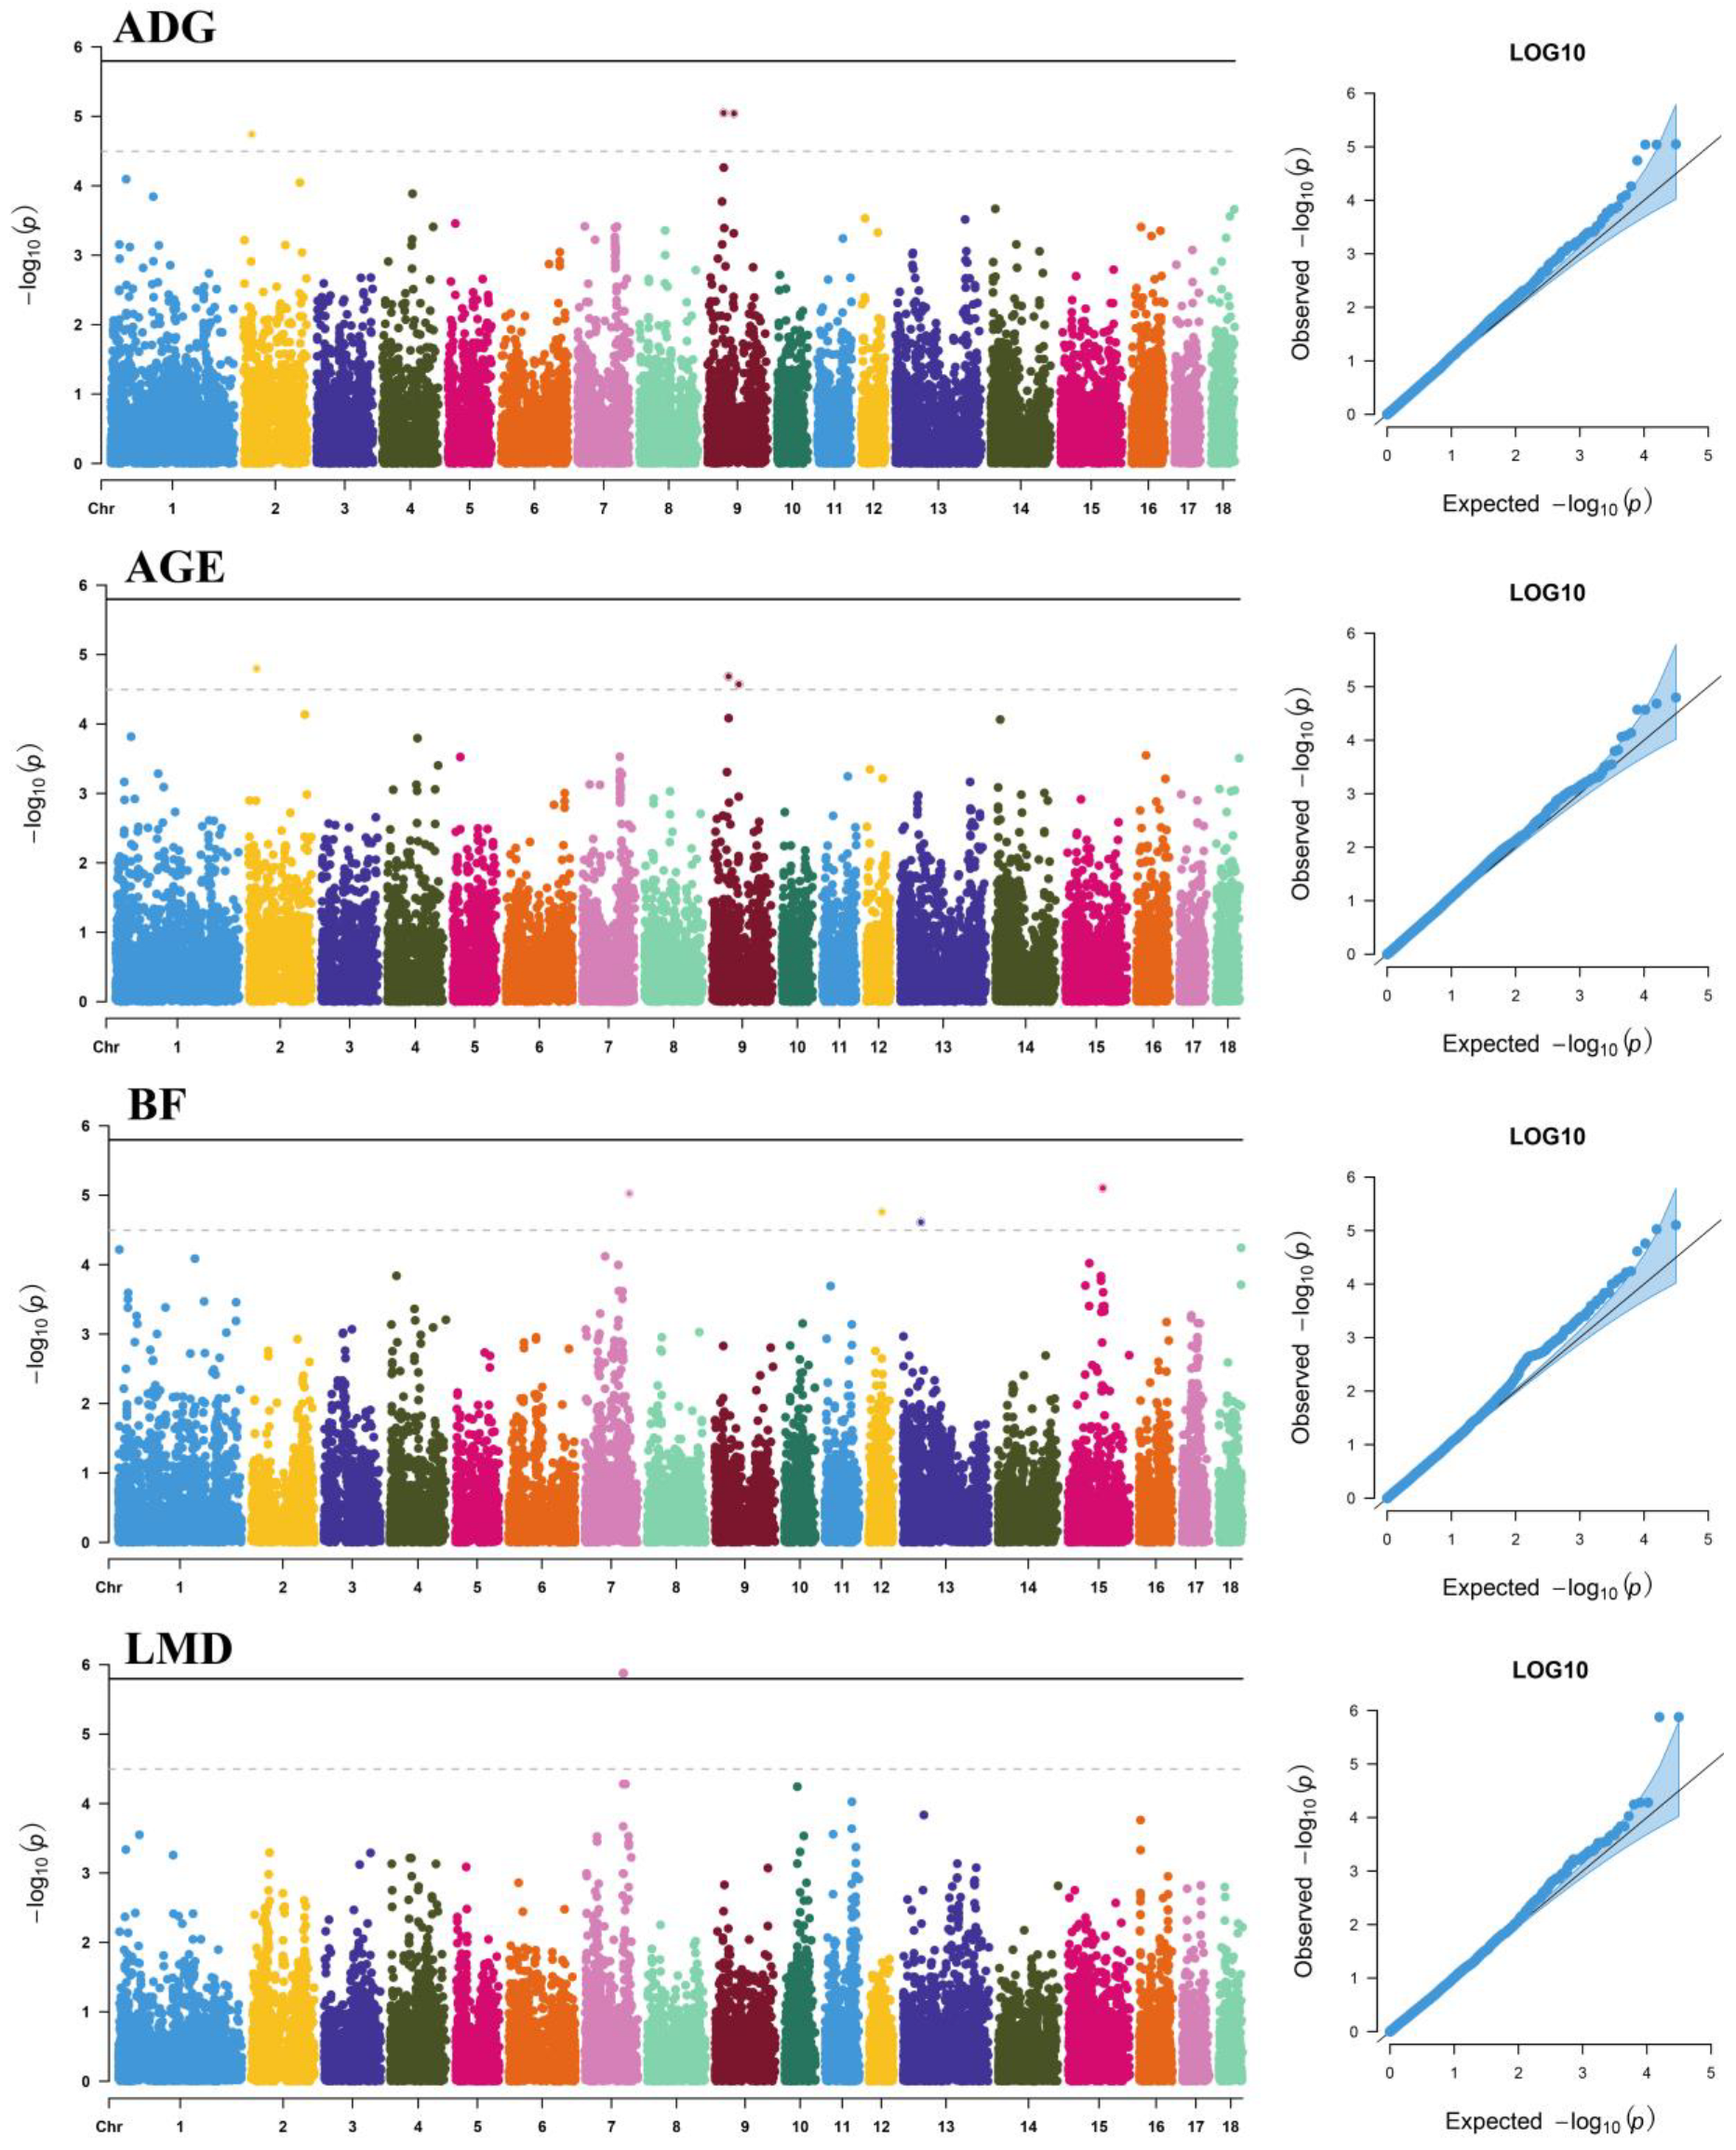
3.1. Additive Effects

A total number of 10 SNPs that surpassed the suggestive significance level were detected as being associated with one of the studied traits (Table 2); a Manhattan plot of the −log10 (p-values) of SNP additive effects is shown in Figure 1. Notice that three SNPs are significantly associated with more than one growth trait, indicating that they exert pleiotropic effects on multiple growth traits. These significant SNPs explained 2.49%, 3.02%, 3.18%, and 1.96% DEBV variance for ADG, AGE, BF, and LMD, respectively. When comparing previously reported QTLs, eight of ten significant SNPs were located in the reported QTL regions (Table S1). The remaining two additive SNPs, CNCB10001620 (Sus scrofa chromosome (SSC) 2: 20310474) and CNCB10006791 (SSC9: 67900715), have not been reported previously in the literature and are likely to be potential novel loci for growth traits in pigs.

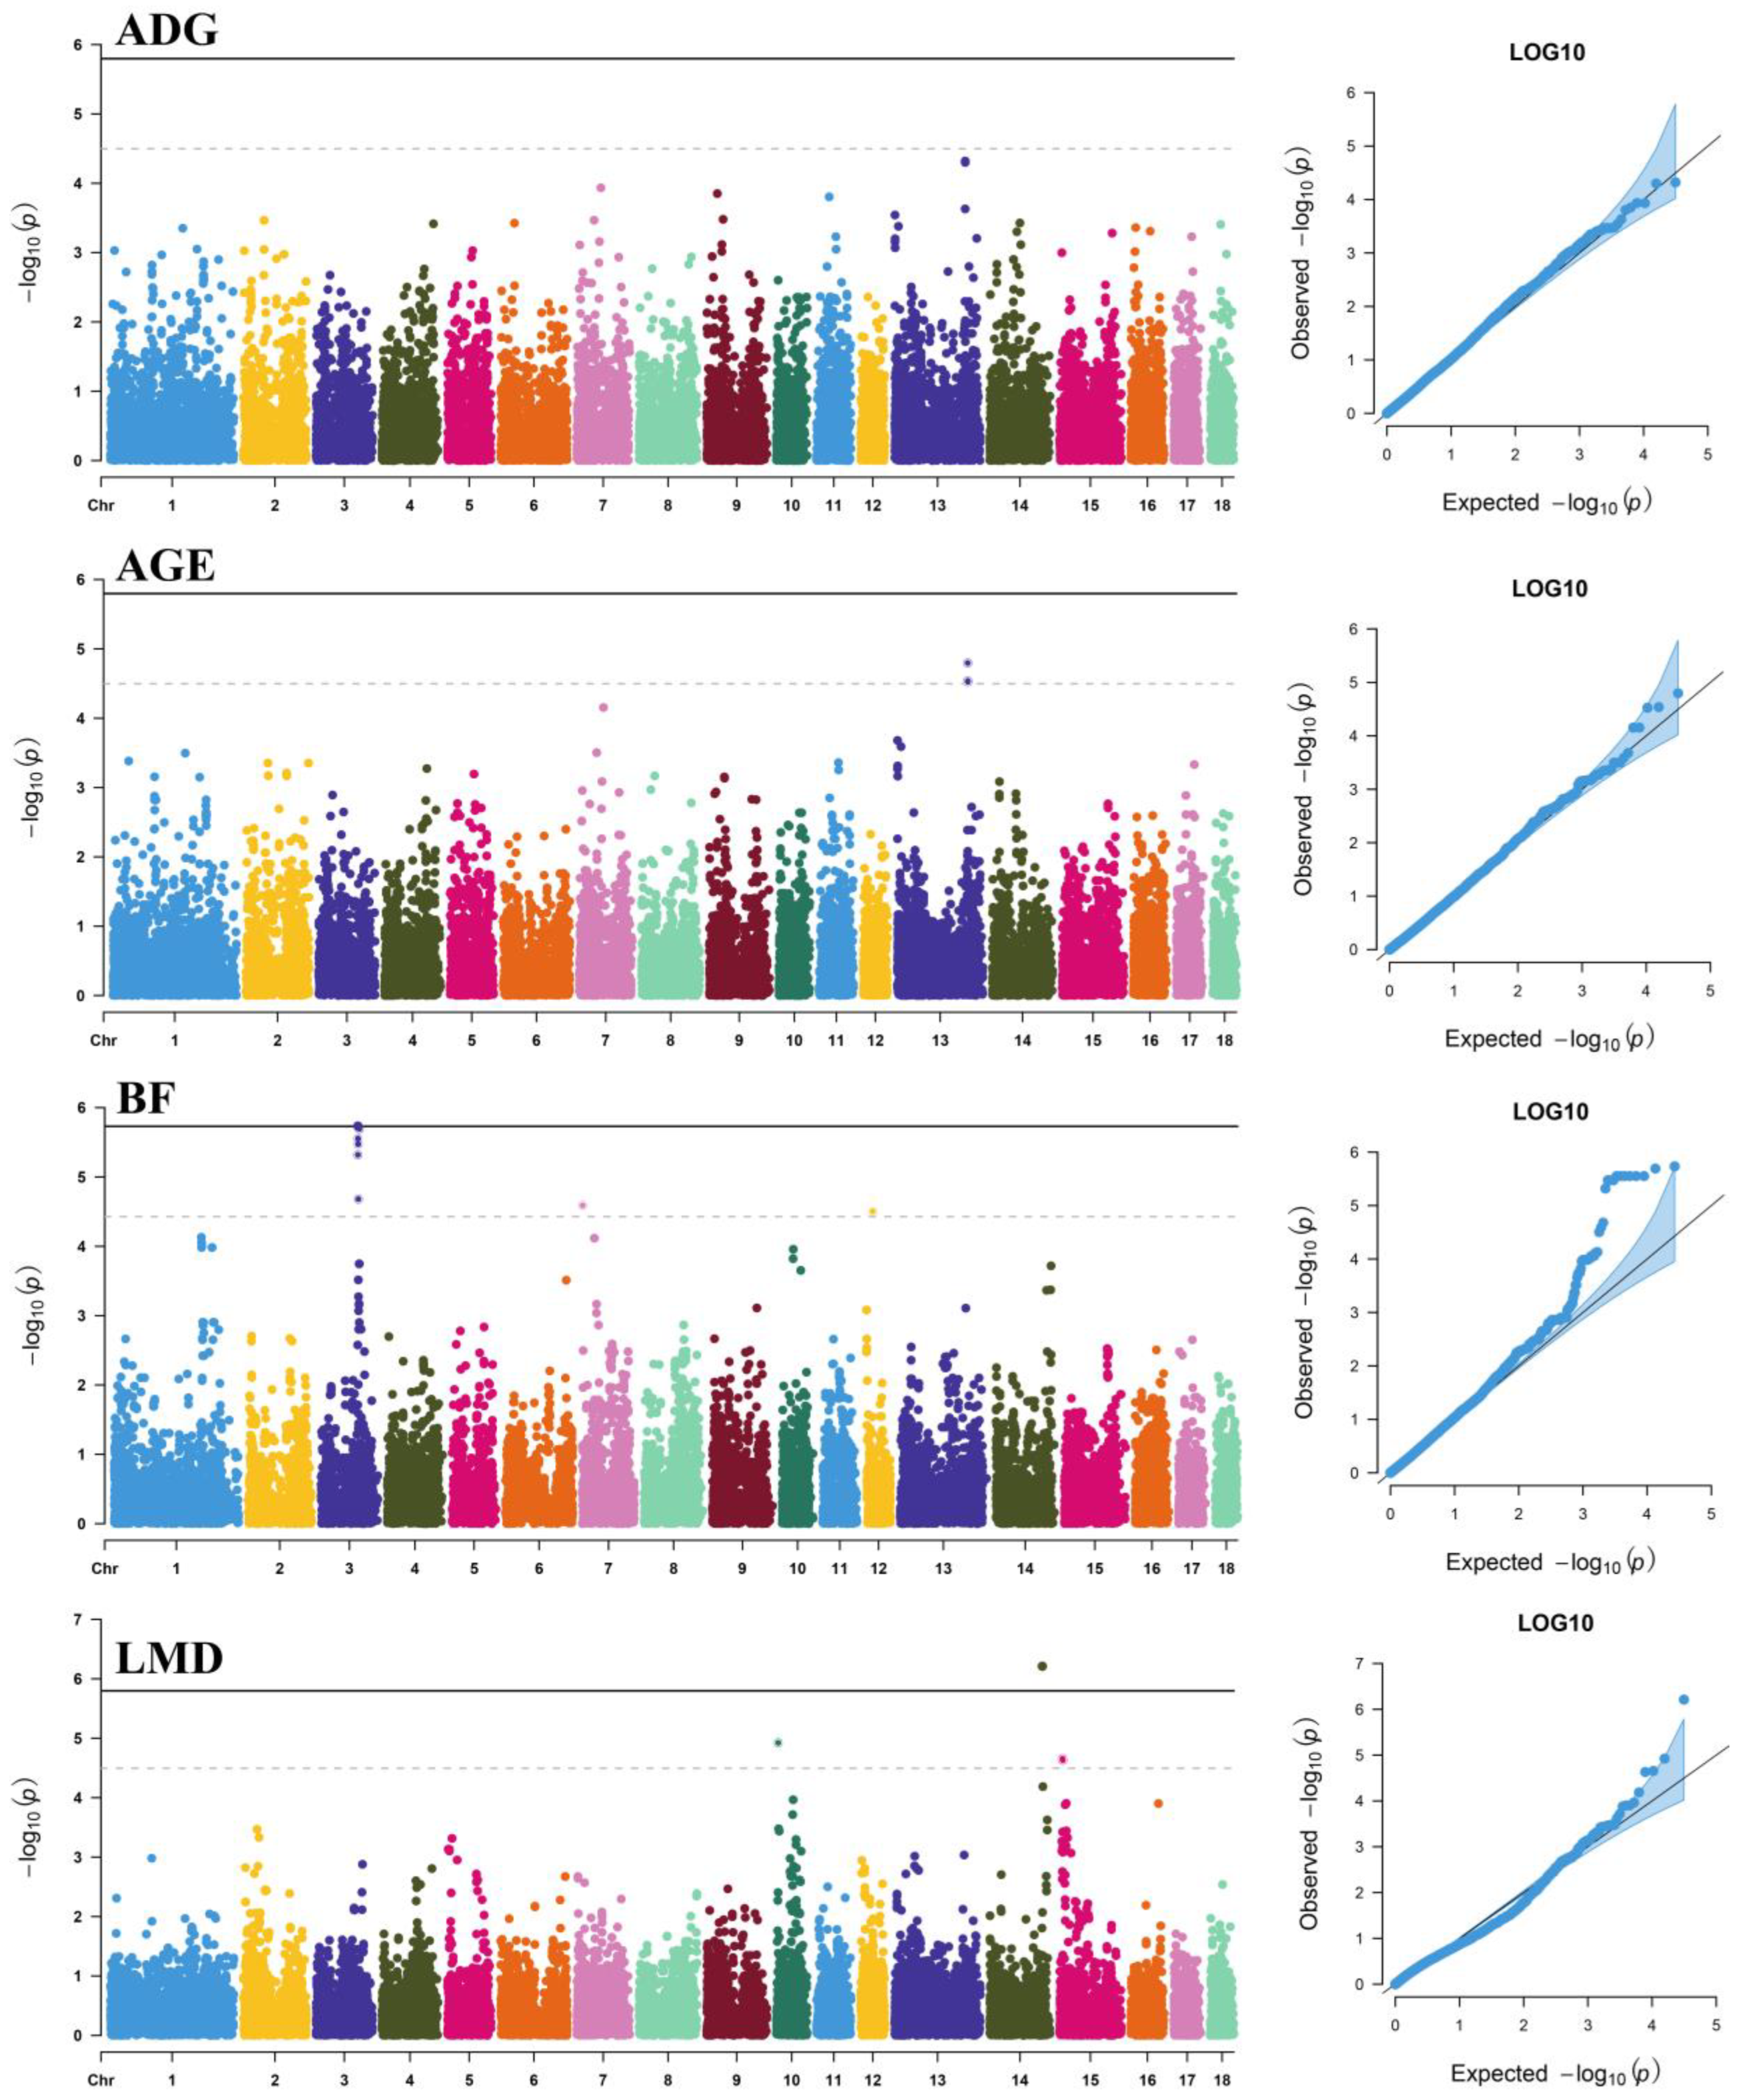
3.2. Dominance Effects

In summary, we also detected 22 SNPs associated with one of the tested studied traits (Table 3), and the p-values of the GWAS results were visualized using Manhattan plots and Q-Q plots (Figure 2). These significant SNPs explained 2.24%, 13.26%, and 4.08% DEBV variance for AGE, BF, and LMD, respectively. When comparing reported QTLs, 16 significant SNPs were located in the identified QTL regions (Table S2). The remaining six dominance SNPs have not been reported in pigs and are likely to be potential novel loci for growth traits. Additionally, we detected a haplotype block that spanned 492 kb (Figure S1) in BF containing 11 significant SNPs.

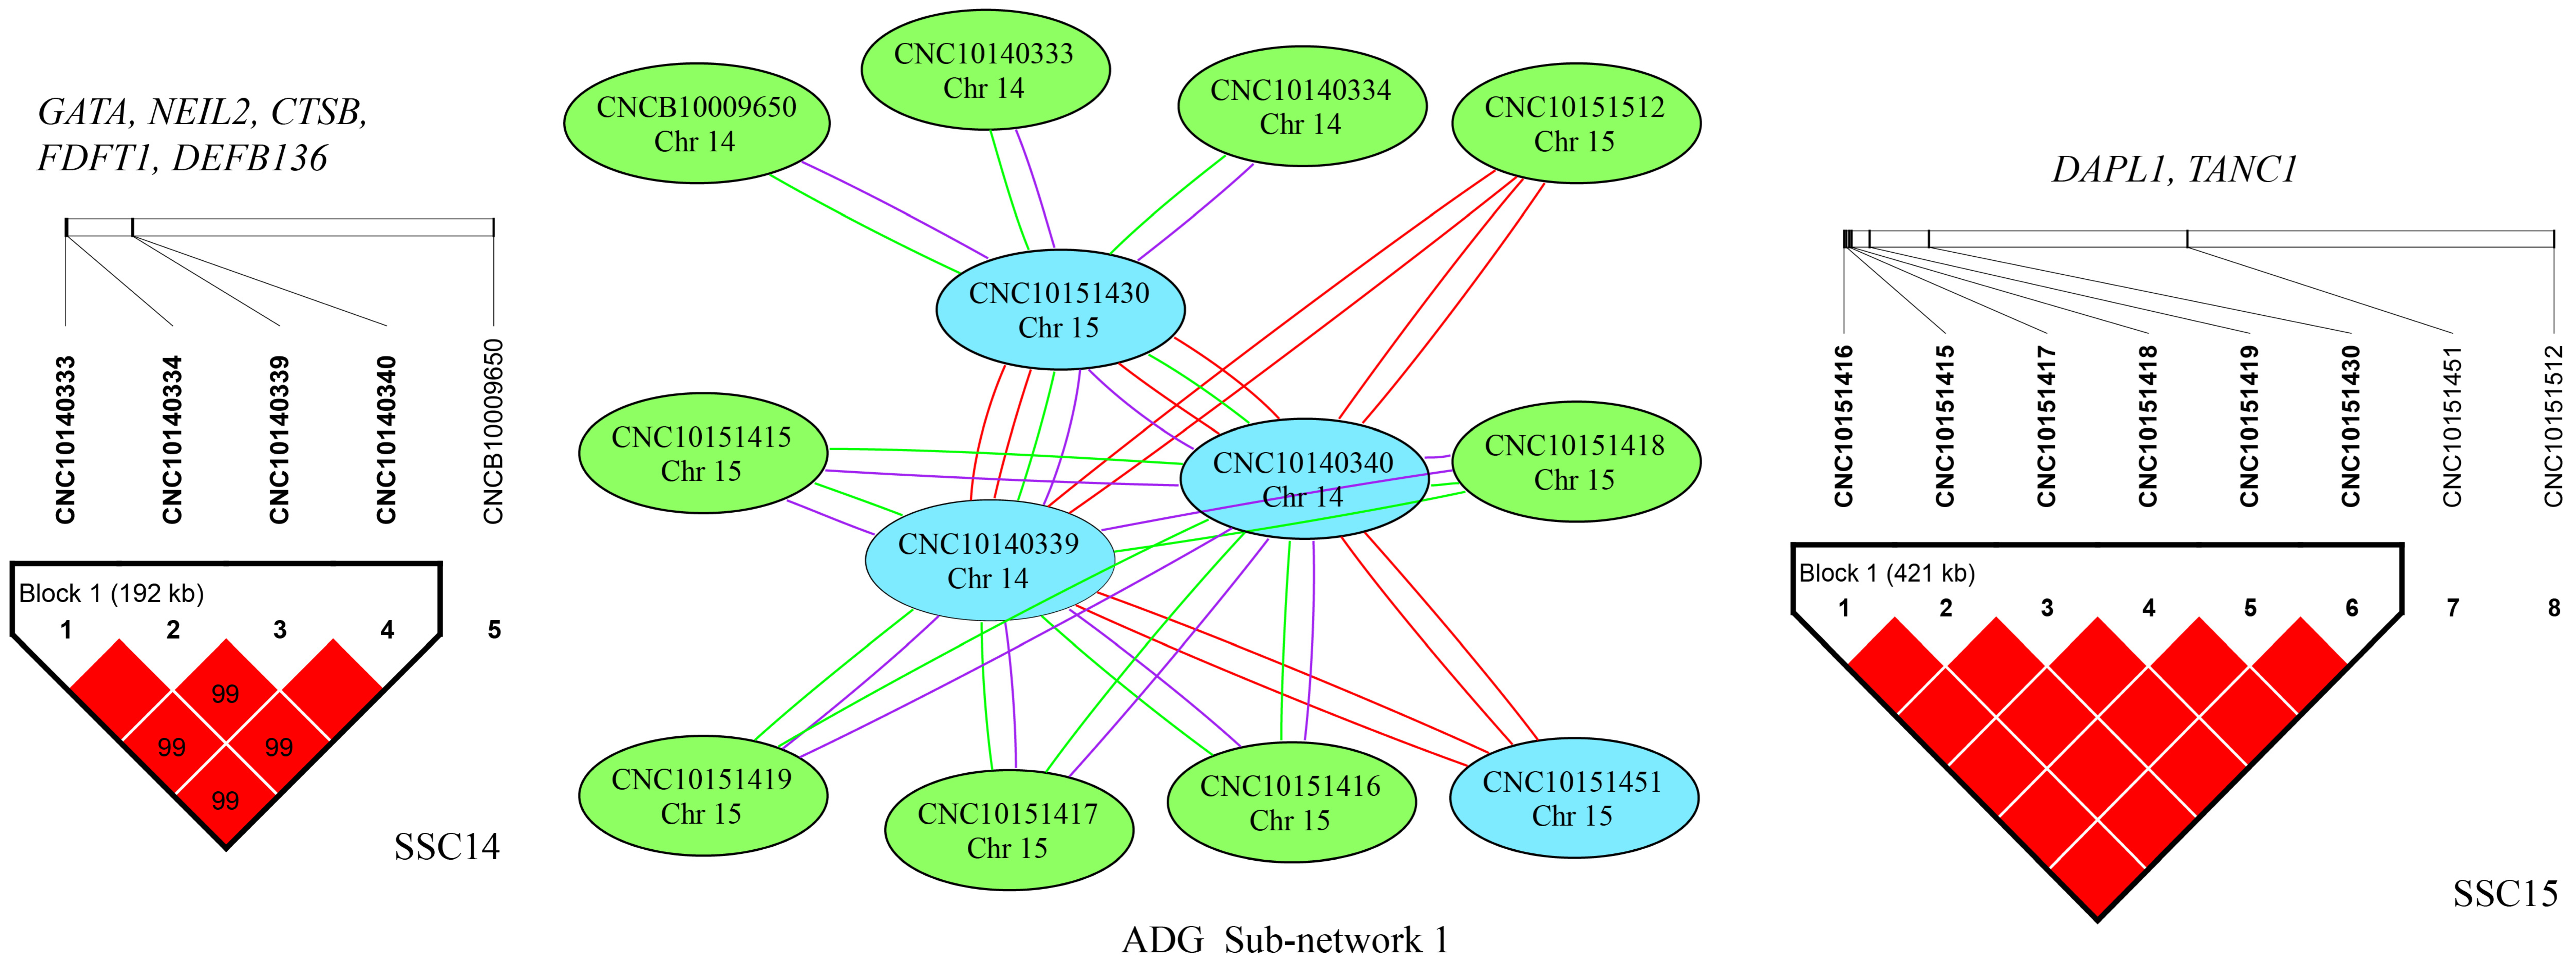
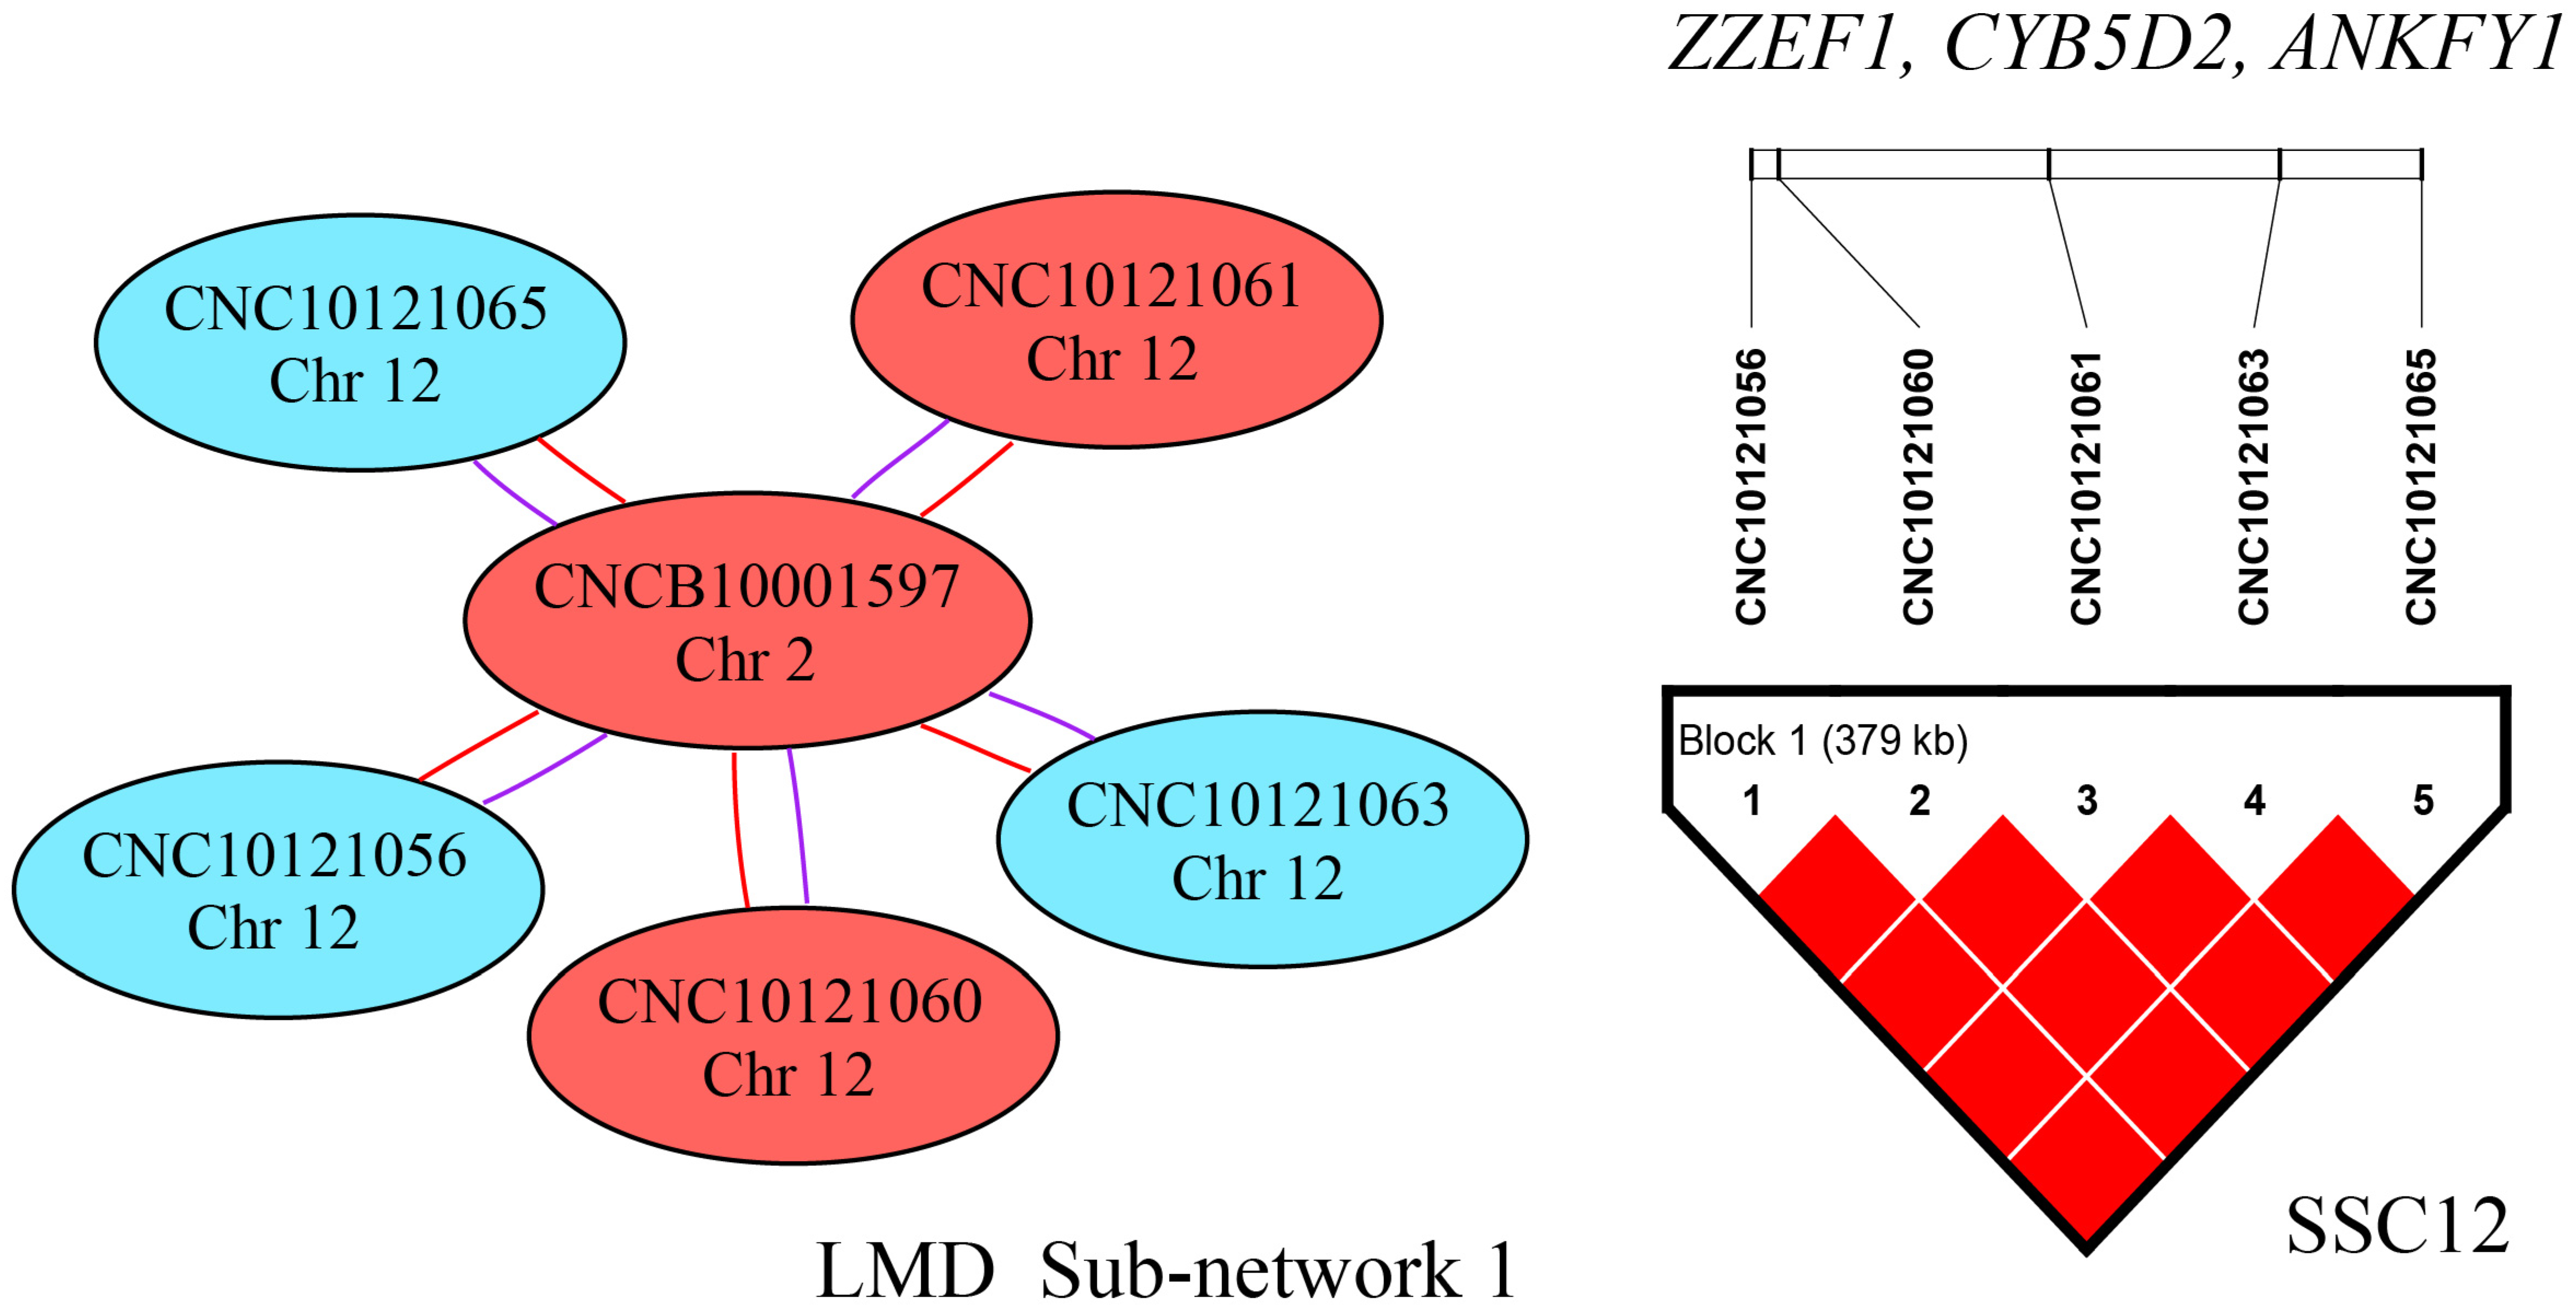
3.3. Epistatic Analysis

After cleaning, 287, 355, and 163 pairs of SNPs were significantly associated with ADG, AGE, and LMD, respectively (Table 4), while for BF, no significant SNP pairs were detached. Of these significant SNP–SNP interactions, 43.21–49.08% exhibited an A × A interaction, 32.52–38.03% exhibited an A × D interaction, and 17.18–23.00% exhibited a D × D interaction.
To investigate the complicated mechanism of epistasis on growth traits, SNP–SNP networks were constructed for each trait by EPISNP3 [24]. The epistatic interaction sub-networks that contained more than three nodes are shown in Supplementary Figures S2–S9. There were three, five, and three networks detected for ADG, AGE, and LMD, respectively.
For ADG, sub-network 1 was the largest one and contained 28 pairs of SNP–SNP interactions between SSC14 and SSC15, which indicated interactions between the two chromosomes (Figure 3). These interactions detected between SSC14 and SSC15 involved five SNPs on SSC14 and eight SNPs on SSC15, which spanned 192 kb (from 14.93 Mbp to 15.12 Mbp) and 422 kb (from 65.71 Mbp to 66.13 Mbp), respectively. According to gene annotation, we found that there were five genes in the 192 kb region on SSC14 and two genes in the 422 kb region on SSC15. Several SNPs in the same LD block on one chromosome appeared in sub-networks 2, 3, 4, and 5, which interacted with a single SNP on another chromosome. More details can be found in Figures S2–S5.
Interestingly, for AGE, sub-network 1 contained 28 pairs of SNP–SNP interaction effects between SSC14 and SSC15, which was the same as ADG sub-network 1, except for one more SNP on SSC14 (Figure 4). These interactions detected between SSC14 and SSC15 involved five SNPs and eight SNPs respectively, which spanned 192 kb (from 14.93 Mbp to 15.12 Mbp) and 422 kb (from 65.71 Mbp to 66.13 Mbp). There were five genes in the 192 kb region on SSC14 and two genes in the region on SSC15. Several SNPs in the same LD block on one chromosome can be found in sub-networks 2 and 3, which interacted with a single SNP on another chromosome. More details can be found in Figures S6 and S7.
For LMD, we detected 10 significant SNP–SNP interaction effects. These interactions were A × A interactions or A × D interactions, which implicated an interaction between SSC2 and SSC12 (Figure 5). The interactions occurred between five SNPs in a single LD block on SSC12. Multiple SNPs in the same LD block on one chromosome were located in sub-networks 2 and 3, which interacted with a single SNP on another chromosome. More details are shown in Figures S8 and S9.

4. Discussion

To eliminate the contribution of information from relatives, which may be significantly associated with the trait analyzed rather than the phenotype, the deregressed EBV (DEBV) was calculated for each individual [30]. DEBV, especially, could take full advantage of the information available on genotyped animals and their relatives, which may properly correct the bias introduced by simply pooling or averaging data information and explaining heterogeneous variance [20]. Therefore, in this study, DEBVs obtained from genetic evaluations were used as response variables to improve the detecting power of GWAS. In recent years, much GWAS research has used DEBVs as pseudo-phenotypes, particularly in work on livestock animals [31,32].
Many significant additive and dominance associations were discovered or involved genomic regions previously reported in the literature. Surprisingly, our study identified a number of novel loci associated with dominance effects on growth traits. SNP–SNP networks of epistatic interactions directly revealed the relationships between SNP effects, which could aid in understanding genetic bias with respect to growth traits.
In this study, the SNP–SNP interactions which occurred on the same chromosome were discovered as interactions between two SNPs on the same chromosome. However, remarkably, these may have been haplotype effects and not interactions [33]. Meanwhile, only interactions involving 10 animals in each genotype combination were considered in order to increase the power of detaching interactions [34]. Then, the results were filtered according to these criteria and large numbers of interactions were identified.
Due to the negative genetic correlation between ADG and AGE, the analysis of these two traits used different modeling approaches to detect candidate genes for growth traits. As a result, some commonly detected signals and some differences were also found as well. There were three significant additive SNPs detected for both ADG and AGE, while, partially overlapped with these, there were SNPs identified as being significantly associated with ADG in Yorkshire and Pietrain pigs [2,35]. The CD55 molecule (CD55) gene, which plays an important role in adipocyte development and could affect the growth rates of animals by regulating adipocyte production, was identified in nearby candidate SNPs (CNCB10006791 and CNCB10006792) [36,37]. The nuclear receptor interacting protein 1 (NRIP1) gene encodes a nuclear protein also known as receptor-interacting protein 140 (RIP140), which was identified as a candidate gene for AGE with dominant effect. RIP140 is widely expressed and is involved in regulating lipid and glucose metabolism and fat cell regulation [38,39,40,41]. The KH RNA binding domain-containing, signal transduction-associated 2 (KHDRBS2) gene encodes an RNA-binding protein, which is involved in mediating uterine endometrial stroma progenitor development [42]. Studies have shown that KHDRBS2 is associated with number of teats in Yorkshire pigs [43] and with reproductive traits in Polish commercial pig breeds [44]. Meanwhile, the farnesyl-diphosphate farnesyltransferase 1 (FDFT1) gene was reported as being associated with growth rate through the muscle transcriptome in Iberian pigs [45].
For BF, the thyroid hormone receptor interactor 11 (TRIP11) gene encodes a protein product that interacts with thyroid hormone receptor β, which functions in regulating lipid metabolism [46] and was also found to be associated with intramuscular fat content in a Meishan × Duroc crossbred population [47]. The musashi homolog 2 (MIS2) gene encodes an RNA-binding protein and plays a central role in controlling feed intake and feeding behavior in mammals [48,49]. A haplotype block that spanned 492 kb among significant dominance SNPs was harbored in a reported BF QTL in Duroc, Yorkshire, and Pietrain pigs [50]. Our study increased the power of QTL detection and narrowed the QTL locations using high-density chip arrays and large sample size.
As for LMD, the vertnin (VRTN) gene is known to affect the variation in vertebral number, and, furthermore, an allele of VRTN affects the length of the longissimus muscle, as reported in [51,52]. Interestingly, two significant additive SNPs within or nearby VRTN was found in the current study to be associated with LMD. In addition, the Zinc Finger E-Box Binding Homeobox 2 (ZEB2) gene was proved to play a role in skeletal muscle differentiation in pluripotent stem cells [53]. Although it has not been reported in pigs, it would be worth seeking to verify it in the future. Additionally, considering the complexity of implementing a breeding program, the results obtained here may not be sufficient for effective incorporation into programs, though they could be combined with other omics data, such as proteomics and metabolomics data.

5. Conclusions

In conclusion, 32 significant SNPs—10 for additive and 22 for dominance effects—and many epistatic interactions were identified for one of four growth traits in a purebred Duroc population through a GWAS fitting additive and non-additive genetic effects. Furthermore, 46 candidate genes with potential functions in muscle development, fat deposition, and regulation of cell growth were considered as candidates for growth traits, including CD55 and NRIP1 for AGE and ADG, TRIP11 and MIS2 for BF, and VRTN and ZEB2 for LMD, respectively. This study presents novel putative causative variants and genes for future pig breeding programs, which may be used in developing trait-specific marker-assisted selection models.

Supplementary Materials

The following supporting information can be downloaded at: https://www.mdpi.com/article/10.3390/genes13081454/s1, Table S1: The additive QTL regions detected in the current study overlapped with previous studies; Table S2: The dominance QTL regions detected in the current study overlapped with previous studies; Figure S1: Linkage disequilibrium (LD) blocks in the significant region on SSC3 for BF; Figure S2: Sub-network 2 for ADG and the LD information; Figure S3: Sub-network 3 for ADG and the LD information; Figure S4: Sub-network 4 for ADG and the LD information; Figure S5: Sub-network 5 for ADG and the LD information; Figure S6: Sub-network 2 for AGE and the LD information; Figure S7: Sub-network 3 for AGE and the LD information; Figure S8: Sub-network 2 for LMD and the LD information; Figure S9: Sub-network 3 for LMD and the LD information.

Author Contributions

J.L. (Jianfeng Liu) and M.L. conceived and designed the experiment. Y.X., W.L., R.M. and Y.Z. performed the experiments. S.L., W.X., J.L. (Jian Liu) and C.W. collected the samples and recorded the phenotypes. Y.X. and S.L. analyzed the data and wrote the manuscript. J.L. (Jianfeng Liu) and L.Z. revised the manuscript. All authors have read and agreed to the published version of the manuscript.

Funding

This work was supported by the China Agriculture Research System of MOF and MARA (No. CARS-35-01A), the National Natural Science Foundation of China (No. 31972563), the Beijing Municipal Commission of Science and Technology (No. Z211100004621005), and Major Science and Technology R&D Projects in Jiangxi Province (No. 20194ABC28008).

Institutional Review Board Statement

This study was approved by approved by the Institutional Animal Care and Use Committee (IACUC) of China Agricultural University (permit No. DK996).

Informed Consent Statement

Not applicable.

Data Availability Statement

The datasets generated and/or analyzed in the current study are not publicly available, since the studied population consists of the nucleus herd of Jiangxi Zhengbang Breeding Co., Ltd., but are available from the corresponding author upon reasonable request.

Acknowledgments

The High-Performance Computing Platform of China Agricultural University is acknowledged for allowing the use of its computational resources.

Conflicts of Interest

The authors have read the journal’s guidelines and declare the following competing interests: the co-authors W.X., J.L., and C.W. are employees of Jiangxi Zhengbang Breeding Co., Ltd., which partially participated in the analysis process. The other authors have no competing interest.

References

  1. Wang, K.; Liu, D.; Hernandez-Sanchez, J.; Chen, J.; Liu, C.; Wu, Z.; Fang, M.; Li, N. Genome wide association analysis reveals new production trait genes in a male Duroc population. PLoS ONE 2015, 10, e0139207. [Google Scholar] [CrossRef] [PubMed]
  2. Tang, Z.; Xu, J.; Yin, L.; Yin, D.; Zhu, M.; Yu, M.; Li, X.; Zhao, S.; Liu, X. Genome-wide association study reveals candidate genes for growth relevant traits in pigs. Front. Genet. 2019, 10, 302. [Google Scholar] [CrossRef]
  3. Hoque, M.A.; Suzuki, K.; Kadowaki, H.; Shibata, T.; Oikawa, T. Genetic parameters for feed efficiency traits and their relationships with growth and carcass traits in Duroc pigs. J. Anim. Breed. Genet. 2007, 124, 108–116. [Google Scholar] [CrossRef]
  4. Bolormaa, S.; Pryce, J.E.; Zhang, Y.; Reverter, A.; Barendse, W.; Hayes, B.J.; Goddard, M.E. Non-additive genetic variation in growth, carcass and fertility traits of beef cattle. Genet Sel. Evol. 2015, 47, 26. [Google Scholar] [CrossRef] [PubMed]
  5. Vitezica, Z.G.; Reverter, A.; Herring, W.; Legarra, A. Dominance and epistatic genetic variances for litter size in pigs using genomic models. Genet. Sel. Evol. 2018, 50, 71. [Google Scholar] [CrossRef] [PubMed]
  6. Maurano, M.T.; Humbert, R.; Rynes, E.; Thurman, R.E.; Haugen, E.; Wang, H.; Reynolds, A.P.; Sandstrom, R.; Qu, H.; Brody, J.; et al. Systematic localization of common disease-associated variation in regulatory DNA. Science 2012, 337, 1190–1195. [Google Scholar] [CrossRef]
  7. Wang, Y.; Ding, X.; Tan, Z.; Xing, K.; Yang, T.; Wang, Y.; Sun, D.; Wang, C. Genome-wide association study for reproductive traits in a Large White pig population. Anim. Genet. 2018, 49, 127–131. [Google Scholar] [CrossRef]
  8. Akanno, E.C.; Chen, L.; Abo-Ismail, M.K.; Crowley, J.J.; Wang, Z.; Li, C.; Basarab, J.A.; MacNeil, M.D.; Plastow, G.S. Genome-wide association scan for heterotic quantitative trait loci in multi-breed and crossbred beef cattle. Genet. Sel. Evol. 2018, 50, 48. [Google Scholar] [CrossRef]
  9. Zepeda-Batista, J.L.; Núñez-Domínguez, R.; Ramírez-Valverde, R.; Jahuey-Martínez, F.J.; Herrera-Ojeda, J.B.; Parra-Bracamonte, G.M. Discovering of Genomic Variations Associated to Growth Traits by GWAS in Braunvieh Cattle. Genes 2021, 12, 1666. [Google Scholar] [CrossRef]
  10. Duan, X.; An, B.; Du, L.; Chang, T.; Liang, M.; Yang, B.G.; Xu, L.; Zhang, L.; Li, J.; E, G.; et al. Genome-Wide Association Analysis of Growth Curve Parameters in Chinese Simmental Beef Cattle. Animals 2021, 11, 192. [Google Scholar] [CrossRef]
  11. Abousoliman, I.; Reyer, H.; Oster, M.; Murani, E.; Mohamed, I.; Wimmers, K. Genome-Wide Analysis for Early Growth-Related Traits of the Locally Adapted Egyptian Barki Sheep. Genes 2021, 12, 1243. [Google Scholar] [CrossRef] [PubMed]
  12. Fu, L.; Jiang, Y.; Wang, C.; Mei, M.; Zhou, Z.; Jiang, Y.; Song, H.; Ding, X. A genome-wide association study on feed efficiency related traits in Landrace pigs. Front. Genet. 2020, 11, 692. [Google Scholar] [CrossRef] [PubMed]
  13. Wu, P.; Wang, K.; Yang, Q.; Zhou, J.; Chen, D.; Liu, Y.; Ma, J.; Tang, Q.; Jin, L.; Xiao, W. Whole-genome re-sequencing association study for direct genetic effects and social genetic effects of six growth traits in Large White pigs. Sci. Rep. 2019, 9, 9667. [Google Scholar] [CrossRef]
  14. Ruan, D.; Zhuang, Z.; Ding, R.; Qiu, Y.; Zhou, S.; Wu, J.; Xu, C.; Hong, L.; Huang, S.; Zheng, E.; et al. Weighted Single-Step GWAS Identified Candidate Genes Associated with Growth Traits in a Duroc Pig Population. Genes 2021, 12, 117. [Google Scholar] [CrossRef]
  15. Su, G.; Christensen, O.F.; Ostersen, T.; Henryon, M.; Lund, M.S. Estimating additive and non-additive genetic variances and predicting genetic merits using genome-wide dense single nucleotide polymorphism markers. PLoS ONE 2012, 7, e45293. [Google Scholar] [CrossRef] [PubMed]
  16. Aliloo, H.; Pryce, J.E.; González-Recio, O.; Cocks, B.G.; Hayes, B.J. Accounting for dominance to improve genomic evaluations of dairy cows for fertility and milk production traits. Genet. Sel. Evol. 2016, 48, 8. [Google Scholar] [CrossRef] [PubMed]
  17. Chang, C.C.; Chow, C.C.; Tellier, L.C.; Vattikuti, S.; Purcell, S.M.; Lee, J.J. Second-generation PLINK: Rising to the challenge of larger and richer datasets. GigaScience 2015, 4, 7. [Google Scholar] [CrossRef]
  18. Browning, B.L.; Zhou, Y.; Browning, S.R. A one-penny imputed genome from next-generation reference panels. Am. J. Hum. Genet. 2018, 103, 338–348. [Google Scholar] [CrossRef]
  19. Madsen, P.; Jensen, J.; Labouriau, R.; Christensen, O.F.; Sahana, G. DMU—A Package for Analyzing Multivariate Mixed Models in quantitative Genetics and Genomics. In Proceedings of the 10th World Congress of Genetics Applied to Livestock Production, Vancouver, BC, Canada, 17–22 August 2014; pp. 18–22. [Google Scholar]
  20. Garrick, D.J.; Taylor, J.F.; Fernando, R.L. Deregressing estimated breeding values and weighting information for genomic regression analyses. Genet. Sel. Evol. 2009, 41, 55. [Google Scholar] [CrossRef]
  21. Mei, Q.; Fu, C.; Li, J.; Zhao, S.; Xiang, T. blupADC: An R package and shiny toolkit for comprehensive genetic data analysis in animal and plant breeding. bioRxiv 2021. [Google Scholar] [CrossRef]
  22. Wang, D.; Tang, H.; Liu, J.F.; Xu, S.; Zhang, Q.; Ning, C. Rapid epistatic mixed-model association studies by controlling multiple polygenic effects. Bioinformatics 2020, 36, 4833–4837. [Google Scholar] [CrossRef] [PubMed]
  23. Shim, H.; Chasman, D.I.; Smith, J.D.; Mora, S.; Ridker, P.M.; Nickerson, D.A.; Krauss, R.M.; Stephens, M. A multivariate genome-wide association analysis of 10 LDL subfractions, and their response to statin treatment, in 1868 Caucasians. PLoS ONE 2015, 10, e0120758. [Google Scholar] [CrossRef] [PubMed]
  24. Ma, L.; Runesha, H.B.; Dvorkin, D.; Garbe, J.R.; Da, Y. Parallel and serial computing tools for testing single-locus and epistatic SNP effects of quantitative traits in genome-wide association studies. BMC Bioinform. 2008, 9, 315. [Google Scholar] [CrossRef] [PubMed]
  25. Barrett, J.C.; Fry, B.; Maller, J.; Daly, M.J. Haploview: Analysis and visualization of LD and haplotype maps. Bioinformatics 2005, 21, 263–265. [Google Scholar] [CrossRef] [PubMed]
  26. Howe, K.L.; Achuthan, P.; Allen, J.; Allen, J.; Alvarez-Jarreta, J.; Amode, M.R.; Armean, I.M.; Azov, A.G.; Bennett, R.; Bhai, J.; et al. Ensembl 2021. Nucleic Acids Res. 2021, 49, D884–D891. [Google Scholar] [CrossRef]
  27. Hu, Z.-L.; Park, C.A.; Reecy, J.M. Bringing the Animal QTLdb and CorrDB into the future: Meeting new challenges and providing updated services. Nucleic Acids Res. 2022, 50, D956–D961. [Google Scholar] [CrossRef]
  28. Safran, M.; Rosen, N.; Twik, M.; BarShir, R.; Stein, T.I.; Dahary, D.; Fishilevich, S.; Lancet, D. The GeneCards Suite. In Practical Guide to Life Science Databases; Abugessaisa, I., Kasukawa, T., Eds.; Springer Nature Singapore: Singapore, 2022; pp. 27–56. [Google Scholar]
  29. Coordinators, N.R. Database resources of the National Center for Biotechnology Information. Nucleic Acids Res. 2016, 44, D7–D19. [Google Scholar] [CrossRef]
  30. Zhang, Z.; Chen, Z.; Ye, S.; He, Y.; Huang, S.; Yuan, X.; Chen, Z.; Zhang, H.; Li, J. Genome-Wide Association Study for Reproductive Traits in a Duroc Pig Population. Animals 2019, 9, 732. [Google Scholar] [CrossRef]
  31. Lee, J.; Kang, J.H.; Kim, J.M. Bayes Factor-Based Regulatory Gene Network Analysis of Genome-Wide Association Study of Economic Traits in a Purebred Swine Population. Genes 2019, 10, 293. [Google Scholar] [CrossRef]
  32. Sutera, A.M.; Moscarelli, A.; Mastrangelo, S.; Sardina, M.T.; Di Gerlando, R.; Portolano, B.; Tolone, M. Genome-Wide Association Study Identifies New Candidate Markers for Somatic Cells Score in a Local Dairy Sheep. Front. Genet. 2021, 12, 643531. [Google Scholar] [CrossRef]
  33. Zhang, H.; Yu, J.-Q.; Yang, L.-L.; Kramer, L.M.; Zhang, X.-Y.; Na, W.; Reecy, J.M.; Li, H. Identification of genome-wide SNP-SNP interactions associated with important traits in chicken. BMC Genom. 2017, 18, 892. [Google Scholar] [CrossRef] [PubMed]
  34. Kramer, L.M.; Ghaffar, M.A.; Koltes, J.E.; Fritz-Waters, E.R.; Mayes, M.S.; Sewell, A.D.; Weeks, N.T.; Garrick, D.J.; Fernando, R.L.; Ma, L.; et al. Epistatic interactions associated with fatty acid concentrations of beef from angus sired beef cattle. BMC Genom. 2016, 17, 891. [Google Scholar] [CrossRef] [PubMed]
  35. Meng, Q.; Wang, K.; Liu, X.; Zhou, H.; Xu, L.; Wang, Z.; Fang, M. Identification of growth trait related genes in a Yorkshire purebred pig population by genome-wide association studies. Asian-Australas. J. Anim. Sci. 2017, 30, 462–469. [Google Scholar] [CrossRef] [PubMed]
  36. Gronthos, S.; Franklin, D.M.; Leddy, H.A.; Robey, P.G.; Storms, R.W.; Gimble, J.M. Surface protein characterization of human adipose tissue-derived stromal cells. J. Cell. Physiol. 2001, 189, 54–63. [Google Scholar] [CrossRef] [PubMed]
  37. Festy, F.; Hoareau, L.; Bes-Houtmann, S.; Péquin, A.-M.; Gonthier, M.-P.; Munstun, A.; Hoarau, J.J.; Césari, M.; Roche, R. Surface protein expression between human adipose tissue-derived stromal cells and mature adipocytes. Histochem. Cell Biol. 2005, 124, 113–121. [Google Scholar] [CrossRef]
  38. Christian, M.; Kiskinis, E.; Debevec, D.; Leonardsson, G.; White, R.; Parker, M.G. RIP140-targeted repression of gene expression in adipocytes. Mol. Cell Biol. 2005, 25, 9383–9391. [Google Scholar] [CrossRef]
  39. Ho, P.C.; Chuang, Y.S.; Hung, C.H.; Wei, L.N. Cytoplasmic receptor-interacting protein 140 (RIP140) interacts with perilipin to regulate lipolysis. Cell Signal. 2011, 23, 1396–1403. [Google Scholar] [CrossRef]
  40. Hochberg, I.; Tran, Q.T.; Barkan, A.L.; Saltiel, A.R.; Chandler, W.F.; Bridges, D. Gene Expression Signature in Adipose Tissue of Acromegaly Patients. PLoS ONE 2015, 10, e0129359. [Google Scholar] [CrossRef]
  41. Shen, Y.; Cohen, J.L.; Nicoloro, S.M.; Kelly, M.; Yenilmez, B.; Henriques, F.; Tsagkaraki, E.; Edwards, Y.J.K.; Hu, X.; Friedline, R.H.; et al. CRISPR-delivery particles targeting nuclear receptor-interacting protein 1 (Nrip1) in adipose cells to enhance energy expenditure. J. Biol. Chem. 2018, 293, 17291–17305. [Google Scholar] [CrossRef]
  42. Saatcioglu, H.D.; Kano, M.; Horn, H.; Zhang, L.; Samore, W.; Nagykery, N.; Meinsohn, M.C.; Hyun, M.; Suliman, R.; Poulo, J.; et al. Single-cell sequencing of neonatal uterus reveals an Misr2+ endometrial progenitor indispensable for fertility. eLife 2019, 8, e46349. [Google Scholar] [CrossRef]
  43. Verardo, L.L.; Silva, F.F.; Lopes, M.S.; Madsen, O.; Bastiaansen, J.W.; Knol, E.F.; Kelly, M.; Varona, L.; Lopes, P.S.; Guimarães, S.E. Revealing new candidate genes for reproductive traits in pigs: Combining Bayesian GWAS and functional pathways. Genet. Sel. Evol. 2016, 48, 9. [Google Scholar] [CrossRef] [PubMed]
  44. Gurgul, A.; Jasielczuk, I.; Ropka-Molik, K.; Semik-Gurgul, E.; Pawlina-Tyszko, K.; Szmatoła, T.; Szyndler-Nędza, M.; Bugno-Poniewierska, M.; Blicharski, T.; Szulc, K.; et al. A genome-wide detection of selection signatures in conserved and commercial pig breeds maintained in Poland. BMC Genet. 2018, 19, 95. [Google Scholar] [CrossRef] [PubMed]
  45. Ayuso, M.; Fernández, A.; Núñez, Y.; Benítez, R.; Isabel, B.; Barragán, C.; Fernández, A.I.; Rey, A.I.; Medrano, J.F.; Cánovas, Á.; et al. Comparative Analysis of Muscle Transcriptome between Pig Genotypes Identifies Genes and Regulatory Mechanisms Associated to Growth, Fatness and Metabolism. PLoS ONE 2015, 10, e0145162. [Google Scholar] [CrossRef] [PubMed]
  46. Zhu, X.; Cheng, S.Y. New insights into regulation of lipid metabolism by thyroid hormone. Curr. Opin. Endocrinol. Diabetes Obes. 2010, 17, 408–413. [Google Scholar] [CrossRef] [PubMed]
  47. Sato, S.; Hasebe, H.; Sato, S.; Asahi, Y.; Hayashi, T.; Kobayashi, E.; Sugimoto, Y. High-resolution physical mapping and construction of a porcine contig spanning the intramuscular fat content QTL. Anim. Genet. 2006, 37, 113–120. [Google Scholar] [CrossRef]
  48. Do, D.N.; Strathe, A.B.; Ostersen, T.; Jensen, J.; Mark, T.; Kadarmideen, H.N. Genome-Wide Association Study Reveals Genetic Architecture of Eating Behavior in Pigs and Its Implications for Humans Obesity by Comparative Mapping. PLoS ONE 2013, 8, e71509. [Google Scholar] [CrossRef]
  49. Sakakibara, S.; Nakamura, Y.; Satoh, H.; Okano, H. Rna-binding protein Musashi2: Developmentally regulated expression in neural precursor cells and subpopulations of neurons in mammalian CNS. J. Neurosci. 2001, 21, 8091–8107. [Google Scholar] [CrossRef]
  50. Fowler, K.E.; Pong-Wong, R.; Bauer, J.; Clemente, E.J.; Reitter, C.P.; Affara, N.A.; Waite, S.; Walling, G.A.; Griffin, D.K. Genome wide analysis reveals single nucleotide polymorphisms associated with fatness and putative novel copy number variants in three pig breeds. BMC Genom. 2013, 14, 784. [Google Scholar] [CrossRef]
  51. Nakano, H.; Sato, S.; Uemoto, Y.; Kikuchi, T.; Shibata, T.; Kadowaki, H.; Kobayashi, E.; Suzuki, K. Effect of VRTN gene polymorphisms on Duroc pig production and carcass traits, and their genetic relationships. Anim. Sci. J. 2015, 86, 125–131. [Google Scholar] [CrossRef]
  52. Hirose, K.; Mikawa, S.; Okumura, N.; Noguchi, G.; Fukawa, K.; Kanaya, N.; Mikawa, A.; Arakawa, A.; Ito, T.; Hayashi, Y.; et al. Association of swine vertnin (VRTN) gene with production traits in Duroc pigs improved using a closed nucleus breeding system. Anim. Sci. J. 2013, 84, 213–221. [Google Scholar] [CrossRef]
  53. Di Filippo, E.S.; Costamagna, D.; Giacomazzi, G.; Cortés-Calabuig, Á.; Stryjewska, A.; Huylebroeck, D.; Fulle, S.; Sampaolesi, M. Zeb2 Regulates Myogenic Differentiation in Pluripotent Stem Cells. Int. J. Mol. Sci. 2020, 21, 2525. [Google Scholar] [CrossRef] [PubMed]
Figure 1. Manhattan plots and Q-Q plots of SNP additive effects for average daily gain (ADG), adjusted age at 100 kg (AGE), backfat thickness at 100 kg (BF), and loin muscle depth at 100 kg (LMD) traits of Duroc pigs. The X-axis shows the physical positions of the SNPs on each chromosome; the Y-axis shows the significance levels (−log10 p-values). The solid line indicates genome-wide significance (p < 1.59 × 10⁻⁶); the dashed line shows suggestive significance (p < 3.19 × 10⁻⁵). The Q-Q plots show the observed vs. expected log p-values.
Genes 13 01454 g001
Figure 2. Manhattan plots and Q-Q plots of SNP dominance effects for average daily gain (ADG), adjusted age at 100 kg (AGE), backfat thickness at 100 kg (BF), and loin muscle depth at 100 kg (LMD) traits. The X-axis shows the physical position of SNPs on each chromosome; the Y-axis shows the significance levels (−log10 p-values). The solid line indicates genome-wide significance (p < 1.59 × 10⁻⁶); the dashed line shows suggestive significance (p < 3.19 × 10⁻⁵). The Q-Q plots show the observed vs. expected log p-values.
Genes 13 01454 g002
Figure 3. Epistatic sub-network 1 among SNPs affecting ADG and the related LD information. The color of a node represents the p-value of an interaction (p < 1 × 10−12 = red; p < 1 × 10−11 = blue; p < 1 × 10−10 = green). The color of connecting lines between circles indicates the type of epistatic effect (A × A = red; A × D = purple; D × D = green). The genes located in the LD block are listed.
Genes 13 01454 g003
Figure 4. Epistatic sub-network 1 among SNPs affecting AGE and the related LD information. The color of a node represents the p-value of an interaction (p < 1 × 10−12 = red; p < 1 × 10−11 = blue; p < 1 × 10−10 = green). The color of the connecting lines between circles indicates the type of epistatic effect (A × A = red; A × D = purple; D × D = green). The genes located in the LD regions are listed.
Genes 13 01454 g004
Figure 5. Epistatic sub-network 1 among SNPs affecting LMD and the related LD information. The color of a node represents the p-value of an interaction (p < 1 × 10−12 = red; p < 1 × 10−11 = blue; p < 1 × 10−10 = green). The color of connecting lines between circles indicates the type of epistatic effect (A × A = red; A × D = purple; D × D = green). The genes located in the LD regions are listed.
Genes 13 01454 g005
Table 1. Summary statistics for ADG, AGE, BF, and LMD.
TraitMean ± SDMax.Min.C.V. (%)Number of Records
ADG (g/day)661.66 ± 57.52824.94512.039.101854
AGE (day)152.33 ± 13.86195.30121.2217.671854
BF (mm)9.58 ± 1.6915.545.708.691847
LMD (mm)54.87 ± 6.5274.0127.3511.891651
AGE: adjusted age at 100 kg, AGE: average daily gain, BF: backfat thickness, LMD: loin muscle depth, SD: standard deviation, Max.: maximum, Min.: minimum, C.V.: coefficient of variation.
Table 2. Summary information of significant additive SNPs for ADG, AGE, BF, and LMD.
TraitSNPChrLocation (bp)AlleleMAFp-Value% DEBVNearest GeneDistance (bp)
ADGCNCB10006667941,538,619C/T0.0868.95 × 10−60.83HTR3BWithin
CNCB10006791967,900,715C/T0.0869.09 × 10−60.83CD55+32,354
CNCB10006792967,967,237A/G0.0869.09 × 10−60.83CD55−6855
AGECNCB10001620220,310,474A/G0.2161.59 × 10−50.78//
CNCB10006667941,538,619C/T0.0862.07 × 10−50.76HTR3BWithin
CNCB10006791967,900,715C/T0.0862.68 × 10−50.74CD55+32,354
CNCB10006792967,967,237A/G0.0862.68 × 10−50.74CD55−6855
BFCNCB100107921589,052,971G/A0.0517.89 × 10−60.84//
CNCB100055917113,533,476T/G0.0749.44 × 10−60.82TRIP11Within
rs814339191233,673,968G/A0.1161.74 × 10−50.77MSI2Within
CNCB100085921345,621,675G/A0.0722.45 × 10−50.75PRICKLE2Within
LMDrs709317845797,614,602T/G0.4691.33 × 10−60.98VRTN+105
CNC11071978797,615,897A/G0.4691.33 × 10−60.98VRTNWithin
AGE: adjusted age at 100 kg, AGE: average daily gain, BF: backfat thickness, LMD: loin muscle depth, Chr: chromosome, Location: SNP position in Ensembl, % DEBV: percentage of DEBV variance explained by the SNP, Distance: distance between the nearest gene and the corresponding significant SNP.
Table 3. Summary information of significant dominance SNPs for AGE, BF, and LMD.
TraitSNPChrLocation (bp)AlleleMAFp-Value% DEBVNearest GeneDistance (bp)
AGECNC1013371813179,900,741C/T0.2851.60 × 10−50.78NRIP1Within
rs8144157413180,051,342T/C0.3642.90 × 10−50.73NRIP1−135,116
rs8086734313180,004,272G/A0.3622.98 × 10−50.73NRIP1−88,046
BFrs81373550393,497,234A/G0.0611.85 × 10−60.95TTC7AWithin
CNCB10002800397,223,093T/C0.1492.03 × 10−60.95ZFP36L2+19,999
rs81373610393,655,118A/C0.0602.80 × 10−60.92MCFD2+22,100
rs80966590393,722,940C/T0.0602.80 × 10−60.92SOCS5−54,462
rs81475091393,732,314G/A0.0602.80 × 10−60.92SOCS5−45,088
rs81299554393,771,724A/G0.0602.80 × 10−60.92SOCS5−5678
rs81373642393,828,846C/T0.0602.80 × 10−60.92SOCS5Within
rs81373648393,902,023G/T0.0602.80 × 10−60.92SOCS5Within
rs81373727394,084,767A/G0.0603.36 × 10−60.91TMEM247+17,743
rs81373716394,110,331G/A0.0603.36 × 10−60.91TMEM247+43,307
rs81373744394,163,788G/A0.0603.36 × 10−60.91EPAS1−3971
rs81213041393,394,317G/A0.0594.80 × 10−60.88STPG4Within
rs81373880394,599,697C/T0.0752.09 × 10−50.76PRKCEWithin
CNC100700167834,427A/C0.4302.57 × 10−50.74GMDSWithin
CNC101203381216,082,351T/C0.4883.13 × 10−50.73MRC2Within
LMDrs8078539514133,966,414A/G0.0876.14 × 10−71.04LHPPWithin
CNCB10007305104,667,593A/G0.0941.19 × 10−50.80//
rs81304718157,424,079C/T0.0912.21 × 10−50.76ZEB2−74,800
CNCB10010367158,203,810A/G0.0602.34 × 10−50.75ARHGAP15Within
AGE: adjusted age at 100 kg, AGE: average daily gain, BF: backfat thickness, LMD: loin muscle depth, Chr: chromosome, Location: SNP position in Ensembl, % DEBV: percentage of DEBV variance explained by the SNP, Distance: distance between the nearest gene and the corresponding significant SNP.
Table 4. Summary information of significant epistatic effects for growth traits.
TraitsNA × AA × DD × D
ADG2871249766
AGE35515913561
LMD163805330
AGE: adjusted age at 100 kg, AGE: average daily gain, LMD: loin muscle depth, N: number of significant SNP pairs, A × A: number of additive-by-additive interactions, A × D: number of additive-by-dominance interactions, D × D: number of dominance-by-dominance interactions.
Publisher’s Note: MDPI stays neutral with regard to jurisdictional claims in published maps and institutional affiliations.

