Article

Mapping-by-Sequencing Reveals Genomic Regions Associated with Seed Quality Parameters in Brassica napus

1
Genetics and Genomics of Plants, CeBiTec & Faculty of Biology, Bielefeld University, Universitätsstraße 27, 33615 Bielefeld, Germany
2
Graduate School DILS, Bielefeld Institute for Bioinformatics Infrastructure (BIBI), Faculty of Technology, Bielefeld University, Universitätsstraße 27, 33615 Bielefeld, Germany
3
Plant Biotechnology and Bioinformatics, Institute of Plant Biology & Braunschweig Integrated Centre of Systems Biology (BRICS), TU Braunschweig, Mendelssohnstraße 4, 38106 Braunschweig, Germany
4
Deutsche Saatveredelung AG, Weissenburger Straße 5, 59557 Lippstadt, Germany
5
NPZ Innovation GmbH, Hohenlieth-Hof 1, 24363 Holtsee, Germany
6
Department of Plant Breeding, Justus Liebig University, Heinrich-Buff-Ring 26-32, 35392 Giessen, Germany
*
Author to whom correspondence should be addressed.
These authors contributed equally to this work.
Genes 2022, 13(7), 1131; https://doi.org/10.3390/genes13071131
Submission received: 31 May 2022 / Revised: 15 June 2022 / Accepted: 22 June 2022 / Published: 23 June 2022
(This article belongs to the Collection Feature Papers: 'Plant Genetics and Genomics' Section)

Abstract

:
Rapeseed (Brassica napus L.) is an important oil crop and has the potential to serve as a highly productive source of protein. This protein exhibits an excellent amino acid composition and has high nutritional value for humans. Seed protein content (SPC) and seed oil content (SOC) are two complex quantitative and polygenic traits which are negatively correlated and assumed to be controlled by additive and epistatic effects. A reduction in seed glucosinolate (GSL) content is desired as GSLs cause a stringent and bitter taste. The goal here was the identification of genomic intervals relevant for seed GSL content and SPC/SOC. Mapping by sequencing (MBS) revealed 30 and 15 new and known genomic intervals associated with seed GSL content and SPC/SOC, respectively. Within these intervals, we identified known but also so far unknown putatively causal genes and sequence variants. A 4 bp insertion in the MYB28 homolog on C09 shows a significant association with a reduction in seed GSL content. This study provides insights into the genetic architecture and potential mechanisms underlying seed quality traits, which will enhance future breeding approaches in B. napus.

Graphical Abstract

1. Introduction

Rapeseed (Brassica napus, AACC, 2n = 38) is the second-most important oil crop after soybean [1]. B. napus is a recent allopolyploid species formed by hybridization between Brassica oleracea and Brassica rapa followed by chromosome doubling approximately 7500 years ago [2]. In addition to its nutritionally beneficial seed oil composition, B. napus has the potential to serve as a high-quality protein source. Protein-rich meals are a valuable “by-product” of oil extraction and can be used as a viable source for plant protein due to their high quality and production volume [3]. The increasing demand for vegetable protein and oil requires breeding efforts in order to enhance the yield of protein and oil in B. napus. Dry mature seeds are composed of oil (45–50% w/w) and protein (20–25% w/w) [4]. Lipids are stored in the form of triacylglycerols (TAGs) in oil bodies, while seed storage proteins such as cruciferin and napin are deposited in protein bodies or protein storage vacuoles [3]. B. napus protein isolates revealed a high bioavailability comparable to animal proteins such as eggs or collagen and are rich in essential amino acids (EAAs) [5]. The high amounts of bioactive compounds in vegetable proteins have beneficial effects on human health by, e.g., preventing hypertension, scavenging free radicals, and reducing cardiovascular risk factors [6].
The presence of off-taste components such as glucosinolates (GSLs) hinders the use of B. napus protein for food production [6]. GSLs are sulfur- and nitrogen-rich secondary plant metabolites [7] and their degradation products have various functions, e.g., in protection against pathogens and herbivorous insects [8,9,10,11]. GSLs are classified into aliphatic, aromatic or indolic GSLs and their biosynthesis can be divided into three stages: (I) chain elongation of selected precursor amino acids, (II) synthesis of the core GSL structure, and (III) secondary modifications of the amino acid side chain [12]. Transcriptional regulation of GSL biosynthesis is controlled by subgroup 12 of R2R3-MYB transcription factors [13,14,15,16,17,18]. In Arabidopsis thaliana, MYB28/HAG1 and MYB29/HAG3 positively regulate aliphatic GSL biosynthetic genes [15,17], while MYB34/ATR1, MYB51/HIG1, and MYB122/HIG2 control indolic GSL biosynthesis [14,16,18]. As aliphatic GSLs represent 91–94% of total seed GSL content, while indolic GSLs contribute 5–8% to the total seed GSL content in B. napus [19], the relevance of MYB28/HAG1 and MYB29/HAG3 homologs for controlling seed GSL content rises. In general, modern double low B. napus varieties display 10–15 µmol GSL per g seed instead of 60–100 µmol GSL per g seed in old varieties [4].
Three major loci controlling GSL content located on B. napus chromosome A09, C02, and C09 have been described [20,21,22,23,24]. These QTL are co-localized with the three homologs of A. thaliana MYB28 and have thus been proposed as candidate genes responsible for the phenotypic variation (PV) of GSL content [2,20,23]. The two homologs on chromosome C02 and C09 are absent in the B. napus Darmor-bzh reference genome sequence [2]. The deletion of these two MYB28 homologs was identified as the cause for low GSL content [20]. Additional candidate genes for lowering GSL content were identified in an analysis of various Brassica genome sequences [23]. However, the link between base-pair level sequence variations and seed GSL content has not been confirmed or analyzed in great detail yet.
Seed protein content (SPC) and seed oil content (SOC) are negatively correlated traits controlled by multiple genes assumingly involving epistatic and additive effects [25]. Consistent with the polygenic origin of SPC and SOC, several studies have reported different genomic intervals distributed across all linkage groups potentially involved in SPC/SOC control [26,27,28,29,30,31,32,33,34,35]. Major factors controlling SPC and SOC are additive effects ranging typically from 0.27 to 2.04% per individual QTL [25,30,31,33,34,35] and environmental conditions [26,35,36,37]. While the majority of previous studies reported frequently minor QTL, which explained individually ~1.2–19% of the PV in SPC and SOC [26,28,29,30,31,32,35], four studies reported less frequent major QTL explaining up to 20–30.2% of the PV [26,33,34,35]. The chromosomal positions of SOC QTL differ between B. napus cultivars [31,34,35,38].
Due to the agronomic and economic importance of SPC and SOC, better knowledge about the underlying regulatory network is of high relevance for future breeding strategies. The negative correlation of SPC and SOC challenges the breeding aim to simultaneously increase oil and protein content. Improvement of seed quality traits during breeding can be achieved by using the variability of naturally or induced mutations and interspecific hybridization among B. napus species [4]. However, breeding elite varieties, e.g., by backcrossing techniques can take years. The rapid development of high-throughput sequencing technologies promotes the application of approaches such as mapping by sequencing (MBS) for the rapid identification of causal mutation underlying a phenotype of interest [39,40]. MBS is a fast and cost-effective way to develop superior crop cultivars with desirable traits as demonstrated in various crops [41,42,43,44,45,46]. Reference genome sequences such as the B. napus Darmor-bzh reference genome sequence [2] provide the basis for MBS approaches. With the rise of third-generation sequencing technologies, long-read assemblies with a high continuity of B. napus cultivars such as Zheyou7 became recently available [47,48,49].
In this study, genomic intervals associated with SPC, SOC, and GSL content in B. napus were analyzed via MBS using a large segregating F2 population. This population was derived from a cross of the B. napus winter-type cultivars Lorenz and Janetzkis Schlesischer. Furthermore, candidate genes were identified by incorporating transcriptomic data sets. Association and gene expression studies indicated that a 4 bp insertion located in a MYB28 homolog on chromosome C09 is a major factor controlling seed GSL content. Sequence variants identified in here will facilitate the development of genetic markers for breeding programs in B. napus.

2. Materials and Methods

2.1. Plant Material and Trait Measurement

The phenotypically segregating F2 population, designated L-x-JS, consists of 2323 individuals and was derived from a cross between the parental lines Lorenz (P1) and Janetzkis Schlesischer (P2), both are B. napus winter-type rape varieties. Janetzkis Schlesischer (DOI: 10.25642/IPK/GBIS/288477) has a high seed GSL content of ~90 µmol/g FW and contains erucic acid. Lorenz is listed as a variety for diversity with the accession number RAW 2152 (https://pgrdeu-preview.ble.de/tsorten/steckbrief/id/551533 (accessed on 11 December 2020) and displays 00-quality. It has medium–high grain yields, high oil content and low GSL content (maintaining institute: Norddeutsche Pflanzenzucht Hans-Georg Lembke KG, DE005). A total of 1373 F2 individuals were planted in Granskevitz alias growing area 2 (SPC_A2) (GE, GPS: 54.526908°, 13.21998°) and 948 in Asendorf alias growing area 1 (SPC_A1) (GE, GPS: 52.7724145°, 9.0044643°). The plants were grown in accordance with German legislation. In total, 1951 F2 individuals of the L-x-JS F2 population were used for the genotype and phenotype analyses for seed GSL content, while 2315 individuals were used for SPC due to the higher variance of SPC.
Seeds were collected for the GSL, SPC and SOC measurements via near-infrared reflectance spectroscopy (NIRS) and analyzed in triplicates. The NIRS measurement was carried out with intact-seed samples. The measured trays were designed for high-throughput measurement of oil seed rape. Each tray requires a seed volume of about 2 cm3. The samples were scanned by a Polytec PSS-2121 diode array spectrometer (Polytec GmbH, Waldenbronn, Germany) with 256 pixels. Reflectance was measured in the range from 1100 to 2100 nm with a step size of 2 nm recorded with the software PSSHOP (Polytec) using DSV internal calibration. Calibration and validation procedures were carried out with several Software packages (SensoLogic GmbH, Norderstedt, Germany). Calibration performance was verified periodical with independent validation sets.
Individuals for sequencing were selected based on phenotypic data, DNA quality, and cultivation location. For the GSL pools, individuals grown in SPC_A1 and SPC_A2 were used to build the high- and the low-GSL pools. For the SPC pools, individuals grown in SPC_A2 were used to build the high and the low pool.

2.2. DNA Extraction and Pooling

Genomic DNA was extracted from leaf disks using the CTAB method [50]. The low-GSL pool consisted of 38 genotypes (GSL_L, <30.83 µmol/g dry weight), while the high-GSL pool contained 52 genotypes (GSL_H, >70 µmol/g dry weight).For growing area 2 (SPC_A2), 22 genotypes were used for the low protein pool (SPC_L_A2 low pool, <16.0% total dry mass) and 19 genotypes for the high protein pool (SPC_H_A2 high pool, >23.1% total dry mass). Library preparation and pooling strategy was performed as described before [41]. The GSL pools were sequenced on a HiSeq1500 in high-output mode using four lanes and the 2 × 100 PE scheme, while the SPC pools were sequenced on a HiSeq1500 in rapid mode using two lanes and the 2 × 150 PE scheme. Lorenz and Janetzkis Schlesischer were sequenced on a HiSeq1500 using the 2 × 150 PE scheme.

2.3. Mapping and Variant Calling

Read quality was checked with FastQC [51]. Reads were mapped via BWA-MEM v0.7 [52] to the B. napus Darmor-bzh v4.1 genome sequence [2] and the Zheyou7 assembly [47] (File S1). Default parameters were applied and the –M flag was set to avoid spurious mappings. Mapping statistics were calculated via the flagstat function of samtools [53] prior and past the following filtering step. Mappings were cleaned with samtools view -q 30 -b -F 0 × 900 -f 0 × 2 to remove low-quality alignments and reads without a properly mapped mate. The filtered BAM files were passed to GATK v3.8 [54,55,56] for the identification of a variant set based on hard filtering. BWA-MEM and GATK were chosen due to excellent performances in previous studies [41,57].

2.4. Generation of the “Gold Standard”for SNV Filtering

The workflow starts with the generation of a gold standard for SNV filtering, which contains SNVs which are homozygous in the parental genotypes and heterozygous in the reconstituted F1 (Files S2 and S3). First the reads of the parents were mapped to the B. napus Darmor-bzh genome sequence v4.1 and variants were called as described above. Next, coverage filters based on the BAM and VCF files were applied. BAM-derived coverage files were constructed as described in Pucker et al., 2018 [58]. A minimum coverage of 10 and a maximum coverage of 60 were determined to yield high-quality SNVs which are likely not affected by copy number variations (GitHub filter_parent_variants.py). The upper limit was chosen, because it represents twice the modal value of each file. Triallelic variants and variants present in both parents were excluded from further analyses as these are not contrasting between the pools (File S2) (GitHub combine_homo_VCFs_vs_Bn41.py).
The resulting set of homozygous SNVs of the parental genotypes was then screened for heterozygosity in a reconstituted F1 population (File S3) (GitHub filter_vcf_F1.py) to generate the final gold standard which contained 903,253 SNVs (Files S2 and S4) (GitHub merge_vcfs.py). The reconstituted F1 variant set comprises variants derived from all analyzed genomic sequencing data of our study. Only “heterozygous” variants, which showed an allele frequency between 0.2–0.8 against the B. napus Darmor-bzh genome sequence were used for the down-stream filtering (File S2).

2.5. Filter Raw Variants per Pool for Delta Allele Frequency (dAF) Calculation

A sophisticated filtering approach was applied to select only highly reliable SNVs for the downstream analyses (File S2). High-quality SNVs were extracted from the raw variants of each pool (GSL_L, GSL_H, SPC_H, SPC_L) by considering only SNV positions present in the gold standard (File S2) (GitHub filter_pools_vcfs_for_gold_standard.py). Only variants with a minimum 0.75-fold the average median coverage and a maximum coverage of 1.5-fold the average median coverage per pool were kept. This final set of variants of the high- and low-GSL and SPC_A2 pools, respectively, were used to calculate delta allele frequencies (dAFs) (Files S2, S5 and S6) (GitHub combine_single_VCFs_version3.py). The dAF is defined as the absolute difference between the allele frequency (AF) values from the two pools for a given variant position. Only biallelic variants are included for the calculation of dAFs to facilitate a reliable dAF estimation.

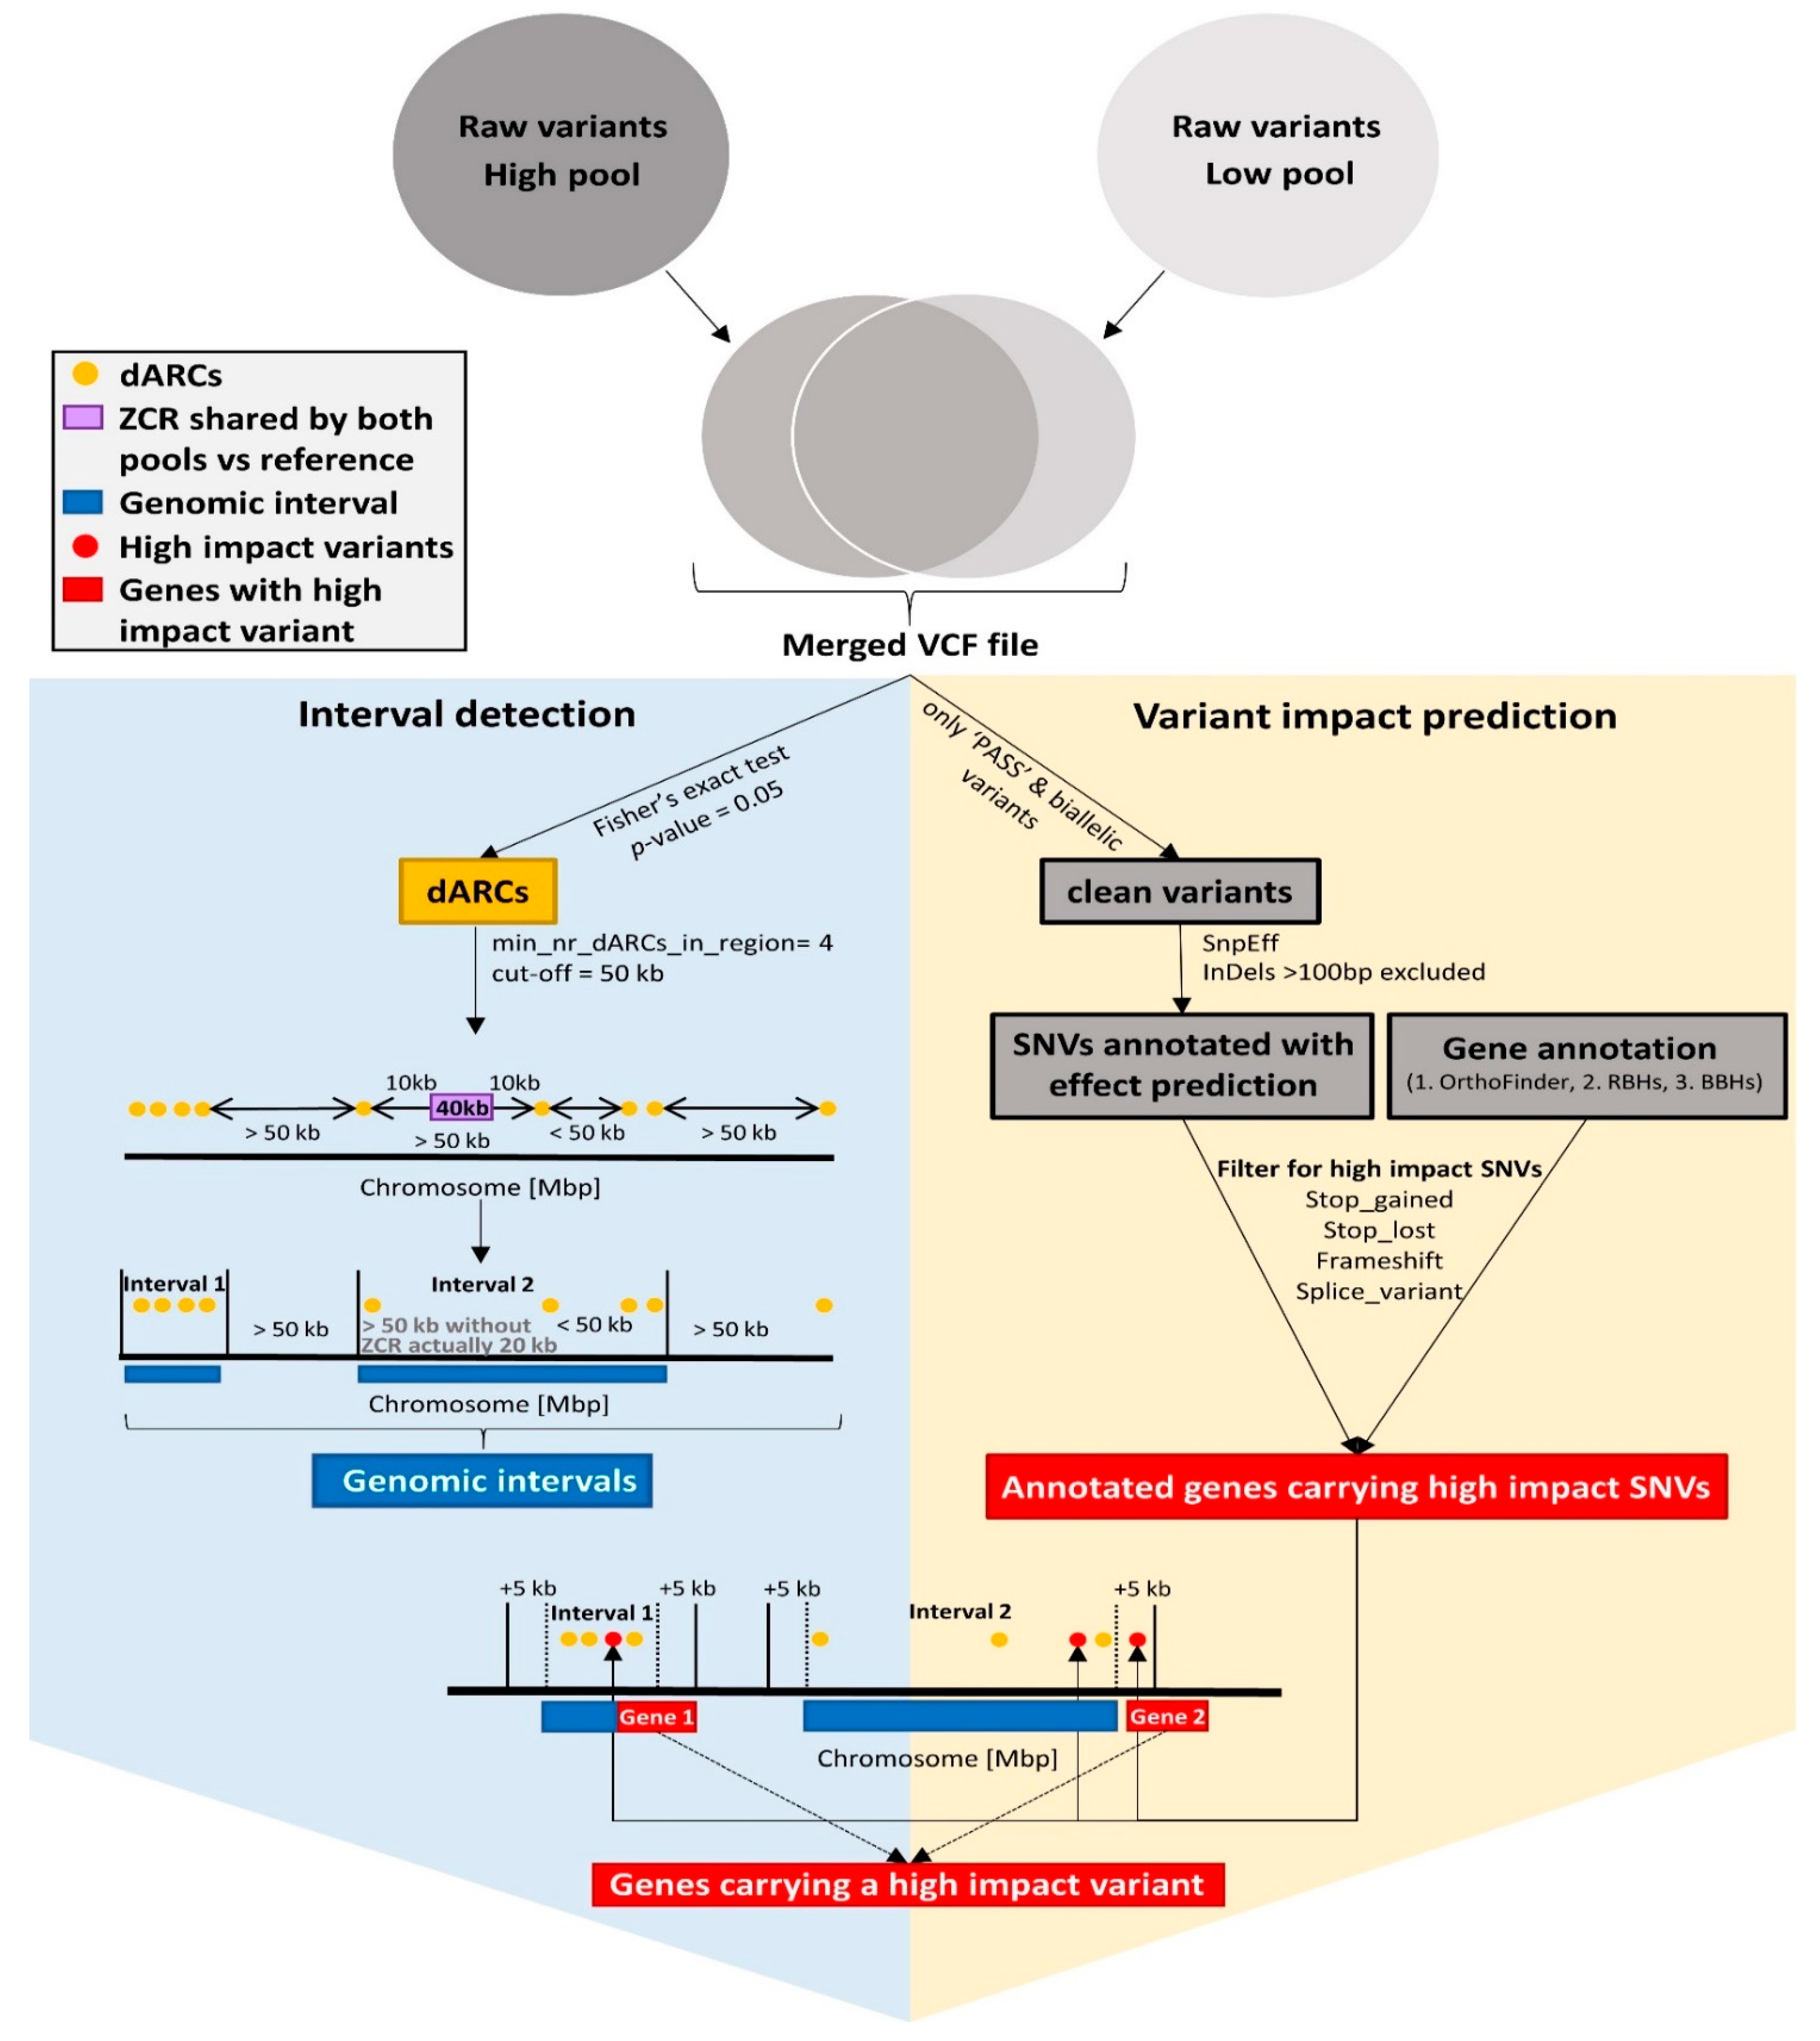
2.6. Interval Detection

For interval detection, Fisher’s exact test was applied on the raw SNVs of the pools to yield variants with a significant dAF (Figure 1). A p-value cut-off of 0.05 was applied after correction for multiple testing (GitHub fisher_exact_test_corrects_for_multiples_testing.py). The passing SNVs are called “statistically meaningful differential Allele-specific Read Counts” (dARCs) (Files S7 and S8).
These dARCs were used to identify genomic intervals associated with the analyzed traits (Figure 1). The following criteria were applied: (I) the minimum amount of dARCs in an interval was set to 4 (--min_nr_dARCs_in_reg), (II) the distance between at least 3 dARCs of one interval needs to be greater than 1 kbp (--dis_in_reg), and (III) the distance between any two adjacent dARCs must be less than 50 kbp (--dis_out_reg) (GitHub get_intervals_based_on_dARCs_Bn41_v4.py). While a certain number of dARCs is required to seed an interval, it is also important that these are equally distributed. Numerous variants originating from the same sequenced DNA fragment could be due to an artifact and are excluded by requiring a minimal distance of the seed dARCs. To avoid extremely large intervals with low dARC frequencies between dARC-rich intervals, the 50 kbp cut-off for the dARC distance is intended to split intervals without a constantly high dARC density.
Zero coverage regions (ZCRs) were identified by using the coverage information of both pools and applying a genome-wide screening with a window size of 200 bp per chromosome (GitHub PAV_finder.py). ZCRs are considered during the interval detection, as they are often responsible for splitting genomic intervals into parts (Figure 1) (Files S9 and S10). The localization of ZCRs at the same genomic position in both pools prevents the detection of variants and hence no dARCs can be detected.
Finally, detected genomic intervals were ranked according to their amount of dARCs. Initial candidate genomic intervals were manually inspected to find a suitable cut-off. For seed GSL content and SPC genomic intervals containing at least 100 dARCs and 65 dARCs were used for downstream analysis, respectively.

2.7. Generation of dAF Plots

Noise in the genome-wide dAF plots (Files S11 and S12) was reduced through the combination of adjacent dAFs (calculated as described in 2.6, GitHub sophisticated_cov_plot.py). Variants within a sliding window of 100 variants were represented by the median dAF of all variants in the window. Each step was a 5 variant shift of the window. The genome-wide distribution of “statistically meaningful differential Allele-specific Read Counts” (dARCs) (compare 2.7 for details) was visualized by the normalized density of dARCs. The normalized density of dARCs was calculated by combining the amount of dARCs in sliding windows of size 100 kbp with steps of size 30 kbp divided by the total amount of SNVs within this window. In addition, the mean mapping coverage of the pools using the same sliding window parameters were calculated and normalized to the maximum mean coverage per chromosome for visualization (Files S11 and S12).

2.8. Presence–Absence Variations (PAVs)

PAVs were identified based on the BAM-derived coverage files by comparison of coverage information of both pools in a genome-wide window approach which considers annotated genes (GitHub PAV_finder.py). Genomic regions or genes with no or at least extremely low coverage in one pool, but substantially higher coverage in the other pool were considered as PAVs. The coverage was normalized to the overall coverage of the pool. Genes located on the genetically non-anchored random scaffolds were excluded from this analysis. For the identification of PAVs based on gene regions the following parameters were used: PAV_finder.py was used in gene mode and –mincov was set to 10 (Files S13 and S14).

2.9. Functional Annotation and Candidate Genes

Genes located within or spanning over the borders of the identified genomic intervals were extracted (Figure 1). Genes were functionally annotated by transferring the Araport11 functional annotation to the v5 gene models [2]. OrthoFinder v2.3.7 [59] was applied using default parameters to identify orthogroups between representative peptides of A. thaliana Araport11 as previously defined [60], and the B. napus representative peptide sequences derived from the B. rapa, B. oleracea, B. napus Express 617, Darmor-bzh, Lorenz, and Janetzkis Schlesischer (Files S1, S15–S19). Remaining unannotated genes were functionally annotated by using reciprocal best blast hits (RBHs) and best blast hits (BBHs) as described previously [61] (Figure 1). We refer to the Bna genes that were annotated as homologs of the respective A. thaliana genes.

2.10. Variant Impact Prediction via SnpEff

Variants predicted to have an impact on the genes located within the genomic interval were extracted. First, SnpEff v4.1f [62] was applied on the merged variants of each pool (GitHub combine_single_VCFs_for_SnpEff.py), which passed GATK’s quality filters (‘PASS’) (Figure 1). The resulting VCF was subjected to SnpEff with default parameters using a custom database constructed from the B. napus Darmor-bzh v4.1 genome sequence and the v5 annotation, which were corrected for the used frame (File S20). SnpEff results were filtered for “high impact” variants as previously defined [61], which included predictions of loss or gain of a stop codon mutations, frameshift mutations, and splice site variants (GitHub get_intervals_based_on_sig_snps_Bn41_v4.py) (Figure 1). Finally, genes located within +/- 5 kbp of the borders of a genomic interval were analyzed for predicted high-impact variants (Figure 1) (Files S21 and S22).

2.11. Generation and Analysis of RNA-Seq Data

Seeds and leaves (28 days after flowering (DAF)) RNA-Seq samples of Janetzkis Schlesischer (P2) and seeds and leaves (23 and 35 DAF) RNA-Seq samples of B. napus SGDH14 (medium–high seed GSL content) [63] were prepared and sequenced according to Schilbert et al. 2021 [64]. Additionally, RNA-Seq reads derived from seeds and leaves of B. napus Express 617 [64] and public RNA-Seq data sets (File S23) were mapped to the B. napus Darmor-bzh v4.1 and Zheyou7 assemblies using STAR v.2.7.1a [65]. STAR was run in basic mode allowing maximal 5% mismatches and requiring an alignment spanning at least 90% of the read length. Mapping statistics were calculated based on STAR.log files via a customized python script (GitHub parse_STAR_log_file_create_mapping_statistic.py) (Files S24). We used featureCounts v1.5.0-p3 [66] for the generation of count tables. The mean fragments per kilobase exon per million reads (FPKM) or mean counts per million (CPM) expression values per organ were used for downstream analysis (GitHub generate_figures_only_mean_expression_calc.py and map_mean_exp_to_cand_genes_in_reg.py). For example, mean CPM expression values of Janetzkis Schlesischer, as well as average coverage information per pool were assigned to the genes to infer PAVs between pools (File S25 and S26) (GitHub fetch_gene_IDs_from_gff3_file.py, map_mean_exp_to_cand_genes_in_reg.py, map_PAVs_to_genes_in_regs.py).

2.12. Identification of MYB Homologs

MYB homologs were identified with KIPEs as described previously [67]. KIPEs was run with a minimal BLAST hit similarity of 40% to reduce the number of fragmented peptides derived from possible mis-annotations. As bait peptide sequences, all A. thaliana MYBs were used [13]. As subject species, the proteomes of several Brassica species were used (Files S1, S17, S19, S27 and S28). The alignment was constructed with MAFFT v.7 [68] and trimmed to minimal alignment column occupancy of 10%. Next, a phylogenetic tree was build (https://GitHub.com/bpucker/script_collection/tree.py with FastTree v2.1.10 [69] using 10,000 rounds of bootstrapping, including the identified MYB homologs from several Brassica species and well described MYB sequences from literature (Files S29–S33). The phylogenetic trees were visualized with FigTree v1.4.3 (http://tree.bio.ed.ac.uk/software/figtree/ (Files S34 and S35). Additional previously identified MYB sequences derived from Darmor-bzh [70] were added manually to the phylogenetic tree to ensure completeness of MYB homologs.
By analyzing mappings of genomic sequence reads from the parental genotypes against the Darmor-bzh and Zheyou7 assembly, the copy numbers of BnaMYB genes/alleles involved in GSL biosynthesis were manually inspected via IGV [71]. Generally, the numbering of GSL MYBs is based on Seo et al. 2017 [70] with small modifications. Finally, BnaMYB28_2 alleles from the B. napus cultivars of a subset of 100 lines from the BnASSYST diversity panel [72] were validated via PCR and Sanger sequencing (File S36).

3. Results

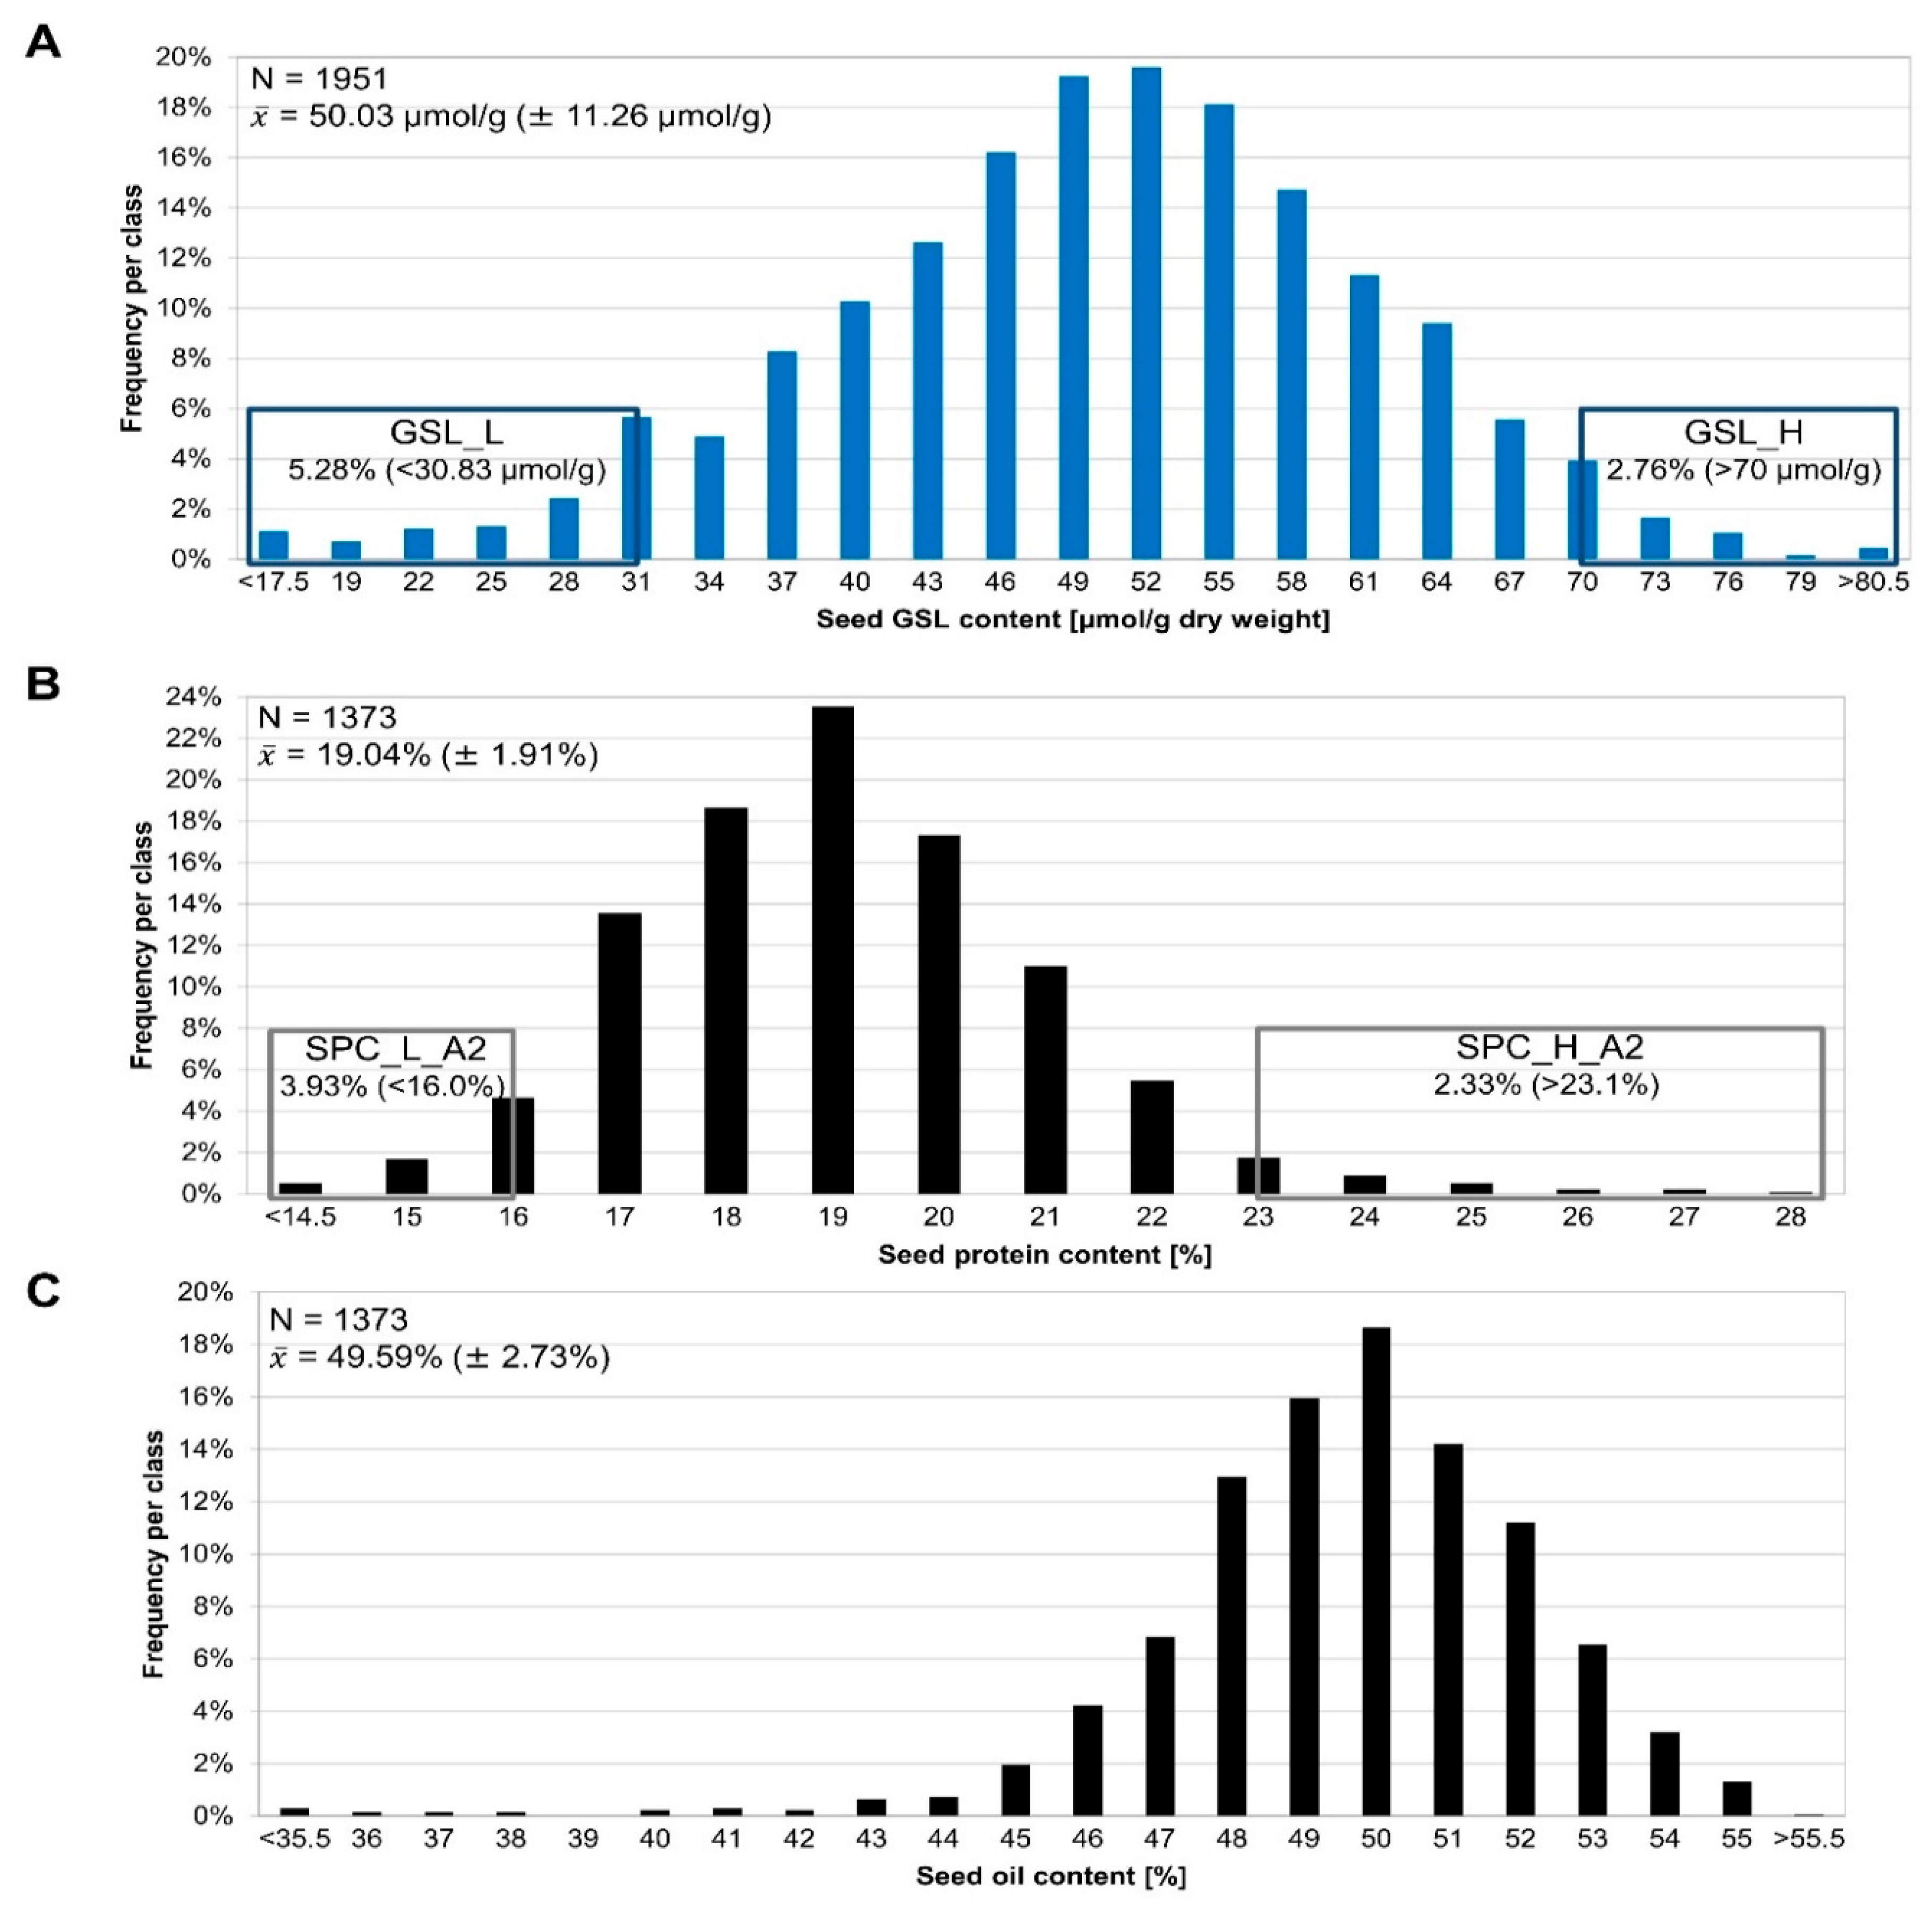
3.1. Phenotyping of the Segregating F2 Population

A large F2 population segregating for seed quality traits and consisting of over 2000 individuals derived from a cross between the B. napus cultivars Lorenz (P1) and Janetzkis Schlesischer (P2) was used for MBS (Figure 2). The traits studied were seed GSL content and SPC/SOC. The seed GSL content ranged from 11.8 to 88.1 µmol/g, while the SPC and SOC ranged between 9.7–28.0% and 24.3–56.3%, respectively (Figure 2).

3.2. MBS Predicted Candidate Genomic Intervals Controlling SPC, SOC, and Seed GSL Content—Mapping and Variant Calling

To map candidate genes, pools from the F2 population were subjected to MBS analysis. Both parental genotypes P1 and P2 and the two pools representing individuals with extreme phenotypes were sequenced, both for seed GSL content and SPC/SOC. After read mapping to the B. napus Darmor-bzh genome sequence, low-quality alignments and reads without a properly mapped mate were removed. Among these data sets at least 52% to 62% of the reads per data set were confidently mapped (File S37). See Supplementary File S37 for mapped read depth values (File S37). Variant calling revealed between 3,580,759 to 5,215,492 high-quality variants (InDels and single-nucleotide variants (SNVs)) for the respective samples (Table 1). Of these, 2,632,505 (73.5%) to 3,987,788 (76.5%) variants were distributed on the 19 pseudochromosomes. The remaining variants were distributed on the genetically non-anchored random scaffolds and were excluded from further analysis. The raw variants of each pool were filtered for the gold-standard SNVs, resulting in high-quality SNVs sets of 889,280 SNVs for the SPC pools and 880,842 for the GSL pools (~1036–1053 SNVs per Mbp) (Table 1). These SNVs were used to generate delta allele frequency (dAF) plots of the high and the corresponding low pool (Files S11 and S12). We noticed that the usage of statistically meaningful differential Allele specific Read Counts (dARCs; see M&M for details) dARCs resulted in less noisy interval detection when compared against dAF approaches (Files S11 and S12).

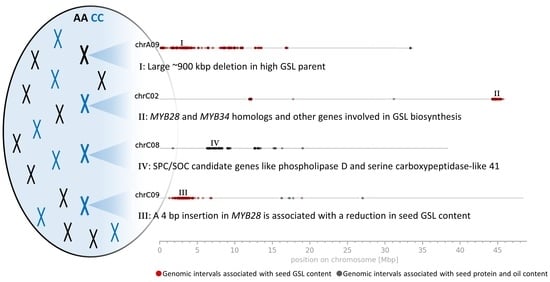
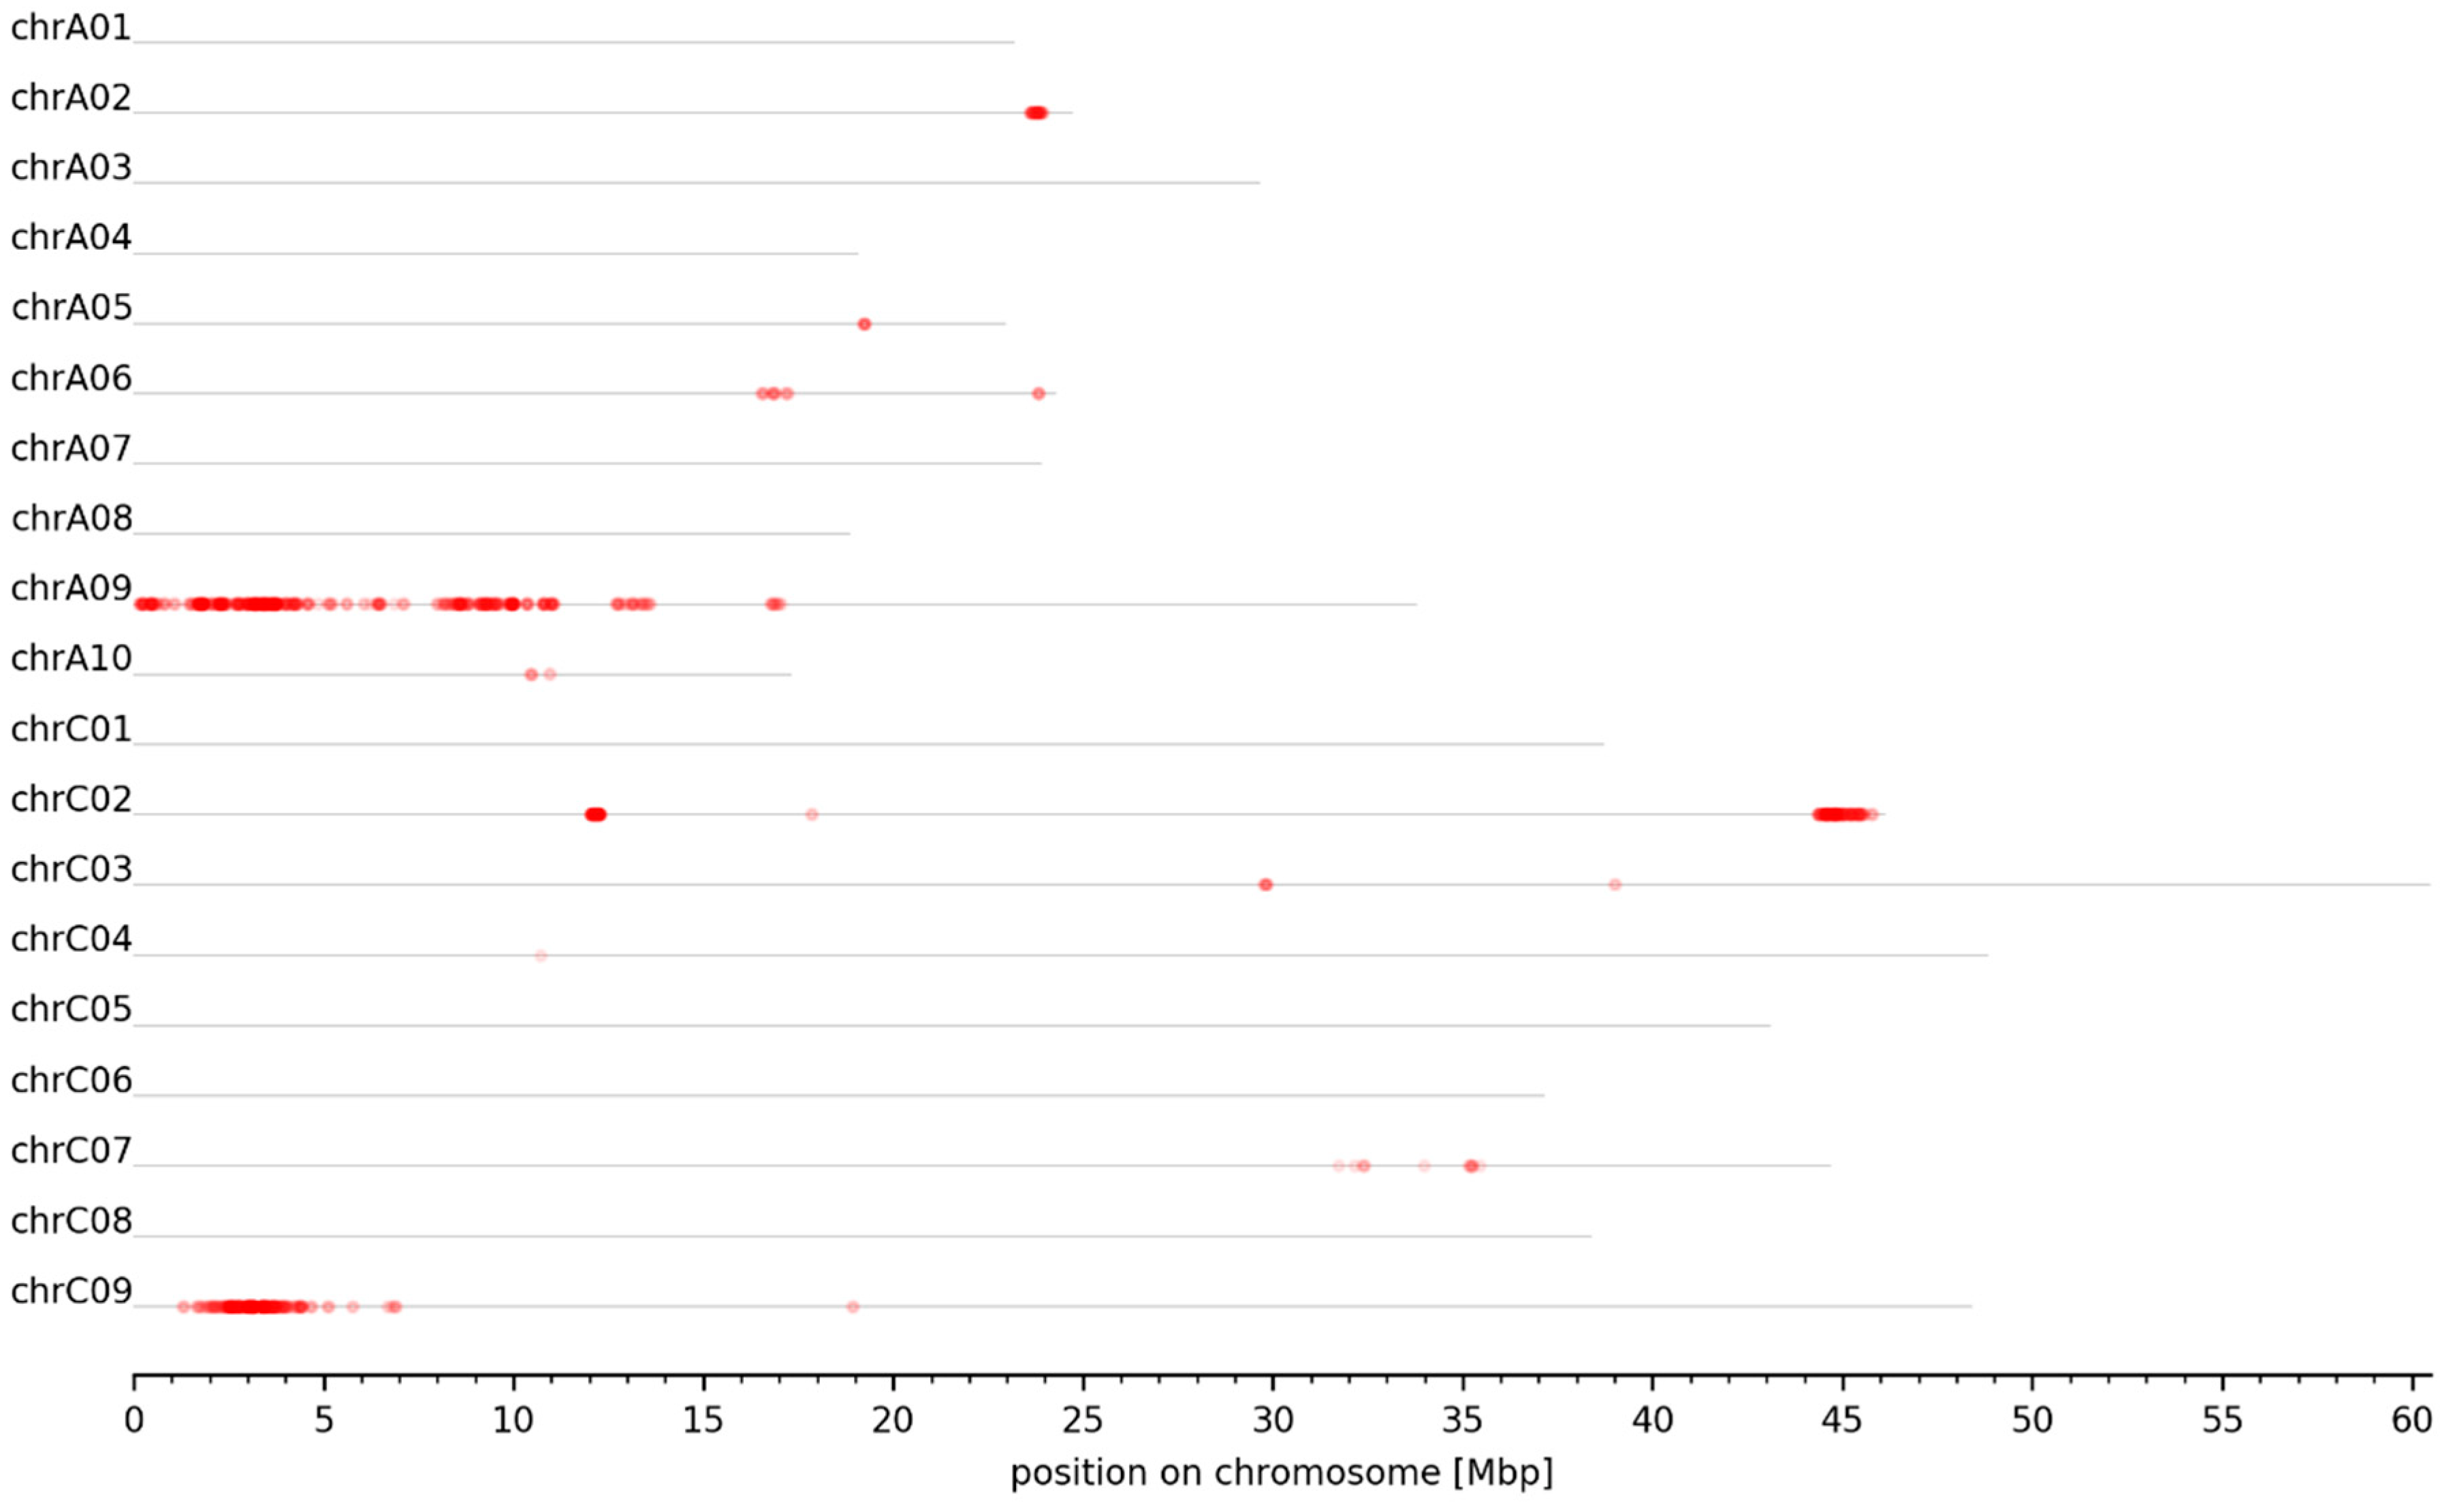
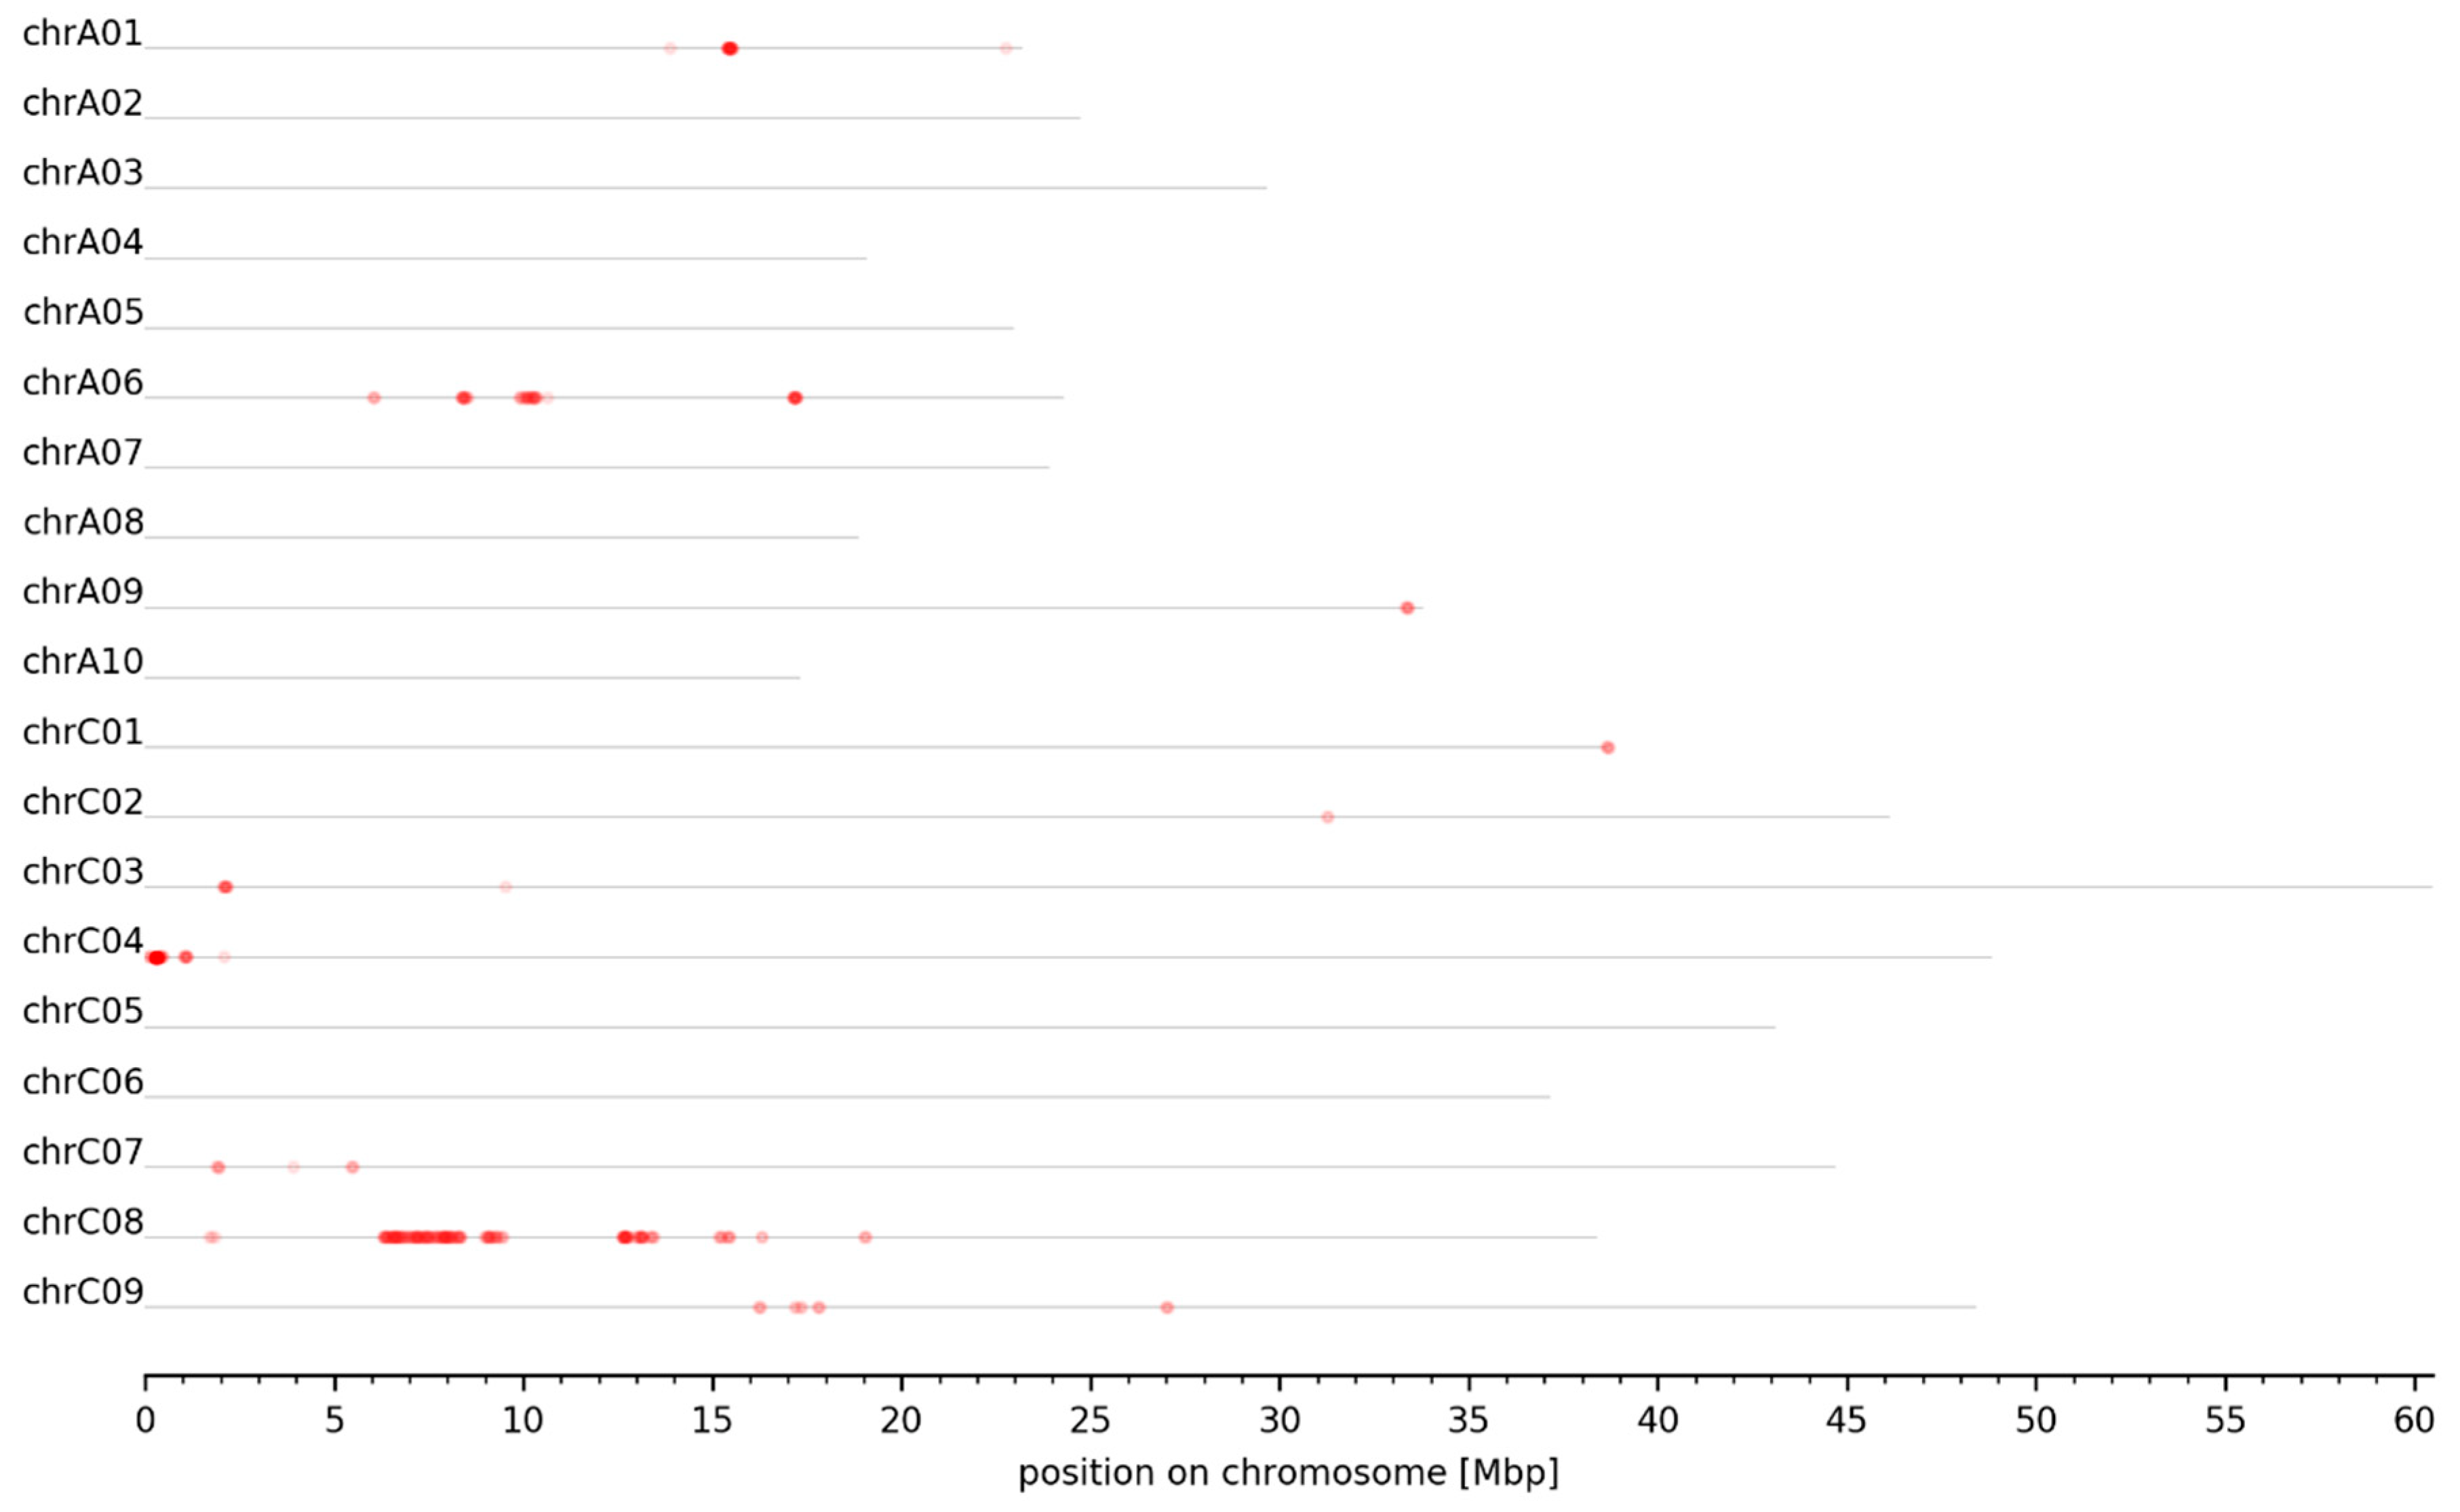
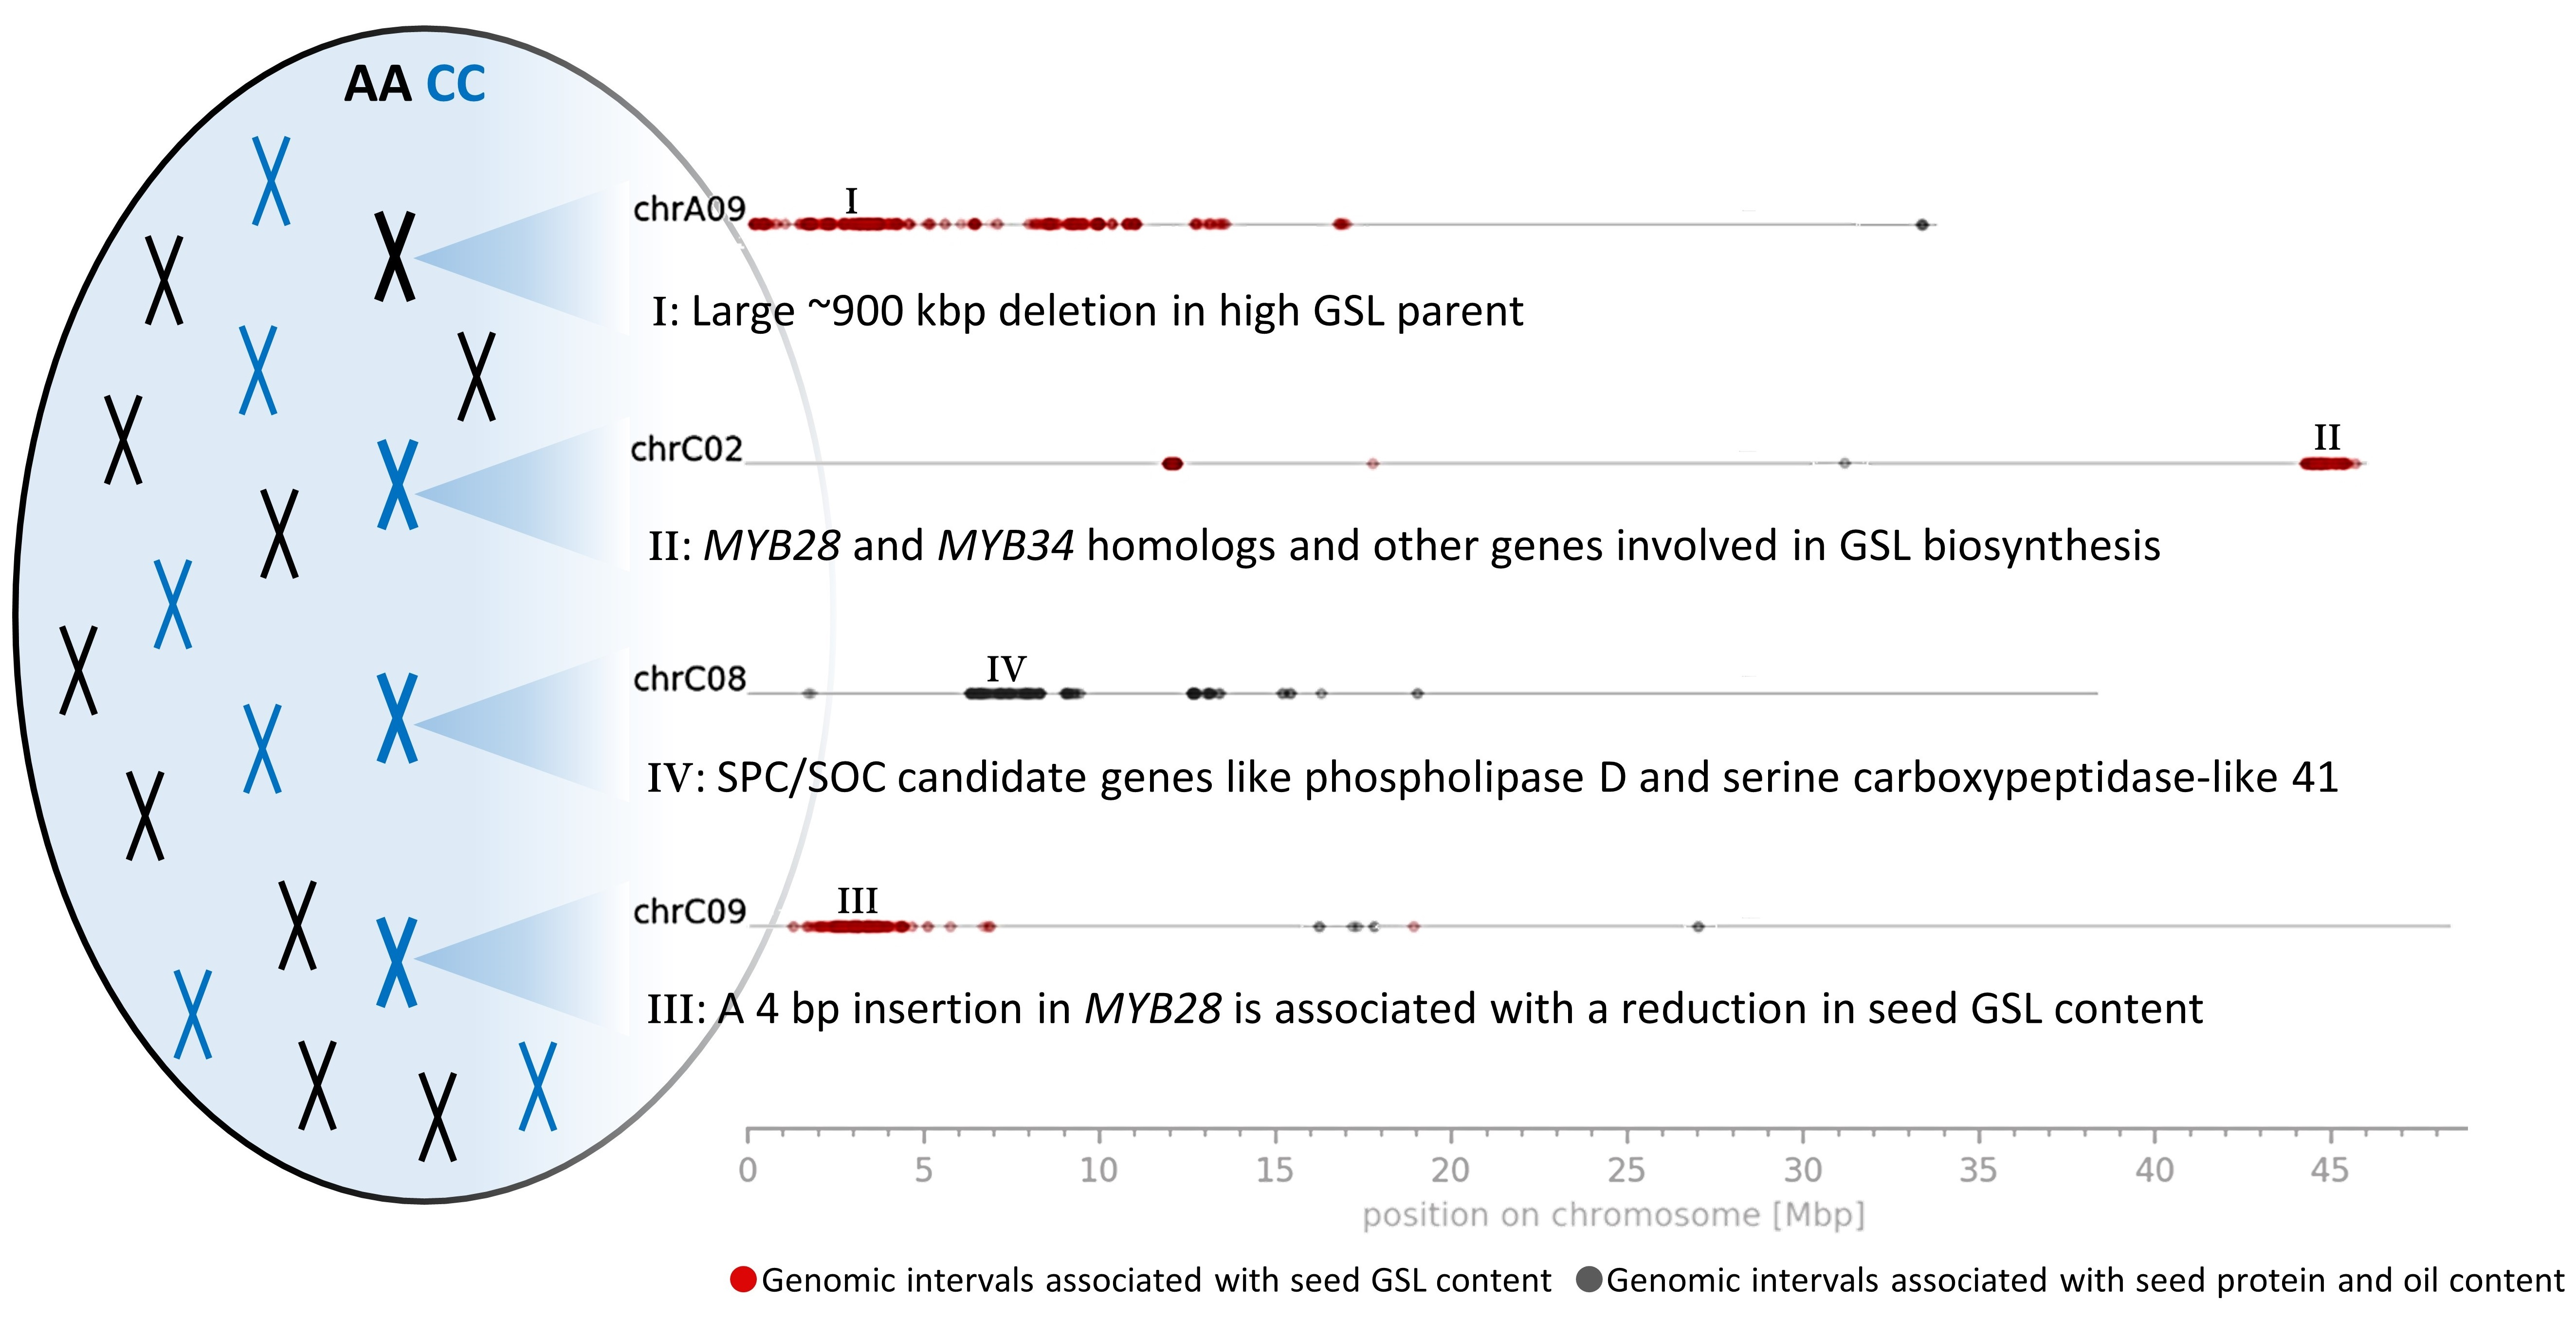
3.3. Genomic Intervals and Candidate Genes Associated with Seed Glucosinolate Content

Evaluation of the dARC distribution among the pseudochromosomes allowed identification of 30 genomic intervals associated with seed GSL content (see M&M). These intervals were detected on six chromosomes, namely A02, A06, A09, C02, C07, and C09. Their sizes range from 73 kbp to 1.32 Mbp (Figure 3, Table 2). Out of the 30 intervals, 18 intervals are located on A09, 5 on C09, 3 on C02, 2 on C07, and 1 on A02 and A06 (Table 2). Several intervals in close proximity on one chromosome emerged due to the lack of dARCs located between these intervals. This can be caused by, e.g., (I) regions with low numbers of SNVs, (II) low-quality variants that do not qualify as dARCs, and (III) a combination of the two mentioned causes.
In total, 1807 genes were found within the genomic intervals associated with seed GSL content (File S25). Some of these genes have a well-known function in GSL biosynthesis or breakdown. BnaC02g41790D, a homolog of A. thaliana METHYLTHIOALKYLMALATE SYNTHASE 1 (AthMAM1), is involved in GSL biosynthesis and is part of the genomic interval C02_GSL_2. Moreover, BnaA09g08410D and BnaA09g01260D, whose A. thaliana homologs are APS KINASE (AthAPK) and N-(METHYLSULFINYL)ALKYL-GLUCOSINOLATE HYDROXYLASE (AthAOP3), involved in GSL biosynthesis were identified in the genomic intervals A09_GSL_1 and A09_GSL_7, respectively. BnaA09g08470D, a homolog of THIOGLUCOSIDE GLUCOHYDROLASE (AthTGG) involved in GSL breakdown, was found in the genomic interval A09_GSL_7. Moreover, key transcription factors involved in the regulation of GSL content were located within the genomic intervals. Two close homologs of AthMYB28 (AthHAG1), BnaC09g05300D and BnaC09g05290D, were located within the genomic interval C09_GSL_2 (File S25). In addition, homologs of AthMYB34 (AthATR1), BnaC09g05060D and BnaC02g41860D, were identified in the genomic intervals C09_GSL_2 and C02_GSL_2, respectively (File S25).

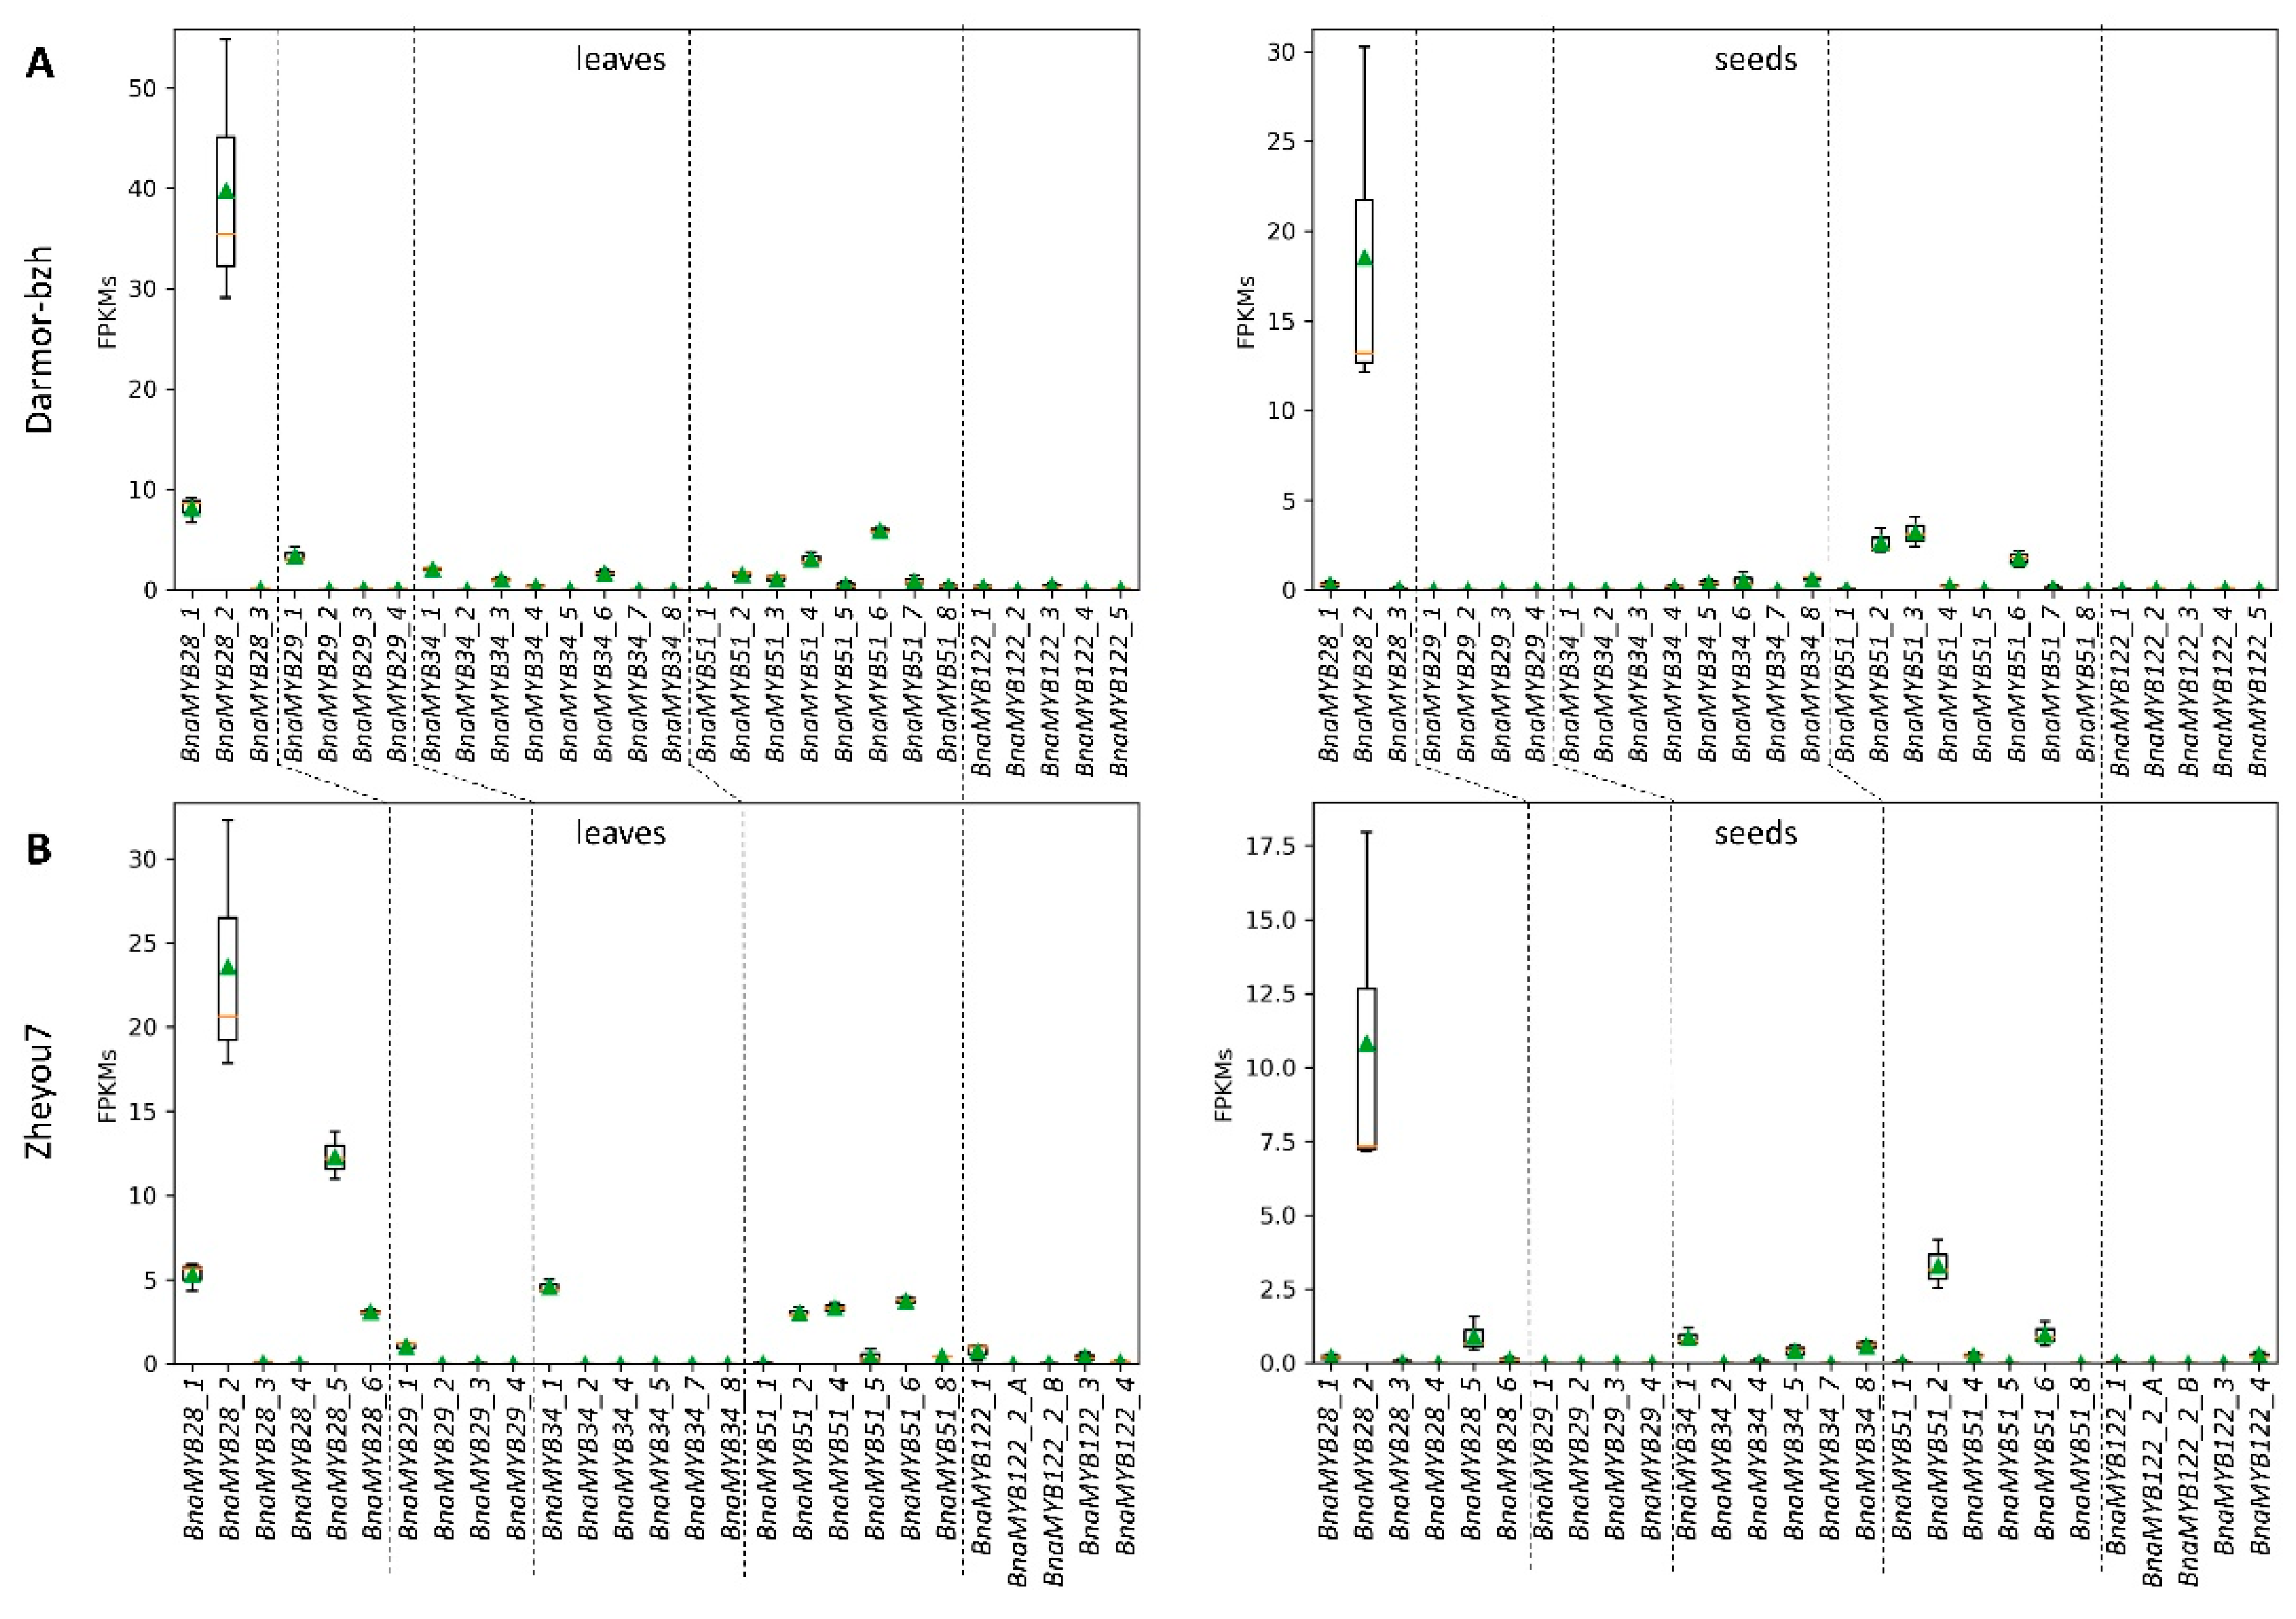
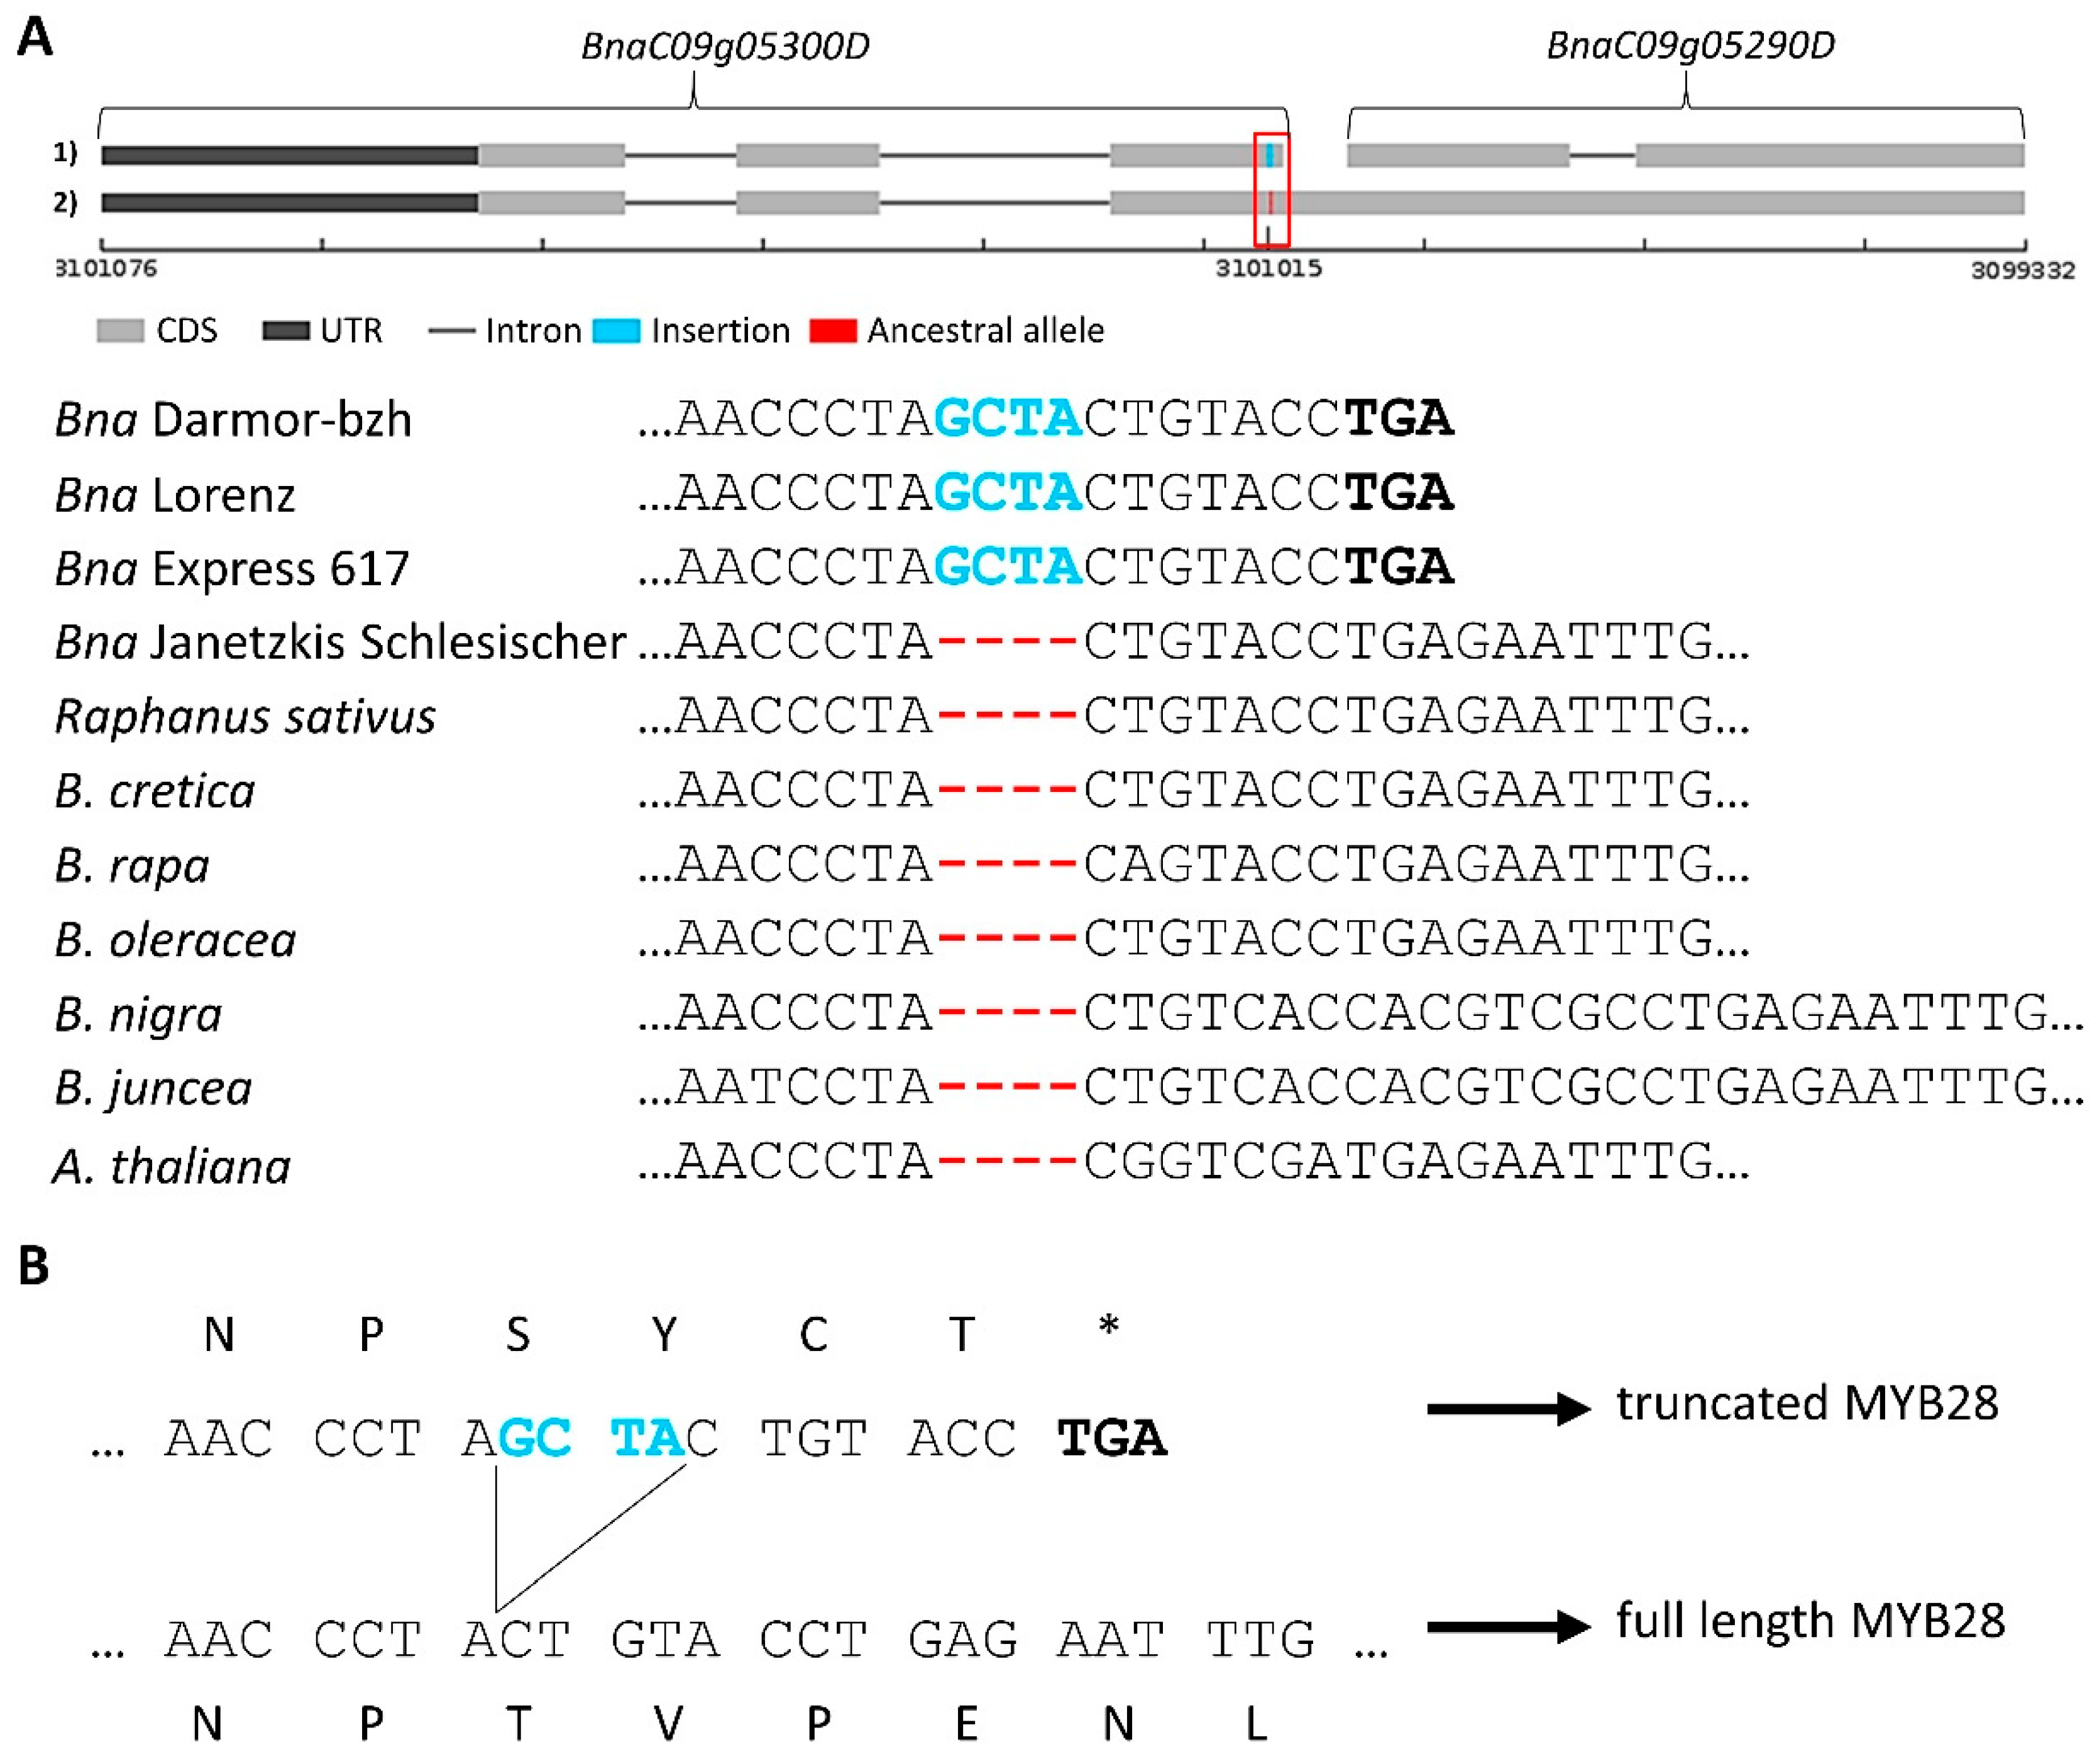
3.3.1. Glucosinolate-Associated MYB Genes Contributed by P1 and P2

To determine which parental genotype brings in which of the key transcription factor genes, we set out to identify all BnaMYB genes/alleles involved in GSL biosynthesis (MYB28, MYB29, MYB34, MYB51, and MYB122; see introduction; collectively referred to here as ‘B. napus GSL MYBs’) in P1 and P2. Since it turned out that not all BnaMYB homologs are resolved in the B. napus Darmor-bzh genome sequence, we used in addition the long-read assembly of the B. napus cultivar Zheyou7 which covers more BnaMYB homologs. BnaMYB sequences of various genotypes including both parental genotypes were subjected to a phylogenetic analysis (Files S29 and S35). By analyzing mappings of genomic sequence reads from the parental genotypes against both assemblies, the copy numbers of B. napus GSL MYBs were identified (Table 3, Files S15 and S29).
A tandem gene duplication event of BnaMYB122_2 in P1 resulted in a higher number of BnaMYB122 genes compared to P2 (File S35). The additional BnaMYB28 copy in P2, BnaMYB28_5, is likely to be derived from the loss of this copy in P1 as indicated by the fractionated and extremely low coverage of the C02 BnaMYB28_5 by genomic read mappings of P1 reads to the Zheyou7 assembly (Files S29 and S15, Table 3 and Table 4). This was also supported by the analysis of GSL pools, where BnaMYB28_5 revealed a ~3-fold higher genomic coverage in the high-GSL pool compared to the low-GSL pool, indicating that this locus is only inherited by the high-GSL parent P2.
Large deletions were detected on A09 in both, P1 and P2. Both deletions affect the presence or absence of B. napus GSL MYBs. The ~920 kbp deletion of P2 ranges from ~4.06 to 4.98 Mbp, while the ~50 kbp deletion of P1 ranges from 4.46 to 4.51 Mbp (pseudochromosome positions taken from the Zheyou7 assembly). The P2 deletion A09_P2_920 harbors 163 genes, while only 1 gene (BnaA09g05680D) is located inside the shared deletion of P1 (File S38). Fractionated and extremely low coverage of the A09 BnaMYB28_4 homolog was observed in genomic read mappings of P1 and P2 reads to the Zheyou7 assembly, indicating its deletion in both parental genotypes (Table 4, File S15). In addition to BnaMYB28_4, additional genes associated with GSL biosynthesis were identified in the A09_P2_920 deletion (File S38) which overlap with high ranked genes affected by PAVs (File S13). The BnaMYB34_7 homolog is located within the A09_P2_920 deletion, but outside of the one of P1 (Table 3 and Table 4, File S15). This was also supported by the analysis of GSL pools, where BnaMYB34_7 revealed a ~3-fold higher genomic coverage in the low-GSL pool compared to the high-GSL pool, indicating that this locus is inherited by the low-GSL parent P1. The A09_P2_920 deletion overlaps with the genomic intervals A09_GSL_4 and A09_GSL_5 and might also be the reason for additional genomic intervals detected in its proximity.
In order to identify B. napus GSL MYB genes expressed in seeds which could influence seed GSL content and thus explain the phenotypic variation in the high- and low-GSL pools, we analyzed their expression in seeds and leaves of P2. Most BnaMYB28, BnaMYB29, BnaMYB34, BnaMYB51, and BnaMYB122 homologs were not or very low expressed in leaves and seeds (Figure 4). Only five homologs are expressed in seeds: BnaMYB28_2, BnaMYB28_5, BnaMYB34_1, BnaMYB51_2, and BnaMYB51_6. As BnaMYB28_5 is absent in the low-GSL parent P1 (Table 4) but expressed in P2, this homolog might explain the genomic intervals identified in the south of chromosome C02 (Figure 3, Table 2). Supporting these genomic intervals, BnaMYB34_1 is also located in the south of C02 (File S29). BnaMYB51_2 and BnaMYB51_6 are located on C08 and A08, respectively, and have homologs in both parental genotypes which showed no genomic coverage differences between the high- and low-GSL pools (File S15). However, BnaMYB28_2 on C09 exceeds the expression of all B. napus GSL MYB homologs by a factor of at least 2-3 fold in leaves and seeds (Figure 4). The analysis of over 650 public available B. napus RNA-Seq data sets (File S23) supports the high expression of BnaMYB28_2 compared to all other GSL MYBs across various tissues and environmental conditions (File S39).

3.3.2. Variation Effects in Genes Involved in Seed Glucosinolate Biosynthesis

As sequence variants can influence the function of gene products, the impact of sequence variants on genes located within or near the genomic intervals (+/−5 kbp) was predicted. Interestingly, the highly expressed BnaMYB28_2 located on C09 is affected by a 4 bp insertion (GCTA) near the end of the annotated third exon (Figure 5A, Files S15 and S40). The phylogeny of MYB28 homologs across several Brassicaceae species revealed that the ancestral allele did not contain this 4 bp insertion (Figure 5A,B, File S35), i.e., the ancestral allele encodes a functional MYB transcription factor. The Darmor-bzh genome sequence contains the insertion. The 4 bp insertion results in a premature stop codon of the MYB28 homolog BnaC09g05300D, leading to a truncated protein (Figure 5B). The second fragment of this locus is annotated as BnaC09g05290D which encodes only a MYB28 C-terminal fragment (Figure 5A).
The ancestral allele is present in 73% of the GSL high pool reads and 29% of the GSL low pool reads, resulting in a dAF of 0.44 (Files S21 and S40). The genomic reads of the high-GSL parent P2 showed the ancestral allele, while those of the low-GSL parent P1 carried the insertion (Figure 5A, File S40). RNA-Seq data from leaves and seeds of P2 support the presence of the ancestral allele on transcript level (File S40).
The BnASSYST diversity panel was screened to investigate the association of the 4 bp insertion with low seed GSL content. The two alleles of the BnaMYB28_2 C09 homolog, namely BnaMYB28_2_1* describing the ancestral allele and BnaMYB28_2_2* describing the insertion allele, were validated by this analysis and confirmed by sequencing (Figure 6A). The insertion allele BnaMYB28_2_2* was identified to be significantly associated with low seed GSL content (Figure 6B). Moreover, co-segregation of the insertion with the C09 homolog was detected (Figure 6B). This finding is in accordance with our phylogenetic analysis, supporting the assumption that the allele without the 4 bp insertion is the ancestral allele.
In order to evaluate whether the 4 bp insertion might be ubiquitously associated with low seed GSL content in B. napus, we analyzed its presence across several B. napus lines (File S41). In accordance with our previous findings, all high-GSL lines contain at least one functional BnaMYB28 homolog harboring the ancestral allele as it has been observed for example for the B. napus genotype SGDH14. All low-GSL lines revealed the presence of the insertion allele of the C09 BnaMYB28 homolog, while the A09 BnaMYB28 homolog was absent (File S41).

3.3.3. PAVs

Additional candidate genes were identified via PAV analysis, which revealed 316 genes affected by PAVs (File S13). As seed GSL content is a polygenic trait, it is not expected to identify genes with no read coverage in one pool compared to full coverage in the other pool. In this study, genes likely to be deleted in one parent but present in the other resulted in a 1/3 read coverage ratio. Genes predicted to be present in the low-GSL parent P1, but absent in the high-GSL parent P2 are described. By analysis of the chromosomal positions of high ranked PAVs, two deletions on A09 were identified. The first major ~900 kbp deletion on A09 (A09_P2_920) and its associated candidate genes have already been described above. A second ~25 kbp deletion is located within A09_GSL_13 ranging from ~10.028–10.053 Mbp, namely A09_P2_25 (File S42). Three of four genes located within this deletion are homologs of genes involved in abscisic acid (ABA) signaling in A. thaliana. Namely BnaA09g16660D, a homolog of CALCIUM-DEPENDENT PROTEIN KINASE 32 (AthCPK32), as well as BnaA09g16680D and BnaA09g16690D, two homologs of BURNOUT1 (AthBNT1), were identified to be absent in P2 compared to P1. For the fourth gene no functional annotation was available.

3.4. Genomic Intervals, Candidate Genes and Variation Effects Associated with Seed Protein and Oil Content

In total 15 genomic intervals associated with SPC and SOC were identified on chromosome A01, A06, A09, C03, C04, C08, and C09 and their sizes range from 10.5 kbp to 2.07 Mbp (Figure 7, Table 5). Out of these 15 intervals, five intervals are located on C08, three on A06, two on C04 and C09 and one on A01, A09 and C03 (Table 5). A total of 351 genes were located within the genomic intervals (File S26), of which some have a well-known function in lipid and/or protein biosynthesis. In addition, several SNVs affecting genes associated with SPC and SOC were investigated.
BnaC03g04570D, a homolog of ALTERED SEED GERMINATION 2 (AthASG2), is located in C03_SPC_1 and affected by a frameshift mutation which is present in 86% of the low-SPC pool reads and in 21% of the high-SPC pool reads (File S22). Within C04_SPC_1 BnaC04g00490D, a homolog of ATP BINDING CASSETTE SUBFAMILY B4 (AthABCB4), was predicted to carry a frameshift mutation with a prevalence of 91% of the low-SPC pool reads and 15% of the high-SPC pool reads. In C04_SPC_2 BnaC04g01520D, a homolog of a kinase family protein with an ARM repeat domain (AthCTEXP), was predicted to gain a stop codon which is present in 93% of the low-SPC pool reads and in 21% of the high-SPC pool reads (File S22). In C08_SPC_2, two major candidate genes were detected. First, BnaC08g05680D, a homolog of the regulator of seed oil content PHOSPHOLIPASE D DELTA (AthPLDδ), is affected by a mutation of the splice site of the first to the second exon (File S22). This mutation is present in 67% of the low-SPC pool reads and in 18% of the high-SPC pool reads. Second, BnaC08g05590D, a homolog of the SERINE CARBOXYPEPTIDASE LIKE 41 (AthSCPL41), carries a frameshift mutation in 59% of the low-SPC pool reads and was not detected in the high-SPC pool reads (File S22). BnaC08g05680D and BnaC08g05590D are located next to each other in the B. napus Darmor-bzh genome sequence. In addition, a frameshift mutation in BnaC08g02490D (C08_SPC_1), which A. thaliana homolog is annotated as an amino acid transporter, was identified. Moreover, mutations located in genes, which A. thaliana homologs are involved in post-translational protein modifications, e.g., ubiquitylation (BnaA06g15510D, BnaA06g18030D, BnaA06g18370D, BnaA06g18380D) (A06_SPC_1 and A06_SPC_3) or myristoylation (BnaA06g15490D) (A06_SPC_1) were identified in genomic intervals on chromosome A06 (File S22). BnaA06g15510D (A06_SPC_1), a homolog of F-BOX PROTEIN 7 (AthFBP7), was predicted to gain a stop codon due to a SNV in 78% of the low-SPC pool reads and 14% of the high-SPC pool reads (File S22). BnaA06g18220D (A06_SPC_3), a homolog of RAB GTPASE HOMOLOG 8A (AthRABE1c), is affected by a frameshift and stop gained mutation in the high-SPC pool and are not present in the low-SPC pool (File S22). PAVs genes located near or in the genomic intervals were not associated with SPC/SOC based on the functional annotation of their corresponding A. thaliana homolog (File S14). In summary, these candidate genes are proposed to contribute to the variations of SPC and SOC in B. napus.

4. Discussion

We investigated a segregating F2 population to identify genomic intervals and candidate genes associated with protein, oil, and glucosinolate content of B. napus seeds. The genomic intervals and candidate genes identified in this study should provide deeper insights into the genetic architecture of the three complex traits. We envision that the results of this study will be used for genetic improvement of seed quality in B. napus.

4.1. Seed Oil and Protein Content

Control of the multigenic traits SPC and SOC is complex and previous studies have reported various SPC and SOC QTL with the majority being minor QTL distributed across all linkage groups [28,29,30,31,32,33,34,35]. As expected for the multigenic traits SPC and SOC, we identified several genomic intervals distributed across 7 chromosomes: A01, A06, A09, C03, C04, C08, and C09. A large proportion of the genomic intervals overlap with loci associated with SOC from previous studies, such as A01_SPC_1, A06_SPC_1-3, C08_SPC_4-5 [27,30,35] indicating the high reliability of these loci. The genomic interval A01_SPC_1 overlaps with a significant region associated with amount of eicosenoic acid [27]. All intervals on chromosome A06 are in line with significant regions associated with oleic acid and linoleic acid [27]. Chao et al. identified several QTL for SPC and SOC, of which two QTL for SOC are in proximity to the genomic interval C03_SPC_1 and one QTL for SPC overlaps with C08_SPC_3-5 [26]. Moreover, C08_SPC_4 and C03_SPC_1 are located in proximity to SNVs significantly associated with linolenic acid [27,38], while C08_SPC_5 is close to SNVs significantly associated with oleic acid, erucic acid [27,38], and eicosenoic acid [27].
Numerous candidate genes and sequence variants associated with SPC/SOC have been detected. For example, BnaC08g05680D, a homolog of PHOSPHOLIPASE D DELTA, is located in C08_SPC_2. Phospholipases are involved in lipid degradation, membrane reconstruction and signal transduction [73]. PLDδ, one of the most abundant PLDs, hydrolyses phospholipids to phosphatidic acid (PA) [73]. Devaiah et al. showed significant reduced seed germination for the pldδ A. thaliana and attenuation of PLDα1 expression might improve oil stability, seed quality and seed aging [74]. In leaves of pldδ A. thaliana mutants the suppression of PLDδ results in the attenuation of PA formation, which blocks the degradation of membrane lipids retarding ABA-promoted senescence [75]. Another candidate gene BnaC08g05590D located in C08_SPC_2 is a homolog of SERINE CARBOXYPEPTIDASE-LIKE 41 (SCPL41). SCPL41 was identified as negative regulator of membrane lipid metabolism and is proposed to be required for phospholipid metabolism or PA-dependent signaling in A. thaliana [76]. Deletion of SCPL41 increased total leaf lipid content and phosphatidylcholine, phosphatidylethanolamine, and phosphatidylglycerol contents, which are substrates of phospholipid hydrolysis via PLD [76]. Interestingly, PLDδ and SCPL41 are located next to each other in the B. napus genome sequence indicating they might be functionally related or act in the same network as it has been observed for, e.g., biosynthetic gene clusters in A. thaliana [77]. In the low-SPC pool, the B. napus PLDδ and SCPL41 homologs are affected by high-impact variants. Therefore, the most likely non-functional SCPL41 and PLDδ homologs might result in an increase in total lipid content in the low-SPC pool. Due to the negative correlation of SPC and SOC this would in turn lead to a low SPC.
On chromosome C04 CTEXP and ABCB4 homologs have been identified as candidate genes affected by nonsense and frameshift mutations, respectively, with a high prevalence in the low-SPC pool. Homologs of CTEXP are known to play a role in intracellular protein trafficking [78], while ABCB4 was identified as an auxin efflux transporter [79]. However, members of the same enzyme family are known as intracellular sterol transporters in mice [80].
A. thaliana mutants of the candidate gene ASG2 located in C03_SPC_1 show seeds with an increased oil body density, fatty acid content, and weight [81]. The authors hypothesize that ASG2 modulates the gene expression or activity of ω-6-fatty acid desaturase (FAD2) and/or ω-3-fatty acid desaturase (FAD3), which are involved in the production of unsaturated FAs [81]. Thus, ASG2 might be a novel candidate gene contributing to an increased SOC in the low-SPC pool. Moreover, the candidate genes involved in post-translational protein modifications might influence SPC/SOC content as, e.g., myristoylation enables protein-lipid interactions and controls the transport and localization of proteins [82].
The candidate gene BnaA06g15510D (A06_SPC_1), whose A. thaliana homolog is annotated as F-BOX PROTEIN 7, is affected by a nonsense mutation in the low-SPC pool, and A. thaliana fbp7 mutants display a defect in protein biosynthesis after cold and heat stress [83]. FBP7 is proposed to regulate translation through ubiquitylation and thereby inactivates a translation repressor under temperature stress [83]. The nonsense mutation in BnaA06g15510D might results in a non-functional FBP7, leading to activation of the translational repressor and thus in a reduction in protein content.
Located in A06_SPC_3 a RABE1c homolog was affected by several mutations in the high-SPC pool. Peroxisomal fatty acid-oxidation is the main pathway for seed lipids catabolism [84]. RABE1c is responsible for PEROXIN 7 (PEX7) dislocation/degradation on the peroxisome membrane and mutation of RABE1c restored peroxisomal β-oxidation activity and PEX7 expression [84]. Treatment with proteasome inhibitors also restored endogenous PEX7 protein levels in GFP-PEX7-expressing seedlings [84]. Thus, a mutated RABE1c in the high-SPC pool might decrease SOC and in parallel increase SPC by increased peroxisomal β-oxidation activity and proteasome inhibitory-like characteristics, respectively.
Of the genes located in the genomic interval on chromosome A01, no association with SPC or SOC was detected based on the functional annotation. However, Liu et al. identified a significant SNV located within BnaA01g22680D, which is in proximity to the genomic interval A01_SPC_1 [85]. The A. thaliana homolog is MILDEW RESISTANCE LOCUS O 6 (AthMLO6). In addition to the identified candidate genes in this study, unknown genes or genomic components might be involved in trans-regulatory or epistatic interactions of SPC/SOC which may be responsible for the indicated genomic intervals.

4.2. Seed Glucosinolate Content

Seed GSL content is influenced by several major and minor QTL. In this study, loci controlling seed GSL content were identified on chromosome A09, C09, C02, A02, A06, and C07 being in accordance with previous findings [20,21,22,23,24]. All significant SNPs located in the regions on A09, C02, C07 and C09 explained 56.7% of the cumulative phenotypic variance [22].
We identified several genomic intervals on chromosome A09. In this case, a large interval is subdivided into several intervals because of (I) regions with low numbers of SNVs, or (II) low-quality variants or (III) a combination of both. Regions with low numbers of SNVs can be caused by deletion in one or both parental genotypes. Therefore, dARCs cannot be detected in these regions which results in a subdivision of intervals. It is possible that such intervals are flanking loci associated with the trait of interest, e.g., in the case of large deletions. Two deletions in the high-GSL parent P2 may have a major influence on seed GSL content. The first ~900 kbp deletion (A09_P2_920) causes the loss of BnaMYB28_4 and BnaMYB34_7, the A. thaliana homologs of these two genes are known positive regulators of GSL biosynthesis. However, because BnaMYB28_4 is also absent in the low-GSL parent P1 and BnaMYB34_7 is not expressed in the high-GSL parent P2 seeds, these genes are likely not responsible for the observed variation in seed GSL content between the parents. The A09_P2_920 deletion also causes the loss of BnaA09g05810D and BnaA09g05510D annotated as CALNEXIN1 (At5g61790) and COBRA (At5g60920), respectively. CALNEXIN1 and COBRA were identified as interaction partner of the aliphatic GSL pathway specific enzyme CYP83A1 [86]. A. thaliana calnexin1 and cobra homozygous T-DNA insertion mutants revealed an increased total aliphatic and indolic GSL content [86], indicating that they have a negative influence on GSL biosynthesis. Thus, the deletion of both genes in P2 might contribute to its high GSL content.
The second ~25 kbp deletion of P2 (A09_P2_2) was found to cause the loss of genes, whose A. thaliana homologs are involved in abscisic acid (ABA) signaling. Plant hormones such as ABA, jasmonic acid (JA) and salicylic acid (SA) impact indolic and aliphatic GSL biosynthesis by increasing the expression of GSL transcription factors such as MYB28 and MYB29 and vice versa [18,87,88]. The deletion of the two homologs (BnaA09g16680D, BnaA09g16690D) of AthBURNOUT1 could result in increased levels of plant stress hormones, as A. thaliana burnout1 loss of function mutants overproduce stress hormones such as JA, SA, ABA, and ethylene [89]. Moreover, the A. thaliana homolog of the deleted BnaCPK32 (BnaA09g16660D) is a positive regulator of AthABF4, which positively regulates the expression of ABA-responsive genes to increase stress tolerance [90]. Thus, lacking BnaCPK32 might impair ABA signaling and stress tolerance, which might be compensated by high GSL content. Taken together, the possible increase in plant stress hormones and reduced stress tolerance might boost GSL production in P2.
In addition to the detection of trait-associated genomic intervals and large deletions, our approach enables the identification of single candidate genes and pinpoints sequence variants and domains at the base-pair level which are associated with seed GSL content. Seed GSL content is influenced by multiple genes involved in the biosynthesis of aliphatic and indolic glucosinolates, as well as GSL breakdown and transport [12,23,91]. However, seed GSLs can be largely decreased by reducing aliphatic GSLs as they represent 91–94% of total seed GSL content [19]. According to Kittipol et al., the results of some studies lead to the assumption that inhibition of GSL transport processes cause the low seed GSL trait in B. napus as no significant correlation between leaf and seed GSL could be found. However, Kittipol et al. showed that seed and leave aliphatic GSL content is most likely regulated by a master regulator affecting all plant tissues rather than long-distance transport, because no accession with high leaf and low seed GSL content was identified [92]. Thus, the positive regulator of the aliphatic GSL biosynthesis, MYB28, was proposed as master regulator [92] and we could indeed identify specifically the BnaMYB28_2 homolog on chromosome C09 as major regulator of seed GSL content. B. napus lines with a low GSL content carry a 4 bp insertion in this gene, which causes a premature stop codon, thus leading to a most likely non-functional MYB transcription factor. Consequently, structural genes in the GSL biosynthesis are no longer activated due to the lack of this central transcriptional regulator. In contrast, lines with high GSL content carry a functional BnaMYB28_2 allele. A significant association between this 4 bp insertion and low seed GSL content was observed before [93], but not explained mechanistically. The Damor-bzh genome sequence harbors the 4 bp insertion which caused the prediction of two gene models at this locus, namely BnaC09g05300D and BnaC09g05290D. While BnaC09g05300D contains a R2R3-MYB DNA-binding domain on sequence level, BnaC09g05290D does not [70]. This could explain why previous studies [92,93] have not described the molecular consequences of this insertion. Our findings on the genomic level are supported by RNA-Seq analyses which show a strong expression of BnaMYB28_2 in seeds. The A09 BnaMYB28 homolog might contribute to a high seed GSL content in some high-GSL lines, but was absent in all low-GSL lines investigated in this study (File S41) marking the 4 bp insertion of the C09 homolog as key determinant for seed GSL content phenotype. Interestingly, the 4 bp insertion is located in the middle of a QTL for seed GSL content which explained 48% of the phenotypic variation [94]. Furthermore, the importance of the MYB28 C09 homolog as positive regulator of GSL biosynthesis was demonstrated in B. oleracea varieties [95,96]. Yi et al. analyzed the expression of 81 genes involved in GSL biosynthesis in 12 genotypes of four B. oleracea subspecies across leaves, stems, and florets [95]. Interestingly, out of five aliphatic transcription factor-related genes, only the C09 MYB28 homolog (Bol036286) was expressed in all genotypes, again stressing its essential role in aliphatic GSL biosynthesis. The data also confirm that not all GSL MYB transcription factors need to be expressed to produce GSLs [95].
Additional genomic differences controlling seed GSL content are copy number variations. As the BnaMYB28 homolog on C02 (BnaMYB28_5) is absent in the low-GSL parent P1, while being expressed in the seeds of in the high-GSL parent P2, BnaMYB28_5 could explain some of the phenotypic variation in GSL content. The role of the MYB28 homologs on C02 and C09 in GSL biosynthesis was analyzed by double-knockout lines of B. oleracea [97]. The remaining functional MYB28 homolog on C07 and the two MYB29 homologs did not compensate the low-GSL phenotype, indicating that these homologs play an inferior role in GSL production [97]. In line with our expression studies showing that the C02 homolog BnaMYB28_5 is >12-fold higher expressed in leaves compared to seeds, the expression of the C02 MYB28 homolog is assumed to be of most importance in regulating aliphatic glucosinolate biosynthesis in aerial organs [92]. Finally, BnaMYB28_5 is much lower expressed in seeds compared to BnaMYB28_2 supporting our hypothesis that the BnaMYB28 C09 homolog is the major regulator of seed GSL content. Although these transcription factors appear responsible for a huge proportion of the GSL difference between B. napus lines, we have identified additional candidate genes associated with seed GSL content such as BnaC02g41790D (homolog of AthMAM1) and BnaA09g08410D (homolog of AthAPK). In accordance with our findings, BnaA09g01260D (homolog of AthAOP3) and BnaA09g08470D (homolog of AthTGG1) were recently identified as novel candidate genes for seed GSL content [93].

5. Conclusions

We identified and described the molecular consequences of a 4 bp insertion located in the third exon of BnaMYB28_2 on chromosome C09 as the most likely causative variant explaining the majority of the phenotypic variance in seed GSL content. B. napus lines with a low GSL content carry a 4 bp insertion in this gene, which causes a premature stop codon, leading to a most likely non-functional MYB. BnaMYB28_2 is the only GSL transcription factor highly expressed in seeds as demonstrated in the high-GSL parent P2 and other B. napus genotypes. Moreover, we identified several new candidate genes controlling SPC and SOC. The new insight into the molecular mechanisms of SPC and SOC, as well as seed GSL content can serve as useful targets for the genetic improvement of B. napus seed quality traits.

Supplementary Materials

The following files are available online at https://doi.org/10.4119/unibi/2963492. File S1: Data sets used for phylogenetic and genomic analyses. File S2: Schematic illustration of the workflow for the generation of the gold standard and follow-up delta allele frequency calculation. File S3: Variants of the reconstituted F1. File S4: Variants of the gold standard. File S5: Seed GSL content SNVs left after filtered for the gold standard. File S6: SPC SNVs left after filtered for the gold standard. File S7: dARCs of seed GSL content pools. File S8: dARCs of SPC pools. File S9: ZCRs of seed GSL content pools. File S10: ZCRs of SPC pools. File S11: Genome-wide delta allele frequency plots of seed GSL content pools. File S12: Genome-wide delta allele frequency plots of SPC pools. File S13: PAVs of GSL pool analysis. File S14: PAVs of SPC pool analysis. File S15: IGV screenshot of GSL MYB homologs expression and genomic coverage in the GSL pools and the parental genotypes, as well as transcriptomic coverage of Janetzkis Schlesischer (JS) leaves and seeds RNA-Seq data. File S16: CDS sequences from B. napus Lorenz. File S17: Peptide sequences from B. napus Lorenz. File S18: CDS sequences from B. napus Janetzkis Schlesischer. File S19: Peptide sequences from B. napus Janetzkis Schlesischer. File S20: Frame-corrected gff3 file for SnpEff analysis. File S21: Predicted high-impact variants of genes located within +/- 5 kbp of the borders of the genomic intervals associated with seed GSL content. File S22: Predicted high-impact variants of genes located within +/- 5 kbp of the borders of the genomic intervals associated with SPC content. File S23: SRA IDs of the used public available RNA-Seq data sets from B. napus. File S24: RNA-Seq mapping statistics. File S25: Genes located in genomic intervals associated with seed GSL content. File S26: Genes located in genomic intervals associated with SPC content. File S27: CDS sequences from B. napus SGDH14. File S28: Peptide sequences from B. napus SGDH14. File S29: GSL MYB transcription factors homologs. File S30: MYB amino acid sequences used for phylogenetic analysis. File S31: GSL transcription factors coding sequences of B. napus Janetzkis Schlesischer. File S32: GSL transcription factors coding sequences of B. napus Lorenz. File S33: GSL transcription factors coding sequences of B. napus SGDH14. File S34: Phylogenetic tree based on the amino acid sequences of all MYB homologs identified in Brassica species marking the key GSL MYB transcription factor clade. File S35: Phylogenetic tree based on the amino acid sequences of the key GSL transcription factors identified in Brassica species. File S36: Oligonucleotide sequences. File S37: Genomic read mapping statistics. File S38: Gene located in the deleted region of B. napus Janetzkis Schlesischer. File S39: Expression of GSL transcription factors based on public available B. napus RNA-Seq data sets. File S40: Genomic and transcriptomic read mappings of GSL pools, parental genotypes, and Janetzkis Schlesischer (JS) leaves and seeds RNA-Seq data vs. the Darmor-bzh genome sequence. (A) Whole-gene view is presented, while (B) shows a close up of the position of the 4 bp InDel. File S41: The C09 BnaMYB28_2 and A09 BnaMYB28_4 alleles association with seed GSL phenotype across various B. napus genotypes. File S42: IGV screenshot of the ~25 kbp deletion located within A09_GSL_13 in B. napus Janetzkis Schlesischer.

Author Contributions

B.W. (Bernd Weisshaar) and D.H. conceived this project. H.M.S., B.P., D.R. and D.H. conducted data analysis. H.M.S. and B.P. wrote the initial draft manuscript. B.W. (Bernd Weisshaar) and D.H. supervised this project. Z.M., F.D. and K.B. performed the plant material and genotype selection, initiated and propagated the F2 crossing population and quantified GSL, oil and protein content in seeds. B.W. (Benjamin Wittkop) provided additional genotypes (the ERANET-Assyst B. napus diversity set) and related phenotypic data. P.V. prepared all sequencing libraries and generated all sequence data analyzed in this study. All authors have read and agreed to the published version of the manuscript.

Funding

This project was funded by the Federal Ministry of Education and Research of Germany (BMBF) under the grant numbers 0315957D (NuGGET) and 031B0198A (RaPEQ). We acknowledge support for the publication costs by the Deutsche Forschungsgemeinschaft and the Open Access Publication Fund of Bielefeld University.

Institutional Review Board Statement

Not applicable.

Informed Consent Statement

Not applicable.

Data Availability Statement

All data generated in this study can be found under the ENA/NCBI Bioproject ID PRJEB36483. In detail, the Janetzkis Schlesischer and SGDH14 RNA-Seq data sets generated for this study can be found with the ENA/NCBI IDs: ERS11936124-ERS11936129 and ERS11936130-ERS11936138, respectively. The genomic data from the pools can be accessed with the ENA/NCBI IDs: ERS4275842 (GSL high pool), ERS4275843 (GSL low pool), ERS4275846 (SPC high pool) and ERS4275847 (SPC low pool). The genomic reads of the parents, Lorenz (P1) and Janetzkis Schlesischer (P2), can be found with the ENA/NCBI IDs ERS4368530 and ERS4368529, respectively. The applied scripts in this study are freely available on GitHub: https://GitHub.com/hschilbert/BnaMBS (DOI: 10.5281/zenodo.6578120).

Acknowledgments

We are thankful to the whole NuGGET and RaPEQ teams for the great support. Many thanks to Helene Schellenberg as well as to Willy Keller for excellent technical assistance. We thank Christian Möllers for providing the B. napus genotype SGDH14 and related phenotypic data.

Conflicts of Interest

The authors declare no conflict of interest.

References

  1. OECD-FAO; Connell, M.A. OECD-FAO Agricultural Outlook 2015–2024. 2015. Available online: https://www.oecd-ilibrary.org/agriculture-and-food/oecd-fao-agricultural-outlook-2015_agr_outlook-2015-en (accessed on 11 December 2020).
  2. Chalhoub, B.; Denoeud, F.; Liu, S.; Parkin, I.A.; Tang, H.; Wang, X.; Chiquet, J.; Belcram, H.; Tong, C.; Samans, B.; et al. Early allopolyploid evolution in the post-neolithic Brassica napus oilseed genome. Science 2014, 345, 950–953. [Google Scholar] [CrossRef] [PubMed] [Green Version]
  3. Wanasundara, J.P.D.; McIntosh, T.C.; Perera, S.P.; Withana-Gamage, T.S.; Mitra, P. Canola/rapeseed protein-functionality and nutrition. Oilseeds Fats Crops Lipids 2016, 23, D407. [Google Scholar] [CrossRef] [Green Version]
  4. Nesi, N.; Delourme, R.; Bregeon, M.; Falentin, C.; Renard, M. Genetic and molecular approaches to improve nutritional value of Brassica napus L. seed. Comptes Rendus Biol. 2008, 331, 763–771. [Google Scholar] [CrossRef] [PubMed]
  5. Fleddermann, M.; Fechner, A.; Rossler, A.; Bahr, M.; Pastor, A.; Liebert, F.; Jahreis, G. Nutritional evaluation of rapeseed protein compared to soy protein for quality, plasma amino acids, and nitrogen balance--a randomized cross-over intervention study in humans. Clin. Nutr. 2013, 32, 519–526. [Google Scholar] [CrossRef]
  6. Aider, M.; Barbana, C. Canola proteins: Composition, extraction, functional properties, bioactivity, applications as a food ingredient and allergenicity—A practical and critical review. Trends Food Sci. Technol. 2011, 22, 21–39. [Google Scholar] [CrossRef]
  7. Sonderby, I.E.; Geu-Flores, F.; Halkier, B.A. Biosynthesis of glucosinolates--gene discovery and beyond. Trends Plant Sci. 2010, 15, 283–290. [Google Scholar] [CrossRef]
  8. Brader, G.; Mikkelsen, M.D.; Halkier, B.A.; Tapio Palva, E. Altering glucosinolate profiles modulates disease resistance in plants. Plant J. 2006, 46, 758–767. [Google Scholar] [CrossRef]
  9. Barth, C.; Jander, G. Arabidopsis myrosinases TGG1 and TGG2 have redundant function in glucosinolate breakdown and insect defense. Plant J. 2006, 46, 549–562. [Google Scholar] [CrossRef]
  10. Bednarek, P.; Pislewska-Bednarek, M.; Svatos, A.; Schneider, B.; Doubsky, J.; Mansurova, M.; Humphry, M.; Consonni, C.; Panstruga, R.; Sanchez-Vallet, A.; et al. A glucosinolate metabolism pathway in living plant cells mediates broad-spectrum antifungal defense. Science 2009, 323, 101–106. [Google Scholar] [CrossRef]
  11. Sotelo, T.; Lema, M.; Soengas, P.; Cartea, M.E.; Velasco, P. In vitro activity of glucosinolates and their degradation products against brassica-pathogenic bacteria and fungi. Appl. Environ. Microbiol. 2015, 81, 432–440. [Google Scholar] [CrossRef] [Green Version]
  12. Halkier, B.A.; Gershenzon, J. Biology and biochemistry of glucosinolates. Annu. Rev. Plant Biol. 2006, 57, 303–333. [Google Scholar] [CrossRef] [PubMed] [Green Version]
  13. Stracke, R.; Werber, M.; Weisshaar, B. The R2R3-MYB gene family in Arabidopsis thaliana. Curr. Opin. Plant Biol. 2001, 4, 447–456. [Google Scholar] [CrossRef]
  14. Celenza, J.L.; Quiel, J.A.; Smolen, G.A.; Merrikh, H.; Silvestro, A.R.; Normanly, J.; Bender, J. The Arabidopsis ATR1 Myb transcription factor controls indolic glucosinolate homeostasis. Plant Physiol. 2005, 137, 253–262. [Google Scholar] [CrossRef] [Green Version]
  15. Gigolashvili, T.; Yatusevich, R.; Berger, B.; Muller, C.; Flugge, U.I. The R2R3-MYB transcription factor HAG1/MYB28 is a regulator of methionine-derived glucosinolate biosynthesis in Arabidopsis thaliana. Plant J. 2007, 51, 247–261. [Google Scholar] [CrossRef] [PubMed]
  16. Gigolashvili, T.; Berger, B.; Mock, H.P.; Muller, C.; Weisshaar, B.; Flugge, U.I. The transcription factor HIG1/MYB51 regulates indolic glucosinolate biosynthesis in Arabidopsis thaliana. Plant J. 2007, 50, 886–901. [Google Scholar] [CrossRef] [Green Version]
  17. Gigolashvili, T.; Engqvist, M.; Yatusevich, R.; Muller, C.; Flugge, U.I. HAG2/MYB76 and HAG3/MYB29 exert a specific and coordinated control on the regulation of aliphatic glucosinolate biosynthesis in Arabidopsis thaliana. New Phytol. 2008, 177, 627–642. [Google Scholar] [CrossRef]
  18. Frerigmann, H.; Gigolashvili, T. MYB34, MYB51, and MYB122 distinctly regulate indolic glucosinolate biosynthesis in Arabidopsis thaliana. Mol. Plant 2014, 7, 814–828. [Google Scholar] [CrossRef] [Green Version]
  19. Velasco, P.; Soengas, P.; Vilar, M.; Cartea, M.E.; del Rio, M. Comparison of Glucosinolate Profiles in Leaf and Seed Tissues of Different Brassica napus Crops. J. Am. Soc. Hortic. Sci. 2008, 133, 551–558. [Google Scholar] [CrossRef] [Green Version]
  20. Harper, A.L.; Trick, M.; Higgins, J.; Fraser, F.; Clissold, L.; Wells, R.; Hattori, C.; Werner, P.; Bancroft, I. Associative transcriptomics of traits in the polyploid crop species Brassica Napus. Nat. Biotechnol. 2012, 30, 798–802. [Google Scholar] [CrossRef]
  21. Howell, P.M.; Sharpe, A.G.; Lydiate, D.J. Homoeologous loci control the accumulation of seed glucosinolates in oilseed rape (Brassica napus). Genome 2003, 46, 454–460. [Google Scholar] [CrossRef]
  22. Li, F.; Chen, B.; Xu, K.; Wu, J.; Song, W.; Bancroft, I.; Harper, A.L.; Trick, M.; Liu, S.; Gao, G.; et al. Genome-Wide Association Study Dissects the Genetic Architecture of Seed Weight and Seed Quality in Rapeseed (Brassica napus L.). DNA Res. 2014, 21, 355–367. [Google Scholar] [CrossRef] [PubMed] [Green Version]
  23. Lu, G.; Harper, A.L.; Trick, M.; Morgan, C.; Fraser, F.; O’Neill, C.; Bancroft, I. Associative Transcriptomics Study Dissects the Genetic Architecture of Seed Glucosinolate Content in Brassica napus. DNA Res. 2014, 21, 613–625. [Google Scholar] [CrossRef] [PubMed] [Green Version]
  24. Qu, C.M.; Li, S.M.; Duan, X.J.; Fan, J.H.; Jia, L.D.; Zhao, H.Y.; Lu, K.; Li, J.N.; Xu, X.F.; Wang, R. Identification of Candidate Genes for Seed Glucosinolate Content Using Association Mapping in Brassica napus L. Genes 2015, 6, 1215–1229. [Google Scholar] [CrossRef] [Green Version]
  25. Eskandari, M.; Cober, E.R.; Rajcan, I. Genetic control of soybean seed oil: II. QTL and genes that increase oil concentration without decreasing protein or with increased seed yield. Theor. Appl. Genet. 2013, 126, 1677–1687. [Google Scholar] [CrossRef] [PubMed]
  26. Chao, H.; Wang, H.; Wang, X.; Guo, L.; Gu, J.; Zhao, W.; Li, B.; Chen, D.; Raboanatahiry, N.; Li, M. Genetic dissection of seed oil and protein content and identification of networks associated with oil content in Brassica napus. Sci. Rep. 2017, 7, 46295. [Google Scholar] [CrossRef] [Green Version]
  27. Qu, C.; Jia, L.; Fu, F.; Zhao, H.; Lu, K.; Wei, L.; Xu, X.; Liang, Y.; Li, S.; Wang, R.; et al. Genome-wide association mapping and Identification of candidate genes for fatty acid composition in Brassica napus L. using SNP markers. BMC Genom. 2017, 18, 232. [Google Scholar] [CrossRef] [Green Version]
  28. Ecke, W.; Uzunova, M.; Weissleder, K. Mapping the genome of rapeseed (Brassica napus L.). II. Localization of genes controlling erucic acid synthesis and seed oil content. Theor. Appl. Genet. 1995, 91, 972–977. [Google Scholar] [CrossRef] [PubMed]
  29. Burns, M.J.; Barnes, S.R.; Bowman, J.G.; Clarke, M.H.; Werner, C.P.; Kearsey, M.J. QTL analysis of an intervarietal set of substitution lines in Brassica napus: (i) Seed oil content and fatty acid composition. Heredity 2003, 90, 39–48. [Google Scholar] [CrossRef]
  30. Delourme, R.; Falentin, C.; Huteau, V.; Clouet, V.; Horvais, R.; Gandon, B.; Specel, S.; Hanneton, L.; Dheu, J.E.; Deschamps, M.; et al. Genetic control of oil content in oilseed rape (Brassica napus L.). Theor. Appl. Genet. 2006, 113, 1331–1345. [Google Scholar] [CrossRef]
  31. Qiu, D.; Morgan, C.; Shi, J.; Long, Y.; Liu, J.; Li, R.; Zhuang, X.; Wang, Y.; Tan, X.; Dietrich, E.; et al. A comparative linkage map of oilseed rape and its use for QTL analysis of seed oil and erucic acid content. Theor. Appl. Genet. 2006, 114, 67–80. [Google Scholar] [CrossRef]
  32. Yan, X.Y.; Li, J.N.; Fu, F.Y.; Jin, M.Y.; Chen, L.; Liu, L.Z. Co-location of seed oil content, seed hull content and seed coat color QTL in three different environments in Brassica napus L. Euphytica 2009, 170, 355–364. [Google Scholar] [CrossRef]
  33. Chen, G.; Geng, J.; Rahman, M.; Liu, X.; Tu, J.; Fu, T.; Li, G.; McVetty, P.B.E.; Tahir, M. Identification of QTL for oil content, seed yield, and flowering time in oilseed rape (Brassica napus). Euphytica 2010, 175, 161–174. [Google Scholar] [CrossRef]
  34. Sun, M.; Hua, W.; Liu, J.; Huang, S.; Wang, X.; Liu, G.; Wang, H. Design of new genome- and gene-sourced primers and identification of QTL for seed oil content in a specially high-oil Brassica napus cultivar. PLoS ONE 2012, 7, e47037. [Google Scholar] [CrossRef]
  35. Zhao, J.; Huang, J.; Chen, F.; Xu, F.; Ni, X.; Xu, H.; Wang, Y.; Jiang, C.; Wang, H.; Xu, A.; et al. Molecular mapping of Arabidopsis thaliana lipid-related orthologous genes in Brassica napus. Theor. Appl. Genet. 2012, 124, 407–421. [Google Scholar] [CrossRef]
  36. Si, P.; Mailer, R.J.; Galwey, N.; Turner, D.W. Influence of genotype and environment on oil and protein concentrations of canola (Brassica napus L.) grown across southern Australia. Aust. J. Agric. Res. 2003, 54, 397–407. [Google Scholar] [CrossRef]
  37. Li, C.; Li, B.; Qu, C.-M.; Yan, X.-Y.; Fu, F.-Y.; Liu, L.-Z.; Chen, L.; Li, J.-N. Analysis of Difference QTLs for Oil Content Between Two Environments in Brassica napus L. Acta Agron. Sin. 2011, 37, 249–254. [Google Scholar] [CrossRef]
  38. Zhu, Q.; King, G.J.; Liu, X.; Shan, N.; Borpatragohain, P.; Baten, A.; Wang, P.; Luo, S.; Zhou, Q. Identification of SNP loci and candidate genes related to four important fatty acid composition in Brassica napus using genome wide association study. PLoS ONE 2019, 14, e0221578. [Google Scholar] [CrossRef]
  39. Schneeberger, K.; Ossowski, S.; Lanz, C.; Juul, T.; Petersen, A.H.; Nielsen, K.L.; Jorgensen, J.E.; Weigel, D.; Andersen, S.U. SHOREmap: Simultaneous mapping and mutation identification by deep sequencing. Nat. Methods 2009, 6, 550–551. [Google Scholar] [CrossRef]
  40. Pucker, B.; Schilbert, H.M. Genomics and Transcriptomics Advance in Plant Sciences. In Molecular Approaches in Plant Biology and Environmental Challenges; Singh, S.P., Upadhyay, S.K., Pandey, A., Kumar, S., Eds.; Energy, Environment, and Sustainability; Springer: Singapore, 2019; pp. 419–448. [Google Scholar]
  41. Ries, D.; Holtgräwe, D.; Viehöver, P.; Weisshaar, B. Rapid gene identification in sugar beet using deep sequencing of DNA from phenotypic pools selected from breeding panels. BMC Genom. 2016, 17, 236. [Google Scholar] [CrossRef] [Green Version]
  42. Abe, A.; Kosugi, S.; Yoshida, K.; Natsume, S.; Takagi, H.; Kanzaki, H.; Matsumura, H.; Mitsuoka, C.; Tamiru, M.; Innan, H.; et al. Genome sequencing reveals agronomically important loci in rice using MutMap. Nat. Biotechnol. 2012, 30, 174–178. [Google Scholar] [CrossRef] [Green Version]
  43. Liu, S.; Yeh, C.T.; Tang, H.M.; Nettleton, D.; Schnable, P.S. Gene mapping via bulked segregant RNA-Seq (BSR-Seq). PLoS ONE 2012, 7, e36406. [Google Scholar] [CrossRef] [PubMed] [Green Version]
  44. Mascher, M.; Jost, M.; Kuon, J.E.; Himmelbach, A.; Assfalg, A.; Beier, S.; Scholz, U.; Graner, A.; Stein, N. Mapping-by-sequencing accelerates forward genetics in barley. Genome Biol. 2014, 15, R78. [Google Scholar] [CrossRef] [PubMed] [Green Version]
  45. Chen, W.; Yao, J.; Chu, L.; Yuan, Z.; Li, Y.; Zhang, Y. Genetic mapping of the nulliplex-branch gene (gb_nb1) in cotton using next-generation sequencing. Theor. Appl. Genet. 2015, 128, 539–547. [Google Scholar] [CrossRef]
  46. Itoh, N.; Segawa, T.; Tamiru, M.; Abe, A.; Sakamoto, S.; Uemura, A.; Oikawa, K.; Kutsuzawa, H.; Koga, H.; Imamura, T.; et al. Next-generation sequencing-based bulked segregant analysis for QTL mapping in the heterozygous species Brassica rapa. Theor. Appl. Genet. 2019, 132, 2913–2925. [Google Scholar] [CrossRef]
  47. Song, J.M.; Guan, Z.; Hu, J.; Guo, C.; Yang, Z.; Wang, S.; Liu, D.; Wang, B.; Lu, S.; Zhou, R.; et al. Eight high-quality genomes reveal pan-genome architecture and ecotype differentiation of Brassica napus. Nat. Plants 2020, 6, 34–45. [Google Scholar] [CrossRef]
  48. Rousseau-Gueutin, M.; Belser, C.; Da Silva, C.; Richard, G.; Istace, B.; Cruaud, C.; Falentin, C.; Boideau, F.; Boutte, J.; Delourme, R.; et al. Long-read assembly of the Brassica napus reference genome Darmor-bzh. Gigascience 2020, 9, giaa137. [Google Scholar] [CrossRef] [PubMed]
  49. Lee, H.; Chawla, H.S.; Obermeier, C.; Dreyer, F.; Abbadi, A.; Snowdon, R. Chromosome-Scale Assembly of Winter Oilseed Rape Brassica napus. Front. Plant Sci. 2020, 11, 496. [Google Scholar] [CrossRef] [PubMed]
  50. Rosso, M.G.; Li, Y.; Strizhov, N.; Reiss, B.; Dekker, K.; Weisshaar, B. An Arabidopsis thaliana T-DNA mutagenised population (GABI-Kat) for flanking sequence tag based reverse genetics. Plant Mol. Biol. 2003, 53, 247–259. [Google Scholar] [CrossRef]
  51. Andrews, S.; Fast, Q.C. A Quality Control Tool for High Throughput Sequence Data. Available online: http://www.bioinformatics.babraham.ac.uk/projects/fastqc/ (accessed on 6 October 2018).
  52. Li, H. Aligning sequence reads, clone sequences and assembly contigs with BWA-MEM. arXiv 2013, arXiv:1303.3997v1302. Available online: http://arxiv.org/abs/1303.3997.
  53. Li, H.; Handsaker, B.; Wysoker, A.; Fennell, T.; Ruan, J.; Homer, N.; Marth, G.; Abecasis, G.; Durbin, R. The Sequence Alignment/Map format and SAMtools. Bioinformatics 2009, 25, 2078–2079. [Google Scholar] [CrossRef] [Green Version]
  54. McKenna, A.; Hanna, M.; Banks, E.; Sivachenko, A.; Cibulskis, K.; Kernytsky, A.; Garimella, K.; Altshuler, D.; Gabriel, S.; Daly, M.; et al. The Genome Analysis Toolkit: A MapReduce framework for analyzing next-generation DNA sequencing data. Genome Res. 2010, 20, 1297–1303. [Google Scholar] [CrossRef] [PubMed] [Green Version]
  55. DePristo, M.A.; Banks, E.; Poplin, R.; Garimella, K.V.; Maguire, J.R.; Hartl, C.; Philippakis, A.A.; del Angel, G.; Rivas, M.A.; Hanna, M.; et al. A framework for variation discovery and genotyping using next-generation DNA sequencing data. Nat. Genet. 2011, 43, 491–498. [Google Scholar] [CrossRef] [PubMed]
  56. Van der Auwera, G.A.; Carneiro, M.O.; Hartl, C.; Poplin, R.; Del Angel, G.; Levy-Moonshine, A.; Jordan, T.; Shakir, K.; Roazen, D.; Thibault, J.; et al. From FastQ data to high confidence variant calls: The Genome Analysis Toolkit best practices pipeline. Curr. Protoc. Bioinform. 2013, 11, 1110. [Google Scholar] [CrossRef]
  57. Schilbert, H.M.; Rempel, A.; Pucker, B. Comparison of Read Mapping and Variant Calling Tools for the Analysis of Plant NGS Data. Plants 2020, 9, 439. [Google Scholar] [CrossRef] [Green Version]
  58. Pucker, B.; Brockington, S.F. Genome-wide analyses supported by RNA-Seq reveal non-canonical splice sites in plant genomes. BMC Genom. 2018, 19, 980. [Google Scholar] [CrossRef] [PubMed] [Green Version]
  59. Emms, D.M.; Kelly, S. OrthoFinder: Phylogenetic orthology inference for comparative genomics. Genome Biol. 2019, 20, 238. [Google Scholar] [CrossRef] [Green Version]
  60. Pucker, B.; Holtgräwe, D.; Weisshaar, B. Consideration of non-canonical splice sites improves gene prediction on the Arabidopsis thaliana Niederzenz-1 genome sequence. BMC Res. Notes 2017, 10, 667. [Google Scholar] [CrossRef] [Green Version]
  61. Pucker, B.; Holtgräwe, D.; Rosleff Sörensen, T.; Stracke, R.; Viehöver, P.; Weisshaar, B. A De Novo Genome Sequence Assembly of the Arabidopsis thaliana Accession Niederzenz-1 Displays Presence/Absence Variation and Strong Synteny. PLoS ONE 2016, 11, e0164321. [Google Scholar] [CrossRef] [Green Version]
  62. Cingolani, P.; Platts, A.; Wang, L.L.; Coon, M.; Nguyen, T.; Wang, L.; Land, S.J.; Lu, X.; Ruden, D.M. A program for annotating and predicting the effects of single nucleotide polymorphisms, SnpEff: SNPs in the genome of Drosophila melanogaster strain w1118; iso-2; iso-3. Fly 2012, 6, 80–92. [Google Scholar] [CrossRef] [PubMed] [Green Version]
  63. Behnke, N.; Suprianto, E.; Möllers, C. A major QTL on chromosome C05 significantly reduces acid detergent lignin (ADL) content and increases seed oil and protein content in oilseed rape (Brassica napus L.). Theor. Appl. Genet. 2018, 131, 2477–2492. [Google Scholar] [CrossRef] [PubMed]
  64. Schilbert, H.M.; Schöne, M.; Baier, T.; Busche, M.; Viehöver, P.; Weisshaar, B.; Holtgräwe, D. Characterization of the Brassica napus flavonol synthase gene family reveals bifunctional flavonol synthases. Front. Plant Sci. 2021, 12, 733762. [Google Scholar] [CrossRef] [PubMed]
  65. Dobin, A.; Davis, C.A.; Schlesinger, F.; Drenkow, J.; Zaleski, C.; Jha, S.; Batut, P.; Chaisson, M.; Gingeras, T.R. STAR: Ultrafast universal RNA-seq aligner. Bioinformatics 2013, 29, 15–21. [Google Scholar] [CrossRef]
  66. Liao, Y.; Smyth, G.K.; Shi, W. featureCounts: An efficient general purpose program for assigning sequence reads to genomic features. Bioinformatics 2014, 30, 923–930. [Google Scholar] [CrossRef] [Green Version]
  67. Pucker, B.; Reiher, F.; Schilbert, H.M. Automatic Identification of Players in the Flavonoid Biosynthesis with Application on the Biomedicinal Plant Croton tiglium. Plants 2020, 9, 1103. [Google Scholar] [CrossRef] [PubMed]
  68. Katoh, K.; Standley, D.M. MAFFT multiple sequence alignment software version 7: Improvements in performance and usability. Mol. Biol. Evol. 2013, 30, 772–780. [Google Scholar] [CrossRef] [PubMed] [Green Version]
  69. Price, M.N.; Dehal, P.S.; Arkin, A.P. FastTree: Computing large minimum evolution trees with profiles instead of a distance matrix. Mol. Biol. Evol. 2009, 26, 1641–1650. [Google Scholar] [CrossRef] [PubMed]
  70. Seo, M.S.; Kim, J.S. Understanding of MYB Transcription Factors Involved in Glucosinolate Biosynthesis in Brassicaceae. Molecules 2017, 22, 1549. [Google Scholar] [CrossRef] [PubMed] [Green Version]
  71. Robinson, J.T.; Thorvaldsdottir, H.; Winckler, W.; Guttman, M.; Lander, E.S.; Getz, G.; Mesirov, J.P. Integrative genomics viewer. Nat. Biotechnol. 2011, 29, 24–26. [Google Scholar] [CrossRef] [Green Version]
  72. Bus, A.; Korber, N.; Snowdon, R.J.; Stich, B. Patterns of molecular variation in a species-wide germplasm set of Brassica napus. Theor. Appl. Genet. 2011, 123, 1413–1423. [Google Scholar] [CrossRef] [PubMed]
  73. Qin, C.; Wang, X. The Arabidopsis Phospholipase D Family. Characterization of a Calcium-Independent and Phosphatidylcholine-Selective PLDζ1 with Distinct Regulatory Domains. Plant Physiol. 2002, 128, 1057–1068. [Google Scholar] [CrossRef] [Green Version]
  74. Devaiah, S.P.; Pan, X.; Hong, Y.; Roth, M.; Welti, R.; Wang, X. Enhancing seed quality and viability by suppressing phospholipase D in Arabidopsis. Plant J. 2007, 50, 950–957. [Google Scholar] [CrossRef] [PubMed]
  75. Jia, Y.; Tao, F.; Li, W. Lipid profiling demonstrates that suppressing Arabidopsis phospholipase Ddelta retards ABA-promoted leaf senescence by attenuating lipid degradation. PLoS ONE 2013, 8, e65687. [Google Scholar] [CrossRef]
  76. Chen, J.; Li, W.Q.; Jia, Y.X. The Serine Carboxypeptidase-Like Gene SCPL41 Negatively Regulates Membrane Lipid Metabolism in Arabidopsis thaliana. Plants 2020, 9, 696. [Google Scholar] [CrossRef] [PubMed]
  77. Nützmann, H.W.; Huang, A.; Osbourn, A. Plant metabolic clusters—From genetics to genomics. New Phytol. 2016, 211, 771–789. [Google Scholar] [CrossRef] [PubMed] [Green Version]
  78. Johnstone, A.D.; Mullen, R.T.; Mangroo, D. Arabidopsis At2g40730 encodes a cytoplasmic protein involved in nuclear tRNA export. Botany 2011, 89, 175–190. [Google Scholar] [CrossRef]
  79. Cho, M.; Lee, Z.W.; Cho, H.T. ATP-binding cassette B4, an auxin-efflux transporter, stably associates with the plasma membrane and shows distinctive intracellular trafficking from that of PIN-FORMED proteins. Plant Physiol. 2012, 159, 642–654. [Google Scholar] [CrossRef] [PubMed] [Green Version]
  80. Tarling, E.J.; Edwards, P.A. Dancing with the sterols: Critical roles for ABCG1, ABCA1, miRNAs, and nuclear and cell surface receptors in controlling cellular sterol homeostasis. Biochim. Biophys. Acta (BBA) Gene Regul. Mech. 2012, 1821, 386–395. [Google Scholar] [CrossRef]
  81. Ducos, E.; Verges, V.; Duge de Bernonville, T.; Blanc, N.; Giglioli-Guivarc’h, N.; Dutilleul, C. Remarkable Evolutionary Conservation of Antiobesity ADIPOSE/WDTC1 Homologs in Animals and Plants. Genetics 2017, 207, 153–162. [Google Scholar] [CrossRef] [PubMed] [Green Version]
  82. Farazi, T.A.; Waksman, G.; Gordon, J.I. The biology and enzymology of protein N-myristoylation. J. Biol. Chem. 2001, 276, 39501–39504. [Google Scholar] [CrossRef] [PubMed] [Green Version]
  83. Calderon-Villalobos, L.I.; Nill, C.; Marrocco, K.; Kretsch, T.; Schwechheimer, C. The evolutionarily conserved Arabidopsis thaliana F-box protein AtFBP7 is required for efficient translation during temperature stress. Gene 2007, 392, 106–116. [Google Scholar] [CrossRef]
  84. Cui, S.; Fukao, Y.; Mano, S.; Yamada, K.; Hayashi, M.; Nishimura, M. Proteomic analysis reveals that the Rab GTPase RabE1c is involved in the degradation of the peroxisomal protein receptor PEX7 (peroxin 7). J. Biol. Chem. 2013, 288, 6014–6023. [Google Scholar] [CrossRef] [PubMed] [Green Version]
  85. Liu, S.; Fan, C.; Li, J.; Cai, G.; Yang, Q.; Wu, J.; Yi, X.; Zhang, C.; Zhou, Y. A genome-wide association study reveals novel elite allelic variations in seed oil content of Brassica napus. Theor. Appl. Genet. 2016, 129, 1203–1215. [Google Scholar] [CrossRef]
  86. Nintemann, S.J.; Hunziker, P.; Andersen, T.G.; Schulz, A.; Burow, M.; Halkier, B.A. Localization of the glucosinolate biosynthetic enzymes reveals distinct spatial patterns for the biosynthesis of indole and aliphatic glucosinolates. Physiol. Plant. 2018, 163, 138–154. [Google Scholar] [CrossRef]
  87. Baskar, V.; Park, S.W. Molecular characterization of BrMYB28 and BrMYB29 paralogous transcription factors involved in the regulation of aliphatic glucosinolate profiles in Brassica rapa ssp. pekinensis. Comptes Rendus Biol. 2015, 338, 434–442. [Google Scholar] [CrossRef] [PubMed]
  88. Yu, Y.-T.; Wu, Z.; Lu, K.; Bi, C.; Liang, S.; Wang, X.-F.; Zhang, D.-P. Overexpression of the MYB transcription factor MYB28 or MYB99 confers hypersensitivity to abscisic acid in Arabidopsis. J. Plant Biol. 2016, 59, 152–161. [Google Scholar] [CrossRef]
  89. Sarazin, V.; Duclercq, J.; Mendou, B.; Aubanelle, L.; Nicolas, V.; Aono, M.; Pilard, S.; Guerineau, F.; Sangwan-Norreel, B.; Sangwan, R.S. Arabidopsis BNT1, an atypical TIR-NBS-LRR gene, acting as a regulator of the hormonal response to stress. Plant Sci. 2015, 239, 216–229. [Google Scholar] [CrossRef] [PubMed]
  90. Choi, H.I.; Park, H.J.; Park, J.H.; Kim, S.; Im, M.Y.; Seo, H.H.; Kim, Y.W.; Hwang, I.; Kim, S.Y. Arabidopsis calcium-dependent protein kinase AtCPK32 interacts with ABF4, a transcriptional regulator of abscisic acid-responsive gene expression, and modulates its activity. Plant Physiol. 2005, 139, 1750–1761. [Google Scholar] [CrossRef] [Green Version]
  91. Nour-Eldin, H.H.; Andersen, T.G.; Burow, M.; Madsen, S.R.; Jorgensen, M.E.; Olsen, C.E.; Dreyer, I.; Hedrich, R.; Geiger, D.; Halkier, B.A. NRT/PTR transporters are essential for translocation of glucosinolate defence compounds to seeds. Nature 2012, 488, 531–534. [Google Scholar] [CrossRef]
  92. Kittipol, V.; He, Z.; Wang, L.; Doheny-Adams, T.; Langer, S.; Bancroft, I. Genetic architecture of glucosinolate variation in Brassica napus. J. Plant Physiol. 2019, 240, 152988. [Google Scholar] [CrossRef]
  93. Wang, B.; Wu, Z.; Li, Z.; Zhang, Q.; Hu, J.; Xiao, Y.; Cai, D.; Wu, J.; King, G.J.; Li, H.; et al. Dissection of the genetic architecture of three seed-quality traits and consequences for breeding in Brassica napus. Plant Biotechnol. J. 2018, 16, 1336–1348. [Google Scholar] [CrossRef] [Green Version]
  94. Stein, A.; Coriton, O.; Rousseau-Gueutin, M.; Samans, B.; Schiessl, S.V.; Obermeier, C.; Parkin, I.A.P.; Chevre, A.M.; Snowdon, R.J. Mapping of homoeologous chromosome exchanges influencing quantitative trait variation in Brassica napus. Plant Biotechnol. J. 2017, 15, 1478–1489. [Google Scholar] [CrossRef] [PubMed] [Green Version]
  95. Yi, G.E.; Robin, A.H.; Yang, K.; Park, J.I.; Kang, J.G.; Yang, T.J.; Nou, I.S. Identification and expression analysis of glucosinolate biosynthetic genes and estimation of glucosinolate contents in edible organs of Brassica oleracea subspecies. Molecules 2015, 20, 13089–13111. [Google Scholar] [CrossRef] [PubMed]
  96. Yin, L.; Chen, H.; Cao, B.; Lei, J.; Chen, G. Molecular Characterization of MYB28 Involved in Aliphatic Glucosinolate Biosynthesis in Chinese Kale (Brassica oleracea var. alboglabra Bailey). Front. Plant Sci. 2017, 8, 1083. [Google Scholar] [CrossRef] [PubMed] [Green Version]
  97. Neequaye, M.; Stavnstrup, S.; Harwood, W.; Lawrenson, T.; Hundleby, P.; Irwin, J.; Troncoso-Rey, P.; Saha, S.; Traka, M.H.; Mithen, R.; et al. CRISPR-Cas9-Mediated Gene Editing of MYB28 Genes Impair Glucoraphanin Accumulation of Brassica oleracea in the Field. CRISPR J. 2021, 4, 416–426. [Google Scholar] [CrossRef] [PubMed]
Figure 1. Schematic illustration of interval detection and extraction of genes carrying high-impact variants. First both raw variants of each pool are combined into a merged VCF file. Interval detection was performed based on the density of dARCs (left). A set of clean variants were extracted from the merged VCF file and used for the detection of high-impact SNVs (right). Finally, the results of both approaches are integrated (bottom). Raw variants (grey circles); dARCs (yellow points); ZCR (purple); genomic intervals (dark blue rectangles); high-impact variants (red points); genes carrying high-impact variants (red rectangles).
Genes 13 01131 g001
Figure 2. Distribution of traits in the F2 population. (A) Distribution of seed GSL content, (B) seed protein content, and (C) seed oil content of the segregating F2 population. Seeds of individual F2 plants were harvested and phenotyped via near-infrared resonance spectroscopy (NIRS). The sample size and mean of the distribution are given by N and x ¯ , respectively. The rectangles in (A,B) mark the tails of the distributions used for pool building, e.g., the low-GSL (GSL_L), high-GSL (GSL_H), low-SPC (SPC_L_A2) and high-SPC (SPC_H_A2) pools. As SPC and SOC are negatively correlated the SPC and SOC pools are largely congruent and thus only the SPC pools were marked. The tails relevant for building the contrasting GSL pools account for 5.28% (<30.83 µmol/g) for the GSL_L pool and 2.76% (>70 µmol/g) for the GSL_H pool of the whole F2 population. The tails from the SPC distribution used to build the pools comprise 3.93% (<16.0%) for SPC_L_A2 and 2.33% (>23.1%) for SPC_H_A2 of the whole F2 population.
Genes 13 01131 g002
Figure 3. Genome-wide plot of normalized dARC density for seed GSL content. The normalized density of dARCs is plotted across all pseudochromosomes of the B. napus Darmor-bzh genome sequence. A heatmap ranging from white to red represents the normalized density of dARCs, where a red color represents a high amount of dARCs.
Genes 13 01131 g003
Figure 4. Expression of B. napus GSL MYB homologs. The expression of BnaMYB28, BnaMYB29, BnaMYB34, BnaMYB51, and BnaMYB122 homologs in leaves and seeds of P2 on the basis of the (A) Darmor-bzh and (B) Zheyou7 genome sequence, as well as their annotation is displayed. The value displayed for BnaMYB28_2 on the basis of Darmor-bzh is the average FPKM of both annotated fragments at this locus, BnaC09g05290D and BnaC09g05300D. The analysis was performed on the basis of the Darmor-bzh and Zheyou7 assembly to ensure that all B. napus GSL MYB homologs are represented. For example, although the BnaMYB28_5 homolog on C02 is missing in the Darmor-bzh genome sequence, the allele of BnaMYB28_5 in P2 could be assigned based on the corresponding Zheyou7 sequence. FPKMs = fragments per kilobase million; n = 3.
Genes 13 01131 g004
Figure 5. A 4 bp insertion is associated with the inactivation of BnaMYB28_2 which is strongly expressed in seeds. (A) Genomic structure of BnaC09g05300D and BnaC09g05290D and alignments of several Brassicaceae MYB28 homologs. The stop codon is shown in bold. (B) Translated reading frame stressing the stop codon derived from the 4 bp insertion. The 4 bp insertion is shown in blue, while the ancestral allele is marked in red.
Genes 13 01131 g005
Figure 6. The 4 bp insertion is associated with low seed GSL content. (A) The two C09 BnaMYB28_2 alleles showing the ancestral allele and the 4 bp insertion allele. (B) Boxplots for seed GSL content based on the genotypes derived from the BnASSYST diversity panel (n = 100): n = 90 for BnaMYB28_2_2*; n = 2 for BnaMYB28_2_2* + BnaMYB28_2_1*; n = 8 for BnaMYB28_2_1*. Differences between genotypes were analyzed by Mann–Whitney U-test and corrected for multiple testing. n.s. represents not significant.
Genes 13 01131 g006
Figure 7. Genome-wide plot of normalized dARC density for SPC and SOC. The normalized density of dARCs is plotted across all pseudochromosomes of the B. napus Darmor-bzh genome sequence. A heatmap ranging from white to red represents the normalized density of dARCs, where a red color represents a high amount of dARCs.
Genes 13 01131 g007
Table 1. Variant calling and dARCs statistics. For each data set, the amount of called raw variants is given. Moreover, the number of variants in the gold standard is listed, as well as the number of SNVs left after filtering for the gold-standard SNVs. Finally, the number of dARCs is stated.
SamplesRaw VariantsGold-Standard SNVs
P13,580,759903,253 (File S4)
P24,905,445
SNVs left after filtering for gold standardStatistically meaningful differential allele-specific read counts (dARCs)
SPC_A2 High-pool5,215,492889,280 (File S6)8407
SPC_A2 Low-pool4,848,100
GSL High-pool5,105,239880,842 (File S5)20,726
GSL Low-pool5,003,187
Table 2. Genomic intervals of seed GSL content. The chromosomal position, size, start and end per genomic interval are listed.
Interval IDChromosomeSize [bp]Start [bp]End [bp]
A02_GSL_1chrA02326,90923,675,28824,002,197
A06_GSL_1chrA0690,19116,818,38816,908,579
A09_GSL_1chrA091,007,69828,6681,036,366
A09_GSL_2chrA09479,3171,465,9241,945,241
A09_GSL_3chrA0973,2142,071,8452,145,059
A09_GSL_4chrA09317,6242,303,4552,621,079
A09_GSL_5chrA09248,1983,036,6803,284,878
A09_GSL_6chrA09395,2393,440,9413,836,180
A09_GSL_7chrA09308,1804,056,0244,364,204
A09_GSL_8chrA0979,5404,580,3384,659,878
A09_GSL_9chrA09270,2346,924,3627,194,596
A09_GSL_10chrA09934,2108,018,9318,953,141
A09_GSL_11chrA09215,2099,150,6829,365,891
A09_GSL_12chrA09173,0369,514,6769,687,712
A09_GSL_13chrA09247,6929,859,34110,107,033
A09_GSL_14chrA0978,70310,831,70010,910,403
A09_GSL_15chrA09117,58810,993,98811,111,576
A09_GSL_16chrA09374,26612,597,24712,971,513
A09_GSL_17chrA09710,70313,041,08413,751,787
A09_GSL_18chrA09378,00416,764,14217,142,146
C02_GSL_1chrC02247,71812,063,72412,311,442
C02_GSL_2chrC02724,82044,411,66245,136,482
C02_GSL_3chrC02431,33245,205,89745,637,229
C07_GSL_1chrC07562,63732,063,22332,625,860
C07_GSL_2chrC07204,48835,236,18335,440,671
C09_GSL_1chrC09671,0971,152,5401,823,637
C09_GSL_2chrC091,320,9091,911,6293,232,538
C09_GSL_3chrC09195,7663,410,3093,606,075
C09_GSL_4chrC09425,4783,699,6964,125,174
C09_GSL_5chrC09199,4144,285,2804,484,694
Table 3. B. napus GSL MYB gene copies identified in the parental genotypes. The number of the GSL MYB genes identified in the parental genotypes B. napus Janetzkis Schlesischer (P2) and B. napus Lorenz (P1) is listed.
Lorenz (P1)Janetzkis Schlesischer (P2)
BnaMYB2845
BnaMYB2944
BnaMYB3487
BnaMYB5177
BnaMYB12265
Table 4. BnaMYB28 homologs. The BnaMYB28 homologs identified in the B. napus cultivars Zheyou7, Darmor-bzh, Janetzkis Schlesischer (P2), and Lorenz (P1) are listed.
NameZheyou7Darmor-bzhJanetzkis 123456Schlesischer (P2)Lorenz (P1)
BnaMYB28_1BnaC07T0355800ZYBnaCnng43220DPresent in genomic mappingPresent in genomic mapping
BnaMYB28_2BnaC09T0054800ZYBnaC09g05300D
+ BnaC09g05290D
Present in genomic mappingPresent in genomic mapping
BnaMYB28_3BnaA03T0422000ZYBnaA03g40190DPresent in genomic mappingPresent in genomic mapping
BnaMYB28_4BnaA09T0074900ZYDeletedAbsentAbsent
BnaMYB28_5BnaC02T0362400ZYDeletedPresent in genomic mappingAbsent
BnaMYB28_6BnaA02T0409000ZYNon-functional copyPresent in genomic mappingPresent in genomic mapping
Table 5. Genomic intervals of SPC and SOC content. The chromosomal position, size, start and end per genomic interval are listed.
Interval IDChromosomeSize [bp]Start [bp]End [bp]
A01_SPC_1chrA01143,41015,427,09315,570,503
A06_SPC_1chrA06247,1648,434,5968,681,760
A06_SPC_2chrA0672,0979,931,98910,004,086
A06_SPC_3chrA06410,67210,177,02710,587,699
A09_SPC_1chrA0941,58533,415,52433,457,109
C03_SPC_1chrC0386,0282,142,0252,228,053
C04_SPC_1chrC0453,519364,385417,904
C04_SPC_2chrC0410,6771,104,3771,115,054
C08_SPC_1chrC08252,4991,743,2781,995,777
C08_SPC_2chrC082,072,6586,332,2628,404,920
C08_SPC_3chrC08472,0539,033,2059,505,258
C08_SPC_4chrC08464,03412,719,35013,183,384
C08_SPC_5chrC08138,55413,409,50713,548,061
C09_SPC_1chrC0992,09116,262,88716,354,978
C09_SPC_2chrC09381,82317,275,71417,657,537
Publisher’s Note: MDPI stays neutral with regard to jurisdictional claims in published maps and institutional affiliations.

