Abstract
This study examined the effects of single-nucleotide polymorphisms (SNPs) on the development of bladder cancer, adding longest-held occupational and industrial history as regulators. The genome purified from blood was genotyped, followed by SNP imputation. In the genome-wide association study (GWAS), several patterns of industrial/occupational classifications were added to logistic regression models. The association test between bladder cancer development and the calculated genetic score for each gene region was evaluated (gene-wise analysis). In the GWAS and gene-wise analysis, the gliomedin gene satisfied both suggestive association levels of 10−5 in the GWAS and 10−4 in the gene-wise analysis for male bladder cancer. The expression of the gliomedin protein in the nucleus of bladder cancer cells decreased in cancers with a tendency to infiltrate and those with strong cell atypia. It is hypothesized that gliomedin is involved in the development of bladder cancer.
1. Introduction
There were approximately 83,730 new cases of bladder cancer (64,280 in men and 19,450 in women) and approximately 17,200 deaths from bladder cancer (12,260 in men and 4940 in women) in the United States in 2021. The rates of new bladder cancer and death due to bladder cancer have been decreasing slightly in women in recent years, whereas in men, incidence rates have been decreasing, but death rates are stable []. In Japan, 23,230 cases (17,555 in men and 15,675 in women) of bladder cancer were diagnosed in 2018, and the number of deaths from bladder cancer was 8911 (6014 in men and 2897 in women) in 2019 [].
Muscle invasive bladder cancer requires highly invasive treatments such as radical cystectomy and systemic chemotherapy. In addition, even non-muscle infiltrating bladder cancer often recurs in the bladder and requires multiple treatments. Thus, medical treatment for bladder cancer requires a great deal of time and medical expenses.
It is well known that smoking is a risk factor for developing bladder cancer [,]. Regarding alcohol drinking, the American Society of Clinical Oncology stated in 2018 that more than 5% of new cancer cases were due to alcohol consumption []. We also reported that alcohol consumption is an independent risk factor for the development of bladder cancer in the Japanese population [].
Occupational and environmental factors are important, in addition to genetic predisposition for bladder cancer. There was a 45-year observational study in Nordic countries on the association between occupation and the development of bladder cancer. According to this study, occupations with a significantly increased incidence of urothelial cancer, with a standardized incidence ratio of 1.20 or higher, include male waiters, chimney sweeps, hairdressers, assistant nurses, seamen, plumbers, cooks and stewards, beverage workers, female tobacco workers, printers, waiters, chemical process workers, sales agents, hairdressers, mechanics, and administrators [].
This study examined the effects of single-nucleotide polymorphisms (SNPs) in the germline genome on the development of bladder cancer in Japan, adding occupational and industrial history as regulators.
A genome-wide association study (GWAS) comprehensively searches the entire genome for gene polymorphisms that exhibit significant frequency differences between an unrelated patient population of a specific disease and an unrelated control population.
In genome-wide studies that analyzed the genomes of bladder cancer patients, 57 SNPs that may increase susceptibility to bladder cancer were identified in the GWAS Catalog (Supplementary Table S1). In addition, there are many GWAS papers on bladder cancer [,,,,,,,,,,,,,,,,,]. In particular, the NAT2 slow acetylator and GSTM1 null genotype are considered to be potential genetic risk factors for the development of bladder cancer []. Polymorphisms in the NAT2 gene were also investigated in Japan, with a risk ratio of 7.80-times []. In addition, a relatively large GWAS for Japanese bladder cancer patients was announced in 2015, and although smoking has been examined and adjusted as an environmental factor, occupational factors have not been examined []. Therefore, it is important to examine the relationship between bladder cancer in the Japanese population and SNPs by adjusting for the industrial/occupational history, in addition to sex, smoking history, and alcohol drinking history.
2. Materials and Methods
The genome was purified using 10 mL of blood mixed with EDTA collected from 352 bladder cancer patients (302 males, 50 females) and 434 control patients (395 males, 39 females) at Japan Organization of Occupational Health and Safety, Kanto Rosai Hospital and Tokyo Metropolitan Tama Medical Center. Control patients did not include those with upper tract urothelial cancer because bladder cancer and upper tract urothelial cancer are considered to be malignant tumors that are anatomically, histologically, and epidemiologically similar.
Occupational and environmental data were obtained from the Inpatient Clinico-Occupational Database of Rosai Hospital Group (ICOD-R), provided by the Japan Organization of Occupational Health and Safety. The ICOD-R includes an occupational history of current and past three jobs, information on smoking, and alcohol habits using interviews and questionnaires completed at the time of admission. Detailed occupational histories were coded with three-digit codes in the Japan Standard Occupational Classification and Japan Standard Industrial Classification corresponding to the International Standard Industrial Classification and International Standard Occupational Classification, respectively []. The Japan Standard Occupational Classification is composed of 12 major groups, 74 minor groups, and 329 unit groups [], whereas the Japan Standard Industrial Classification is composed of 20 divisions, 99 major groups, 530 groups, and 1460 industries []. Other clinical data were obtained from electronic medical records. Missing values exist due to omission or lack of description by patients.
2.1. A New Classification of Industry/Occupation
To create a new classification, we divided the occupations into four groups: professional, service, management, and blue-collar workers, and further divided the industries into three groups: white-collar industry, blue-collar industry, and service industry. These two kinds of groups were combined into a total of 12 (4 × 3) industry/occupation classes [,]. Using this classification, tentatively named the Zaitsu classification, we previously reported an association between occupation and the prognosis of bladder cancer [].
2.2. Clinical and Environmental Factor
From the clinical data, categorical variables were preliminarily analyzed by Fisher’s exact test between two or multiple groups, and continuous variables were preliminarily analyzed by the Mann–Whitney U test. Furthermore, logistic regression analysis was performed with the development of bladder cancer as the objective variable, whereas age, sex, Brinkman index (BI) classified into four groups (0: BI 0, 1: 1–399, 2: 400–799, 3: 800≤), alcohol consumption history (2 levels, yes or no), and industrial / occupational classifications of the longest-held job for each patient were explanatory variables.
The industrial/occupational classifications added to the logistic regression model here were: (a) industrial classification (20 divisions, Supplementary Table S2); (b) the 35 major groups included in industrial classification divisions D (Construction), E (Manufacturing), and H (Transport and postal services); and (c) Occupational classification major groups (12 categories, Supplementary Table S3). From the logistic regression models of a, b, and c, the explanatory variables related to industry/occupation were selected by the backward step-wise method using the Akaike information criterion.
2.3. Genotyping
Performed by Riken Genesis Co., Ltd. (Taito-Ku, Tokyo, Japan). Samples were genotyped using the Illumina Infinium Asian Screening Array-24 v1.0 BeadChip, which combines genome-wide coverage of East Asian populations, relevant clinical research content, and scalability for genomic screening. For quality control of samples, we excluded those with (i) a sample call rate < 0.99, (ii) a person with the lowest call rate from the pairs with a proportion IBD (identity-by-descent) > 0.1875, and (iii) outliers from Japanese clusters identified by principal component analysis using the genotyped samples and East Asians in the International Genome Sample Resource [] (The 1000 Genomes Project Consortium 2015). For quality control of genotypes, we excluded those with a (i) SNP call rate < 0.99 or (ii) p-value for the Hardy-Weinberg Disequilibrium test < 0.001.
2.4. Imputation
We utilized SNP imputation for all samples under 1000 Genomes Project Phase 3 as a reference panel []. We implemented the pre-phasing by Eagle [,] and imputation by Minimac3 []. After imputation, we excluded SNPs with an imputation quality of R-square < 0.3.
2.5. GWAS
We conducted 6 GWAS patterns for bladder cancer development by logistic linear models using SNP dosage obtained by SNP imputation and Efficient and Parallelizable Association Container Toolbox (EPACTS) []. In the association test, age, sex, smoking history (Brinkman Index, ordered category with 0 < 1 < 2 < 3 levels), alcohol consumption history (2 levels, yes or no), and several patterns of industrial/occupational classifications were added to logistic regression models. Tested industrial/occupational classifications were: (i) 1 variable with 20 levels for industrial classification divisions, (ii) selected industrial classification division(s) from 20 variables with 2 levels (yes or no) by the backward step-wise method in a logistic regression model without SNP dosage, (iii) 1 variable with 12 levels for occupational classification major groups, (iv) selected occupational classification major group(s) from 12 variables with 2 levels (yes or no) by the backward step-wise method in a logistic regression model without SNP dosage, (v) selected industrial classification major groups from 35 variables with 2 levels (yes or no) by the backward step-wise method in a logistic regression model without SNP dosage, and (vi) the Zaitsu classification. We also used only male samples for GWAS, taking into account sex differences in some occupations. We did not conduct GWAS using only females due to the small number of cases. We set the genome-wide significance level for our study at p = 5 × 10⁻⁸ and suggestive association level at p = 10−5 [].
2.6. Gene-Wise Analysis
For SNPs contained within 50 bp upstream and downstream of the gene regions defined in Ref Gene [], we calculated the genetic score (GS) [] as described below, and the association test between bladder cancer development and GS for each gene region was evaluated by the Burden test and SKAT-O test using EPACTS (version 3.2.6) (University of Michigan, Ann Arbor, MI, USA). In our study, we performed gene-wise analysis for 20,865 regions. We set the genome-wide significance level for our study at p = 2.4 × 10⁻⁶ (=0.05/20,865) and suggestive association level at p = 10−4. Adjusting factors in GWAS were also included in the gene-wise analysis. GWAS and gene-wise analysis were performed by StaGen Co., Ltd. (Taito-ku, Tokyo, Japan 111-0051).
Here, the GSi of an individual patient is equal to the weighted sum of the individual’s genotypes, xj (0, 1, 2), at SNPs in genei. Weights (βj) are calculated by EPACTS and M is the number of SNPs in genei.
2.7. Immunohistochemistry
The expression of gliomedin protein was examined by tissue immunostaining using paraffin-embedded bladder tumor tissue removed by transurethral resection of the bladder tumor. The antibody used was anti-GLDN (gliomedin) polyclonal antibody (26185-1-AP, Proteintech, Rosemont, IL, USA). Two independent pathologists evaluated histological staining by the immunoreactive score [] and individual scores were analyzed after averaging.
2.8. Study Approval
The Ethical Committee of the Japan Organization of Occupational Health and Safety approved the experiments (2018-2). All experiments were performed in accordance with relevant guidelines and regulations, including any relevant details. Written informed consent was received from patients prior to inclusion in the study.
3. Results
3.1. Clinical and Environmental Factors
The age of the bladder cancer patients included was slightly lower than the control patients for men and higher for women (Table 1). Malignant tumors other than urothelial cancer were observed in 13.9% of men and 18.0% of women in the bladder cancer group, and 72.2% of men and 59.0% of women in the control group. In the male control group, 46.6% had prostate cancer and 11.1% had renal cell carcinoma (Supplementary Table S4).

Table 1.
Clinical and environmental factors.
In terms of smoking history, a high Brinkman index classified into four stages and the development of male bladder cancer were slightly related. The Brinkman index 2–3 group had more male bladder cancer than the Brinkman index 0–1 group (Table 1). As for alcohol consumption history, bladder cancer patients drank slightly less alcohol than control patients overall (Table 1). The overall distributions of the divisions of industrial classification (Table 2), occupational classification major groups (Table 3), and groups in the Zaitsu classification (Table 4) were not significantly different from controls in male, female, and all bladder cancer patients. Looking at the individual divisions of industrial classification, bladder cancer was less frequent in division G and more frequent in division S in male cases and all cases (Table 2). In addition, in the individual major groups of occupational classification, bladder cancer was significantly more common in the major group F in male cases and all cases (Table 3).
Table 2.
Distribution of industrial classification divisions.
Table 3.
Distribution of occupational classification major groups.
Table 4.
Distribution of groups in the Zaitsu classification.
In the selection of explanatory variables concerning industry/occupation by the backward step-wise method for logistic regression models, industrial classification divisions G and S, and occupational classification major group F, were selected in male cases from all divisions and from all major groups, respectively, whereas in all cases including both men and women, industrial classification divisions G, L, and S, and occupational classification major group F remained.
In addition, from the major groups in industrial classification divisions D, E, and H, “Manufacture of general-purpose machinery”, “Miscellaneous manufacturing industries”, “Construction work by specialist contractor”, “Equipment installation work”, and “Railway transport” were selected as explanatory variables in male cases, whereas “Miscellaneous manufacturing industries”, “Construction work by specialist contractor”, and “Railway transport” remained in all cases. The overall distribution of bladder cancer cases in these industrial major groups was not different from that of the controls (Table 5).
Table 5.
Distribution of industrial classification major groups in divisions D, E, and H in males.
3.2. Sample QC
For 789 genotyped samples of 830 samples, 21 were excluded in which the sample call rate was <0.99, the proportion IBD was >0.1875, and outliers from Japanese clusters identified by principal component analysis (Supplemental Figure S1). In our study, we used 766 samples in GWAS (Supplementary Table S5).
3.3. SNP QC for Imputation
We selected SNPs to be used for SNP imputation. The number of SNPs loaded on the chip was 659,184 and the number of SNPs genotyped was 657,060. In addition, there were 641,043 SNPs with a definite chromosomal location, 395,708 SNPs with a call rate of 99% or higher, a p-value of 0.0001 for the Hardy–Weinberg law of equilibrium, and a minor allele frequency (MAF) of 1% or higher. SNP imputation was performed using 395,708 SNPs (Supplementary Table S6).
3.4. Imputation
The number of SNPs able to be imputed was 47,109,297. Of the 47,109,297 SNPs, 11,175,945 with an R-squared value greater than 0.3 were used in the GWAS (Supplementary Table S7).
3.5. Results of GWAS and Gene-Wise Analysis
No SNPs satisfying the genome-wide significance level 5 × 10⁻⁸ were detected in GWAS in all cases or in male cases. A Manhattan plot of the genome-wide association test for each analysis pattern is shown in Figure 1. In the gene-wise analysis, no genes satisfying the genome-wide significance level 2.4 × 10⁻⁶ were detected in all cases or in male cases. In GWAS and gene-wise analysis, the gliomedin (GLDN) gene located at 15q21.2 satisfied both a suggestive association level of 10−5 in GWAS and suggestive association level of 10−4 in gene-wise analysis (Table 6 and Figure 2).
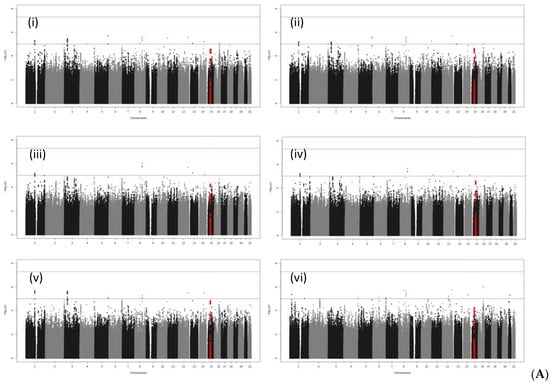
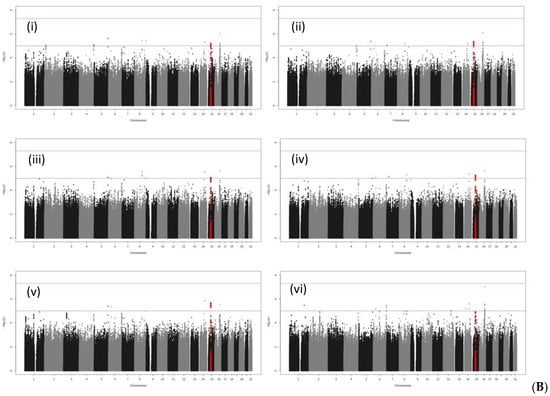
Figure 1.
Manhattan plots of GWAS: (A) All bladder cancer; (B) male bladder cancer. Industrial/occupational factors added in GWAS: (i) 1 variable with 20 levels for industrial classification divisions; (ii) selected industrial classification divisions G and S for male bladder cancer, with divisions G, L, and S for all bladder cancer; (iii) 1 variable with 12 levels for occupational classification major groups; (iv) selected occupational classification major group F; (v) selected industrial classification major groups in D, E, and H, i.e., “Manufacture of general-purpose machinery”, “Miscellaneous manufacturing industries”, “Construction work by specialist contractor”, “Equipment installation work”, and “Railway transport” for male bladder cancer, and “Miscellaneous manufacturing industries”, “Construction work by specialist contractor”, and “Railway transport” for all bladder cancer; and (vi) the Zaitsu classification, The SNPs in the GDLN region are plotted in red.
Table 6.
Results of GWAS and gene-wise analysis for bladder cancer. Results that satisfied both p < 10−5 by GWAS and p < 10−4 by gene-wise analysis were selected.
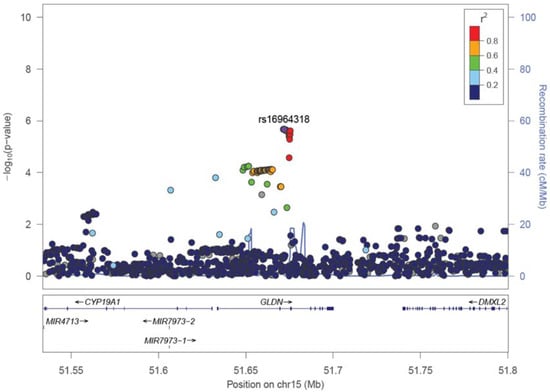
Figure 2.
A representative regional plot of GLDN region. Added industrial/occupational factors were selected among industrial classification major groups in D, E, and H, i.e., “Manufacture of general-purpose machinery”, “Miscellaneous manufacturing industries”, “Construction work by specialist contractor”, “Equipment installation work”, and “Railway transport” for male bladder cancer.
In the Manhattan plot of male bladder cancer cases, there were peaks satisfying a suggestive level of p < 10−5 between LINC00922 and CDH5 in chromosome 16, and between LINC00473 and PDE10A in chromosome 6, but they were outside the genetic regions in the regional plots of GWAS results (Supplementary Figure S2).
In all bladder cancer cases, Manhattan plot peaks satisfying p < 10−5 were observed near WNT2B in chromosome 1 and XYLB of chromosome 3 (Supplementary Figures S3 and S4), but they did not satisfy the suggestive association level of p < 10−4 in gene-wise analysis.
3.6. Expression of Gliomedin Protein in Bladder Cancer Tissues
The expression of the gliomedin protein (Figure 3) in the nucleus of bladder cancer cells was lower in cancers with a tendency to infiltrate and those with strong cell atypia, as shown in Table 7. The expression of the gliomedin protein in the cytoplasm of cancer cells and in the nucleus of stromal cells was not associated with the degree of cancer infiltration or cancer cell atypia.
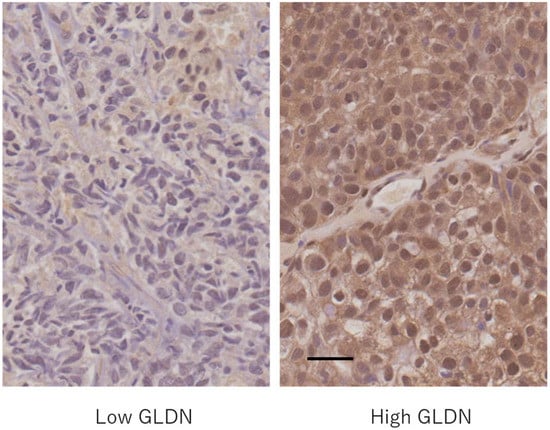
Figure 3.
Gliomedin (GLDN) protein expression in bladder cancer. Left: a case with low gliomedin expression in both the nucleus and cytoplasm of cancer cells; Right: a case with high gliomedin expression in both the nucleus and cytoplasm of cancer cells. Scale bar = 0.5 μm.
Table 7.
Expression of gliomedin protein in bladder cancer tissues.
4. Discussion
Kawasaki City, where Kanto Rosai Hospital is located, is a traditional heavy industry area adjacent to the Tokyo Metropolitan area. Fuchu City, where Tokyo Metropolitan Tama Medical Center is located, is a commercial and residential area on the outskirts of Tokyo. Therefore, workers engaged in the primary sector of industry and mining industry were limited in this study.
The reason why the industrial classification divisions G, L, and S, and the occupational classification major group F were particularly adopted as the adjusting factors in certain patterns of GWAS analysis is that these factors were selected by the backward step-wise method in the analysis of the patient background. In addition, the adjusting factors were selected from the industrial classification major groups included in the industrial classification divisions D, E, and H for men because a relatively large number of cases were included in these three divisions.
The occupations vulnerable to bladder cancer in previous reports were fairly specific and limited. Compared with these, this study mainly used the relatively rough classification of industry/occupation such as industrial classification divisions, major groups, and occupational classification major groups. Therefore, the purpose of this study was not to examine the relationship between SNPs and specific environmentally exposed substances, such as nicotine and aromatic amines, but rather to incorporate the contribution of broader industrial/occupational environmental factors, such as stress stimulation and work environment, into the development of bladder cancer as adjustment factors. Under these conditions, the gliomedin gene was detected in this study by GWAS and gene-wise analysis as a gene that may be associated with the development of bladder cancer in males.
GWAS is widely performed to replicate obtained results with other datasets. However, detailed recording of occupational/industrial history, such as ICOD-R, is not comprehensively enforced in Japan, making it difficult to replicate GWAS with occupational/industrial history as an adjusting factor. Therefore, in this study, in addition to GWAS to verify one SNP, the results were supported by performing gene-wise analysis to examine the association between a given pathological condition and a certain gene as a whole.
Kaneko et al. used ICOD-R occupational classification major groups to demonstrate that occupations with high physical activity reduced the risk of cancer []. They also compared the categories included in the manufacturing industry division (Division E) of ICOD-R and noted that the incidence of ureter cancer in the electronics category is higher than that in the food manufacturing category []. Therefore, adding the industrial/occupational classification to the adjusting factors of GWAS, even if it is relatively rough, is considered to be meaningful in examining the development of cancer.
The control group in this analysis included several malignant tumor diseases other than urothelial cancer. The inclusion of many cases of other malignancies in the control group of GWAS for bladder cancer is controversial. It is thought that pathways common to malignancies in general are less likely to be detected, but on the other hand, it may be more effective in order for pathways specific to bladder cancer to emerge.
The gliomedin gene encodes a protein containing olfactomedin-like and collagen-like domains. The gliomedin protein, which is present in both transmembrane and secretory forms, promotes the formation of the Node of Ranvier in the peripheral nervous system []. Mutations in the gliomedin gene cause lethal congenital contracture syndrome []. Autoantibodies to the gliomedin protein have also been identified in patients with multifocal motor neuropathy serotypes []. An important paralog of the gliomedin gene is olfactomedin protein family [].
The expression of gliomedin mRNA and protein is found in the nuclei of many types of cancer cells, including urothelial cancer []. The early deregulation of gliomedin during liver tumorigenesis was previously reported []. The gliomedin paralog, olfactomedin 4, is a glycoprotein with an olfactomedin-domain, which is involved in numerous intracellular signaling pathways, including NF-κB, and is associated with innate immunity. Furthermore, olfactomedin 4 suppresses the development and progression of cancer [,], and tumorigenesis is observed in olfactomedin4 deficient mice []. Thus, it is hypothesized that gliomedin is also involved in the development of bladder cancer by a mechanism similar to that of olfactomedin 4 in innate immunity and oncogenesis in a certain environment.
As the expression of the gliomedin protein in the nucleus of cancer cells is decreased in bladder cancer with strong nuclear atypia and infiltration tendency, it is speculated that gliomedin may act as a tumor suppressor factor in bladder cancer. As GWAS suggested a relationship between the gliomedin gene and the development of bladder cancer in men, further studies are required.
5. Conclusions
In conclusion, the gliomedin gene was suggested to be related to the development of male bladder cancer by adding longest-held occupational and industrial history as regulators in the GWAS and gene-wise analysis. In addition, the expression of the gliomedin protein in the nucleus of bladder cancer cells was lower in cancers with a tendency to infiltrate and those with strong cell atypia.
Supplementary Materials
The following supporting information can be downloaded at: www.mdpi.com/article/10.3390/genes13030448/s1, Figure S1: Results of a principal component analysis (A) Our samples and East Asian samples in IGSR. (B) Our samples and Chinese and Japanese samples in IGSR. The number of outliers from Japanese clusters was eight and these samples were excluded; Figure S2: Regional plots of LINC00922 CDH5 (Upper) and LINC00473 PDE10A (Lower) regions. Added industrial/occupational factors were industrial classification divisions G and S for the upper panel and Zaitsu classifications for the lower; Figure S3: Regional plots of the WNT2B region. Added industrial/occupational factors were 1 variable with 20 levels for industrial classification divisions for the upper panel, industrial classification divisions G, L, and S for the middle, and selected industrial classification major groups in divisions D, E, and H for the lower; Figure S4: Regional plots of the XYLB region. Added industrial/occupational factors were 1 variable with 20 levels for industrial classification divisions for the upper panel, industrial classification divisions G, L, and S for the middle, and selected industrial classification major groups in divisions D, E, and H for the lower; Table S1: SNPs susceptible to bladder cancer; Table S2: Japan Standard Industrial Classification (Rev. 13 October 2013), Divisions; Table S3: Japan Standard Occupational Classification (Rev. 5 December 2009), Major groups; Table S4: Incidence of malignant tumors other than urothelial cancer; Table S5: For 789 genotyped samples of 830 samples, 21 samples were excluded in which the sample call rate was <0.99, the proportion IBD was > 0.1875, and outliers from Japanese clusters identified by principal component analysis. In our study, we used 766 samples in GWAS; Table S6: We selected SNPs to be used for SNP imputation. The number of SNPs loaded on the chip was 659,184, and the number genotyped was 657,060. In addition, there were 641,043 SNPs with a definite chromosomal location, 395,708 SNPs with a call rate of 99% or higher, a p-value of 0.0001 for the Hardy–Weinberg law of equilibrium, and a minor allele frequency (MAF) of 1% or higher. SNP imputation was performed using 395,708 SNPs; Table S7: The number of SNPs that was able to be imputed was 47,109,297. Of the 47,109,297 SNPs, 11,175,945 with an R-square value greater than 0.3 were used in the GWAS.
Author Contributions
T.T. designed the study, analyzed the data, and wrote the manuscript. T.T., M.H.-K., Y.O., M.Z. and T.A. acquired data. All authors have read and agreed to the published version of the manuscript.
Funding
This study was supported by a grant for research and development and the dissemination project on occupational injuries and illnesses from the Japan Organization of Occupational Health and Safety.
Institutional Review Board Statement
The Ethical Committee of the Japan Organization of Occupational Health and Safety approved the experiments (approval code: 2018-2; approval date: 27 June 2018). All experiments were performed in accordance with relevant guidelines and regulations, including any relevant details.
Informed Consent Statement
Written informed consent was received from patients prior to inclusion in the study.
Data Availability Statement
Not applicable.
Acknowledgments
We would like to thank Akiko Tonooka (Cancer Institute Hospital of Japanese Foundation for Cancer Research) and Hiroki Tanaka (JR Tokyo General Hospital) for their cooperation in pathological diagnosis. We also thank Kazuyuki Nakazono (StaGen Co., Ltd.) for performing GWAS and gene-wise analysis.
Conflicts of Interest
We declare that there are no conflicts of interest regarding the publication of this study.
References
- American Cancer Society, Key Statistics for Bladder Cancer. Available online: https://www.cancer.org/cancer/bladder-cancer/about/key-statistics.html (accessed on 31 August 2021).
- National Cancer Center, Cancer Type Statistical Information: Bladder. (In Japanese). Available online: https://ganjoho.jp/reg_stat/statistics/stat/cancer/21_bladder.html#anchor1 (accessed on 31 August 2021).
- Freedman, N.D.; Silverman, D.T.; Hollenbeck, A.R.; Schatzkin, A.; Abnet, C.C. Association between smoking and risk of bladder cancer among men and women. J. Am. Med. Assoc. 2011, 306, 737–745. [Google Scholar] [CrossRef] [PubMed]
- Masaoka, H.; Matsuo, K.; Ito, H.; Wakai, K.; Nagata, C.; Nakayama, T.; Sadakane, A.; Tanaka, K.; Tamakoshi, A.; Sugawara, Y.; et al. Cigarette Smoking and Bladder Cancer Risk: An Evaluation Based on a Systematic Review of Epidemiologic Evidence in the Japanese Population. Jpn. J. Clin. Oncol. 2016, 46, 273–283. [Google Scholar] [CrossRef] [PubMed] [Green Version]
- LoConte, N.K.; Brewster, A.M.; Kaur, J.S.; Merrill, J.K.; Alberg, A.J. Alcohol and Cancer: A Statement of the American Society of Clinical Oncology. J. Clin. Oncol. 2018, 36, 83–93. [Google Scholar] [CrossRef] [PubMed] [Green Version]
- Zaitsu, M.; Nakamura, F.; Toyokawa, S.; Tonooka, A.; Takeuchi, T.; Homma, Y.; Kobayashi, Y. Risk of Alcohol Consumption in Bladder Cancer: Case-Control Study from a Nationwide Inpatient Database in Japan. Tohoku J. Exp. Med. 2016, 239, 9–15. [Google Scholar] [CrossRef] [PubMed] [Green Version]
- Pukkala, E.; Martinsen, J.I.; Lynge, E.; Gunnarsdottir, H.K.; Sparén, P.; Tryggvadottir, L.; Weiderpass, E.; Kjaerheim, K. Occupation and Cancer—Follow-up of 15 Million People in Five Nordic Countries. Acta Oncol. 2009, 48, 646–790. [Google Scholar] [CrossRef] [Green Version]
- García-Closas, M.; Malats, N.; Silverman, D.; Dosemeci, M.; Kogevinas, M.; Hein, D.W.; Tardón, A.; Serra, C.; Carrato, A.; García-Closas, R.; et al. NAT2 Slow Acetylation, GSTM1 Null Genotype, and Risk of Bladder Cancer: Results from the Spanish Bladder Cancer Study and Meta-Analyses. Lancet 2005, 366, 649–659. [Google Scholar] [CrossRef] [Green Version]
- Kiemeney, L.A.; Thorlacius, S.; Sulem, P.; Geller, F.; Aben, K.K.H.; Stacey, S.N.; Gudmundsson, J.; Jakobsdottir, M.; Bergthorsson, J.T.; Sigurdsson, A.; et al. Sequence Variant on 8q24 Confers Susceptibility to Urinary Bladder Cancer. Nat. Genet. 2008, 40, 1307–1312. [Google Scholar] [CrossRef]
- Wu, X.; Ye, Y.; Kiemeney, L.A.; Sulem, P.; Rafnar, T.; Matullo, G.; Seminara, D.; Yoshida, T.; Saeki, N.; Andrew, A.S.; et al. Genetic Variation in the Prostate Stem Cell Antigen Gene PSCA Confers Susceptibility to Urinary Bladder Cancer. Nat. Genet. 2009, 41, 991–995. [Google Scholar] [CrossRef]
- Rafnar, T.; Sulem, P.; Stacey, S.N.; Geller, F.; Gudmundsson, J.; Sigurdsson, A.; Jakobsdottir, M.; Helgadottir, H.; Thorlacius, S.; Aben, K.K.H.; et al. Sequence Variants at the TERT-CLPTM1L Locus Associate with Many Cancer Types. Nat. Genet. 2009, 41, 221–227. [Google Scholar] [CrossRef]
- Kiemeney, L.A.; Sulem, P.; Besenbacher, S.; Vermeulen, S.H.; Sigurdsson, A.; Thorleifsson, G.; Gudbjartsson, D.F.; Stacey, S.N.; Gudmundsson, J.; Zanon, C.; et al. A Sequence Variant at 4p16.3 Confers Susceptibility to Urinary Bladder Cancer. Nat. Genet. 2010, 42, 415–419. [Google Scholar] [CrossRef] [Green Version]
- Rothman, N.; Garcia-Closas, M.; Chatterjee, N.; Malats, N.; Wu, X.; Figueroa, J.D.; Real, F.X.; Van Den Berg, D.; Matullo, G.; Baris, D.; et al. A Multi-Stage Genome-Wide Association Study of Bladder Cancer Identifies Multiple Susceptibility Loci. Nat. Genet. 2010, 42, 978–984. [Google Scholar] [CrossRef] [PubMed] [Green Version]
- Garcia-Closas, M.; Ye, Y.; Rothman, N.; Figueroa, J.D.; Malats, N.; Dinney, C.P.; Chatterjee, N.; Prokunina-Olsson, L.; Wang, Z.; Lin, J.; et al. A Genome-Wide Association Study of Bladder Cancer Identifies a New Susceptibility Locus within SLC14A1, a Urea Transporter Gene on Chromosome 18q12.3. Hum. Mol. Genet. 2011, 20, 4282–4289. [Google Scholar] [CrossRef] [PubMed] [Green Version]
- Moore, L.E.; Baris, D.R.; Figueroa, J.D.; Garcia-Closas, M.; Karagas, M.R.; Schwenn, M.R.; Johnson, A.T.; Lubin, J.H.; Hein, D.W.; Dagnall, C.L.; et al. GSTM1 Null and NAT2 Slow Acetylation Genotypes, Smoking Intensity and Bladder Cancer Risk: Results from the New England Bladder Cancer Study and NAT2 Meta-Analysis. Carcinogenesis 2011, 32, 182–189. [Google Scholar] [CrossRef]
- Rafnar, T.; Vermeulen, S.H.; Sulem, P.; Thorleifsson, G.; Aben, K.K.; Witjes, J.A.; Grotenhuis, A.J.; Verhaegh, G.W.; Hulsbergen-van de Kaa, C.A.; Besenbacher, S.; et al. European Genome-Wide Association Study Identifies SLC14A1 as a New Urinary Bladder Cancer Susceptibility Gene. Hum. Mol. Genet. 2011, 20, 4268–4281. [Google Scholar] [CrossRef] [PubMed] [Green Version]
- Tang, W.; Fu, Y.-P.; Figueroa, J.D.; Malats, N.; Garcia-Closas, M.; Chatterjee, N.; Kogevinas, M.; Baris, D.; Thun, M.; Hall, J.L.; et al. Mapping of the UGT1A Locus Identifies an Uncommon Coding Variant That Affects MRNA Expression and Protects from Bladder Cancer. Hum. Mol. Genet. 2012, 21, 1918–1930. [Google Scholar] [CrossRef]
- Figueroa, J.D.; Ye, Y.; Siddiq, A.; Garcia-Closas, M.; Chatterjee, N.; Prokunina-Olsson, L.; Cortessis, V.K.; Kooperberg, C.; Cussenot, O.; Benhamou, S.; et al. Genome-Wide Association Study Identifies Multiple Loci Associated with Bladder Cancer Risk. Hum. Mol. Genet. 2014, 23, 1387–1398. [Google Scholar] [CrossRef] [PubMed]
- Figueroa, J.D.; Han, S.S.; Garcia-Closas, M.; Baris, D.; Jacobs, E.J.; Kogevinas, M.; Schwenn, M.; Malats, N.; Johnson, A.; Purdue, M.P.; et al. Genome-Wide Interaction Study of Smoking and Bladder Cancer Risk. Carcinogenesis 2014, 35, 1737–1744. [Google Scholar] [CrossRef] [Green Version]
- Rafnar, T.; Sulem, P.; Thorleifsson, G.; Vermeulen, S.H.; Helgason, H.; Saemundsdottir, J.; Gudjonsson, S.A.; Sigurdsson, A.; Stacey, S.N.; Gudmundsson, J.; et al. Genome-Wide Association Study Yields Variants at 20p12.2 That Associate with Urinary Bladder Cancer. Hum. Mol. Genet. 2014, 23, 5545–5557. [Google Scholar] [CrossRef] [Green Version]
- Matsuda, K.; Takahashi, A.; Middlebrooks, C.D.; Obara, W.; Nasu, Y.; Inoue, K.; Tamura, K.; Yamasaki, I.; Naya, Y.; Tanikawa, C.; et al. Genome-Wide Association Study Identified SNP on 15q24 Associated with Bladder Cancer Risk in Japanese Population. Hum. Mol. Genet. 2015, 24, 1177–1184. [Google Scholar] [CrossRef] [Green Version]
- Wang, M.; Li, Z.; Chu, H.; Lv, Q.; Ye, D.; Ding, Q.; Xu, C.; Guo, J.; Du, M.; Chen, J.; et al. Genome-Wide Association Study of Bladder Cancer in a Chinese Cohort Reveals a New Susceptibility Locus at 5q12.3. Cancer Res. 2016, 76, 3277–3284. [Google Scholar] [CrossRef] [Green Version]
- Rashkin, S.R.; Graff, R.E.; Kachuri, L.; Thai, K.K.; Alexeeff, S.E.; Blatchins, M.A.; Cavazos, T.B.; Corley, D.A.; Emami, N.C.; Hoffman, J.D.; et al. Pan-Cancer Study Detects Genetic Risk Variants and Shared Genetic Basis in Two Large Cohorts. Nat. Commun. 2020, 11, 4423. [Google Scholar] [CrossRef] [PubMed]
- Wu, J.; Wang, M.; Chen, H.; Xu, J.; Zhang, G.; Gu, C.; Ding, Q.; Wei, Q.; Zhu, Y.; Ye, D. The Rare Variant Rs35356162 in UHRF1BP1 Increases Bladder Cancer Risk in Han Chinese Population. Front. Oncol. 2020, 10, 134. [Google Scholar] [CrossRef] [PubMed] [Green Version]
- Lipunova, N.; Wesselius, A.; Cheng, K.K.; van Schooten, F.-J.; Bryan, R.T.; Cazier, J.-B.; Galesloot, T.E.; Kiemeney, L.A.L.M.; Zeegers, M.P. Genome-Wide Association Study for Tumour Stage, Grade, Size, and Age at Diagnosis of Non–Muscle-Invasive Bladder Cancer. Eur. Urol. Oncol. 2019, 2, 381–389. [Google Scholar] [CrossRef] [PubMed]
- Inatomi, H.; Katoh, T.; Kawamoto, T.; Matsumoto, T. NAT2 Gene Polymorphism as a Possible Marker for Susceptibility to Bladder Cancer in Japanese. Int. J. Urol. 1999, 6, 446–454. [Google Scholar] [CrossRef]
- Kaneko, R.; Zaitsu, M.; Sato, Y.; Kobayashi, Y. Risk of Cancer and Longest-held Occupations in Japanese Workers: A Multicenter Hospital-based Case-control Study. Cancer Med. 2019, 8, 6139–6150. [Google Scholar] [CrossRef] [Green Version]
- Ministry of Internal Affairs and Communications, Japan Standard Industry Classification. 2013. Available online: https://www.soumu.go.jp/english/dgpp_ss/seido/sangyo/san13-3.htm (accessed on 31 August 2021).
- Ministry of Internal Affairs and Communications, Japan Standard Occupational Classification. 2009. Available online: https://www.soumu.go.jp/english/dgpp_ss/seido/shokgyou/co09-4.htm (accessed on 31 August 2021).
- Zaitsu, M.; Kato, S.; Kim, Y.; Takeuchi, T.; Sato, Y.; Kobayashi, Y.; Kawachi, I. Occupational Class and Risk of Cardiovascular Disease Incidence in Japan: Nationwide, Multicenter, Hospital-Based Case-Control Study. J. Am. Heart Assoc. 2019, 8, e011350. [Google Scholar] [CrossRef]
- Zaitsu, M.; Kaneko, R.; Takeuchi, T.; Sato, Y.; Kobayashi, Y.; Kawachi, I. Occupational Class and Male Cancer Incidence: Nationwide, Multicenter, Hospital-Based Case-Control Study in Japan. Cancer Med. 2019, 8, 795–813. [Google Scholar] [CrossRef] [Green Version]
- Zaitsu, M.; Lee, H.; Lee, S.; Takeuchi, T.; Kobayashi, Y.; Kawachi, I. Occupational Disparities in Bladder Cancer Survival: A Population-based Cancer Registry Study in Japan. Cancer Med. 2020, 9, 894–901. [Google Scholar] [CrossRef] [Green Version]
- Auton, A.; Abecasis, G.R.; Altshuler, D.M.; Durbin, R.M.; Abecasis, G.R.; Bentley, D.R.; Chakravarti, A.; Clark, A.G.; Donnelly, P.; Eichler, E.E.; et al. A Global Reference for Human Genetic Variation. Nature 2015, 526, 68–74. [Google Scholar] [CrossRef] [Green Version]
- Sudmant, P.H.; Rausch, T.; Gardner, E.J.; Handsaker, R.E.; Abyzov, A.; Huddleston, J.; Zhang, Y.; Ye, K.; Jun, G.; Hsi-Yang Fritz, M.; et al. An Integrated Map of Structural Variation in 2,504 Human Genomes. Nature 2015, 526, 75–81. [Google Scholar] [CrossRef] [Green Version]
- Loh, P.-R.; Danecek, P.; Palamara, P.F.; Fuchsberger, C.; Reshef, Y.A.; Finucane, H.K.; Schoenherr, S.; Forer, L.; McCarthy, S.; Abecasis, G.R.; et al. Reference-Based Phasing Using the Haplotype Reference Consortium Panel. Nat. Genet. 2016, 48, 1443–1448. [Google Scholar] [CrossRef] [PubMed] [Green Version]
- Loh, P.-R.; Palamara, P.F.; Price, A.L. Fast and Accurate Long-Range Phasing in a UK Biobank Cohort. Nat. Genet. 2016, 48, 811–816. [Google Scholar] [CrossRef] [PubMed] [Green Version]
- Das, S.; Forer, L.; Schönherr, S.; Sidore, C.; Locke, A.E.; Kwong, A.; Vrieze, S.I.; Chew, E.Y.; Levy, S.; McGue, M.; et al. Next-Generation Genotype Imputation Service and Methods. Nat. Genet. 2016, 48, 1284–1287. [Google Scholar] [CrossRef] [Green Version]
- Lee, S.; Wu, M.C.; Lin, X. Optimal Tests for Rare Variant Effects in Sequencing Association Studies. Biostatistics 2012, 13, 762–775. [Google Scholar] [CrossRef] [Green Version]
- Gibson, J.; Russ, T.C.; Clarke, T.-K.; Howard, D.M.; Hillary, R.F.; Evans, K.L.; Walker, R.M.; Bermingham, M.L.; Morris, S.W.; Campbell, A.; et al. A Meta-Analysis of Genome-Wide Association Studies of Epigenetic Age Acceleration. PLoS Genet. 2019, 15, e1008104. [Google Scholar] [CrossRef]
- Variant Tools, Ref Gene. Available online: https://varianttools.sourceforge.net/Annotation/RefGene (accessed on 31 August 2021).
- Lee, S.; Abecasis, G.R.; Boehnke, M.; Lin, X. Rare-Variant Association Analysis: Study Designs and Statistical Tests. Am. J. Hum. Genet. 2014, 95, 5–23. [Google Scholar] [CrossRef] [PubMed] [Green Version]
- Remmele, W.; Stegner, H.E. Recommendation for Uniform Definition of an Immunoreactive Score (IRS) for Immunohistochemical Estrogen Receptor Detection (ER-ICA) in Breast Cancer Tissue. Pathologe 1987, 8, 138–140. [Google Scholar]
- Kaneko, R.; Sato, Y.; Kobayashi, Y. Manufacturing Industry Cancer Risk in Japan: A Multicenter Hospital-Based Case Control Study. Asian Pac. J. Cancer Prev. 2020, 21, 2697–2707. [Google Scholar] [CrossRef]
- Eshed, Y.; Feinberg, K.; Poliak, S.; Sabanay, H.; Sarig-Nadir, O.; Spiegel, I.; Bermingham, J.R.; Peles, E. Gliomedin Mediates Schwann Cell-Axon Interaction and the Molecular Assembly of the Nodes of Ranvier. Neuron 2005, 47, 215–229. [Google Scholar] [CrossRef] [Green Version]
- Maluenda, J.; Manso, C.; Quevarec, L.; Vivanti, A.; Marguet, F.; Gonzales, M.; Guimiot, F.; Petit, F.; Toutain, A.; Whalen, S.; et al. Mutations in GLDN, Encoding Gliomedin, a Critical Component of the Nodes of Ranvier, Are Responsible for Lethal Arthrogryposis. Am. J. Hum. Genet. 2016, 99, 928–933. [Google Scholar] [CrossRef] [Green Version]
- Notturno, F.; Di Febo, T.; Yuki, N.; Fernandez Rodriguez, B.M.; Corti, D.; Nobile-Orazio, E.; Carpo, M.; De Lauretis, A.; Uncini, A. Autoantibodies to Neurofascin-186 and Gliomedin in Multifocal Motor Neuropathy. J. Neuroimmunol. 2014, 276, 207–212. [Google Scholar] [CrossRef]
- Anholt, R.R.H. Olfactomedin Proteins: Central Players in Development and Disease. Front. Cell Dev. Biol. 2014, 2, 6. [Google Scholar] [CrossRef] [PubMed] [Green Version]
- The Human Protein Atlas. Available online: https://www.proteinatlas.org/ENSG00000186417-GLDN/pathology (accessed on 31 August 2021).
- Graveel, C.R.; Harkins-Perry, S.R.; Acevedo, L.G.; Farnham, P.J. Identification and Characterization of CRG-L2, a New Marker for Liver Tumor Development. Oncogene 2003, 22, 1730–1736. [Google Scholar] [CrossRef] [PubMed] [Green Version]
- Shi, W.; Ye, Z.; Zhuang, L.; Li, Y.; Shuai, W.; Zuo, Z.; Mao, X.; Liu, R.; Wu, J.; Chen, S.; et al. Olfactomedin 1 Negatively Regulates NF-ΚB Signalling and Suppresses the Growth and Metastasis of Colorectal Cancer Cells. J. Pathol. 2016, 240, 352–365. [Google Scholar] [CrossRef] [PubMed]
- Li, H.; Kim, C.; Liu, W.; Zhu, J.; Chin, K.; Rodriguez-Canales, J.; Rodgers, G.P. Olfactomedin 4 Downregulation Is Associated with Tumor Initiation, Growth and Progression in Human Prostate Cancer. Int. J. Cancer 2020, 146, 1346–1358. [Google Scholar] [CrossRef] [PubMed] [Green Version]
- Liu, W.; Rodgers, G.P. Olfactomedin 4 Expression and Functions in Innate Immunity, Inflammation, and Cancer. Cancer Metastasis Rev. 2016, 35, 201–212. [Google Scholar] [CrossRef] [PubMed]
Publisher’s Note: MDPI stays neutral with regard to jurisdictional claims in published maps and institutional affiliations. |
© 2022 by the authors. Licensee MDPI, Basel, Switzerland. This article is an open access article distributed under the terms and conditions of the Creative Commons Attribution (CC BY) license (https://creativecommons.org/licenses/by/4.0/).