
Loss of Heterozygosity in the Tumor DNA of De Novo Diagnosed Patients Is Associated with Poor Outcome for B-ALL but Not for T-ALL

 , , , , , and
Abstract
1. Introduction
2. Materials and Methods
3. Results
4. Discussion
5. Conclusions
Supplementary Materials
Author Contributions
Funding
Institutional Review Board Statement
Informed Consent Statement
Conflicts of Interest
References
- Malard, F.; Mohty, M. Acute lymphoblastic leukaemia. Lancet 2020, 395, 1146–1162. [Google Scholar] [CrossRef]
- Mrózek, K.; Harper, D.P.; Aplan, P.D. Cytogenetics and molecular genetics of acute lymphoblastic leukemia. Hematol./Oncol. Clin. N. Am. 2009, 23, 991–1010. [Google Scholar] [CrossRef] [PubMed]
- Piskunova, I.S.; Obukhova, T.N.; Parovichnikova, E.N.; Kulikov, S.M.; Troitskaya, V.V.; Gavrilina, O.A.; Savchenko, V.G. Structure and significance of cytogenetic abnormalities in adult patients with Ph-negative acute lymphoblastic leukemia. Ter. Arkhiv 2018, 90, 30–37. [Google Scholar] [CrossRef] [PubMed]
- Thiagalingam, S.; Foy, R.L.; Cheng, K.; Lee, H.J.; Thiagalingam, A.; Ponte, J.F. Loss of heterozygosity as a predictor to map tumor suppressor genes in cancer: Molecular basis of its occurrence. Curr. Opin. Oncol. 2002, 14, 65–72. [Google Scholar] [CrossRef]
- Makishima, H.; Maciejewski, J.P. Pathogenesis and consequences of uniparental disomy in cancer. Clin. Cancer Res. 2011, 17, 3913–3923. [Google Scholar] [CrossRef]
- Carroll, A.J.; Shago, M.; Mikhail, F.M.; Raimondi, S.C.; Hirsch, B.A.; Loh, M.L.; Raetz, E.A.; Borowitz, M.J.; Wood, B.L.; Maloney, K.W.; et al. Masked hypodiploidy: Hypodiploid acute lymphoblastic leukemia (ALL) mimicking hyperdiploid ALL in children: A report from the Children’s Oncology Group. Cancer Genet. 2019, 238, 62–68. [Google Scholar] [CrossRef]
- Bhargava, A.; Fuentes, F.F. Mutational dynamics of microsatellites. Mol. Biotechnol. 2010, 44, 250–266. [Google Scholar] [CrossRef]
- Takeuchi, S.; Tsukasaki, K.; Bartram, C.R.; Seriu, T.; Zimmermann, M.; Schrappe, M.; Park, S.; Taguchi, H.; Koeffler, H.P.; Takeuchi, N. Long-term study of the clinical significance of loss of heterozygosity in childhood acute lymphoblastic leukemia. Leukemia 2003, 17, 149–154. [Google Scholar] [CrossRef]
- Chambon-Pautas, C.; Cavé, H.; Gérard, B.; Guidal-Giroux, C.; Duval, M.; Vilmer, E.; Grandchamp, B. High-resolution allelotype analysis of childhood B-lineage acute lymphoblastic leukemia. Leukemia 1998, 12, 1107–1113. [Google Scholar] [CrossRef]
- Baccichet, A.; Qualman, S.K.; Sinnett, D. Allelic loss in childhood acute lymphoblastic leukemia. Leuk. Res. 1997, 21, 817–823. [Google Scholar] [CrossRef]
- Merup, M.; Moreno, T.C.; Heyman, M.; Rönnberg, K.; Grandér, D.; Detlofsson, R.; Rasool, O.; Liu, Y.; Söderhäll, S.; Juliusson, G.; et al. 6q deletions in acute lymphoblastic leukemia and non-Hodgkin’s lymphomas. Blood 1998, 91, 3397–3400. [Google Scholar] [CrossRef] [PubMed]
- Cavé, H.; Avet-Loiseau, H.; Devaux, I.; Rondeau, G.; Boutard, P.; Lebrun, E.; Méchinaud, F.; Vilmer, E.; Grandchamp, B. Deletion of chromosomal region 13q14.3 in childhood acute lymphoblastic leukemia. Leukemia 2001, 15, 371–376. [Google Scholar] [CrossRef] [PubMed][Green Version]
- Pabst, T.; Schwaller, J.; Bellomo, M.J.; Oestreicher, M.; Mühlematter, D.; Tichelli, A.; Tobler, A.; Fey, M.F. Frequent clonal loss of heterozygosity but scarcity of microsatellite instability at chromosomal breakpoint cluster regions in adult leukemias. Blood 1996, 88, 1026–1034. [Google Scholar] [CrossRef]
- Patel, H.S.; Kantarjian, H.M.; Bueso-Ramos, C.E.; Medeiros, L.J.; Haidar, M.A. Frequent deletions at 12q14.3 chromosomal locus in adult acute lymphoblastic leukemia. Genes Chromosomes Cancer 2005, 42, 87–94. [Google Scholar] [CrossRef]
- Chung, C.Y.; Kantarjian, H.; Haidar, M.; Starostik, P.; Manshouri, T.; Gidel, C.; Freireich, E.; Keating, M.; Albitar, M. Deletions in the 13q14 locus in adult lymphoblastic leukemia: Rate of incidence and relevance. Cancer 2000, 88, 1359–1364. [Google Scholar] [CrossRef]
- Faderl, S.; Gidel, C.; Kantarjian, H.M.; Manshouri, T.; Keating, M.; Albitar, M. Loss of heterozygosity on chromosome 5 in adults with acute lymphoblastic leukemia. Leuk. Res. 2001, 25, 39–43. [Google Scholar] [CrossRef]
- Haidar, M.A.; Kantarjian, H.; Manshouri, T.; Chang, C.-Y.; O’Brien, S.; Freireich, E.; Keating, M.; Albitar, M. ATM gene deletion in patients with adult acute lymphoblastic leukemia. Cancer 2000, 88, 1057–1062. [Google Scholar] [CrossRef]
- Kanerva, J.; Niini, T.; Vettenranta, K.; Riikonen, P.; Mäkipernaa, A.; Karhu, R.; Knuutila, S.; Saarinen-Pihkala, U.M. Loss at 12p detected by comparative genomic hybridization (CGH): Association with TEL-AML1 fusion and favorable prognostic features in childhood acute lymphoblastic leukemia (ALL). A multi-institutional study. Med. Pediatr. Oncol. 2001, 37, 419–425. [Google Scholar] [CrossRef]
- Walters, R.; Kantarjian, H.M.; Keating, M.J.; Estey, E.H.; Trujillo, J.; Cork, A.; McCredie, K.B.; Freireich, E.J. The importance of cytogenetic studies in adult acute lymphocytic leukemia. Am. J. Med. 1990, 89, 579–587. [Google Scholar] [CrossRef]
- Baughn, L.B.; Biegel, J.A.; South, S.T.; Smolarek, T.A.; Volkert, S.; Carroll, A.J.; Heerema, N.A.; Rabin, K.R.; Zweidler-McKay, P.A.; Loh, M.; et al. Integration of cytogenomic data for furthering the characterization of pediatric B-cell acute lymphoblastic leukemia: A multi-institution, multi-platform microarray study. Cancer Genet. 2015, 208, 1–18. [Google Scholar] [CrossRef][Green Version]
- Forero-Castro, M.; Robledo, C.; Benito, R.; Abáigar, M.; Martín, A.; Arefi, M.; Fuster, J.L.; Heras, N.D.L.; Rodríguez, J.N.; Quintero, J.; et al. Genome-Wide DNA Copy Number Analysis of Acute Lymphoblastic Leukemia Identifies New Genetic Markers Associated with Clinical Outcome. PLoS ONE 2016, 11, e0148972. [Google Scholar] [CrossRef] [PubMed]
- Takeuchi, S.; Koike, M.; Seriu, T.; Bartram, C.; Slater, J.; Park, S.; Miyoshi, I.; Koeffler, H. Homozygous deletions at 9p21 in childhood acute lymphoblastic leukemia detected by microsatellite analysis. Leukemia 1997, 11, 1636–1640. [Google Scholar] [CrossRef] [PubMed]
- Heerema, N.A.; Sather, H.N.; Sensel, M.G.; Liu-Mares, W.; Lange, B.J.; Bostrom, B.C.; Nachman, J.B.; Steinherz, P.G.; Hutchinson, R.; Gaynon, P.S.; et al. Association of chromosome arm 9p abnormalities with adverse risk in childhood acute lymphoblastic leukemia: A report from the Children’s Cancer Group. Blood 1999, 94, 1537–1544. [Google Scholar]
- Nahi, H.; Hägglund, H.; Ahlgren, T.; Bernell, P.; Hardling, M.; Karlsson, K.; Lazarevic, V.L.; Linderholm, M.; Smedmyr, B.; Åström, M.; et al. An investigation into whether deletions in 9p reflect prognosis in adult precursor B-cell acute lymphoblastic leukemia: A multi-center study of 381 patients. Haematologica 2008, 93, 1734–1738. [Google Scholar] [CrossRef] [PubMed]
- Rosales-Rodríguez, B.; Núñez-Enríquez, J.C.; Mejía-Aranguré, J.M.; Rosas-Vargas, H. Prognostic Impact of Somatic Copy Number Alterations in Childhood B-Lineage Acute Lymphoblastic Leukemia. Curr. Oncol. Rep. 2020, 23, 2. [Google Scholar] [CrossRef]
- Forero-Castro, M.; Montaño, A.; Robledo, C.; De Coca, A.G.; Fuster, J.; Heras, N.D.L.; Queizán, J.; Hernández-Sánchez, M.; Corchete-Sánchez, L.; Martín-Izquierdo, M.; et al. Integrated Genomic Analysis of Chromosomal Alterations and Mutations in B-Cell Acute Lymphoblastic Leukemia Reveals Distinct Genetic Profiles at Relapse. Diagnostics 2020, 10, 455. [Google Scholar] [CrossRef]
- Ampatzidou, M.; Florentin, L.; Papadakis, V.; Paterakis, G.; Tzanoudaki, M.; Bouzarelou, D.; Papadhimitriou, S.; Polychronopoulou, S. Copy Number Alteration Profile Provides Additional Prognostic Value for Acute Lymphoblastic Leukemia Patients Treated on BFM Protocols. Cancers 2021, 13, 3289. [Google Scholar] [CrossRef]
- Irving, J.A.E.; Bloodworth, L.; Bown, N.P.; Case, M.C.; Hogarth, L.A.; Hall, A.G. Loss of heterozygosity in childhood acute lymphoblastic leukemia detected by genome-wide microarray single nucleotide polymorphism analysis. Cancer Res. 2005, 65, 3053–3058. [Google Scholar] [CrossRef]
- Peterson, J.F.; Aggarwal, N.; Smith, C.A.; Gollin, S.; Surti, U.; Rajkovic, A.; Swerdlow, S.H.; Yatsenko, S.A. Integration of microarray analysis into the clinical diagnosis of hematological malignancies: How much can we improve cytogenetic testing? Oncotarget 2015, 6, 18845–18862. [Google Scholar] [CrossRef]
- Chen, C.; Heng, E.Y.H.; Lim, A.S.T.; Lau, L.C.; Lim, T.H.; Wong, G.C.; Tien, S.L. Chromosomal microarray analysis is superior in identifying cryptic aberrations in patients with acute lymphoblastic leukemia at diagnosis/relapse as a single assay. Int. J. Lab. Hematol. 2019, 41, 561–571. [Google Scholar] [CrossRef]
- Wang, Y.; Miller, S.; Roulston, D.; Bixby, D.; Shao, L. Genome-Wide Single-Nucleotide Polymorphism Array Analysis Improves Prognostication of Acute Lymphoblastic Leukemia/Lymphoma. J. Mol. Diagn. JMD 2016, 18, 595–603. [Google Scholar] [CrossRef] [PubMed]
- Peterson, J.F.; Van Dyke, D.L.; Hoppman, N.L.; Kearney, H.M.; Sukov, W.R.; Greipp, P.T.; Ketterling, R.P.; Baughn, L.B. The Utilization of Chromosomal Microarray Technologies for Hematologic Neoplasms: An ACLPS Critical Review. Am. J. Clin. Pathol. 2018, 150, 375–384. [Google Scholar] [CrossRef] [PubMed]


| * | B-ALL (n = 40) | T-ALL (n = 43) | MPAL (n = 4) |
|---|---|---|---|
| Male:Female | 20:20 | 28:15 | 4:0 |
| Age, median | 36 (19–61) years | 33 (20–50) years | 32 (27–36) years |
| Leukocytes, 10*9/L | 9.25 (1.39–593.48) | 44.9 (1.09–833.94) | 3.82 (1.79–5.69) |
| LDH | 964 (221–20,062) | 1447(120–20,064) | 308 (154–1052.6) |
| Blast cells in peripheral blood, % | 56 (0–98) | 67.5 (0–96) | 1 (0–71) |
| Blast cells in the bone marrow, % | 80 (0–96.8) | 86.6 (0–100) | 36.8 (31.2–74.8) |
| Immunophenotype, EGIL, WHO | B-I 7 (17.5%) | ETP (T-I) 4 (9.3%) | T/myelo 2 (50%) |
| B-II 31 (77.5%) | ETP (T-II) 2 (4.7%) | B/myelo 1 (25%) | |
| B-III 1 (2.5%) | T-II 11 (25%) | T/B 1 (25%) | |
| B-IV 1 (2.5%) | T-III 23 (54%) | ||
| T-IV 3 (7%) | |||
| Standard cytogenetics | |||
| + mitosis | 37 (92.5%) | 41 (95.3%) | 4 (100%) |
| − mitosis | 3 (7.5%) | 2 (4.7%) | |
| Karyotype | |||
| Normal | 16 (40%) | 17 (39.5%) | 4 (100%) |
| Abnormal: | 21 (52.5%) | 24 (55.8%) | |
| Complex (>3 chromosomal aberrations) | 6 | 5 | |
| Hyperploid | 4 | 1 | |
| Other | 11 | 17 | |
| CNS leukemia | 6 (15%) | 9 (20.9%) | 0 (0%) |
| Extramedullary disease | 11 (27.5%) | 27 (62.8%) | 3 (75%) |
| CR | |||
| After 2nd induction (+70 day) | 35 | 40 | 2 (50%) |
| Refractory disease | 4 | 3 | 2 (50%) |
| Death in CR | 1 |
| LOH-Positive * (n = 10) | LOH-Negative (n = 26) | p χ2 | |
|---|---|---|---|
| Male:Female | 6:4 | 11:15 | |
| Age, median | 34.5 (19–61) years | 36 (21–53) years | |
| Leukocytes, 10*9/L | 10.76 (1.40–34.39) | 5.66 (1.09–593.48) | 1.000 |
| LDH, U/L | 1439 (221.00–20,062.00) | 615.50 (293–7348.8) | 0.260 |
| Blast cells in peripheral blood, % | 52.5 (1–89) | 15 (0–98) | 0.540 |
| Blast cells in the bone marrow, % | 84.20 (70–95.8) | 79 (0–200) | 0.300 |
| Immunophenotype, EGIL, WHO | B-II 9 (90%) | B-I 7 (27%) | 0.161 |
| B-IV 1 (10%) | B-II 19 (73%) | ||
| Standard cytogenetics | |||
| + mitosis | 9 (90%) | 24 (92.3%) | 0.823 |
| − mitosis | 1 (10%) | 2 (7.7%) | |
| Karyotype | |||
| Normal | 2 (20%) | 10 (38.5%) | 0.302 |
| Abnormal: | 7 (70%) | 14 (53.8%) | |
| Complex (>3 chromosomal aberrations) | 5 (3 deaths) | 1 | |
| Hyperploid | 1 | 3 live | |
| Other | 1 | 10 | |
| CNS leukemia | 2 | 3 | 0.511 |
| Extramedullary disease | 2 | 8 | 0.519 |
| CR | |||
| After 2nd induction (+70 day) | 10 | 23 | 0.262 |
| Refractory disease | 0 | 3 | |
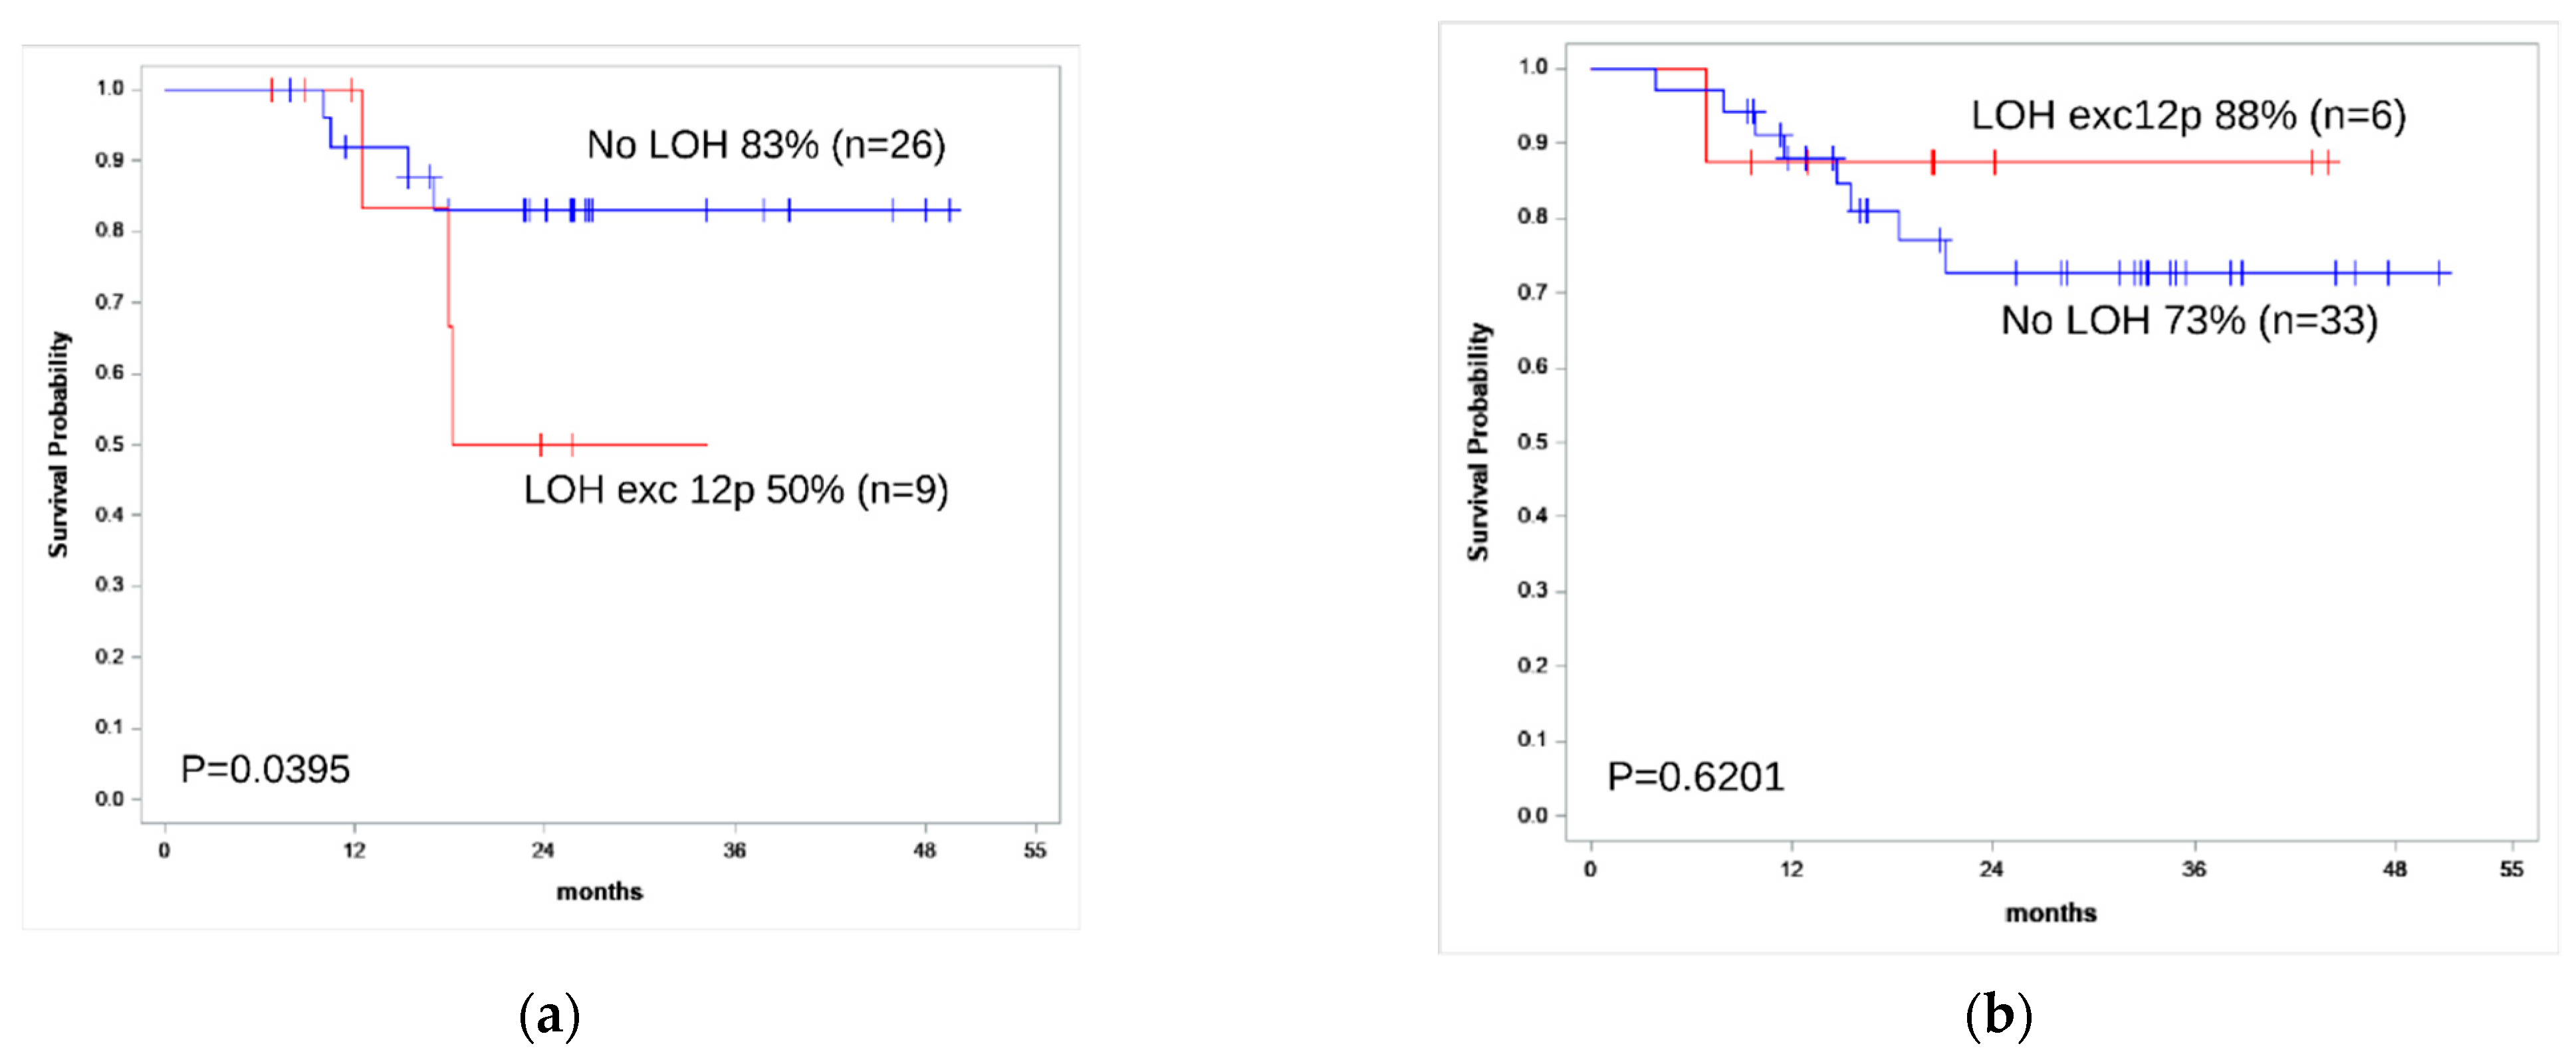
| 2-year OS | 50% | 83% | 0.040 |
| 2-year RFS | 50% | 85% | 0.030 |
| LOH-Positive * (n = 9) | LOH-Negative * (n = 33) | p χ2 | |
|---|---|---|---|
| Male:Female | 6:3 | 21:12 | |
| Age, median | 31.5 (20–37) years | 33 (20–50) years | |
| Leukocytes, 10*9/L median | 80.35 (9–833.94) | 23 (2.06–333.21) | 0.210 |
| LDH, U/L | 1738.5 (415–20,064.3) | 1299 (120–7633.2) | 0.300 |
| Blast cells in peripheral blood, % median | 75.5 (6–96) | 60.0 (0–92) | 0.160 |
| Blast cells in the bone marrow, % median | 93.4 (66–98) | 82.4 (0–100) | 0.020 |
| Immunophenotype, EGIL, WHO | T-II 1 (11%)T-III 8 (89%) | ETP (T-I) 4 (12%) ETP (T-II) 2 (6.1%) T-II 9 (27.3%) T-III 15 (45.5%) T-IV 3 (9.1%) | |
| Standard cytogenetics | |||
| + mitosis | 9 (100%) | 31 (94%) | 0.450 |
| − mitosis | 0 | 2 (6%) | |
| Karyotype | |||
| Normal | 3 (33.3%) | 12 (36.4%) | 0.770 |
| Abnormal: | 6 (66.7%) | 19 (57.6%) | |
| Complex (>3 chromosomal aberrations) | - | 5 | |
| Hyperploid | - | 1 | |
| Other | 6 | 13 | |
| CNS leukemia | 2 (22.2%) | 6 (18%) | 0.785 |
| Extramedullary disease | 5 (55.6%) | 24 (72.7%) | 0.324 |
| CR | |||
| After 2nd induction | 8 | 31 | |
| Refractory disease | 1 | 2 | 0.603 |
| 2-year OS | 88% | 73% | 0.62 |
| 2-year RFS | 100% | 69% | 0.16 |
| ## | All Phenotype | Aberrant STR Loci | Karyotype | Microarray |
|---|---|---|---|---|
| 29 | B-II | 1q42, 13q31.1, 6q14 | 45,XX,del(6)(q12),i(7)(q10),-13,add(19)(p?;q?)[10]/46,XX,i(7)(q10),del(13)(q22), add(19)(p?;q?)[1]/46,XX,add(3)(q26),del(6)(q12),i(7)(q10),add(19)(p?;q?)[1]/46,XX[8] | Gain 1q, loss 6q, loss 7p, gain 7q, loss 13q |
| 32 | B-II | 3p21.3 | 51,XX,del(1)(p31),+1,del(4)(q28),+5,+8,der(9),del(13)(q14q22),+13,der(15),del(17)(q23),+21[15]/46,XX[15] | Gain 1q, LOH 3 chr, gain 5 chr, 7 chr, 8 chr, loss 13q, gain 21q |
| 39 | B-II | 7q21, 4q31, 16q24.1, 5q33, 5q23.2 | 46,XY[27]/45,X,-Y[1]/46,XY,del(1)(q31)[1]/46,XY,?add(1)(q44)[1] | Gain 1 chr, 2 chr, loss 5q, gain 6 chr, loss 9chr, gain 10 chr, 12 chr, 14q, loss 15q, 16q, gain 18chr, 19 chr, 21q, 22q |
| 45 | B-II | Imbalance X/Y, 1q42, 10q26, 6q14, 4q31,18q21.33 | n/a | Gain 1q, 4 chr, 6 chr, LOH 9 chr, gain 10 chr, 14q, loss16q, gain 17 chr, 18 chr, 21 chr, X chr |
| 63 | B-II | 5q23.2 | 46,XX[20] | n/a |
| 65 | B-II | 12p13.2 | 46,XY,-7,add(12)(p?),add(12)(p?),-17,+2mar[cp8]/46,XY[22] | Loss 7q, 12p, gain 17p |
| 89 | B-IV | 1q42, 12p13.2, 16q24.1, 22q12.3 | 49,XY,+1,del(1)(p10),der(3),del(6)(p23),der(8),del(9)(p23),+12, t(14;18)(q32;q21),+16,der(17)[20] | Gain 1q, LOH 2p, 2q, 3p, 3q, gain 4p, LOH 5p, 5q, gain 8q, 10p, LOH 12p,16p, 16q, gain 18q |
| 71 | B-II | Imbalance X/Y, 8q24.13, 10q26.3,18q21.33, 4q31.3, 6q14 | 57,XY,+X,+4,+6,+8,+10,+14,+17,+18,+21x2,+mar[14] | Gain 4p, 4q, 6p, 6q, 8p, 8q,10p, 10q, 14q,16q, 17p, 17q, 18p, 18q,20q, Xp |
| 82 | B-II | 6q14 | 46,XX,?del(6)(q22),-7?,add(19)(p?q?) or der(19)t(1;19)(q23;p13), +mar,inc[cp7]/46,XX[3] | Gain 1q, loss 6q, 9p, gain 9q |
| 91 | B-II | 1q42, 5q23.2 | 46,XY,der(7)t(1;7)(q10;p21)[15]/46,XY,der(7)t(1;7)(q10;p21)x2[1]/46,XY[14] | Gain 1q, LOH 5q23 |
| 2 | T-III | 10q26.3 | 46, XY[30] | LOH 9p, LOH 10q |
| 3 | T-II | 12p13.2, 12p13.3 | 46, XY | Gain 5p, 6q, loss 9p, 12p, gain 17q, 18p, 18q, 19p |
| 4 | T-III | 12p13.2 | 47,Y,?t(X;19)(p21;?p13?q13),der(18),+der(19)t(X;19)(p21;?p13?q13) or der(19)[11]/46,XY[3] | Loss 12p, 18p, 18q, gain 19p, Xp |
| 33 | T-III | 12p13.2, 12p13.31, 4q31.3 | 46,XY,t(7;9)(p14;p23),der(14)[26]/46,XY[7] | LOH 4q, loss 7p, LOH 9p, gain 9q, LOH 12p, loss 14q |
| 43 | T-III | 12p13.2 | No data | Loss 9p, gain 9q, loss 12p,12q, 13q |
| 64 | T-III | 21q21.1, EMAST 4q31.3 | 46,XX[28]/47,XX,+mar[1]/47,XX,+9,i(9)(q10)[1] | Gain 21q |
| 66 | T-III | 10q26.3 | 46,XY[19]/46,XY,del(7)(p11)[1] | n/a |
| 85 | T-III | 11p15.5 | 46,XY[20] | n/a |
| 88 | T-III | 6q14 | t(2;14)(q36;q22)[15]/46,XX[10] | Loss 3p, gain 3q, 5p, loss 6q |
| 7 | MPAL | 5q33.1 | 46,XY,add(1)(q44), der (17) i ?(17)(q10)[1]/46,XY[24] | Gain 3q, loss 5q, loss 12q, LOH 17p |
| 99 | MPAL | 2p14, 7q21, 13q31, 16q24, 18q21, 21q21, 2p25, 12p13.31 | n/a | LOH 8q, loss/LOH 2p, LOH 7q21.3q22.1 and many mozaic LOH less than 5 × 10⁶ bp |
Publisher’s Note: MDPI stays neutral with regard to jurisdictional claims in published maps and institutional affiliations. |
© 2022 by the authors. Licensee MDPI, Basel, Switzerland. This article is an open access article distributed under the terms and conditions of the Creative Commons Attribution (CC BY) license (https://creativecommons.org/licenses/by/4.0/).
Share and Cite
Risinskaya, N.; Kozhevnikova, Y.; Gavrilina, O.; Chabaeva, J.; Kotova, E.; Yushkova, A.; Isinova, G.; Zarubina, K.; Obukhova, T.; Kulikov, S.; et al. Loss of Heterozygosity in the Tumor DNA of De Novo Diagnosed Patients Is Associated with Poor Outcome for B-ALL but Not for T-ALL. Genes 2022, 13, 398. https://doi.org/10.3390/genes13030398
Risinskaya N, Kozhevnikova Y, Gavrilina O, Chabaeva J, Kotova E, Yushkova A, Isinova G, Zarubina K, Obukhova T, Kulikov S, et al. Loss of Heterozygosity in the Tumor DNA of De Novo Diagnosed Patients Is Associated with Poor Outcome for B-ALL but Not for T-ALL. Genes. 2022; 13(3):398. https://doi.org/10.3390/genes13030398
Chicago/Turabian StyleRisinskaya, Natalya, Yana Kozhevnikova, Olga Gavrilina, Julia Chabaeva, Ekaterina Kotova, Anna Yushkova, Galina Isinova, Ksenija Zarubina, Tatiana Obukhova, Sergey Kulikov, and et al. 2022. "Loss of Heterozygosity in the Tumor DNA of De Novo Diagnosed Patients Is Associated with Poor Outcome for B-ALL but Not for T-ALL" Genes 13, no. 3: 398. https://doi.org/10.3390/genes13030398
APA StyleRisinskaya, N., Kozhevnikova, Y., Gavrilina, O., Chabaeva, J., Kotova, E., Yushkova, A., Isinova, G., Zarubina, K., Obukhova, T., Kulikov, S., Julhakyan, H., Sudarikov, A., & Parovichnikova, E. (2022). Loss of Heterozygosity in the Tumor DNA of De Novo Diagnosed Patients Is Associated with Poor Outcome for B-ALL but Not for T-ALL. Genes, 13(3), 398. https://doi.org/10.3390/genes13030398