Article

Identification of Reliable Reference Genes under Different Stresses and in Different Tissues of Toxicodendron succedaneum

1
College of Life Sciences, Southwest Forestry University, Kunming 650224, China
2
Key Laboratory for Forest Genetic and Tree Improvement and Propagation in Universities of Yunnan Province, Southwest Forestry University, Kunming 650224, China
3
Key Laboratory of Biodiversity Conservation in Southwest China, State Forestry Administration, Southwest Forestry University, Kunming 650224, China
*
Author to whom correspondence should be addressed.
These authors contributed equally to this work.
Genes 2022, 13(12), 2396; https://doi.org/10.3390/genes13122396
Submission received: 11 November 2022 / Revised: 14 December 2022 / Accepted: 15 December 2022 / Published: 17 December 2022
(This article belongs to the Section Plant Genetics and Genomics)

Abstract

:
Toxicodendron succedaneum (L.) Kuntze (T. succedaneum) is an economic tree species that produces urushiol and urushi wax, and it is of great value in industry and medicine. However, the stability of reference genes (RGs) has not been systematically reported in T. succedaneum to date. In this study, the expression of 10 candidate RGs was analyzed by RT-qPCR in different tissues (roots, stems, leaves), stress treatments (high/low temperature, drought), and hormone stimulation (jasmonic acid, JA). Then, the stability ranking of 10 candidate genes was evaluated by ∆Ct analysis and three software programs: geNorm, NormFinder, and BestKeeper. Finally, RefFinder was used to comprehensively analyze the expression stability of 10 candidate genes. The comprehensive analysis showed that TsRG05/06, TsRG01/06, and TsRG03/ACT were stable under high/low-temperature stress, drought stress, and JA treatment, respectively. TsRG03 and ACT had stable expression in different tissues. While the TsRG03 and ACT were recommended as the suitable RGs for T. succedaneum in all samples. Meanwhile, UBQ was the least suitable as a reference gene for T. succedaneum. In addition, the results of geNorm showed that the combination of two stable RGs could make the results of gene expression more accurate. These results provide alternative RGs for the study of gene function, correction, and normalization of target gene expression and directed molecular breeding in T. succedaneum.

1. Introduction

Reference genes (RGs), also known as housekeeping genes, are stably expressed in various cells, and are less affected by external factors [1,2]. RGs are widely used in molecular biology research, such as RT-qPCR, ribonuclease protection assay (RPA), northern blotting, gene chips, Western blotting, etc. [3,4,5]. The stability of RGs affects the evaluation of gene expression levels and the accuracy of quantitative analysis [6,7]. Therefore, the appropriate RGs should be selected for data standardization and error correction of target gene expression. Most of the commonly used RGs, such as ACT (actin), TUB (tubulin), UBQ (ubiquitin), GAPDH (glyceraldehyde-3-phosphate dehydrogenase), 18S rRNA (18S ribosomal RNA), 28S rRNA (28S ribosomal RNA), PP2A (protein phosphatase 2A), and EF-1α (elongation factor 1-alpha), are the housekeeping genes that constitute the cytoskeleton or maintain the essential metabolism required for the normal life of cells [7,8,9,10,11,12]. In addition, some studies have shown that many newly identified genes, including RPII (RNA polymerase subunit), UNK1 (hypothetical protein), F-box (F-box protein), and many small RNAs, are more suitable for RGs than some traditional genes [13,14,15,16,17].
However, a handful of studies have confirmed that plants lack universal RGs, and the applicability of specific RGs depends on experimental conditions and plant species [18,19,20,21]. Accordingly, the use of RGs with unstable expression may result in biased results and false positives [22,23]. For example, several commonly used RGs (TUB, ACT, UBQ, and EF-1α) were found to be unstable in different tissues of Arabidopsis thaliana (A. thaliana) and hybrid aspen (Populus tremula × Populus tremuloides) [24]. EF-1α is the most stable reference gene in potatoes under late blight and salt stress, while EF-1α and APRT (adenine phosphoribosyltransferase) are the most stable RGs under cold stress [12]. Similarly, the expression of β-tubulin was not stable during fruit development in cherry (Cerasus pseudocerasus) [25]. Therefore, the selection and validation of RGs under diverse experimental conditions is crucial to obtaining reliable quantitative analysis results.
T. succedaneum belongs to the family Anacardiaceae, a deciduous and dioecious tree [26]. The lacquer wax produced from its seeds can be used in the production of cosmetics, waterproofing agents, coatings, adhesives, lubricants, etc. [27]. Meanwhile, T. succedaneum has important applications in the medical field; for instance, modern medicine has found that laccase and urushiol of T. succedaneum can be used as cancer inhibitors [27]. Furthermore, its well-developed root system can be used to reduce soil and water loss; therefore, T. succedaneum plays an important role in improving the ecological environment [27,28,29]. Basic molecular research is important to the precise exploitation of T. succedaneum, but there is little research in this area. So, the suitable RGs are critical to the molecular biology-related research, while on the contrary, there is no systematic study on the RGs of T. succedaneum. Due to this, the selection and identification of reliable RGs will be beneficial to the accuracy of gene quantitative analysis and the related molecular biology research in T. succedaneum.
This study evaluated the stable expression of six candidate RGs, according to the T. succedaneum transcriptome dataset, and four widely used RGs (ACT, UBQ, PP2A2, and 18S rRNA). RT-qPCR was used to detect the expression levels of these 10 genes in different tissues (roots, stems, and leaves), abiotic stress (high/low temperature, drought), and hormone stimulation (JA). The ∆Ct value method and three kinds of Excel-based software programs, geNorm [30], Normfinder [31], and BestKeeper [32], were used to evaluate the RT-qPCR results of the 10 candidate RGs, and RefFinder [33] was used to further comprehensively analyze the expression stability of these genes. Overall, this study has excellent benefits and is helpful to the gene function research and molecular breeding of T. succedaneum.

2. Materials and Methods

2.1. Plant Materials and Stress Treatments

The aseptic plantlets of T. succedaneum were obtained from the Cell and Tissue Cultures Laboratory of College of Life Sciences, Southwest Forestry University (Kunming 650224, China). They were incubated in an incubator at 24 ℃ with 70% humidity and 90 µmol·m−2·s−1 light intensity for 12 h of light/12 h of darkness for one week before treatment. For high and low temperature stresses, 4℃ and 35℃ were applied, respectively. For drought treatment, the seedlings were transferred into ½ MS culture medium containing 20% PEG6000 (polyethylene glycol-6000). For hormone stimulation, the seedlings were transferred into a 1/2 MS culture medium containing 25 mM JA [34]. The roots, leaves, and stems of the treated plants were sampled at 6 h, 12 h, and 24 h, respectively, frozen in liquid nitrogen, and stored at −80 ℃ until RNA isolation. Each sample was performed in triplicate biological replicates.

2.2. Total RNA Isolation and cDNA Synthesis

Total RNA from leaves, roots, and stems of T. succedaneum were isolated by using the TaKaRa MiniBEST Plant RNA Extraction Kit (TAKARA-Bio Inc., Shiga, Japan) according to its manual. The light absorption of RNA at 230 nm (A230), 260 nm (A260), and 280 nm (A280) were determined by using the K5800C spectrophotometer (KAIAO, Beijing, China), and the concentration and purity of RNA were evaluated by the value of A260 and the ratios of 260/280 (1.8–2.1) and 260/230 (2.3–2.6), respectively. RNA samples were assessed by 1.0% agarose gel electrophoresis (AGE). A total of 500 ng RNA from each sample was used for 1st strand cDNA synthesis using Hifair® III Reverse Transcriptase (YEASEN, Shanghai, China) according to the manufacturer’s protocols.

2.3. Screening of Candidate RGs and Primers Design

We identified six candidate RGs (Table S1) from the T. succedaneum transcriptome data by using the Python library, ERgene (version = 1.2.0) [35]. Four relatively stable traditional RGs were screened according to the gene expression in the transcriptome data of T. succedaneum, namely ACT, 18S rRNA (18S), UBQ, and PP2A2. The primers of the 10 RGs for RT-qPCR were designed using Primer Preminer 6.0. The LinRegPCR (version = 2021.2) [36] was used to calculate the amplification efficiency and correlation coefficient (R2) of each primer pair.

2.4. RT-qPCR

RT-qPCR analysis was performed in 96-well plates with the LightCycler® 96 Real-Time PCR Detection System (Roche, Hercules, Switzerland) using Hieff UNICON® Universal Blue qPCR SYBR Green Master Mix (YEASEN, Shanghai, China). The reaction system was prepared in 20 μL volumes containing 1 μL synthesized cDNA, 10 μL Blue qPCR SYBR Green Master Mix, 0.4 μL of each primer (10 μM), and 8.2 μL ddH2O. The reactions comprised an initial step at 95 °C for 2 min, followed by 40 denaturation cycles at 95 °C for 10 s and primer annealing at 60 °C for 30 s. Fluorescence intensities were measured for RT-qPCR at the end of each cycle. A melting curve (1 cycle of 95 °C for 10 s, 65 °C for 10 s, and 97 °C for 1 s) was performed directly to check for specific amplification. The experiments were performed in triplicate for each sample. The Ct (cycle threshold) values from RT-qPCR were standardized according to the following Formulas (1) and (2):
Ct = Ct sample Ct min
Q = 2 Ct
∆Ct represented the difference value between Ctsample and Ctmin; Ctsample indicates the Ct value of each sample in different treatment groups and tissues; Ctmin represented the minimum Ct value in each different treatment and tissue; and Q stood for the relative expression of genes.

2.5. Assessing the Stability of Candidate Genes Expression

Microsoft Excel 2016 was used to process all the raw Ct values generated by RT-qPCR, and the quartile of Ct values for each RG in all conditions, ∆Ct values and Q values of each RG at the three stages (6 h, 12 h, 24 h) under different treatments and in different tissues were calculated by Excel’s built-in function. All the Q values of each sample at the three stages (6 h, 12 h, and 24 h) under different treatments and in different tissues were imported into GeNorm (https://genorm.cmgg.be/, accessed on 2 May 2022) and NormFinder (https://www.moma.dk/normfinder-software, accessed on 18 May 2022) to overall analysis and identify the stability of RGs. The all the raw Ct values of each sample at the three stages (6 h, 12 h, and 24 h) under different treatments and in different tissues were imported into BestKeeper (https://www.gene-quantification.de/bestkeeper.html, accessed on 22 May 2022) and RefFinder (http://blooge.cn/RefFinder/, accessed on 13 June 2022) to perform an overall analysis and identify the stability of RGs. The data obtained from the experiment were plotted and analyzed by Graphpad Prism 8.0.2 and Microsoft Excel 2016. Adobe Illustrator 2020 was used for chart layout.

3. Results

3.1. Specificity and Amplification Efficiency of Candidate RGs

We used the ERgene tool to screen six RGs (RGs), TsRG01, TsRG02, TsRG03, TsRG04, TsRG05, and TsRG06, and four traditional RGs (ACT, 18S rRNA (18S), UBQ, and PP2A2) that were widely adopted in other plants [7,8,9,10,11,12] (Table 1). Totally, the specific primers of 10 RGs were designed for RT-qPCR, and the specificity of the primers was analyzed based on the melting curve. The results displayed the melting curves of 10 RGs that had a single peak with good repeatability (Figure S1). Furthermore, the RT-qPCR amplification efficiency ranged from 94.12% (PP2A2) to 108.57% (TsRG06), and the R2 of all primers ranged from 0.99897 (TsRG06) to 0.99980 (PP2A2) (Table 1). These results showed that all primers of RGs met the requirements for RT-qPCR and could be used in further analysis.

3.2. Expression Profiling of Candidate RGs

The Ct value represented the expression level of RGs, and the smaller Ct values meant a higher expression level [37]. Moreover, the changes in Ct values reflected the stability of RGs, and the smaller changes in Ct values represent the more stable expression of the genes. The results of expression levels (Ct) of 10 candidate RGs in root, stem, and leaf of T. succedaneum under different stresses showed that the Ct values of RGs varied from 14.04 to 32.60, of which the average Ct of TsRG02 was the smallest (17.62), indicating that its expression level was the highest, and the average Ct of UBQ was the highest (21.51), implying that its expression level was the lowest in all samples (Figure 1). According to the Ct values, the expression of the 10 candidate RGs, from high to low, was TsRG02 > ACT > TsRG04 > TsRG05 > TsRG03 > TsRG01 > 18S > TsRG06 > PP2A2 > UBQ. In addition, the range of Ct changes was the smallest in the ACT gene (ΔCt = 3.26) and the highest in the UBQ gene (ΔCt = 14.91). These results suggested that TsRG01, TsRG03, TsRG06, and ACT can be used as RGs in T. succedaneum under different stresses and tissues.

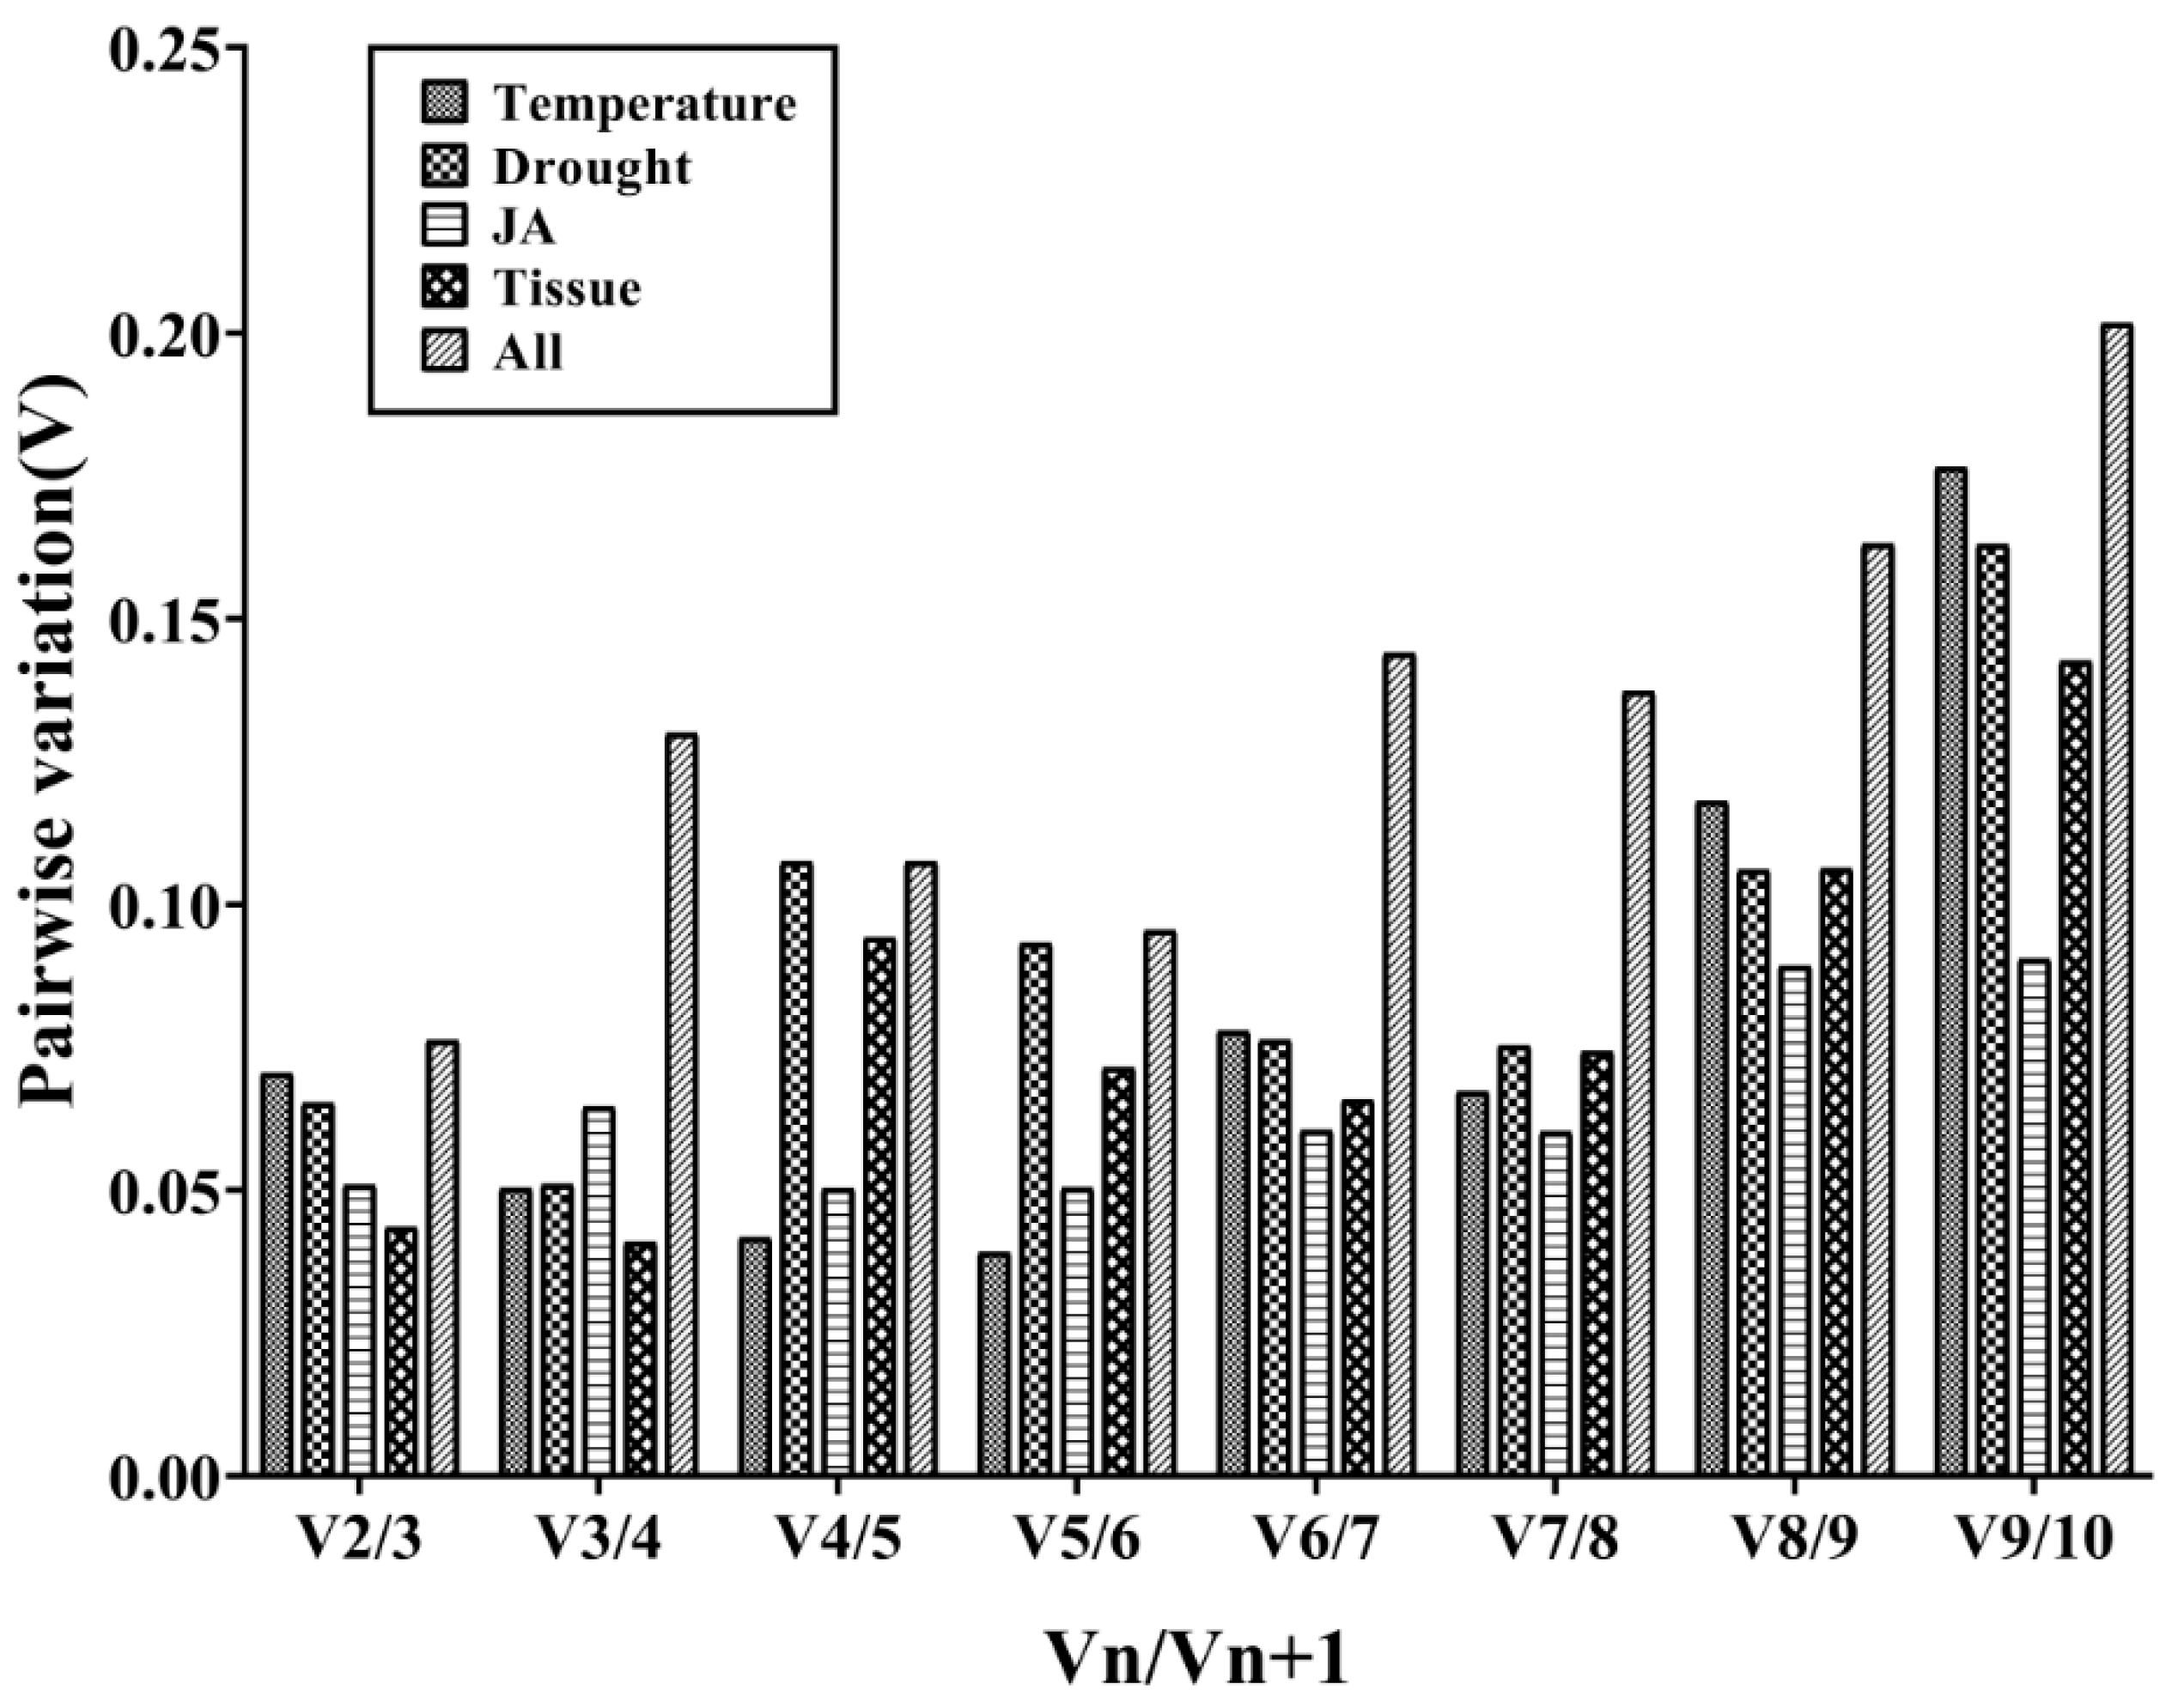
3.3. The Stability of Candidate RGs Was Analyzed by Genorm Software

The GeNorm program, a Visual Basic application tool for Microsoft Excel, can evaluate gene expression stability (M value), which is the mean pair-wise variation between an individual gene and all other tested control genes [30]. The program ranks the genes based on their M values, and the standard of the selected RGs was also based on the M values. The manual of the GeNorm program recommends M = 1.5 as a threshold [23,38]. So, if the M value of the candidate RGs is more than 1.5, it is not suitable as the reference gene; however, some authors propose the maximum value of 0.5 to obtain more accurate results [23,38]. Meanwhile, the RGs with high M values are less stably expressed, whereas those with low M values are stably expressed [29].
All the Q values of each RG at the three stages under different treatments and in different tissues were calculated by Genorm to perform an overall analysis and identify the stability of RGs. The results showed that the expression of TsRG06 and ACT (M = 0.183) was more stable than that of other RGs, while UBQ (M = 0.803) was the least stable gene (Figure 2a) under the high/low temperature treatment. Under the drought treatment, TsRG01 and TsRG06 (M = 0.192) showed the most common and stable expression, while UBQ (M = 0.850) was considered the least stable gene (Figure 2b). Under the JA treatment, 18S and ACT (M = 0.136) were more stable and were recommended as RGs to normalize the expression level of target genes, and UBQ (M = 0.569) seemed to be inappropriate as a reference gene (Figure 2c). For the samples from different tissues, ACT and TsRG03 (M = 0.144) were regarded as the optimal RGs, while UBQ (M = 0.758) was the least stable gene (Figure 2d). Additionally, TsRG03 and TsRG06 (M = 0.161) were stable genes, but TsRG04 (M = 1.079) was the least stable gene in all the samples (Figure 2e).
Furthermore, the geNorm program can calculate the optimal number of required RGs for obtaining reliable results from RT-qPCR analysis by pairwise variation (V) analysis of RGs. In order to determine the optimal number of candidate RGs required for RT-qPCR data normalization, the geNorm program was used to analyze the pairwise variation (Vn/Vn+1) between the normalization factors (NF) NFn and NFn+1. The geNorm program proposed 0.15 as a cut-off value, which means if Vn/Vn+1 < 0.15, the minimum value of n is the optimal number of genes required [30]. As shown in Figure 3, the V2/3 values in the tissues for temperature stress, drought stress, and JA treatment were less than 0.15, which suggested that the top two RGs were sufficient for accurate normalization. In different tissues, TsRG03/TsRG06 (V2/V3 = 0.044) was a suitable gene pair for mRNA level normalization. TsRG06/ACT (V2/V3 = 0.070) were identified as an appropriate gene set under temperature treatments. Moreover, the gene pair TsRG01/TsRG06 (V2/V3 = 0.065) was recommended for drought treatment, while 18S/ACT (V2/V3 = 0.050) were suggested as the RGs under JA treatment. In addition, TsRG03/TsRG06 (V2/V3 = 0.055) were selected as RGs sets in all the samples (Figure 3).

3.4. The Stability of Candidate RGs Was Analyzed by Normfinder Software

NormFinder, another Visual Basic application, was used to evaluate the expression level of 10 candidate RGs; it can automatically calculate the stability value for all candidate RGs on each sample set [31]. The NormFinder software ranks the set of candidate normalization genes according to the expression stability of the candidate RGs. RGs with lower stability values showed fewer varied expressions and a more stable expressed pattern, while genes with higher stability values showed more varied expressions and had the least stable expressed pattern [31]. All the Q values of each RG at the three stages under different treatments and in different tissues were calculated by Normfinder to provide an overall analysis and identify the stability of RGs. According to the results, in the group comprised of samples from temperature stress, drought treatment, and different tissues, PP2A2 displayed the best stability value, whereas UBQ was the most unstable gene. For the JA treatment and all samples, TsRG03 was the most stable gene, while TsRG04 was the most unstable gene in all samples (Table 2).

3.5. The Stability of Candidate RGs Was Analyzed by Bestkeeper Software

BestKeeper is a program based on Excel that analyzes the stability of the RGs by calculating the standard deviation (SD) and coefficient of variation (CV) of the Ct values of candidate RGs. Therefore, RGs with smaller SD and CV values have more stable expression, and vice versa [32]. All the raw Ct values of each RG at the three stages under different treatments and in different tissues were calculated by Normfinder to provide an overall analysis and identify the stability of RGs. The results indicated that TsRG01 and TsRG06 tended to be the most stable genes, as they were listed on the top 2 of the ranks under temperature stress, drought treatments, different tissues, and all samples. On the contrary, TsRG02 and UBQ seemed not to be well-rounded RGs. TsRG05 and TsRG04 had values of 0.40 and 0.64 under JA treatments, respectively, and the values showed that TsRG05 was the most stably expressed RG under JA treatments (Table 3).

3.6. The Stability of Candidate RGs Was Analyzed by ∆Ct Value Method

The ΔCt method is based on a comparison of the standard deviation of the ΔCt of the relative expression of paired genes within each sample to identify useful RGs. The reference gene with smaller standard deviations of ΔCt was more stable [39,40]. All the ΔCt values of each RG at the three stages under different treatments and in different tissues were calculated by Excel’s built-in function to perform an overall analysis and identify the stability of RGs. According to ΔCt analysis (Table 4), TsRG03, ACT, and TsRG01 were the most stable candidate RGs when all samples were analyzed, as the lowest mean deviation was detected in these genes. Considering the temperature treatment dataset, it appeared that the most stable genes were TsRG05, TsRG04, and TsRG03 according to the ΔCt values. For drought samples, the most stable genes were ACT, TsRG03, and TsRG06. For the JA treatment and in different tissues, TsRG03 was the most stable gene, while UBQ was the most unstable gene.

3.7. The Stability of Candidate RGs Was Comprehensive Analyzed by RefFinder Software

RefFinder is a web-based online analysis tool that has been used to comprehensively rank the stability of RGs obtained by geNorm, NormFinder, and BestKeeper software and calculate the geometric mean value [33]. The smaller geometric mean stand for the RGs are more stable [33]. However, the results of 10 candidate RGs by three software (geNorm, Normfinde, and BestKeeper) and ∆Ct analysis showed the similarities and differences in stability of RGs in T. succedaneum, indicating that different analysis methods achieve different results. Therefore, to obtain a more reasonable ranking order of 10 candidate RGs’ stability, we used the online tool RefFinder to conduct a comprehensive ranking of the results obtained by the above three software programs and ∆Ct analysis. All the raw Ct values of each RG at the three stages under different treatments and in different tissues were calculated by RefFinder to provide an overall analysis and identify the stability of RGs. The results of the RefFinder software showed that TsRG05 (Table 5A), TsRG01 (Table 5B and C), and TsRG03 (Table 5C) were the most stable RGs under high/low temperatures, drought, and JA treatment, respectively. What is more, TsRG03 was also the most stable reference gene in different tissues (Table 5D). In all samples, TsRG03 was strongly recommended as a reference gene according to the top geometric mean (ranking values), and UBQ was consistently the least reliable gene because of its comprehensive ranking always remained the lowest in all sample sets (Table 5E).

4. Discussion

4.1. Potential RGs Were Identified from the Transcriptome Data

In this study, six potential RGs were identified based on the T. succedaneum transcriptome data using the ERgene tool and the annotation results from nine databases (Gene Ontology (GO), Kyoto Encyclopedia of Genes and Genomes orthology (KOG), Practical Finite-Analytic Method (Pfam), Swissprot, Translation of EMBL (TrEMBL), evolutionary genealogy of genes: Non-supervised Orthologous Groups (eggNOG), nucleotide sequence database (nr), Kyoto Encyclopedia of Genes and Genomes (KEGG). According to the tools and database analyses, TsRG01, TsRG05, and TsRG06 belonged to ribosomal RNA and encoded 40S rRNA (Table S1), and TsRG03 and TsRG04 belonged to the elongation factor gene family (TsRG03 was an EF-1β-like gene, and TsRG04 was an EF-1α-like gene). Regrettably, the function of the TsRG02 gene has not been characterized, and further studies are needed for verification (Table S1). EF gene family and ribosomal RNA as the RGs have been reported [7,41,42]. However, thus far, there are no reports on the use of 40S rRNA as a reference gene. Our results (Table 5) showed that the expression of 40S rRNA in T. succedaneum was stable and could be used as a reference gene. In addition, we found a new reference gene, TsRG02, which had a good stability expression when T. succedaneum was treated with JA but was unstable under other conditions (Table 5). So, TsRG02 was specific as an internal reference gene for T. succedaneum under high/low temperature and drought stress.

4.2. Identification and Selection of RGs

The selection of appropriate RGs is an important preliminary step in the process of gene expression research. Therefore, it is necessary to screen the most stable RGs under different experimental treatments and in different tissues when using RT-qPCR to analyze the target gene expression. A number of studies have shown that the types and stability of RGs vary with different plant species, tissues, stages of development, and biotic/abiotic stress treatments [18]. Therefore, by comparing the analysis results obtained by different RG screening software programs, the most stable RGs can be better determined under diverse situations, including different species, tissues, experimental treatments, etc. Moreover, the experimental error caused by the artificial blind selection of RGs can be eliminated. However, the gene expression stability data obtained by software was not completely consistent in our study, which was caused by different algorithms (Table 5). Therefore, it is essential to use multiple software analyses to increase the reliability of experimental results.
The results of the comprehensive analysis showed that TsRG05/06, TsRG01/06, and TsRG01/06 were stable under high/low temperature stress, drought stress, and JA treatment, respectively. TsRG03 and ACT had stable expression in different tissues. In all samples, TsRG03 and ACT were recommended as the suitable RGs for T. succedaneum. Our study found that the expression levels of ACT and TsRG03 were stable under JA treatment and in different tissues; therefore, they were recommended as RGs in all samples. However, a previous study has shown that ACT was the least stable of the 13 RGs tested in Cycas elongate [43], and this is not consistent with our results. So, whether ACT could be used as a reference gene in T. succedaneum under other treatments needs further experimental verification. On the other hand, UBQ belonged to the ubiquitin family gene, which was a kind of traditional reference gene, but its expression level was extremely unstable in all samples in our study. We speculated that this may be due to temperature, drought, and JA stress affecting the dynamic balance between ubiquitination and deubiquitination in T. succedaneum cells, just as several studies had shown that UBQ was unsuitable for normalization in Suaeda aralocaspica and Camellia sinensis [44,45]. Furthermore, the expression of UBQ was induced by external factors such as high temperature and drought stress in A. thaliana [46] and Vicia faba [47], respectively. Therefore, it is necessary to screen and evaluate candidate RGs before analyzing the expression of the target gene.
In summary, we screened a series of potential RGs in T. succedaneum under different conditions (high/low temperature stress, drought, JA treatment, and different tissues). These results provide alternative RGs for future studies such as exploring the function of genes, correction and normalization of target gene expression, and directed molecular breeding in T. succedaneum.

5. Conclusions

In this study, three software programs and ΔCt analyses were used to determine the stability of 10 candidate RGs in the different tissues (roots, stems, and leaves) under different stresses in T. succedaneum. The results of the comprehensive analysis showed that the stability of the 10 candidate genes under high/low temperature stresses was ranked as TsRG05 > TsRG06 > ACT > TsRG04 > TsRG01 > PP2A2 > TsRG03 > 18S > TsRG02 > UBQ, therefore we recommended TsRG05 and TsRG06 as the combination of RGs when T. succedaneum was under temperature stress. While the stability of 10 genes was ranked as TsRG01 > TsRG06 > ACT > TsRG03 > PP2A2 > TsRG04 > 18S > TsRG05 > TsRG02 > UBQ when T. succedaneum was treated with PEG600, and TsRG01 and TsRG06 were recommended as the better combination of RGs. Furthermore, when T. succedaneum was induced by JA, the stability of genes ranked as TsRG03 > ACT > TsRG02 > TsRG01 > 18S > TsRG06 > TsRG05 > TsRG04 > PP2A2 > UBQ, so TsRG03 and ACT had good stability as RGs in T. succedaneum under JA treatment. Moreover, the stability order of 10 genes in different tissues was TsRG03 > ACT > PP2A2 > TsRG01 > TsRG04 > TsRG06 > TsRG05 > 18S > TsRG02 > UBQ, and TsRG03 and ACT were recommended as the better combination of RGs. Lastly, the stability order of 10 genes was ranked as TsRG03 > ACT > TsRG01 > TsRG05 > TsRG06 > PP2A2 > 18S > TsRG02 > TsRG04 > UBQ in all conditions, and TsRG03 and ACT were recommended combinations as the RGs. However, according to our results, UBQ was not suitable for gene expression analysis in T. succedaneum. In any case, our study lays the foundation for further analysis of differential gene expression and molecular mechanisms in T. succedaneum in response to different treatments. Moreover, this study is helpful for molecular biology-related research in T. succedaneum.

Supplementary Materials

The following supporting information can be downloaded at: https://www.mdpi.com/article/10.3390/genes13122396/s1, Figure S1: The melting curve analysis of real-time quantitative PCR (RT-qPCR) amplification of 10 candidate RGs in T. succedaneum; Table S1: Database annotation of six RGs from transcriptome data.

Author Contributions

Conceptualization, D.M. and J.Y.; methodology, D.M., Q.Z. and J.Y.; software, D.M. and Q.Z.; validation, D.M., Q.Z. and Y.L.; formal analysis, D.M.; investigation, X.D.; resources, C.H. and X.D.; data curation, Y.L. and J.Z.; writing—original draft preparation, D.M. and Q.Z.; writing—review and editing, D.M. and Q.Z.; visualization, D.M.; supervision, J.Y. and C.H.; project administration, C.H.; funding acquisition, C.H. All authors have read and agreed to the published version of the manuscript.

Funding

This research was funded by the Yunnan Provincial Expert Workstation (202005AF150020), and the Yunnan Provincial “Ten-Thousand Program” for Leading Industry Innovation (YUWR-CYJS-2020-018).

Institutional Review Board Statement

Not applicable.

Informed Consent Statement

Not applicable.

Data Availability Statement

Data supporting this study can be obtained by contacting the corresponding author upon reasonable request.

Conflicts of Interest

The authors declare no conflict of interest.

References

  1. Ciesielska, A.; Stączek, P. Selection and validation of RGs for qRT-PCR analysis of gene expression in Microsporum canis growing under different adhesion-inducing conditions. Sci. Rep. 2018, 8, 1197. [Google Scholar] [CrossRef] [Green Version]
  2. Liu, W.; Yuan, X.; Yuan, S.; Dai, L.; Dong, S.; Liu, J.; Peng, L.; Wang, M.; Tang, Y.; Xiao, Y. Optimal RGs for gene expression analysis in polyploid of Cyprinus carpio and Carassius auratus. BMC Genet. 2020, 21, 107. [Google Scholar] [CrossRef]
  3. Yang, Z.; Zhang, R.; Zhou, Z. Identification and Validation of RGs for Gene Expression Analysis in Schima superba. Genes 2021, 12, 732. [Google Scholar] [CrossRef]
  4. Ahmed, U.; Xie, Q.; Shi, X.; Zheng, B. Development of RGs for Horticultural Plants. Crit. Rev. Plant Sci. 2022, 41, 190–208. [Google Scholar] [CrossRef]
  5. Wang, Z.; Yu, F.; Shi, D.; Wang, Y.; Xu, F.; Zeng, S. Selection and validation of RGs for RT-qPCR analysis in Desmodium styracifolium Merr. 3 Biotech 2021, 11, 403. [Google Scholar] [CrossRef] [PubMed]
  6. Guénin, S.; Mauriat, M.; Pelloux, J.; Van Wuytswinkel, O.; Bellini, C.; Gutierrez, L. Normalization of qRT-PCR data: The necessity of adopting a systematic, experimental conditions-specific, validation of references. J. Exp. Bot. 2009, 60, 487–493. [Google Scholar] [CrossRef] [PubMed] [Green Version]
  7. Xu, W.; Dong, Y.; Yu, Y.; Xing, Y.; Li, X.; Zhang, X.; Hou, X.; Sun, X. Identification and evaluation of reliable RGs for quantitative real-time PCR analysis in tea plants under differential biotic stresses. Sci. Rep. 2020, 10, 2429. [Google Scholar] [CrossRef] [Green Version]
  8. Ferradás, Y.; Rey, L.; Martínez, Ó.; Rey, M.; González, M.V. Identification and validation of RGs for accurate normalization of real-time quantitative PCR data in kiwifruit. Plant Physiol. Biochem. 2016, 102, 27–36. [Google Scholar] [CrossRef]
  9. Wu, J.; Zhang, H.; Liu, L.; Li, W.; Wei, Y.; Shi, S. Validation of RGs for RT-qPCR Studies of Gene Expression in Preharvest and Postharvest Longan Fruits under Different Experimental Conditions. Front. Plant Sci. 2016, 7, 780. [Google Scholar] [CrossRef] [Green Version]
  10. Liu, D.; Shi, L.; Han, C.; Yu, J.; Li, D.; Zhang, Y. Validation of RGs for gene expression studies in virus-infected Nicotiana benthamiana using quantitative real-time PCR. PLoS ONE 2012, 7, e46451. [Google Scholar] [CrossRef]
  11. Gantasala, N.P.; Papolu, P.K.; Thakur, P.K.; Kamaraju, D.; Sreevathsa, R.; Rao, U. Selection and validation of RGs for quantitative gene expression studies by real-time PCR in eggplant (Solanum melongena L). BMC Res. Notes 2013, 6, 312. [Google Scholar] [CrossRef] [PubMed] [Green Version]
  12. Lopez-Pardo, R.; Ruiz De Galarreta, J.I.; Ritter, E. Selection of housekeeping genes for qRT-PCR analysis in potato tubers under cold stress. Mol. Breed. 2013, 31, 39–45. [Google Scholar] [CrossRef]
  13. Chen, X.; Truksa, M.; Shah, S.; Weselake, R.J. A survey of quantitative real-time polymerase chain reaction internal RGs for expression studies in Brassica napus. Anal. Biochem. 2010, 405, 138–140. [Google Scholar] [CrossRef] [PubMed]
  14. Artico, S.; Nardeli, S.M.; Brilhante, O.; Grossi-De-Sa, M.F.; Alves-Ferreira, M. Identification and evaluation of new RGs in Gossypium hirsutum for accurate normalization of real-time quantitative RT-PCR data. BMC Plant Biol. 2010, 10, 49. [Google Scholar] [CrossRef] [Green Version]
  15. Barsalobres-Cavallari, C.F.; Severino, F.E.; Maluf, M.P.; Maia, I.G. Identification of suitable internal control genes for expression studies in Coffea arabica under different experimental conditions. BMC Mol. Biol. 2009, 10, 1. [Google Scholar] [CrossRef] [Green Version]
  16. Die, J.V.; Román, B.; Nadal, S.; González-Verdejo, C.I. Evaluation of candidate RGs for expression studies in Pisum sativum under different experimental conditions. Planta 2010, 232, 145–153. [Google Scholar] [CrossRef] [Green Version]
  17. Luo, H.; Chen, S.; Wan, H.; Chen, F.; Gu, C.; Liu, Z. Candidate RGs for gene expression studies in water lily. Anal. Biochem. 2010, 404, 100–102. [Google Scholar] [CrossRef]
  18. Joseph, J.T.; Poolakkalody, N.J.; Shah, J.M. Plant RGs for development and stress response studies. J. Biosci. 2018, 43, 173–187. [Google Scholar] [CrossRef]
  19. Chen, H.; Hu, B.; Zhao, L.; Shi, D.; She, Z.; Huang, X.; Priyadarshani, S.V.G.N.; Niu, X.; Qin, Y. Differential Expression Analysis of RGs in Pineapple (Ananas comosus L.) during Reproductive Development and Response to Abiotic Stress, Hormonal Stimuli. Trop. Plant Biol. 2019, 12, 67–77. [Google Scholar] [CrossRef]
  20. Fan, C.; Qiu, Z.; Zeng, B.; Liu, Y.; Li, X.; Guo, G. Selection of RGs for quantitative real-time PCR in Casuarina equisetifolia under salt stress. Biol. Plant. 2017, 61, 463–472. [Google Scholar] [CrossRef]
  21. Zheng, T.; Chen, Z.; Ju, Y.; Zhang, H.; Cai, M.; Pan, H.; Zhang, Q. Reference gene selection for qRT-PCR analysis of flower development in Lagerstroemia indica and L. speciosa. PLoS ONE 2018, 13, e195004. [Google Scholar] [CrossRef] [PubMed] [Green Version]
  22. Li, M.; Wang, F.; Jiang, Q.; Wang, G.; Tian, C.; Xiong, A. Validation and Comparison of RGs for qPCR Normalization of Celery (Apium graveolens) at Different Development Stages. Front. Plant Sci. 2016, 7, 313. [Google Scholar] [CrossRef] [PubMed] [Green Version]
  23. Ma, R.; Xu, S.; Zhao, Y.; Xia, B.; Wang, R. Selection and Validation of Appropriate RGs for Quantitative Real-Time PCR Analysis of Gene Expression in Lycoris aurea. Front. Plant Sci. 2016, 7, 536. [Google Scholar] [CrossRef] [PubMed] [Green Version]
  24. Gutierrez, L.; Mauriat, M.; Guénin, S.; Pelloux, J.; Lefebvre, J.F.; Louvet, R.; Rusterucci, C.; Moritz, T.; Guerineau, F.; Bellini, C.; et al. The lack of a systematic validation of RGs: A serious pitfall undervalued in reverse transcription-polymerase chain reaction (RT-PCR) analysis in plants. Plant Biotechnol. J. 2008, 6, 609–618. [Google Scholar] [CrossRef] [PubMed] [Green Version]
  25. Zhang, K.; Li, M.; Cao, S.; Sun, Y.; Long, R.; Kang, J.; Yan, L.; Cui, H. Selection and validation of RGs for target gene analysis with quantitative real-time PCR in the leaves and roots of Carex rigescens under abiotic stress. Ecotoxicol. Environ. Saf. 2019, 168, 127–137. [Google Scholar] [CrossRef] [PubMed]
  26. Hiraoka, Y.; Tamaki, I.; Watanabe, A. The origin of wild populations of Toxicodendron succedaneum on mainland Japan revealed by genetic variation in chloroplast and nuclear DNA. J. Plant Res. 2018, 131, 225–238. [Google Scholar] [CrossRef]
  27. Jun, T.; Kun, Y.S.; Zhi, C.F.; Wei, C.Z.; Hua, Z.J.; Yun, X.D. Research progress on Toxicodendron succedaneum. Hubei Agric. Sci. 2019, 58, 16–20. [Google Scholar] [CrossRef]
  28. Nitta, K.; Kataoka, K.; Sakurai, T. Primary structure of a Japanese lacquer tree laccase as a prototype enzyme of multicopper oxidases. J. Inorg. Biochem. 2002, 91, 125–131. [Google Scholar] [CrossRef]
  29. Wu, P.L.; Lin, S.B.; Huang, C.P.; Chiou, R.Y. Antioxidative and cytotoxic compounds extracted from the sap of Rhus succedanea. J. Nat. Prod. 2002, 65, 1719–1721. [Google Scholar] [CrossRef]
  30. Vandesompele, J.; De Preter, K.; Pattyn, F.; Poppe, B.; Van Roy, N.; De Paepe, A.; Speleman, F. Accurate normalization of real-time quantitative RT-PCR data by geometric averaging of multiple internal control genes. Genome Biol. 2002, 3, H34. [Google Scholar] [CrossRef]
  31. Andersen, C.L.; Jensen, J.L.; Ørntoft, T.F. Normalization of real-time quantitative reverse transcription-PCR data: A model-based variance estimation approach to identify genes suited for normalization, applied to bladder and colon cancer data sets. Cancer Res. 2004, 64, 5245–5250. [Google Scholar] [CrossRef] [PubMed] [Green Version]
  32. Pfaffl, M.W.; Tichopad, A.; Prgomet, C.; Neuvians, T.P. Determination of stable housekeeping genes, differentially regulated target genes and sample integrity: BestKeeper--Excel-based tool using pair-wise correlations. Biotechnol. Lett. 2004, 26, 509–515. [Google Scholar] [CrossRef]
  33. Xie, F.; Xiao, P.; Chen, D.; Xu, L.; Zhang, B. miRDeepFinder: A miRNA analysis tool for deep sequencing of plant small RNAs. Plant Mol. Biol. 2012, 80, 75–84. [Google Scholar] [CrossRef] [PubMed]
  34. Schilmiller, A.L.; Howe, G.A. Systemic signaling in the wound response. Curr. Opin. Plant Biol. 2005, 8, 369–377. [Google Scholar] [CrossRef] [PubMed]
  35. Zeng, Z.; Xiong, Y.; Guo, W.; Du, H. ERgene: Python library for screening endogenous RGs. Sci. Rep. 2020, 10, 18557. [Google Scholar] [CrossRef] [PubMed]
  36. Ramakers, C.; Ruijter, J.M.; Deprez, R.H.; Moorman, A.F. Assumption-free analysis of quantitative real-time polymerase chain reaction (PCR) data. Neurosci. Lett. 2003, 339, 62–66. [Google Scholar] [CrossRef] [PubMed]
  37. Zhao, J.; Zhou, M.; Meng, Y. Identification and Validation of RGs for RT-qPCR Analysis in Switchgrass under Heavy Metal Stresses. Genes 2020, 11, 502. [Google Scholar] [CrossRef]
  38. Hellemans, J.; Mortier, G.; De Paepe, A.; Speleman, F.; Vandesompele, J. qBase relative quantification framework and software for management and automated analysis of real-time quantitative PCR data. Genome Biol. 2007, 8, R19. [Google Scholar] [CrossRef] [Green Version]
  39. Morales, M.A.; Mendoza, B.M.; Lavine, L.C.; Lavine, M.D.; Walsh, D.B.; Zhu, F. Selection of RGs for Expression Studies of Xenobiotic Adaptation in Tetranychus urticae. Int. J. Biol. Sci. 2016, 12, 1129–1139. [Google Scholar] [CrossRef] [Green Version]
  40. Silver, N.; Best, S.; Jiang, J.; Thein, S.L. Selection of housekeeping genes for gene expression studies in human reticulocytes using real-time PCR. BMC Mol. Biol. 2006, 7, 33. [Google Scholar] [CrossRef]
  41. Patankar, H.V.; Assaha, D.V.M.; Al-Yahyai, R.; Sunkar, R.; Yaish, M.W. Identification of RGs for Quantitative Real-Time PCR in Date Palm (Phoenix dactylifera L.) Subjected to Drought and Salinity. PLoS ONE 2016, 11, e166216. [Google Scholar] [CrossRef] [PubMed] [Green Version]
  42. Auler, P.A.; Benitez, L.C.; Do, A.M.; Vighi, I.L.; Dos, S.R.G.; Da, M.L.; Braga, E.J. Evaluation of stability and validation of RGs for RT-qPCR expression studies in rice plants under water deficit. J. Appl. Genet. 2017, 58, 163–177. [Google Scholar] [CrossRef] [PubMed]
  43. Hu, Y.; Deng, T.; Chen, L.; Wu, H.; Zhang, S. Selection and Validation of RGs for qRT-PCR in Cycas elongata. PLoS ONE 2016, 11, e154384. [Google Scholar] [CrossRef] [Green Version]
  44. Cao, J.; Wang, L.; Lan, H. Validation of RGs for quantitative RT-PCR normalization in Suaeda aralocaspica, an annual halophyte with heteromorphism and C4 pathway without Kranz anatomy. Peerj 2016, 4, e1697. [Google Scholar] [CrossRef] [PubMed] [Green Version]
  45. Hao, X.; Horvath, D.P.; Chao, W.S.; Yang, Y.; Wang, X.; Xiao, B. Identification and evaluation of reliable RGs for quantitative real-time PCR analysis in tea plant (Camellia sinensis (L.) O. Kuntze). Int. J. Mol. Sci. 2014, 15, 22155–22172. [Google Scholar] [CrossRef]
  46. Burke, T.J.; Callis, J.; Vierstra, R.D. Characterization of a polyubiquitin gene from Arabidopsis thaliana. Mol. Gen. Genet. 1988, 213, 435–443. [Google Scholar] [CrossRef]
  47. Ammar, M.H.; Khan, A.M.; Migdadi, H.M.; Abdelkhalek, S.M.; Alghamdi, S.S. Faba bean drought responsive gene identification and validation. Saudi J. Biol. Sci. 2017, 24, 80–89. [Google Scholar] [CrossRef]
Figure 1. The expression levels of 10 candidate RGs across all experimental samples. The box plot represents the distribution interval of Ct values of 10 RGs in all samples: the upper side represents the upper quartile (75%), the middle line represents the median (50%), the lower side represents the lower quartile (25%), the upper edge represents the maximum value of sample data, and the lower edge represents the minimum value of sample data.
Genes 13 02396 g001
Figure 2. Average expression stability values (M) of 10 candidate RGs under different conditions by geNorm analysis. The direction of the arrows indicates the most and least stable RGs. (a) temperature treatments, (b) drought treatments, (c) JA treatments, (d) different tissues, (e) all samples.
Genes 13 02396 g002
Figure 3. Determination of the optimal number of RGs for normalization by pairwise variation (V) using geNorm. The average pairwise variations (Vn/Vn+1) were analyzed to measure the effect of adding RGs during the RT-qPCR.
Genes 13 02396 g003
Table 1. Primers of candidate RGs.
RGsProduct Size (bp)Primer Sequences (5′-3′)R2Efficiency (%)
TsRG01177F-TTGGGCAGCCGTTGATCTT
R-GCTTAGGGTTTCTCCTCTCCTT
0.9994398.11
TsRG02228F-GCCTCAAAGCCAGGTAAG
R-AGAGTGCCGAAATCATCG
0.99908102.32
TsRG03134F-TCTGCTGCCTTCTCATCCTC
R-GTGGTACGAATGCGTGTCTT
0.99931105.47
TsRG04245F-CTGTCTCACTTGCTGCGGCTAG
R-GCACCCAGGCGTACTTGAATGA
0.9991394.94
TsRG05237F-CCACAAGTCCAGGGAATGCT
R-AGGGAGTGAAGACGGAAACG
0.99898107.71
TsRG06122F-TTCACAAAGCGGGTCTCCC
R-TTCACTTCCTCACGTGGGTC
0.99897108.57
ACT188F-AACTCTCCACCTCGTCCTCC
R-TGGACCAGACTCGTCGTACT
0.99958103.29
PP2A2161F-CCCTGTGACAATTTGTGGCG
R-TAAGGGCCACTAACAGCGTG
0.9998094.12
UBQ200F-GGGTCCTCCCATCCTCAAGT
R-AACTCTCCACCTCGTCCTCC
0.9990194.13
18S209F-GAAGAGCATCCAGTGCTT
R-TGCATCGGTGAGATCACG
0.99927101.17
Table 2. Stability of candidate RGs calculated by NormFinder under different conditions.
RankTemperatureDroughtJATissuesAll
GeneStabilityGeneStabilityGeneStabilityGeneStabilityGeneStability
1PP2A20.12PP2A20.27TsRG030.05PP2A20.11TsRG030.08
218S0.2218S0.38TsRG020.11TsRG040.29ACT0.13
3TsRG050.24ACT0.39ACT0.2TsRG050.34TsRG010.13
4TsRG040.26TsRG030.43TsRG060.2018S0.35TsRG050.30
5TsRG030.34TsRG040.45TsRG010.21TsRG030.39PP2A20.36
6ACT0.42TsRG050.4718S0.28ACT0.4418S0.48
7TsRG060.45TsRG060.47TsRG040.38TsRG010.46TsRG061.01
8TsRG010.46TsRG010.49TsRG050.57TsRG060.46TsRG021.08
9TsRG020.99TsRG020.86PP2A20.76TsRG020.88UBQ1.59
10UBQ1.76UBQ1.62UBQ0.90UBQ1.42TsRG042.00
Table 3. Expression stability values of candidate RGs under different conditions were calculated by BestKeeper.
Samples12345678910
TemperaturegeneTsRG06TsRG01ACTTsRG03TsRG04TsRG05PP2A218STsRG02UBQ
SD0.720.740.830.860.930.941.271.401.652.05
CV3.723.924.524.575.015.036.097.429.159.35
DroughtgeneTsRG01TsRG06TsRG03TsRG04ACTTsRG05PP2A218STsRG02UBQ
SD0.650.650.660.740.740.740.951.221.471.89
CV3.473.423.563.994.054.004.556.408.178.45
JAgeneTsRG05TsRG04TsRG06TsRG01TsRG03ACTTsRG0218SPP2A2UBQ
SD0.400.640.670.740.770.920.930.971.301.43
CV2.333.803.714.174.275.136.095.506.117.28
TissuesgeneTsRG01TsRG06TsRG03ACTTsRG05TsRG04PP2A218STsRG02UBQ
SD0.670.700.720.730.810.841.051.321.511.82
CV3.593.643.883.994.334.505.056.998.418.36
AllgeneTsRG01TsRG06TsRG03ACTTsRG05TsRG04PP2A218STsRG02UBQ
SD0.720.730.750.760.850.881.090.331.711.79
CV3.883.834.044.194.604.805.237.129.708.31
Table 4. Expression stability of 10 candidate RGs under different conditions were calculated by ∆Ct.
RankTemperatureDroughtJATissuesAll
GeneStabilityGeneStabilityGeneStabilityGeneStabilityGeneStability
1TsRG050.57ACT0.66TsRG030.42TsRG030.59TsRG030.85
2TsRG040.59TsRG030.67TsRG020.44PP2A20.62ACT0.87
3TsRG030.61TsRG060.68TsRG010.44TsRG040.62TsRG010.87
4TsRG060.62PP2A20.70ACT0.44ACT0.62TsRG050.93
5ACT0.63TsRG010.70TsRG060.46TsRG060.62PP2A20.93
6TsRG010.65TsRG040.7618S0.48TsRG010.6218S0.97
7PP2A20.6818S0.77TsRG040.54TsRG050.65TsRG061.32
818S0.71TsRG050.79TsRG050.6618S0.71TsRG021.34
9TsRG021.17TsRG021.07PP2A20.84TsRG021.05UBQ1.72
10UBQ1.80UBQ1.68UBQ0.97UBQ1.47TsRG042.09
Table 5. The stability ranking order of 10 candidate RGs were calculated by RefFinder.
A. Ranking Order under High/Low Temperature Stress (Better–Good–Average)
Ranking∆CtgeNormNormfinderBestKeeperComprehensive rankingRanking values
1TsRG05TsRG06|ACTPP2A2TsRG01TsRG052.59
2TsRG04-18STsRG06TsRG062.74
3TsRG03TsRG05TsRG05ACTACT3.08
4TsRG06TsRG04TsRG04TsRG04TsRG043.36
5ACTTsRG01TsRG03TsRG05TsRG013.94
6TsRG01TsRG03ACTTsRG03PP2A24.30
7PP2A2PP2A2TsRG06PP2A2TsRG034.82
818S18STsRG0118S18S5.66
9TsRG02TsRG02TsRG02TsRG02TsRG029.00
10UBQUBQUBQUBQUBQ10.00
B. Ranking Order under drought stress (Better–Good–Average)
Ranking∆CtgeNormNormfinderBestKeeperComprehensive rankingRanking values
1ACTTsRG06|TsRG01PP2A2TsRG01TsRG012.51
2TsRG03-18STsRG06TsRG062.55
3TsRG06TsRG03ACTTsRG03ACT2.78
4PP2A2ACTTsRG03TsRG04TsRG032.91
5TsRG01PP2A2TsRG04ACTPP2A23.44
6TsRG04TsRG04TsRG05TsRG05TsRG045.18
718STsRG05TsRG06PP2A218S5.47
8TsRG0518STsRG0118STsRG056.70
9TsRG02TsRG02TsRG02TsRG02TsRG029.00
10UBQUBQUBQUBQUBQ10.00
C. Ranking Order under JA stress (Better–Good–Average)
Ranking∆CtgeNormNormfinderBestKeeperComprehensive rankingRanking values
1TsRG03ACT|18STsRG03TsRG05TsRG032.24
2TsRG02-TsRG02TsRG04ACT2.91
3TsRG01TsRG02ACTTsRG06TsRG023.03
4ACTTsRG01TsRG06TsRG01TsRG013.94
5TsRG06TsRG03TsRG01TsRG0318S4.12
618STsRG0618SACTTsRG064.36
7TsRG04TsRG04TsRG04TsRG02TsRG054.76
8TsRG05TsRG05TsRG0518STsRG045.12
9PP2A2PP2A2PP2A2PP2A2PP2A29.00
10UBQUBQUBQUBQUBQ10.00
D. Ranking Order under different tissues (Better–Good–Average)
Ranking∆CtgeNormNormfinderBestKeeperComprehensive rankingRanking values
1TsRG03TsRG03|ACTPP2A2TsRG01TsRG031.97
2PP2A2-TsRG04TsRG06ACT3.13
3TsRG04TsRG06TsRG05TsRG03PP2A23.15
4ACTTsRG0118SACTTsRG013.6
5TsRG06TsRG04TsRG03TsRG05TsRG043.66
6TsRG01TsRG05ACTTsRG04TsRG063.94
7TsRG05PP2A2TsRG01PP2A2TsRG055.01
818S18STsRG0618S18S6.73
9TsRG02TsRG02TsRG02TsRG02TsRG029.00
10UBQUBQUBQUBQUBQ10.00
E. Ranking Order under all samples (Better–Good–Average)
Ranking∆CtgeNormNormfinderBestKeeperComprehensive rankingRanking values
1TsRG03TsRG03|ACTTsRG03TsRG01TsRG031.32
2ACT-ACTTsRG06ACT2.00
3TsRG01TsRG01TsRG01TsRG03TsRG012.28
4TsRG05TsRG05TsRG05ACTTsRG054.23
5PP2A2PP2A2PP2A2TsRG05TsRG065.12
618S18S18STsRG04PP2A25.44
7TsRG06TsRG06TsRG06PP2A218S6.45
8TsRG02TsRG02TsRG0218STsRG028.24
9UBQUBQUBQTsRG02TsRG048.80
10TsRG04TsRG04TsRG04UBQUBQ9.24
Publisher’s Note: MDPI stays neutral with regard to jurisdictional claims in published maps and institutional affiliations.

