Article

Genome-Wide Analysis for Early Growth-Related Traits of the Locally Adapted Egyptian Barki Sheep

1
Leibniz Institute for Farm Animal Biology, Wilhelm-Stahl-Allee 2, 18196 Dummerstorf, Germany
2
Desert Research Center, Department of Animal and Poultry Breeding, 1 Mathaf El-Matareya St., El-Matareya, Cairo 11753, Egypt
3
Faculty of Agricultural and Environmental Sciences, University of Rostock, Justus-von-Liebig-Weg 7, 18059 Rostock, Germany
*
Author to whom correspondence should be addressed.
Genes 2021, 12(8), 1243; https://doi.org/10.3390/genes12081243
Submission received: 17 June 2021 / Revised: 9 August 2021 / Accepted: 11 August 2021 / Published: 13 August 2021
(This article belongs to the Special Issue Genetics and Breeding of Small Ruminants)

Abstract

:
Sheep play a critical role in the agricultural and livestock sector in Egypt. For sheep meat production, growth traits such as birth and weaning weights are very important and determine the supply and income of local farmers. The Barki sheep originates from the northeastern coastal zone of Africa, and due to its good adaptation to the harsh environmental conditions, it contributes significantly to the meat production in these semi-arid regions. This study aimed to use a genome-wide SNP panel to identify genomic regions that are diversified between groups of individuals of Egyptian Barki sheep with high and low growth performance traits. In this context, from a phenotyped population of 140 lambs of Barki sheep, 69 lambs were considered for a genome-wide scan with the Illumina OvineSNP50 V2 BeadChip. The selected lambs were grouped into divergent subsets with significantly different performance for birth weight and weaning weight. After quality control, 63 animals and 40,383 SNPs were used for analysis. The fixation index (FST) for each SNP was calculated between the groups. The results verified genomic regions harboring some previously proposed candidate genes for traits related to body growth, i.e., EYA2, GDF2, GDF10, MEF2B, SLC16A7, TBX15, TFAP2B, and TNNC2. Moreover, novel candidate genes were proposed with known functional implications on growth processes such as CPXM2 and LRIG3. Subsequent association analysis showed significant effects of the considered SNPs on birth and weaning weights. Results highlight the genetic diversity associated with performance traits and thus the potential to improve growth traits in the Barki sheep breed.

1. Introduction

Breeding is one of the main drivers affecting allele frequencies, leading to genomic regions with genetic differentiation, thus contributing to the genetic diversity of livestock species [1]. Many studies analyzing the genetic architecture of complex traits using genome-wide SNP data have been conducted in different livestock species in the last decade. In ruminants, these studies have detected candidate genes related to growth, muscle conformation, adaptation, and reproduction traits in sheep [2,3,4,5,6]; milk production, reproduction, body constitution, muscle development, coat color, and thermotolerance in cattle [7,8]; and adaptation, coat color, milk composition, and growth traits in goats [9,10]. To identify the corresponding genomic regions, several methods are available that are capable of analyzing genetic variation within a population and between populations or groups of individuals. The calculation of fixation index (FST) of Weir and Cockerham (1984) is one of the most popular methods to analyze population structure in this framework. The FST approach measures genomic differentiation between two or more populations, breeds, or divergent lines and subgroups in the same breed, depending on allele frequency, and is thus able to identify highly differentiated alleles that undergo selection, while being unbiased for sample size [7,11].
Growth traits are very important in sheep breeding and considerably affect the resource efficiency and breeder’s profit. Growth traits, like other quantitative traits, are controlled by the complex genetic background of the animal as well as environmental factors, such as feed and herd management. Body weight gain has a moderate to high heritability [12,13,14] and is one of the main indices of selection, especially for meat type breeds. However, it also influences wool production and the reproduction performance of sheep [15]. Body weight gain can be monitored at birth or at other animal life stages and largely determines the amount of income from sheep meat production. Weight measurement at birth represents the earliest indicator of growth performance and related traits [16]. Various genetic but also non-genetic factors affect the birth weight, such as the dam’s weight, age, and nutrient supply during pregnancy [17]. The heritability of birth weight was estimated to be 0.39 and 0.31 in Iranian Mehraban and Lori–Bakhtiari sheep breeds, respectively. For weaning weight, heritability was estimated to be 0.25 for weaning weight in Iranian Mehraban sheep [17]. Heritabilities for birth weight and weaning weight were 0.19 and 0.20 in Barki sheep, respectively [18]. For Barki sheep-breeding in particular, high weight at birth is not a primary goal; more importance is given to achieving higher weaning weights [18]. This is also related to the fact that problems for the dam or the newborn lamb should be avoided, such as dystocia during the birth process. In fact, Barki sheep show large differences in growth traits, ranging from 2.4 to 5.0 kg for birth weight with an average of 3.7 kg and from 5.2 to 28.8 kg for weaning weight with an average of 13.8 kg [19]. In general, although Barki sheep are highly adapted to the harsh environmental conditions of northeast Africa and have a high value for farmers in this region, it remains difficult to obtain a large number of genotyped and comprehensively phenotyped animals due to the smallholder sheep farming systems in Egypt [20]. Improving growth traits in sheep using genetics is promising and is being implemented in different sheep populations but would further benefit from an understanding of the underlying biological processes and functions. The aim of the current study was to gain insight into diversified genomic regions for growth traits in the Barki sheep breed and to derive potential candidate genes that are functionally related to the traits of interest.

2. Materials and Methods

2.1. Animals and Phenotypes

In this study, a population of 140 lambs (55 males and 85 females) from single births of the Egyptian Barki sheep was considered for investigation of the genomic regions and candidate genes for growth traits comprising birth weight and weaning weight. Animals were raised in the farms of the Desert Research Centre (DRC), Ministry of Agriculture, Egypt. They were kept under an intensive breeding system in semi-open yards. The lambs were from one breeding season and were offspring of 10 rams. Birth weight within 12 h after parturition and weaning weight after a lactation period of 3 months (90 days) were recorded for every lamb using an electronic scale. From birth to weaning age, the lambs were suckled only on their mother’s milk daily. Fresh water was offered two times daily to lambs ad libitum. The experiment was conducted in accordance with all ethics and animal rights (DRC), considering all regulations in conformity with the European Union Directive for the protection of experimental animals (2010/63/EU).

2.2. Genotyping and Quality Control

For each lamb, blood was sampled from the jugular vein in EDTA-containing tubes and stored at −80 °C until DNA extraction. DNA extraction was performed according to the manufacturer’s instructions with the G-spin Total DNA Extraction kit (iNtRON Biotechnology, Seoul, Korea). Out of the entire population of 140 animals, 69 lambs with considerable differences in the respective growth trait were genotyped using the Illumina OvineSNP50 V2 BeadChip (Illumina, San Diego, CA, USA). The relative identity-by-descent (IBD) was calculated for all pairs of lambs. The genetic relatedness average was 0.15. The iScan Reader (Illumina) was used to image the raw signal intensities of the 53,516 SNPs on the chip, which were subsequently converted into genotypes with the GenomeStudio software (version 2.0). The samples with call rates < 90% were removed from further analysis. The SNPs with genotype call rates < 98%, minor allele frequencies (MAF) < 0.05, in high linkage disequilibrium (r2 > 0.5) within windows of 50 SNPs, and significant deviation from Hardy–Weinberg equilibrium at p < 10−6 were removed from the analysis. JMP Genomics software (version 9) was used for quality control. A total of 63 animals and 40,383 SNPs remained and passed the quality control. Base pair positions and names of SNP markers were updated to the latest version of the ovine genome (Oar_v3.1 accessed on 6 July 2020). SNPs not located on autosomes and lacking reference SNP (rs) identifiers were excluded. Based on the SNP data, the genomic relationship matrix of lambs was calculated using SNPRelate R package (version 1.24.0) and visualized in a principal component plot (Supplementary Materials Figure S1).

2.3. FST Analysis and Screening for Candidate Genes

For each of the traits, birth weight and weaning weight, the genotyped animals were divided into two subgroups, each representing the extreme phenotypes for the respective trait with significant differences between the groups (Figure 1). The Student’s t-test was used to compute the differences between the means of high and low groups. The fixation index (FST) for each SNP was calculated between the groups low birth weight (LBW)—high birth weight (HBW) and low weaning weight (LWW)—high weaning weight (HWW) by the SNPRelate R package (version 1.24.0) using the Weir and Cockerham method [21,22]. FST values were Z-transformed using the following equation Z(FST) = (FST − μ FST)/ϭ FST, where μ FST is the overall mean of FST values and ϭ FST is the standard deviation of FST values. In addition, an SNP-specific baseline FST estimate was calculated to evaluate the results of the FST analysis. This estimation was based on a random permutation of the group assignment with 10,000 iterations. Subsequently, the distribution of SNP-specific FST values was used to calculate permutation-based p-values for the intended group comparisons (LBW–HBW and LWW–HWW) using the statmod R package [23]. Using the genomic inflation factor lambda (λBW = 1.19, λWW = 1.72), genomic control corrections were made and permutation p-values were adjusted. Only the SNPs having the top 0.05% of Z(FST) values were selected for further analysis. Manhattan plots of Z(FST) value for each SNP were constructed using qqman package (version 0.1.4) in R software. To identify the candidate genes, the Ensembl database was used to select the genes within 2 Mb windows around high Z(FST) SNPs [24]. Genes harboring a highlighted Z(FST) SNP were considered as positional candidate genes. Functional candidate genes in the respective genomic region were identified according to their functional relation with the phenotypes, employing available gene annotations from the GeneCards (http://www.genecards.org; accessed on 19 May 2021) and Uniprot (http://www.uniprot.org; accessed on 19 May 2021) databases. Kyoto Encyclopedia of Genes and Genomes (KEGG, https://www.kegg.jp/; accessed on 23 July 2021) pathway enrichment analysis of the functional, positional, and closest up- and downstream-located genes based on SNPs that exceeded the threshold was performed using ClueGO plugin with the Cytoscape software (version 3.6.1) [25,26].

2.4. Marker–Trait Association Analysis

The association analysis was carried out to test the effect of the genotypes of the selected SNPs on the phenotypes of birth and weaning weight by JMP Genomics software (version 9) using the QK mixed model procedure considering the genomic relationship matrix. In addition, the statistical model included the sex of lamb as fixed effect (two levels). p ≤ 0.05 was considered significant, p ≤ 0.01 highly significant, and p > 0.05 not significant.

3. Results

3.1. Phenotypic Data of Growth Traits

Descriptive statistics of birth weight and weaning weight of Barki lambs with divergent performance in the respective trait are shown in Table 1.

3.2. Detection of Genomic Regions and Candidate Genes

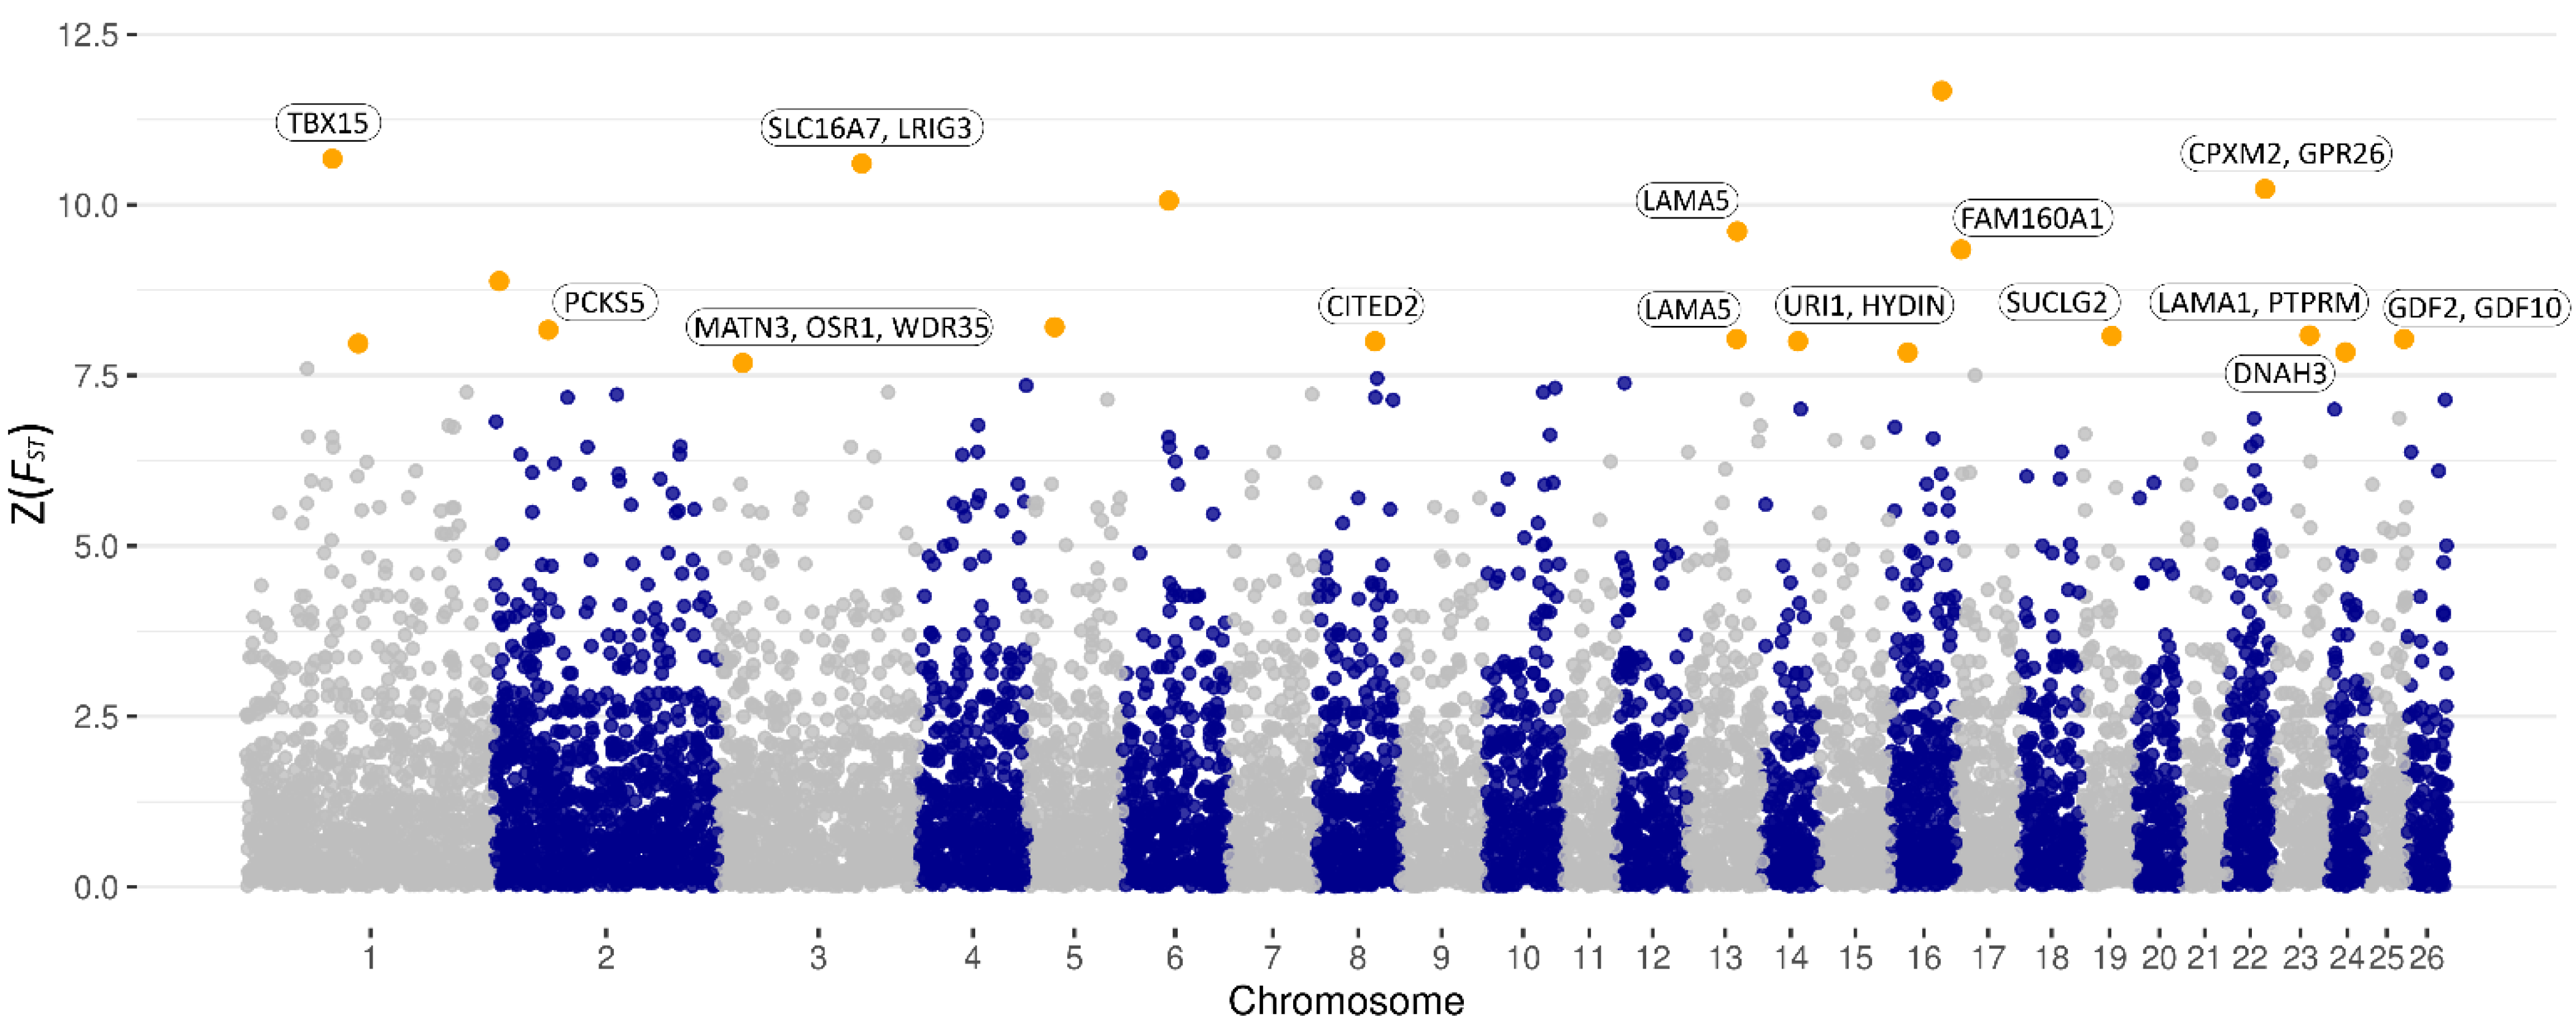
For the detection of genomic regions and candidate genes of growth traits, subgroups with distinct differences in the respective traits were analyzed. In particular, Z(FST) values were calculated to explore genomic differences between groups using genome-wide distributed SNPs. Figure 2 shows a Manhattan plot of SNP-specific Z(FST) values for birth weight and highlighted genomic regions and SNPs with the highest Z(FST) values. Obtained SNPs and regions were distributed on chromosomes 1, 2, 3, 5, 6, 8, 13, 14, 16, 17, 19, 22, 23, 24, and 25 (cutoff Z(FST) ≥ 7.68, Table 2). Genomic regions highlighted by the selected SNPs were mined for positional and functional candidate genes (Table 2). This analysis yielded eight positional candidate genes comprising PCKS5, WDR35, LAMA5, HYDIN, FAM160A1, GPR26, PTPRM, and DNAH3. Moreover, a total of 13 functional candidate genes in the indicated genomic regions were identified, which are known to affect birth weight or are involved in the development process during the embryonic stage and after birth. These comprise TBX15, SLC16A7, LRIG3, MATN3, OSR1, CITED2, LAMA5, URI1, SUCLG2, CPXM2, LAMA1, GDF2, and GDF10. Among the vital processes to which these genes contribute is the development of body organs, such as limbs, liver, lungs, brain, skeletal system, and muscles. Except for the SNPs indicating the genomic regions harboring BRINP1, CITED2, CPXM2, GDF2, and GDF10, the marker–trait association analysis confirmed a significant relationship of the candidate loci with birth weight in the Barki lamb population (Table 2, Supplementary Materials Table S1).
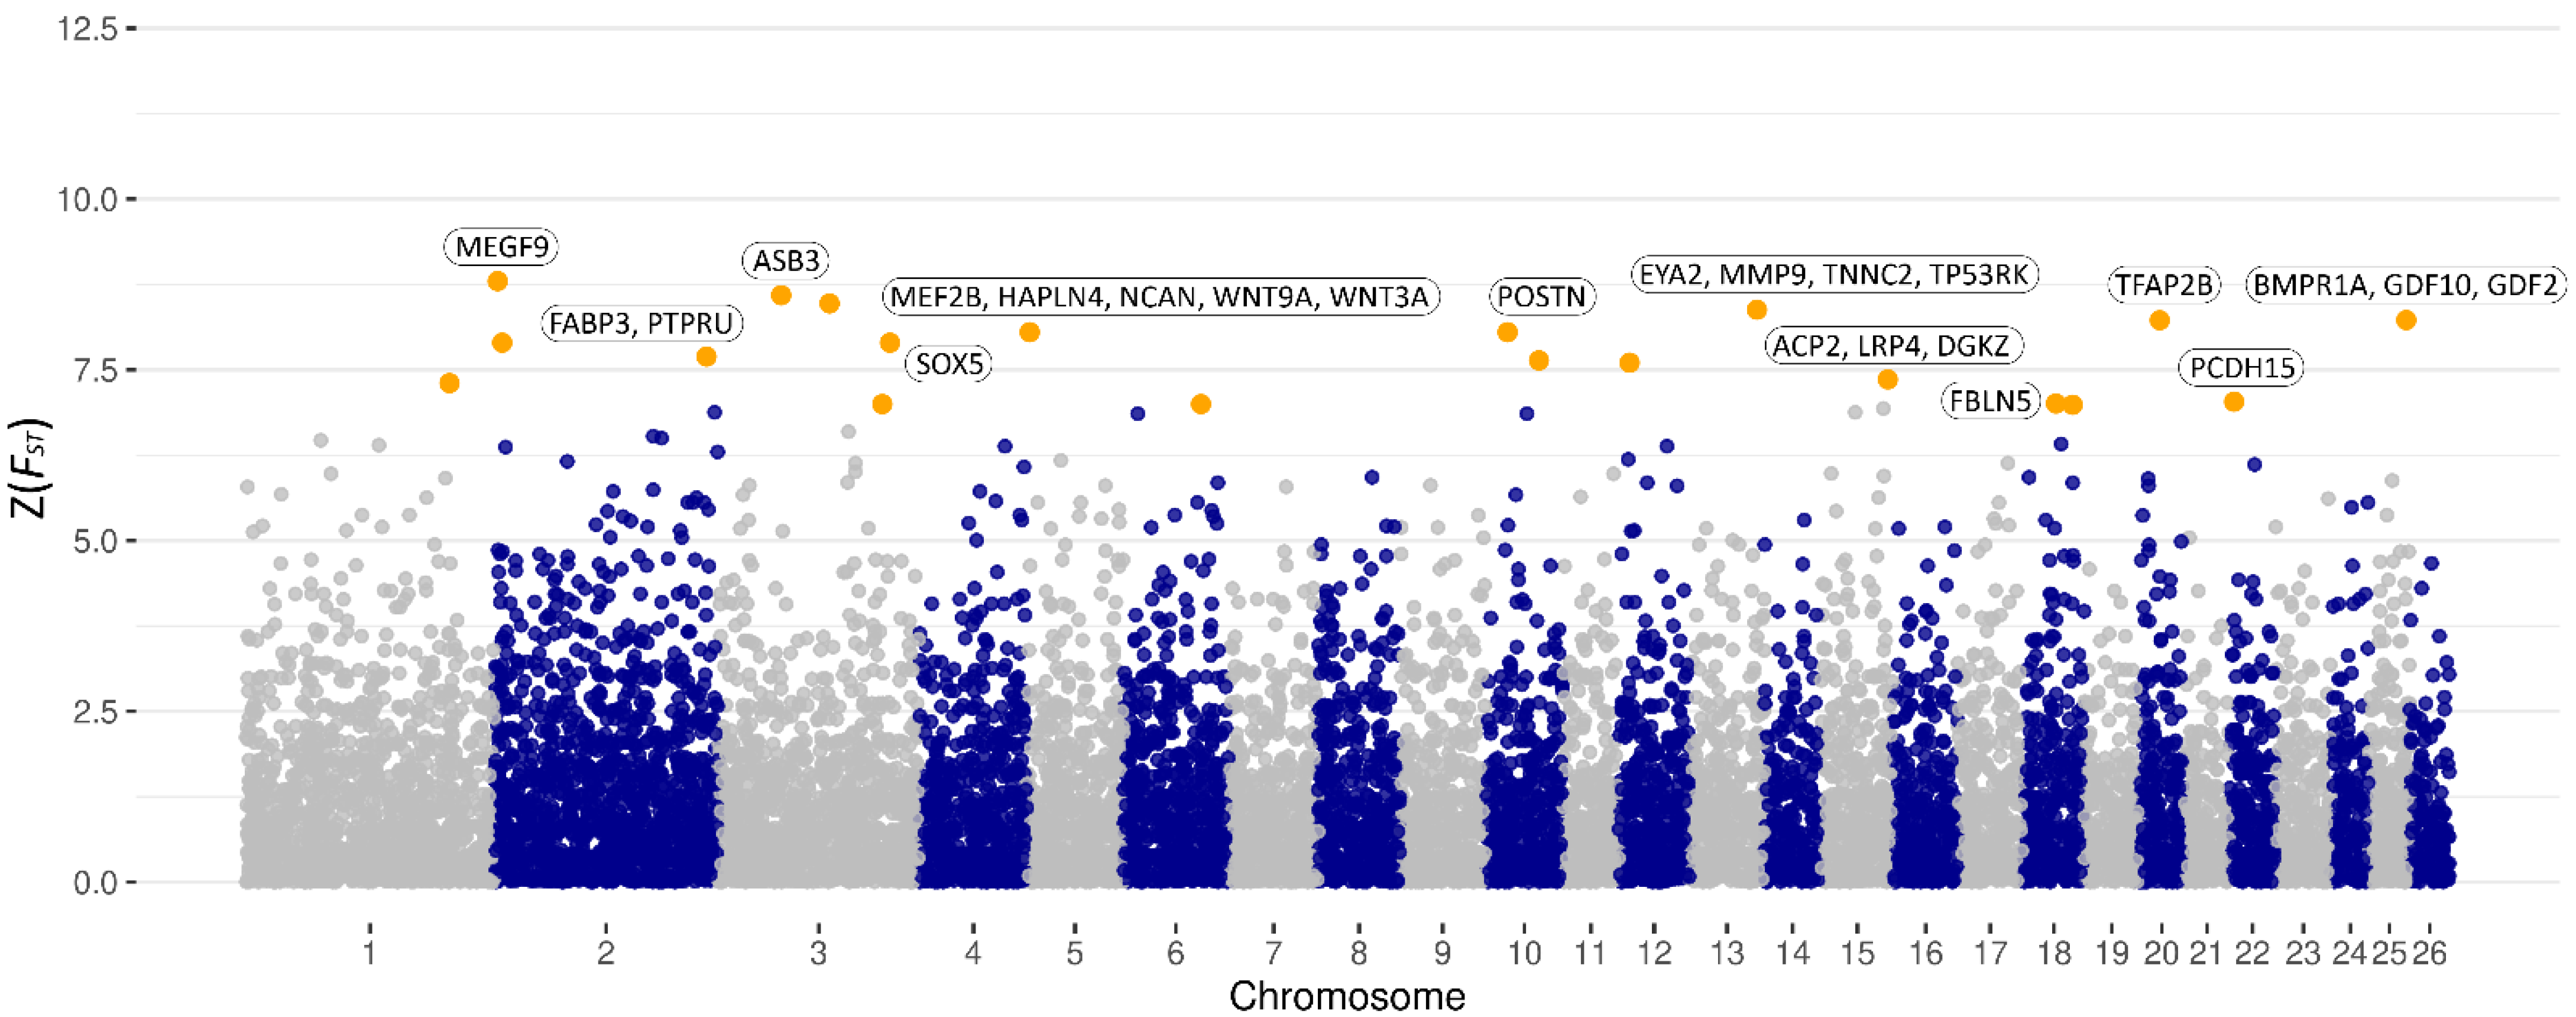
For weaning weight, 20 SNPs, which reached the threshold Z(FST) value at 99.95% of the percentile distribution, were identified (cutoff Z(FST) ≥ 6.99, Table 3). These SNPs indicated 13 genomic regions distributed on chromosomes 1, 2, 3, 5, 6, 10, 12, 13, 15, 18, 20, 22, and 25, as illustrated in Figure 3. Considering these regions, seven positional candidate genes, directly tagged by one of the identified SNPs, were detected. These genes are ASB3, SOX5, TP53RK, DGKZ, FBLN5, PCDH15, and GLUD1. Moreover, 19 functional candidate genes were identified in the respective genomic regions for weaning weight including MEGF9, PTPRU, FABP3, MEF2B, HAPLN4, NCAN, WNT9A, WNT3A, POSTN, EYA2, MMP9, TNNC2, ACP2, LRP4, FBLN5, TFAP2B, BMPR1A, GDF2, and GDF10. Considering the SNPs indicative for these candidate genes, most of the SNPs appeared to be significantly associated with weaning weight (Table 3, Supplementary Materials Table S2). Considering all SNPs that exceeded the threshold for birth and weaning weights, results of the enrichment analysis of the functional, positional, and closest up- and downstream located genes within 2 Mb are presented (Supplementary Materials Figure S2).

4. Discussion

In this study, we used the Ovine SNP50 V2 BeadChip to identify the genomic differences between groups of Barki sheep that differed significantly in growth traits (birth and weaning weight). The average birth weight of Barki lambs was similar to those of lambs of the native Egyptian breeds, such as Rahmani and Ossimi breeds, with 3.73 and 3.9 kg. However, in terms of weaning weight, Rahmani and Ossimi lambs are slightly heavier than Barki lambs with average weights of 17.63 and 14.05 kg, respectively [27,28]. Moreover, birth weight (5.08 kg) and weaning weight (29.8 kg) of Romney lambs, as one of the worldwide economically important meat-type breeds, were reported to be higher than the weights of Barki sheep [29]. In order to elucidate genetic contributions, genetic differentiations between the subgroups were investigated by the calculation of SNP-specific Z(FST) values. Considering birth weight and weaning weight, identified genomic regions on chromosomes 2, 3, 5, 15, 16, 18, 22, 24, and 25 were previously proposed in the sheep QTL database to be associated with some growth traits such as body weight at different ages of lambs and average daily gain [30]. A total of 15 genomic regions were found to exhibit divergent allele frequencies for birth weight in Barki lambs. Regions on chromosomes 1, 3, and 16 are proposed to be the most promising regions, since they enclose four SNPs with the highest Z(FST) values. Within the genomic region on chromosome 1 at 95.3 Mb, T-box 15 (Tbx15) appears to be the most promising functional candidate gene. Tbx15 gene is a member of T-box gene family, which encodes for transcription factors. T-box genes play a critical role in the development of different tissues and organs in vertebrates and invertebrates, such as the skeletal system during the embryonic stage [31]. The expression of Tbx15 was reported in the development of forelimb and hind limb buds in chick and mouse [32,33]. Within chromosome 3, the solute carrier family 16 member 7 (SLC16A7) gene at 159.6 Mb and the leucine-rich repeats and immunoglobulin-like domains protein 3 (LRIG3) gene at 160.4 Mb were proposed as additional promising candidates for birth weight. SLC16A7 was reported to have a role in skeletal muscle as a lactate cotransporter [34]. LRIG3 is known to be involved in placenta and embryonic development in pigs [35]. Moreover, the carboxypeptidase-like protein X2 encoding gene (CPXM2) located on chromosome 22 at 42.4 Mb plays an important role in growth processes. It was reported to be one of the genes that regulate backfat thickness at different life stages in pigs [36].
Within the genomic region on chromosome 5 at 3.1 Mb, the myocyte enhancer factor-2B (MEF2B) gene was proposed as a functional gene for weaning weight. This gene encodes a member of the myocyte enhancer factor-2 family (MEF2A, MEF2B, MEF2C, and MEF2D), which plays an important and critical role in cell development, embryonic development, muscle tissue growth, and development processes [37,38]. Polymorphism in the 3′-UTR of the MEF2B gene showed a significant correlation with some growth traits in New Ujumqin Sheep such as body weight and chest girth at 4 and 6 months [39]. Previous studies revealed a significant association between MEF2B and skeletal muscle satellite cell and reproductive traits in pigs [40] as well as diameter of muscle fibers in goats [41]. The SNP indicating the MEF2B region was found to be significantly associated with weaning weight. Within chromosome 13, the eyes absent homolog 2 (EYA2) and the fast skeletal muscle troponin C (TNNC2) genes were revealed as candidates for weaning weight. In Ethiopian sheep, EYA2 was proposed as a candidate for embryonic development of tendons, bones, and cartilages [42]. TNNC2 plays a critical role in skeletal muscle contraction, modulates the Ca2+-activation characteristics of muscle fibers [43], and is highly expressed during the myoblast differentiation and skeletal muscle development [44]. Previous studies on TNNC2 reported a significant association with growth traits in porcine skeletal muscles [45] and with carcass weight and marbling score in three native sheep breeds [46].
Within the region on chromosome 20 at 23.4 Mb, the transcription factor AP-2B (TFAP2B) gene was proposed as a functional candidate for weaning weight. TFAP2B was documented in vertebrates and invertebrates and has a critical role during embryonic development [47]. The function of TFAP2B in the development of craniofacial structures, limb formation, and kidney and skin development was reported in mice [48].
Based on the indicated genomic regions of birth weight and weaning weight, some functional candidate genes were proposed such as growth differentiation factors 2 and 10 genes (GDF2, GDF10) on chromosome 25. GDF2 and GDF10 are members of the transforming growth factor-β (TGF- β) superfamily and the bone morphogenetic protein family (BMP), also known as bone morphogenetic protein 9 and 3B (BMP9, BMP3B) [49]. Previous studies reported a significant correlation between GDF2 and GDF10 genes and weaning weight in New Zealand dual-purpose sheep [50]. GDF10 regulates cell growth and differentiation in embryonic and adult tissues. Genetic polymorphism in the bovine GDF10 gene showed a significant effect on some body measurements in Chinese indigenous cattle [51]. Results of the marker–trait association analysis confirmed the significant effect of the majority of selected SNPs on both birth weight and weaning weight and reflected the contribution of these SNPs to the phenotypic differences between high and low groups of these traits. Results of the enrichment analysis revealed the contribution of the selected genes in some physiological pathways related to growth performance such as animal organ formation, regulation of embryonic development, and skeletal muscle development, which confirm the critical role of these genes in growth processes. However, the robustness of association analysis is a matter of sample size [52]; the results of this study require validation in an independent population and with a larger sample size.

5. Conclusions

The genome-wide SNPs analysis revealed a number of genomic regions containing putative QTL for birth weight and weaning weight. The QTL regions cover a number of promising functional candidate genes such as CPXM2, EYA2, GDF2, GDF10, LRIG3, MEF2B, SLC16A7, TBX15, TFAP2B, and TNNC2, which deserve further investigation, due to their relation to biological processes, including metabolism, body growth, organ morphogenesis, skeletal muscle development, and cell proliferation and differentiation. Moreover, the marker–trait association analysis revealed a significant relationship of the considered SNPs to the studied traits. Our findings provide valuable information for a better understanding of the genetics of early growth-related traits and might contribute to the improvement of these traits in the Barki sheep breed.

Supplementary Materials

The following tables are available online at www.mdpi.com/article/10.3390/genes12081243/s1. Table S1: Association of selected SNP genotypes with birth weight in Egyptian Barki lambs (Mean ± SE); Table S2: Association of selected SNP genotypes with weaning weight in Egyptian Barki lambs (Mean ± SE); Figure S1: Principal component plot of the genomic relationship of animals displaying the classification into high and low groups for birth weight (frame color) and weaning weight (fill color); Figure S2: KEGG pathway enrichment analysis of the functional, positional, and closest up- and downstream located genes within a 2 Mb window.

Author Contributions

Conceptualization, I.M. and K.W.; methodology, I.A., H.R. and E.M.; formal analysis, I.A., H.R. and M.O.; resources, I.M. and K.W.; data curation, I.A. and H.R.; writing—original draft preparation, I.A.; writing—review and editing, all authors; supervision, H.R. and K.W.; funding acquisition, I.M. and K.W. All authors have read and agreed to the published version of the manuscript.

Funding

This work was supported by a grant to I.A. from the Sector for Missions and Cultural Affairs, Ministry of Higher Education, Egypt, and co-financed by the Leibniz Institute for Farm Animal Biology (FBN), Germany.

Institutional Review Board Statement

All animal handling procedures and samples collection were conducted with the approval of the Department of Animal Health (DRC) Committee, did not require an animal experimentation permit according to the regulations of the Desert Research Center (DCR) Ethics Board, and complied in their implementation with the European Union Directive on the Protection of the Experimental Animals (2010/63/EU).

Data Availability Statement

Genotypic and phenotypic information has been deposited at Open Science Framework (https://osf.io/qj29r/; accessed on 19 November 2020).

Acknowledgments

The authors thank Angela Garve for her excellent technical help.

Conflicts of Interest

The authors declare no conflict of interest.

References

  1. Smith, J.M.; Haigh, J. The hitch-hiking effect of a favourable gene. Genet. Res. 2007, 89, 391–403. [Google Scholar] [CrossRef] [Green Version]
  2. Kijas, J.W.; Lenstra, J.; Hayes, B.; Dalrymple, B. Genome-wide analysis of the world’s sheep breeds reveals high levels of historic mixture and strong recent selection. PLoS Biol. 2012, 10, e1001258. [Google Scholar] [CrossRef] [Green Version]
  3. Purfield, D.C.; McParland, S.; Wall, E.; Berry, D. The distribution of runs of homozygosity and selection signatures in six commercial meat sheep breeds. PLoS ONE 2017, 12, e0176780. [Google Scholar] [CrossRef] [Green Version]
  4. Rochus, C.M.; Tortereau, F.; Plisson-Petit, F.; Servin, B. Revealing the selection history of adaptive loci using genome-wide scans for selection: An example from domestic sheep. BMC Genom. 2018, 19, 71. [Google Scholar] [CrossRef] [Green Version]
  5. Ghasemi, M.; Zamani, P.; Vatankhah, M.; Abdoli, R. Genome-wide association study of birth weight in sheep. Animal 2019, 13, 1797–1803. [Google Scholar] [CrossRef] [PubMed]
  6. Yurchenko, A.A.; Deniskova, T.; Yudin, N.; Reyer, H.; Wimmers, K.; Larkin, D. High-density genotyping reveals signatures of selection related to acclimation and economically important traits in 15 local sheep breeds from Russia. BMC Genom. 2019, 20, 294. [Google Scholar] [CrossRef] [PubMed]
  7. Zhao, F.; McParland, S.; Du, L.; Berry, D. Detection of selection signatures in dairy and beef cattle using high-density genomic information. Genet. Sel. Evol. 2015, 47, 49. [Google Scholar] [CrossRef] [PubMed] [Green Version]
  8. El-Halawany, N.; Zhou, X.; Al-Tohamy, A.; El-Sayd, Y.; Shawky, A.; Michal, J.; Jiang, Z. Genome-wide screening of candidate genes for improving fertility in Egyptian native Rahmani sheep. Anim. Genet. 2016, 47, 513. [Google Scholar] [CrossRef]
  9. Burren, A.; Neuditschko, M.; Signer-Hasaler, H.; Flury, C. Genetic diversity analyses reveal first insights into breed-specific selection signatures within Swiss goat breeds. Anim. Genet. 2016, 47, 727–739. [Google Scholar] [CrossRef]
  10. Kim, E.S.; Elbeltagy, A.; Aboul-Naga, A.; Rothschild, M. Multiple genomic signatures of selection in goats and sheep indigenous to a hot arid environment. Heredity 2016, 116, 255–264. [Google Scholar] [CrossRef]
  11. McRae, K.M.; McEwan, J.; Dodds, K.; Gemmell, N. Signatures of selection in sheep bred for resistance or susceptibility to gastrointestinal nematodes. BMC Genom. 2014, 15, 637. [Google Scholar] [CrossRef] [Green Version]
  12. Shrestha, J.N.B.; Vesely, J.A.; Chesnais, J.P. Genetic and phenotypic parameters for daily gain and body weights in Suffolk lambs. Can.J. Anim. Sci. 1985, 65, 575–582. [Google Scholar] [CrossRef]
  13. Fitzmaurice, S.; Conington, J.; McHugh, N.; Banos, G. Towards future genetic evaluations for live weight and carcass composition traits in UK sheep. Small Rumin. Res. 2021, 196, 106327. [Google Scholar] [CrossRef]
  14. Harvey, C.F.; Larry, A.K.; Richard, M.T.; Warren, M.S. Heritability and genetic correlations of feed intake, body weight gain, residual gain, and residual feed intake of beef cattle as heifers and cows. J. Anim. Sci. 2020, 98, skz394. [Google Scholar] [CrossRef]
  15. Wei, C.H.L.; Liu, C.S. Encyclopedia of Modern Sheep Production Technology; Agriculture Press: Beijing, China, 2014; pp. 70–77. [Google Scholar]
  16. Ptáček, M.; Ducháček, J.; Stádník, L.; Hakl, J.; Fantová, M. Analysis of multivariate relations among birth weight, survivability traits, growth performance, and some important factors in Suffolk lambs. Arch. Anim. Breed. 2017, 60, 43–50. [Google Scholar] [CrossRef] [Green Version]
  17. Zamani, P.; Mohammadi, H. Comparison of different models for estimation of genetic parameters of early growth traits in the Mehraban sheep. J. Anim. Breed. Genet. 2008, 125, 29–34. [Google Scholar] [CrossRef] [PubMed]
  18. Sallam, A.M.; Ibrahim, A.H.; Alsheikh, S.M. Estimation of genetic parameters and variance components of pre-weaning growth traits in Barki lambs. Small Rumin. Res. 2019, 173, 94–100. [Google Scholar] [CrossRef]
  19. Abousoliman, I.; Reyer, H.; Oster, M.; Murani, E.; Wimmers, K. Analysis of candidate genes for growth and milk performance traits in the Egyptian Barki sheep. Animals 2020, 10, 197. [Google Scholar] [CrossRef] [PubMed] [Green Version]
  20. Sallam, A.M. A missense mutation in the coding region of the toll-like receptor 4 (TLR4) gene affects milk traits in Barki sheep. Anim. Biosci. 2021, 34, 489–498. [Google Scholar] [CrossRef]
  21. Weir, B.S.; Cockerham, C.C. Estimating f-statistics for the analysis of population structure. Evolution 1984, 38, 1358–1370. [Google Scholar] [CrossRef]
  22. Zheng, X.; Levine, D.; Shen, J.; Laurie, C.; Weir, B. A high-performance computing toolset for relatedness and principal component analysis of SNP data. Bioinformatics 2012, 28, 3326–3328. [Google Scholar] [CrossRef] [Green Version]
  23. Phipson, B.; Smyth, G.K. Permutation p-values should never be zero: Calculating exact p-values when permutations are randomly drawn. Stat. Appl. Genet. Mol. Biol. 2010, 9, 39. [Google Scholar] [CrossRef]
  24. De Las Heras-Saldana, S.; Clark, S.A.; Duijvesteijn, N.; Gondro, C.; van der Werf, J.H.J.; Chen, Y. Combining information from genome-wide association and multi-tissue gene expression studies to elucidate factors underlying genetic variation for residual feed intake in Australian Angus cattle. BMC Genom. 2019, 20, 939. [Google Scholar] [CrossRef] [PubMed] [Green Version]
  25. Shannon, P.; Markiel, A.; Ozier, O.; Baliga, N.S.; Wang, J.T.; Ramage, D.; Amin, N.; Schwikowski, B.; Ideker, T. Cytoscape: A software environment for integrated models of biomolecular interaction networks. Genome Res. 2003, 13, 2498–2504. [Google Scholar] [CrossRef]
  26. Bindea, G.; Mlecnik, B.; Hackl, H.; Galon, J. ClueGO: A Cytoscape plug-in to decipher functionally grouped gene ontology and pathway annotation networks. Bioinformatics 2009, 25, 1091–1093. [Google Scholar] [CrossRef] [Green Version]
  27. Marai, I.F.M.; Daader, A.H.; Bahgat, L.B. Performance traits of purebred Ossimi and Rahmani lambs and their crosses with Finnsheep born under two accelerated mating systems. Arch. Anim. Breed. 2009, 52, 497–511. [Google Scholar] [CrossRef] [Green Version]
  28. Abd-Allah, M.; Abass, S.; Allam, F. Reproductive performance of Rahmani and Chios sheep and their lambs under Upper Egypt conditions. Online J. Anim. Feed Sci. 2011, 1, 121–129. [Google Scholar]
  29. Thomson, B.C.; Muir, P.D.; Smith, N.B. Litter size, lamb survival, birth and twelve week weight in lambs born to cross-bred ewes. J. N. Z. Grassl. 2004, 66, 233–237. [Google Scholar] [CrossRef]
  30. Animal QTL Database—Animal Genome Databases. Available online: https://www.animalgenome.org/cgi-bin/QTLdb/OA/ontrait?trait_ID=3228 (accessed on 29 July 2021).
  31. Papaioannou, V.E. T-box genes in development: From hydra to humans. Int. Rev. Cytol. 2001, 207, 1–70. [Google Scholar] [CrossRef] [PubMed]
  32. Gibson-Brown, J.J.; Agulnik, S.; Chapman, D.; Garvey, N.; Papaioannou, V. Evidence of a role for T-box genes in the evolution of limb morphogenesis and the specification of forelimb/hindlimb identity. Mech. Dev. 1996, 56, 93–101. [Google Scholar] [CrossRef]
  33. Candille, S.I.; Chen, C.; Russ, A.; Barsh, G. Dorsoventral Patterning of the Mouse Coat by Tbx15. PLoS Biol. 2004, 2, e3. [Google Scholar] [CrossRef] [PubMed]
  34. Carraro, L.; Ferrarasso, S.; Cardazzo, B.; Bargelloni, L. Expression profiling of skeletal muscle in young bulls treated with steroidal growth promoters. Physiol. Genom. 2009, 38, 138–148. [Google Scholar] [CrossRef] [PubMed] [Green Version]
  35. Metodiev, S.; Young, J.; Onteru, S.; Rothschild, M.; Dekkers, J. A whole-genome association study for litter size and litter weight traits in pigs. Livest Sci. 2018, 211, 87–97. [Google Scholar] [CrossRef]
  36. Pérez-Montarelo, D.; Madsen, O.; Alves, E.; Fernandez, A. Identification of genes regulating growth and fatness traits in pig through hypothalamic transcriptome analysis. Physiol. Genom. 2014, 46, 195–206. [Google Scholar] [CrossRef] [Green Version]
  37. Firulli, A.B.; Miano, J.; Bi, W.; Johnson, A.; Schwarz, J. Myocyte enhancer binding factor-2 expression and activity in vascular smooth muscle cells. Association with the activated phenotype. Circ. Res. 1996, 78, 196–204. [Google Scholar] [CrossRef]
  38. Iida, K.; Hidaka, K.; Takeuchi, M.; Yutani, C.; Morisaki, T. Expression of MEF2 genes during human cardiac development. Tohoku J. Exp. Med. 1999, 187, 15–23. [Google Scholar] [CrossRef] [Green Version]
  39. Zhang, L.; Ma, X.; Xuan, J.; Wang, H.; Wu, M.; Du, L. Identification of MEF2B and TRHDE gene polymorphisms related to growth traits in a new Ujumqin sheep population. PLoS ONE 2016, 11, e0159504. [Google Scholar] [CrossRef] [Green Version]
  40. HE Bo, Z.R.; Yuanzhu, X.; Hu, C. Culture, Identification and biological characteristics of skeletal muscle satellite cells of the Neonatal pig. Acta Vet. Zootech. Sin. 2006, 6, 555–559. [Google Scholar]
  41. Chen, L.; Cheng, B.; Li, L.; Zhan, S.; Zhong, T.; Chen, Y.; Zhang, H. The molecular characterization and temporal-spatial expression of myocyte enhancer factor 2 genes in the goat and their association with myofiber traits. Gene 2015, 555, 223–230. [Google Scholar] [CrossRef]
  42. Ahbara, A.; Bahbahani, H.; Almathen, F.; Agoub, M.; Mwacharo, J. Genome-wide variation, candidate regions and genes associated with fat deposition and tail morphology in Ethiopian indigenous sheep. Front. Genet. 2019, 9, 1–21. [Google Scholar] [CrossRef]
  43. Farah, C.S.; Reinach, F.C. The troponin complex and regulation of muscle contraction. FASEB J. 1995, 9, 755–767. [Google Scholar] [CrossRef]
  44. Bucher, E.A.; Maisonpierre, P.; Konieczny, S.; Emerson, C. Expression of the troponin complex genes: Transcriptional coactivation during myoblast differentiation and independent control in heart and skeletal muscles. Mol. Cell. Biol. 1988, 8, 4134–4142. [Google Scholar] [CrossRef] [PubMed] [Green Version]
  45. Li, Y.; Chen, Y.; Li, J.; Wang, C.; Liu, X.; Ling, F.; Zhong, W. Molecular characterization, expression profile and polymorphisms of the porcine TNNC2 gene. Hereditas 2008, 145, 274–282. [Google Scholar] [CrossRef] [PubMed]
  46. Xu, Q.; Kang, K.; Yan, F.; An, J.; Chen, Y. Characterization of the fast skeletal troponin C (TNNC2) gene in three Chinese native sheep breeds. Arch. Anim. Breed. 2008, 51, 572–581. [Google Scholar] [CrossRef] [Green Version]
  47. Zhao, F.; Satoda, M.; Licht, J.; Hayashizaki, Y.; Gelb, B. Cloning and characterization of a novel mouse AP-2 transcription factor, AP-2delta, with unique DNA binding and transactivation properties. J. Biol. Chem. 2001, 276, 40755–40760. [Google Scholar] [CrossRef] [Green Version]
  48. Moser, M.; Pscherer, A.; Roth, C.; Becker, J.; Fassler, R. Enhanced apoptotic cell death of renal epithelial cells in mice lacking transcription factor AP-2beta. Genes Dev. 1997, 11, 1938–1948. [Google Scholar] [CrossRef] [Green Version]
  49. Tian-Ke, L.; Chun-Nian, L.; Xia, L.; Jie, P.; Xiao-Yun, W.; Min, C.; Wen, Q.; Ping, Y. GDF-10 Gene Polymorphism and Its Association with Production Traits in Gannan Yak. Sci. Agric. Sin. 2014, 47, 161–169. [Google Scholar] [CrossRef]
  50. Pickering, N.K. Genetics of Flystrike, Dagginess and Associated Traits in New Zealand Dual-Purpose Sheep. Ph.D. Thesis, Massey University, Palmerston North, New Zealand, 2013. [Google Scholar]
  51. Adoligbe, C.; Zan, L.; Farougou, S.; Wang, H.; Ujjan, J. Bovine GDF10 gene polymorphism analysis and its association with body measurement traits in Chinese indigenous cattle. Mol. Biol. Rep. 2012, 39, 4067–4075. [Google Scholar] [CrossRef] [Green Version]
  52. Hong, E.P.; Park, J.W. Sample Size and Statistical Power Calculation in Genetic Association Studies. Genom. Inform. 2012, 10, 117–122. [Google Scholar] [CrossRef] [PubMed]
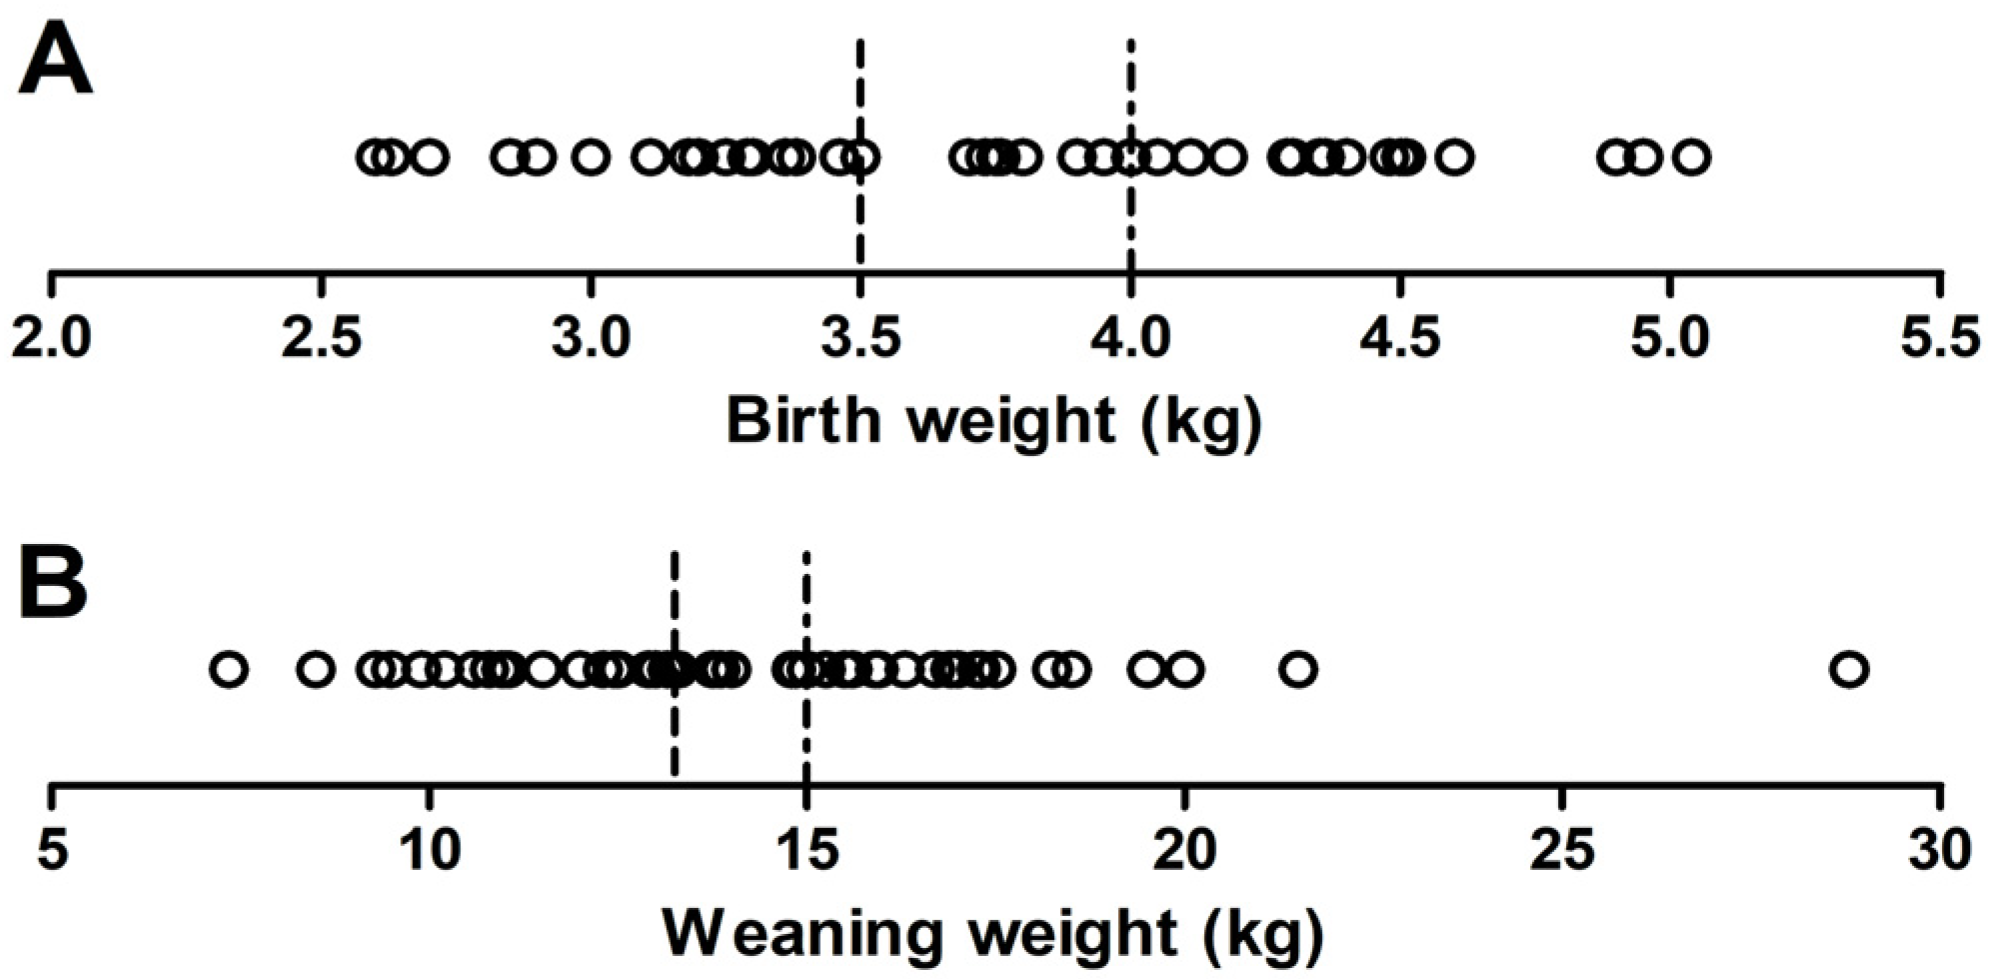
Figure 1. Distribution of lambs according to their birth weight (A) and weaning weight (B). The dashed lines indicate the thresholds for classification of animals into low and high groups.
Genes 12 01243 g001
Figure 2. Manhattan plot of the Z(FST) values for each single nucleotide polymorphism (SNP) between Barki sheep groups divergent in birth weight (LBW–HBW). Orange dots represent SNPs that passed the cutoff threshold at 99.95% of the percentile distribution (Z(FST) ≥ 7.68).
Genes 12 01243 g002
Figure 3. Manhattan plot of the Z(FST) values for each single nucleotide polymorphism (SNP) of weaning weight. Orange dots represent SNPs that passed the cutoff threshold at 99.95% of the percentile distribution (Z(FST) ≥ 6.99).
Genes 12 01243 g003
Table 1. Descriptive statistics of lamb growth traits.
TraitAbbreviationGroup *NMeanSDMinMaxp-Value **
Birth weight (kg)BWHBW314.30.34.05.0p < 0.001
LBW243.20.32.63.5
Weaning weight (kg)WWHWW2818.12.515.028.8p < 0.001
LWW2311.21.77.413.3
* HBW = High birth weight, LBW = Low birth weight, HWW = High weaning weight, LWW = Low weaning weight. ** = p-value computed using t-test, SD = Standard deviation.
Table 2. Genomic positions of SNPs that exceeded the cutoff threshold (Z(FST) ≥ 7.68) for divergence in birth weight and adjacent candidate genes within a 2 Mb window.
Rs IdentifierChrPositionMAFZ(FST)Permutation
p Value 1
Association
p Value 2
Candidate Genes 3
rs4266521021953693970.33510.680.00060.004TBX15, SPAG17
rs40972705711241171180.2207.970.0010.003CLDN17, GRIK1
rs423222301254723260.3018.880.00060.015BRINP1, TLR4
rs4195140912600441100.3698.170.00060.116PCKS5, RFK, ENSOARG00000012533
rs4286144653277327210.4927.680.0009<0.0001MATN3, OSR1, WDR35, TTC32
rs41706006031602523100.44610.610.00030.001SLC16A7, LRIG3
rs4135475615314775700.4818.210.0010.144PRR16, FAM170A
rs4133648716516507050.30110.060.00030.006--
rs4273853098640752590.2768.000.00060.156CITED2, U5, NMBR
rs40664997313549404150.4449.610.00030.041LAMA5, CDH28, CDH4
rs41911209513542197580.2958.030.00090.166LAMA5, RPS21, ADRM1
rs41032345914394156490.3288.000.0010.0006URI1, HYDIN, CMTR2, POP4
rs42323711516561440680.41211.670.00030.014MYO10
rs41304922816181865600.1347.840.0090.058ZSWIM6, SMIM15
rs4139669461760263790.4659.340.00060.006FAM160A1, GATB, SH3D19
rs43043090319330888130.2898.080.00060.046SUCLG2, ENSOARG00000010424
rs41771908522423230390.44410.230.00030.002CPXM2, GPR26, ACADSB
rs41278136223411772450.1278.070.00090.001LAMA1, PTPRM, RAB12
rs42120978424187483520.0867.840.00090.001DNAH3, LYRM1, TMEM159
rs42973658625419114620.3488.030.00030.064GDF2, GDF10, PTPN20
1 p-value resulting from permutation-based test of FST values and subsequent adjustment for genomic inflation; 2 p-value resulting from association analysis of the respective SNP with birth weight; 3 Gene names in bold = functional candidate genes, underlined = positional candidate genes, only italic = closest up- and downstream-located genes within a 2 Mb window, Chr = chromosome, MAF = minor allele frequency, Z(FST) = SNP-specific Z-transformed fixation index.
Table 3. Genomic positions of SNPs that exceeded the cutoff threshold (Z(FST) ≥ 6.99) for divergence in weaning weight and adjacent candidate genes within a 2 Mb window.
Rs NameChrPositionMAFZ(FST)Permutation
p-Value 1
Association
p-Value 2
Candidate Genes 3
rs40149763812260474030.2747.300.1700.002IL12A, IQCJ
rs402362274240143860.1948.800.0030.015MEGF9, CDK5RAP2, BRINP1
rs427650461289850610.2597.900.0030.018TNFSF15, TMEM268
rs40505405922360859060.3547.690.0040.177FABP3, MATN1, PTPRU
rs4205737453702273760.5008.590.0030.077ASB3, CHAC2
rs42250282331240108530.4088.470.0030.039MGAT4C, C12orf50
rs42574797831911397220.2697.900.0030.067SOX5, BCAT1, ETNK1
rs41075480531826692940.3417.000.0030.044RESF1, AMN1
rs429678680530763970.2248.100.0030.278MEF2B, HAPLN4, NCAN, WNT9A, WNT3A, PRSS38, SNAP47
rs4189265686865056750.3817.000.0040.120SLC4A4, GC
rs40188897910251156070.2198.100.0030.002POSTN, RFXAP, SERTM1
rs42849762910599745200.2637.640.0040.006SLITRK1, SLITRK6
rs42694363412122666330.4367.600.0030.009RGS18, BRINP3
rs41316942913749247470.3038.380.0030.009EYA2, MMP9, TNNC2, TP53RK, SLC13A3, SLC2A10
rs41145109615745978120.3997.360.0030.128ACP2, LRP4, DGKZ, CREB3L1, MDK
rs43068480018369365010.3227.010.0030.009NOVA1, FOXG1
rs42603656518555370480.4146.990.0030.495FBLN5, TC2N, TRIP11
rs41007956820233944980.4708.230.0030.143TFAP2B, PKHD1
rs4216909962250902230.3457.030.0030.026PCDH15, U3, SYCE1
rs40043284125412418660.4598.230.0030.039BMPR1A, GDF10, GDF2, GLUD1, U6, SHLD2
1 p-value resulting from permutation-based test of FST values and subsequent adjustment for genomic inflation; 2 p-value resulting from association analysis of the respective SNP with weaning weight; 3 Gene names in bold = functional candidate genes, underlined = positional candidate genes, only italics = closest up- and downstream-located genes within a 2 Mb window, Chr = chromosome, MAF = minor allele frequency, Z(FST) = SNP-specific Z-transformed fixation index.
Publisher’s Note: MDPI stays neutral with regard to jurisdictional claims in published maps and institutional affiliations.