Article

Comparison of Selection Signatures between Korean Native and Commercial Chickens Using 600K SNP Array Data

1
Division of Animal and Dairy Science, Chungnam National University, Daejeon 34134, Korea
2
Bio-AI Convergence Research Center, Chungnam National University, Daejeon 34134, Korea
*
Author to whom correspondence should be addressed.
Genes 2021, 12(6), 824; https://doi.org/10.3390/genes12060824
Submission received: 12 April 2021 / Revised: 18 May 2021 / Accepted: 24 May 2021 / Published: 27 May 2021
(This article belongs to the Special Issue Poultry Genetics, Breeding and Biotechnology)

Abstract

:
Korean native chickens (KNCs) comprise an indigenous chicken breed of South Korea that was restored through a government project in the 1990s. The KNC population has not been developed well and has mostly been used to maintain purebred populations in the government research institution. We investigated the genetic features of the KNC population in a selection signal study for the efficient improvement of this breed. We used 600K single nucleotide polymorphism data sampled from 191 KNCs (NG, 38; NL, 29; NR, 52; NW, 39; and NY, 33) and 54 commercial chickens (Hy-line Brown, 10; Lohmann Brown, 10; Arbor Acres, 10; Cobb, 12; and Ross, 12). Haplotype phasing was performed using EAGLE software as the initial step for the primary data analysis. Pre-processed data were analyzed to detect selection signals using the ‘rehh’ package in R software. A few common signatures of selection were identified in KNCs. Most quantitative trait locus regions identified as candidate regions were associated with traits related to reproductive organs, eggshell characteristics, immunity, and organ development. Block patterns with high linkage disequilibrium values were observed for LPP, IGF11, LMNB2, ERBB4, GABRB2, NTM, APOO, PLOA1, CNTN1, NTSR1, DEF3, CELF1, and MEF2D genes, among regions with confirmed selection signals. NL and NW lines contained a considerable number of selective sweep regions related to broilers and layers, respectively. We recommend focusing on improving the egg and meat traits of KNC NL and NW lines, respectively, while improving multiple traits for the other lines.

1. Introduction

‘Selection’ refers to a phenomenon in which genetic and phenotypic characteristics are fixed within a population. Continuous positive selection, either natural or artificial, affects allele diversity. During this process, a specific allele can be fixed in a specific population, and adjacent alleles are gradually fixed together. This results in an increase or decrease in the genotype frequencies of a particular gene and is commonly referred to as ‘selective sweep’ [1,2]. In an analysis of selection signals, traces of selective sweep are examined within genes. Therefore, the study of selection signals can be used to identify a genomic region fixed within a population undergoing selection, or to search for genes or genomic regions associated with a specific trait through comparative analysis. The genome-wide association study approach is the most representative method used to analyze the association between phenotype and genotype. However, in a genome-wide association study, information regarding phenotype measurements is necessary. The results can be affected by errors resulting from incorrect phenotype information and influenced by a biased genotype distribution. However, the analysis of selection signals is free from some limitations associated with other methods. Therefore, it is considered an appropriate analytical method for fixed unknown traits or gene-tracking studies in populations without quantitative phenotype information. There are many selection-signal analysis methods, but single allele frequencies or haplotype information have recently been used to detect selective sweep. Among the available methods, the approach based on extended haplotype homozygosity (EHH) uses haplotype and long-range linkage disequilibrium (LD) information and is reportedly able to select significant high-homozygosity regions with greater accuracy, compared with a single allele frequency approach [3,4,5].
The chicken is an important livestock species and protein source for humans. Additionally, chickens are amenable to improvement because they have a short life cycle and can produce a large offspring population, compared with other livestock animals. Commercially, improvements can be made for layer (producing eggs) or broiler (producing meat) chickens. With respect to broilers, from 1957 to 2005, their growth rate increased by more than 400%, while the feed conversion ratio (FCR) decreased by 50% [6].
The Korean native chicken (KNC) nearly became extinct because of the Korean War and industrialization, but in 1992, five pure lines were restored through a restoration project implemented by the government. These lines are categorized as follows, according to the colors of their feathers: red–brown (NR), yellow–brown (NY), grey–brown (NG), black (NL), and white (NW). Until recently, these KNC lines have been maintained for preservation purposes, and have not been improved. Additionally, there is little information available regarding the improvement of economic traits. The KNC reportedly has a lower growth rate and feed efficiency than broiler chickens [7,8]. For these reasons, the production of KNCs in Korea is only 3% of the total broiler production (Animal and Plant Quarantine Agency, 2018). Therefore, the profitability of KNC production must be improved by applying selective breeding that considers the genetic characteristics of economic traits for each chicken line. Furthermore, potential areas of improvement should be identified, such as whether the genetic characteristics of each KNC line are related to meat or egg traits. Therefore, this study was performed to identify genetic similarities and differences among the lines by comparing selection signatures of broiler and layer populations with the five KNC lines.

2. Materials and Methods

2.1. Sample Genotyping and Genetic Diversity Analysis

In total, 245 samples comprising purebred KNCs and commercial broilers and layers were analyzed in this study. The KNC group was collected from the Korean National Institute of Animal Science in 2011 and it was further divided into five lines (NG, 38; NL, 29; NR, 52; NW, 39; and NY, 33). Broilers and layers were obtained from commercial farms in 2017 and these were divided into three (Arbor Acres [Ab], 10; Cobb [CB], 12; and Ross [RS], 12) and two (Hy-line Brown (HL), 10; and Lohmann Brown (LO), 10) varieties, respectively. Genomic DNA (gDNA) was extracted from blood or tissue samples from all birds using PrimePrep™ Genomic DNA Isolation kits (GeNetBio, Daejeon, Korea). The concentration and purity of extracted gDNA were investigated using a NanoDrop spectrophotometer (Thermo Fisher Scientific, Waltham, MA, USA), and the gDNA was stored at −20 °C until use.
With these gDNA samples, data regarding 547,784 single nucleotide polymorphisms (SNPs) were obtained using a 600K Affymetrix Axiom® array (Affymetrix, Santa Clara, CA, USA). For quality control, SNPs with a minor allele frequency of ≥5% and a call rate of 90% were selected for further analysis. Eventually, 540,560 SNPs distributed across Gallus gallus chromosomes 1–28 were used in this study.
Three general diversity analyses were performed to assess the genetic diversity of the entire population. First, principal component analysis was performed using PLINK1.9 software [9]. The results were confirmed in scatter plots based on the four principal component (PC) axes with the best explanatory power according to their total loading values. Second, population admixture analysis was performed using ADMIXTURE 1.3 software [10]. The number of common ancestors (K-value) was calculated from a range of 2–15, and the result was confirmed using a bar plot. Third, a phylogenetic tree based on Nei’s genetic distance was constructed using the ‘poppr’ package in R software [11].

2.2. LD Analysis and the Detection of Regions Exhibiting Selection Signatures Based on iHS and Rsb between Populations

To detect selection signals, phasing was performed using genotype data for each chromosome in Eagle v2.4.1 software [12]. Haplotype phasing data were used to calculate the integrated haplotype homozygosity score (iHS) and extended haplotype homozygosity ratio between populations (Rsb) with the ‘rehh’ package in R software (Equation (1)) [13]. Candidate regions were determined using the sliding window method. Each window had a size of 25 kb, with an overlap of 12.5 kb. When more than four significant SNPs (p < 0.01) were included in a window, it was considered a candidate region.
E H H S s , t = 1 n s ( n s 1 ) ( k = 1 K s , t n a l l e l e 1 ( n a l l e l e 1 1 ) + k = 1 K s , t n a l l e l e 2 ( n a l l e l e 2 1 ) ) u n i H S = l n ( i H H a l l e l e 1 i H H a l l e l e 2 ) ,     i H S = u n i H S m e a n ( u n i H S ) s d ( u n i H S ) h s = n s 1 n s ( 1 1 n s 2 ( n a l l e l e 1 2 + n a l l e l e 2 2 ) ) n E H H S s , t = 1 h s , t 1 h s u n R s b = l n ( i n E S p o p 1 i n E S p o p 2 ) ,     R s b = u n R s b m e d i a n ( u n R s b ) s d ( u n R s b )
  • n s : Total number of haplotype;
  • n a l l e l e 1 : Total number of haplotype for allele1;
  • n a l l e l e 2 : Total number of haplotype for allele2;
  • i n E S p o p 1 : integrated haplotype homozygosity score (nEHHS) for pop1;
  • i n E S p o p 2 : integrated haplotype homozygosity score (nEHHS) for pop2.
A heatmap plot was created by calculating the linkage coefficient of correlation (r2) between SNPs included in a candidate region using the ‘LDheatmap’ package in R software [14]. Additionally, an LD block was defined as the area where more than four consecutive SNPs with r2 ≥ 0.6 were located.

2.3. Gene and Quantitative Trait Locus (QTL) Annotation

Annotation was performed to check the genetic information associated with each candidate selection signal region. Genetic information was acquired from corresponding entries in the Ensembl database (Gallus_gallus-5.0) using the ‘biomaRt’ package in R software [15]. QTL annotation was performed to check the QTL information associated with each candidate region. Gallus_gallus-5.0 QTL information was extracted from the Animal QTL Database (https://www.animalgenome.org/cgi-bin/QTLdb/GG/index (accessed on 20 January 2021)), and candidate selection regions were identified.

3. Results

3.1. General Diversity and Sliding Window Analyses

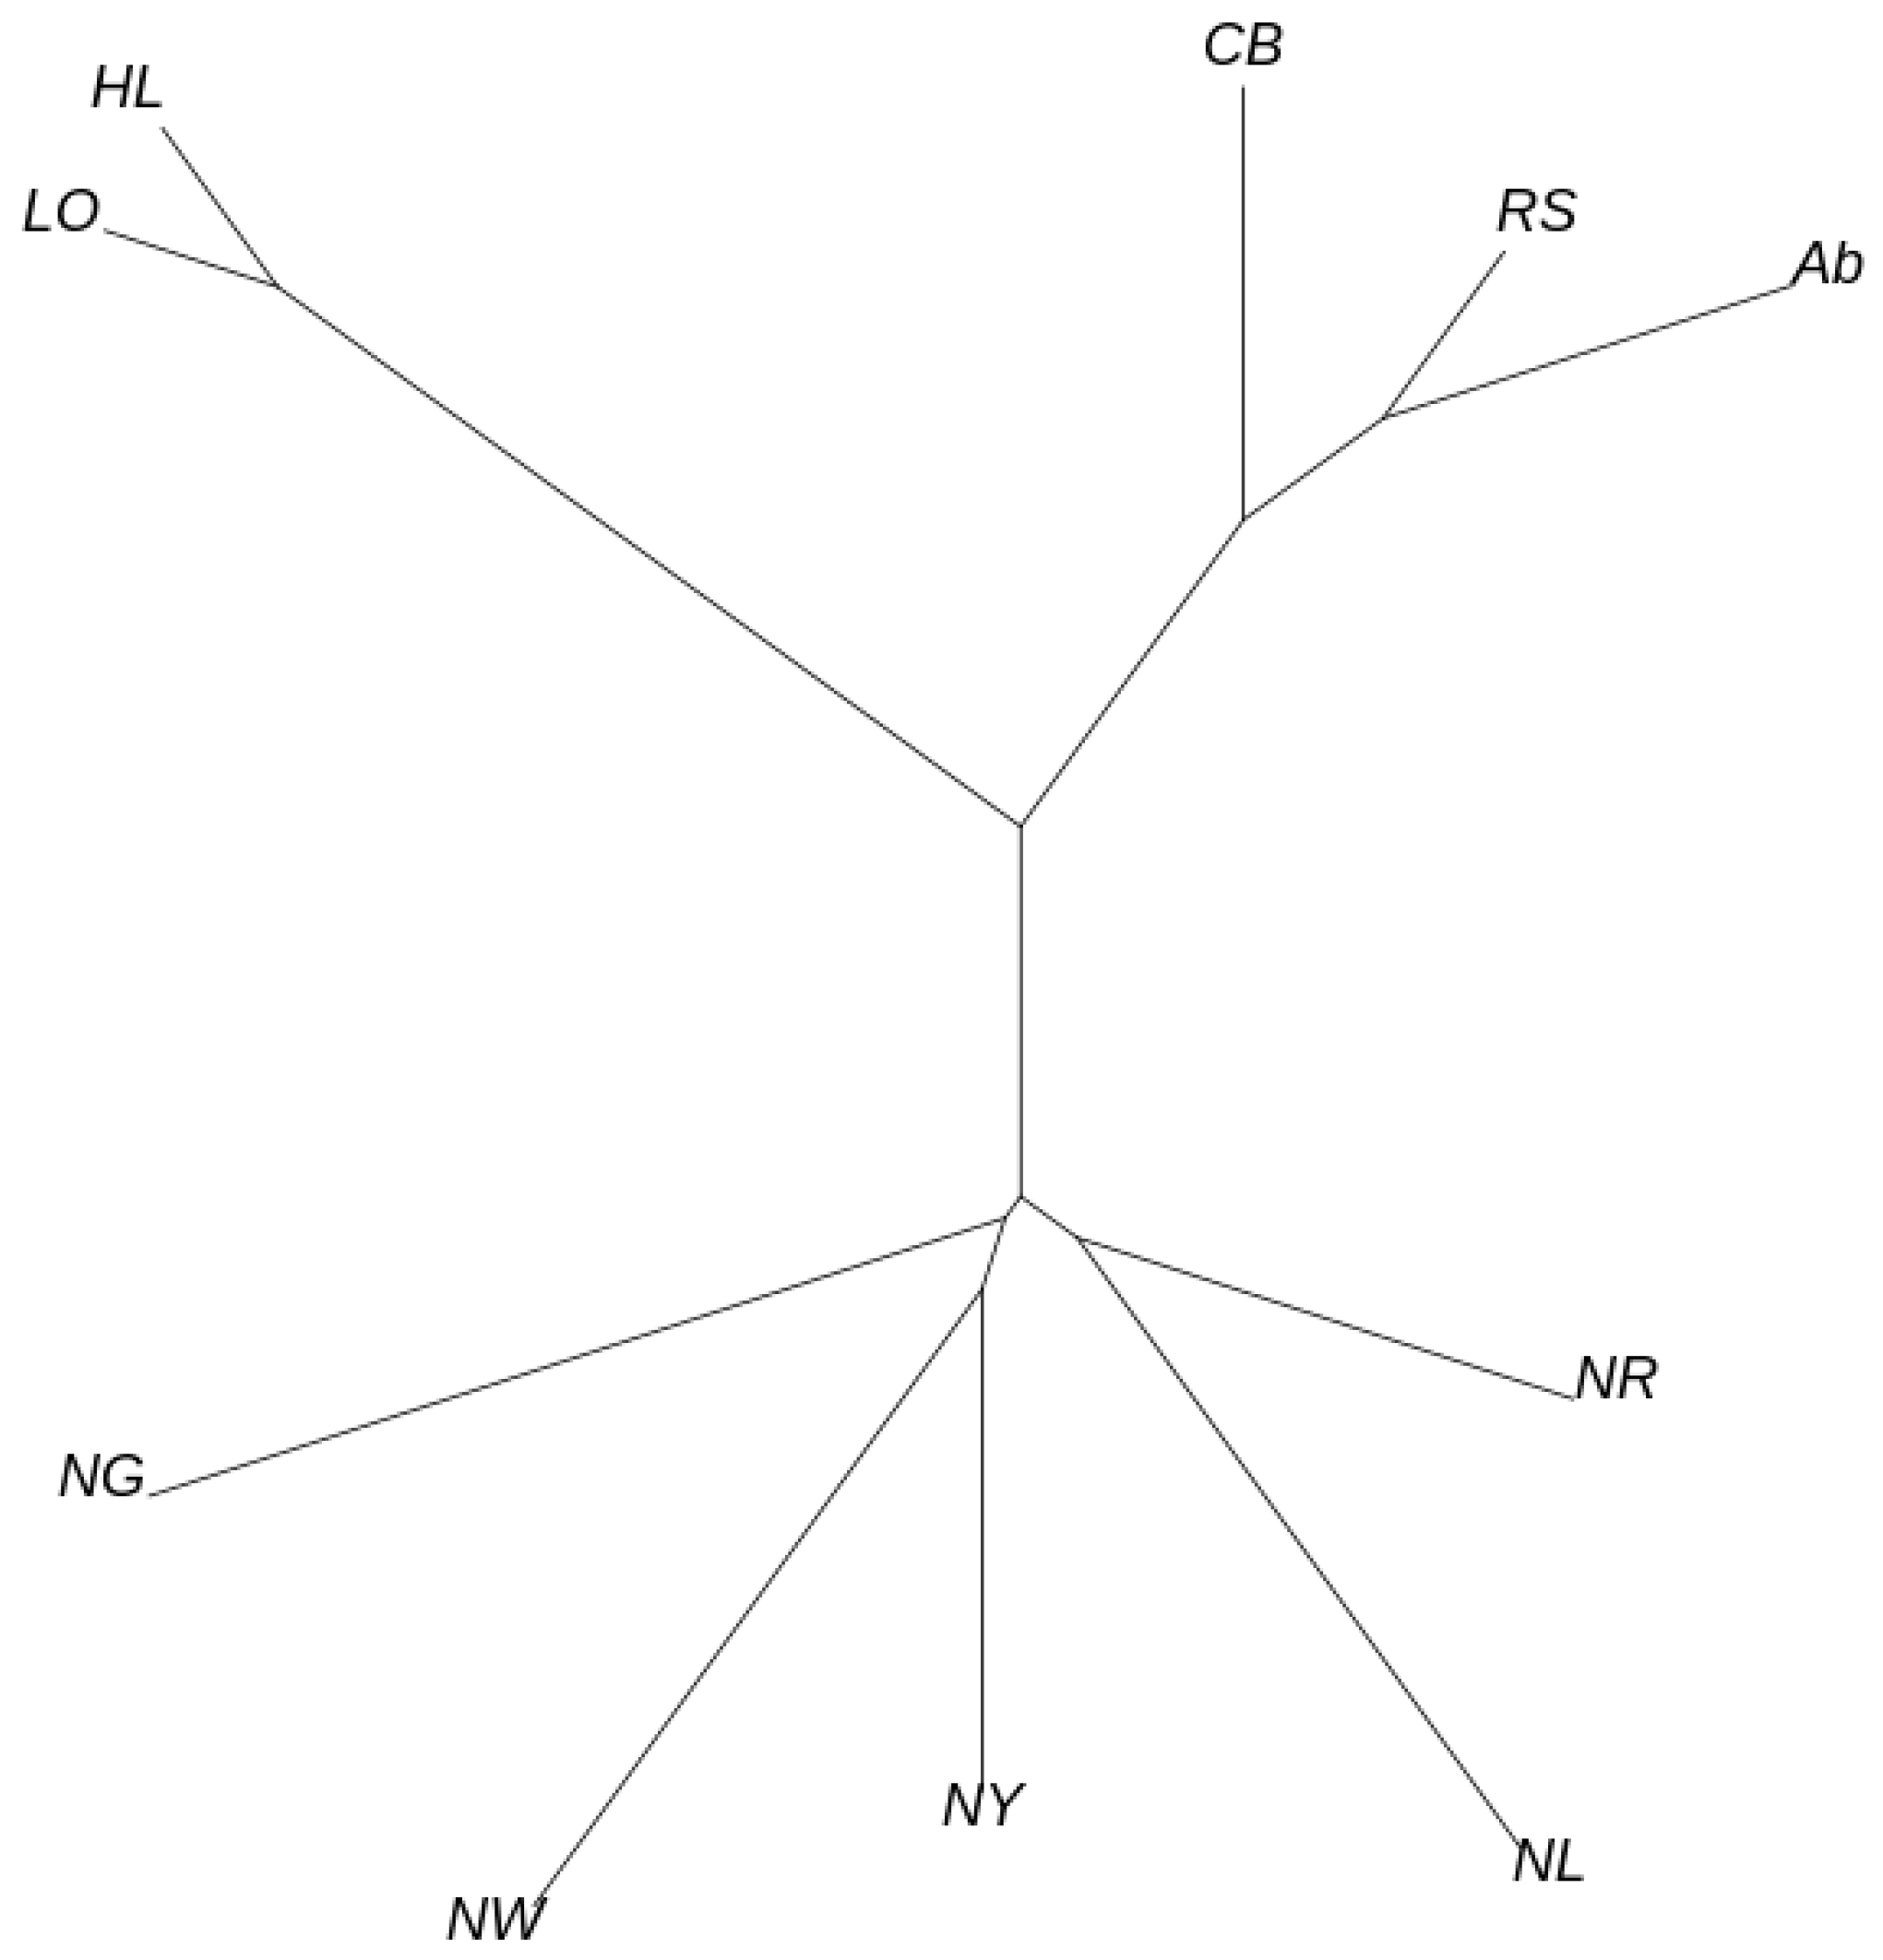
Principal component analysis was performed to confirm genetic similarities and differences among the chicken populations sampled in this study (Figure 1). PC1–4 explained 18.50%, 12.74%, 11.74%, and 9.07% of the total variance, respectively, and thus had substantial explanatory power. All KNC lines (NG, NL, NR, NW, and NY) were clustered separately. The commercial chicken breeds were clustered into broiler (Ab, CB, and RS) and layer (HL and LO) groups. In particular, the KNC lines and commercial chicken breeds could be distinguished based on PC1, which had the greatest explanatory power. The commercial chicken breeds also clustered separately from the KNC lines in the phylogenetic tree constructed based on Nei’s genetic distance, forming their own subtree (Figure 2). Furthermore, the NL and NR lines were located in their own subtree, as were the NW and NY lines. The outcomes of admixture analysis confirmed the previous results in greater detail (Figure 3 and Figure S1). With two common ancestors (K = 2), there was a clear separation between the commercial and native chicken breeds. The largest difference between the NG and NR lines was observed when K = 3. Additionally, excluding NG, the remaining KNC lines shared at least 70.88% of their genetic makeup with the NR line, consistent with the phylogenetic analysis results. When K = 6, the five KNC lines were completely separated, and when K = 7, broilers and layers were separated. At the optimal genetic component value, K = 12, KNC lines were separated from the broilers and layers. In particular, mixing of genetic components was confirmed in all lines except NG, and more than 99.89% of the single components were identified. To determine the regions with selection signatures, the entire genome was divided into 25-kb windows (each with an overlap of 12.5 kb). In total, 37,238 windows were identified; the mean number of SNPs per window was 14.17098.

3.2. Detection of Selection Signatures and QTL Annotation

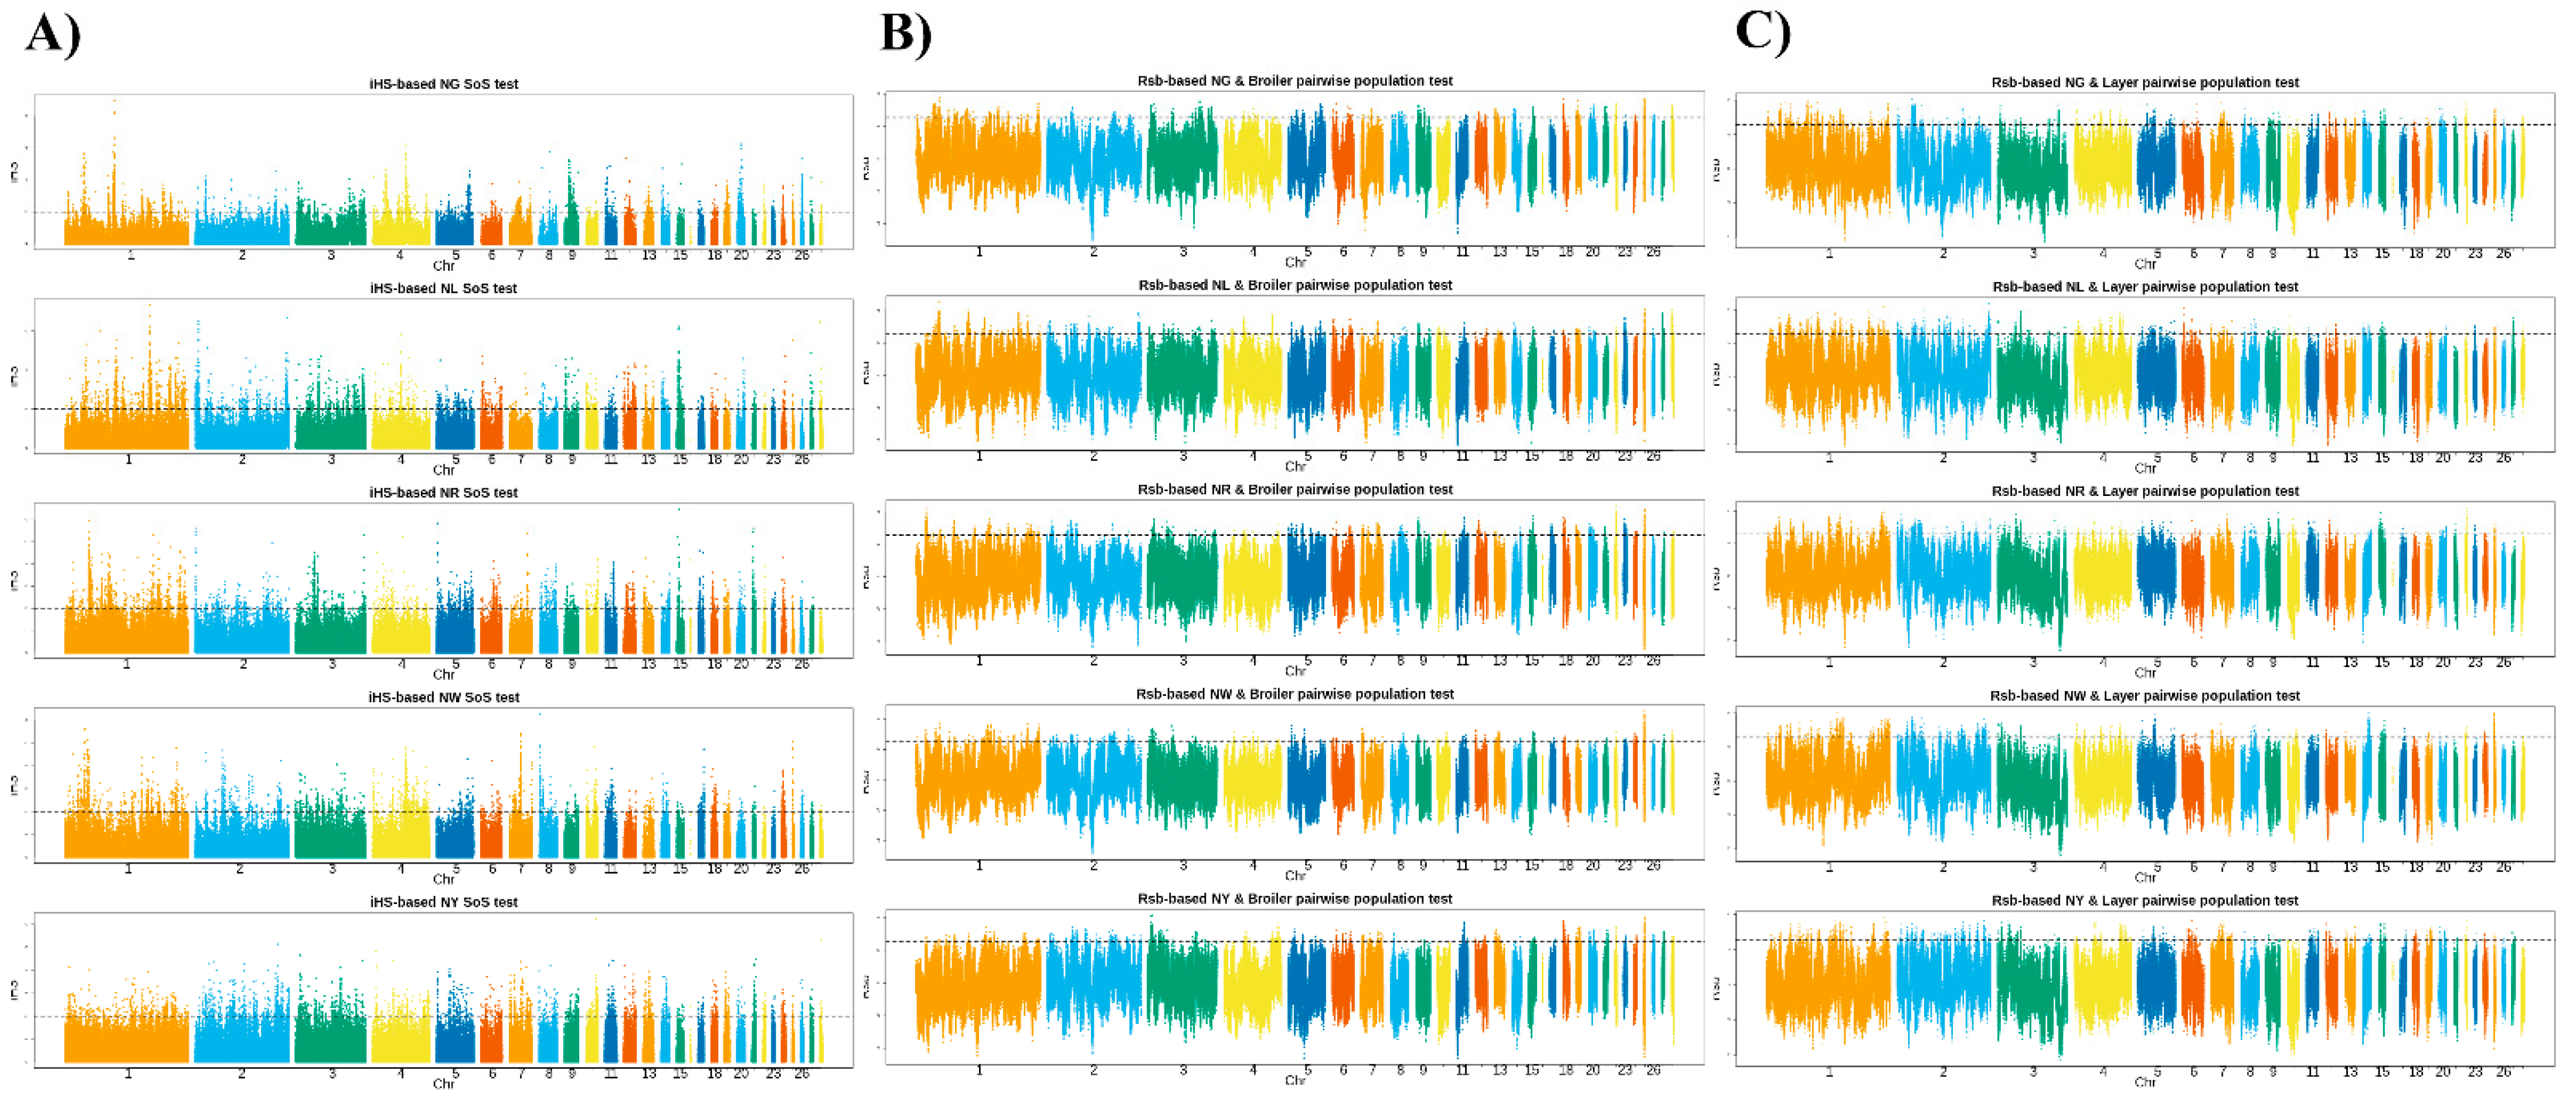
From the haplotype-based iHS and Rsb analyses, within- and between-group selection signals for the five KNC lines were identified. Some overlaps were found, but in most instances, selection signals were detected in distinct areas for each line (Figure 4).
In terms of within-population selection signals in the KNC lines, 125, 168, 135, 114, and 98 signals were identified in the NG, NL, NR, NW, and NY lines, respectively (p < 0.01). iHS analysis could not identify common selection signal areas in the KNC lines.
However, based on QTL annotation, significant effects were found for features related to immunity (spleen weight, fowl typhoid susceptibility, Marek’s disease virus antibody titer, infectious bronchitis virus antibody titer, and alternative complement activation by red blood cells) and eggshell traits. Layer-specific selection signals were identified in QTL regions related to eggshell traits (strength and thickness), production (feed conversion ratio, FCR), and fear-associated behaviours (e.g., feather pecking and aggressive behaviours) (Table S1).
Upon comparing selection signals with the broiler population, 66, 65, 80, 52, and 46 areas with selection signals were identified in the NG (Rsb ≥ 2.549), NL (Rsb ≥ 2.557), NR (Rsb ≥ 2.556), NW (Rsb ≥ 2.544), and NY (Rsb ≥ 2.550) lines, respectively. QTL annotation revealed significant QTL regions related to long-term development (ileum length, ileum weight, and duodenum length), reproduction (ovary percentage and ovary weight), production (FCR and feed intake), fear—tonic immobility duration (in most KNC lines), exterior traits (comb weight and wattle weight), and other traits (Table S2).
Upon comparing selection signals with the layer population, 134, 113, 132, 111, and 122 areas with selection signals were identified in the NG (Rsb ≥ 2.578), NL (Rsb ≥ 2.569), NR (Rsb ≥ 2.564), NW (Rsb ≥ 2.570), and NY (Rsb ≥ 2.562) lines, respectively. QTL annotation revealed significant QTL domains in most of the KNC lines related to long-term development (ileum weight, gizzard weight, and heart weight), reproduction (egg number, ovary percentage, and ovary weight), eggshell traits (color and strength), production (dry matter intake, FCR, and feed intake), fear—tonic immobility duration, feather pecking, and exterior traits (comb weight and wattle weight) (Table S3).

3.3. LD Block Profiling for Significant Selection Signal Regions

Different LD block patterns were found for each line in the selection signal analysis. In this study, an LD block refers to an instance of more than four consecutive SNPs with an LD coefficient (r2) ≥ 0.6. For the KNCs, 18,008, 16,134, 19,827, 19,006, and 16,605 LD blocks were identified in the NG, NL, NR, NW, and NY lines, respectively. For the commercial chicken breeds, 13,448 and 14,540 blocks were identified in the broilers and layers, respectively, which were small numbers compared with the numbers of blocks in the KNCs. Among the LD blocks identified throughout the genome, candidate genes with greater selection pressure were extracted and visualised in an LD heatmap. In particular, block patterns with high LD coefficients were observed for the LPP, IGF11, LMNB2, ERBB4, GABRB2, NTM, APOO, PLOA1, CNTN1, NTSR1, DEF3, CELF1, and MEF2D genes.

4. Discussion

Although there are many differences between KNCs and commercial chicken breeds, the greatest difference is related to artificial selection. Traditionally, chickens were reared in the backyard to provide small amounts of eggs and meat for the household, not for economic purposes. Furthermore, the KNC population was restored to avoid extinction, not for economic benefits. Therefore, traces of positive selection for adaptation to the backyard environment in the wild-type chicken should be retained in the current KNC population. The purpose of this study was to conduct a basic diversity analysis of 191 KNCs and 54 commercial chickens using 600K SNP data, and to identify signals of positive selective sweep in KNCs that can be used for breed improvement.
Similar patterns were observed in both principal component and phylogenetic analyses. In the principal component analysis plots, broilers, layers, and the KNC lines clustered mainly into different groups, and similar trends were observed in subtrees on phylogenetic analysis. In particular, the KNC lines differed markedly from the commercial chickens, with large differences also evident among lines. Therefore, we performed three selection signal analyses for each line, comparing the lines to broilers and layers in iHS and Rsb. Genetic information for candidate regions exhibiting selection signals was extracted based on the locations of regions in the Gallus_gallus-5.0 genome (Table 1). However, because most candidate genes were unknown genes, QTL information was extracted regarding each putative selection signal region. Only a few candidate genes were shared among lines, according to the analyses. This is potentially because of genetic differences among KNC lines, as demonstrated by the diversity analysis. The results indicated that most QTL regions identified as candidate selection signal regions were related to biological characteristics such as reproductive organs, eggshell traits, immunity, and organ development.
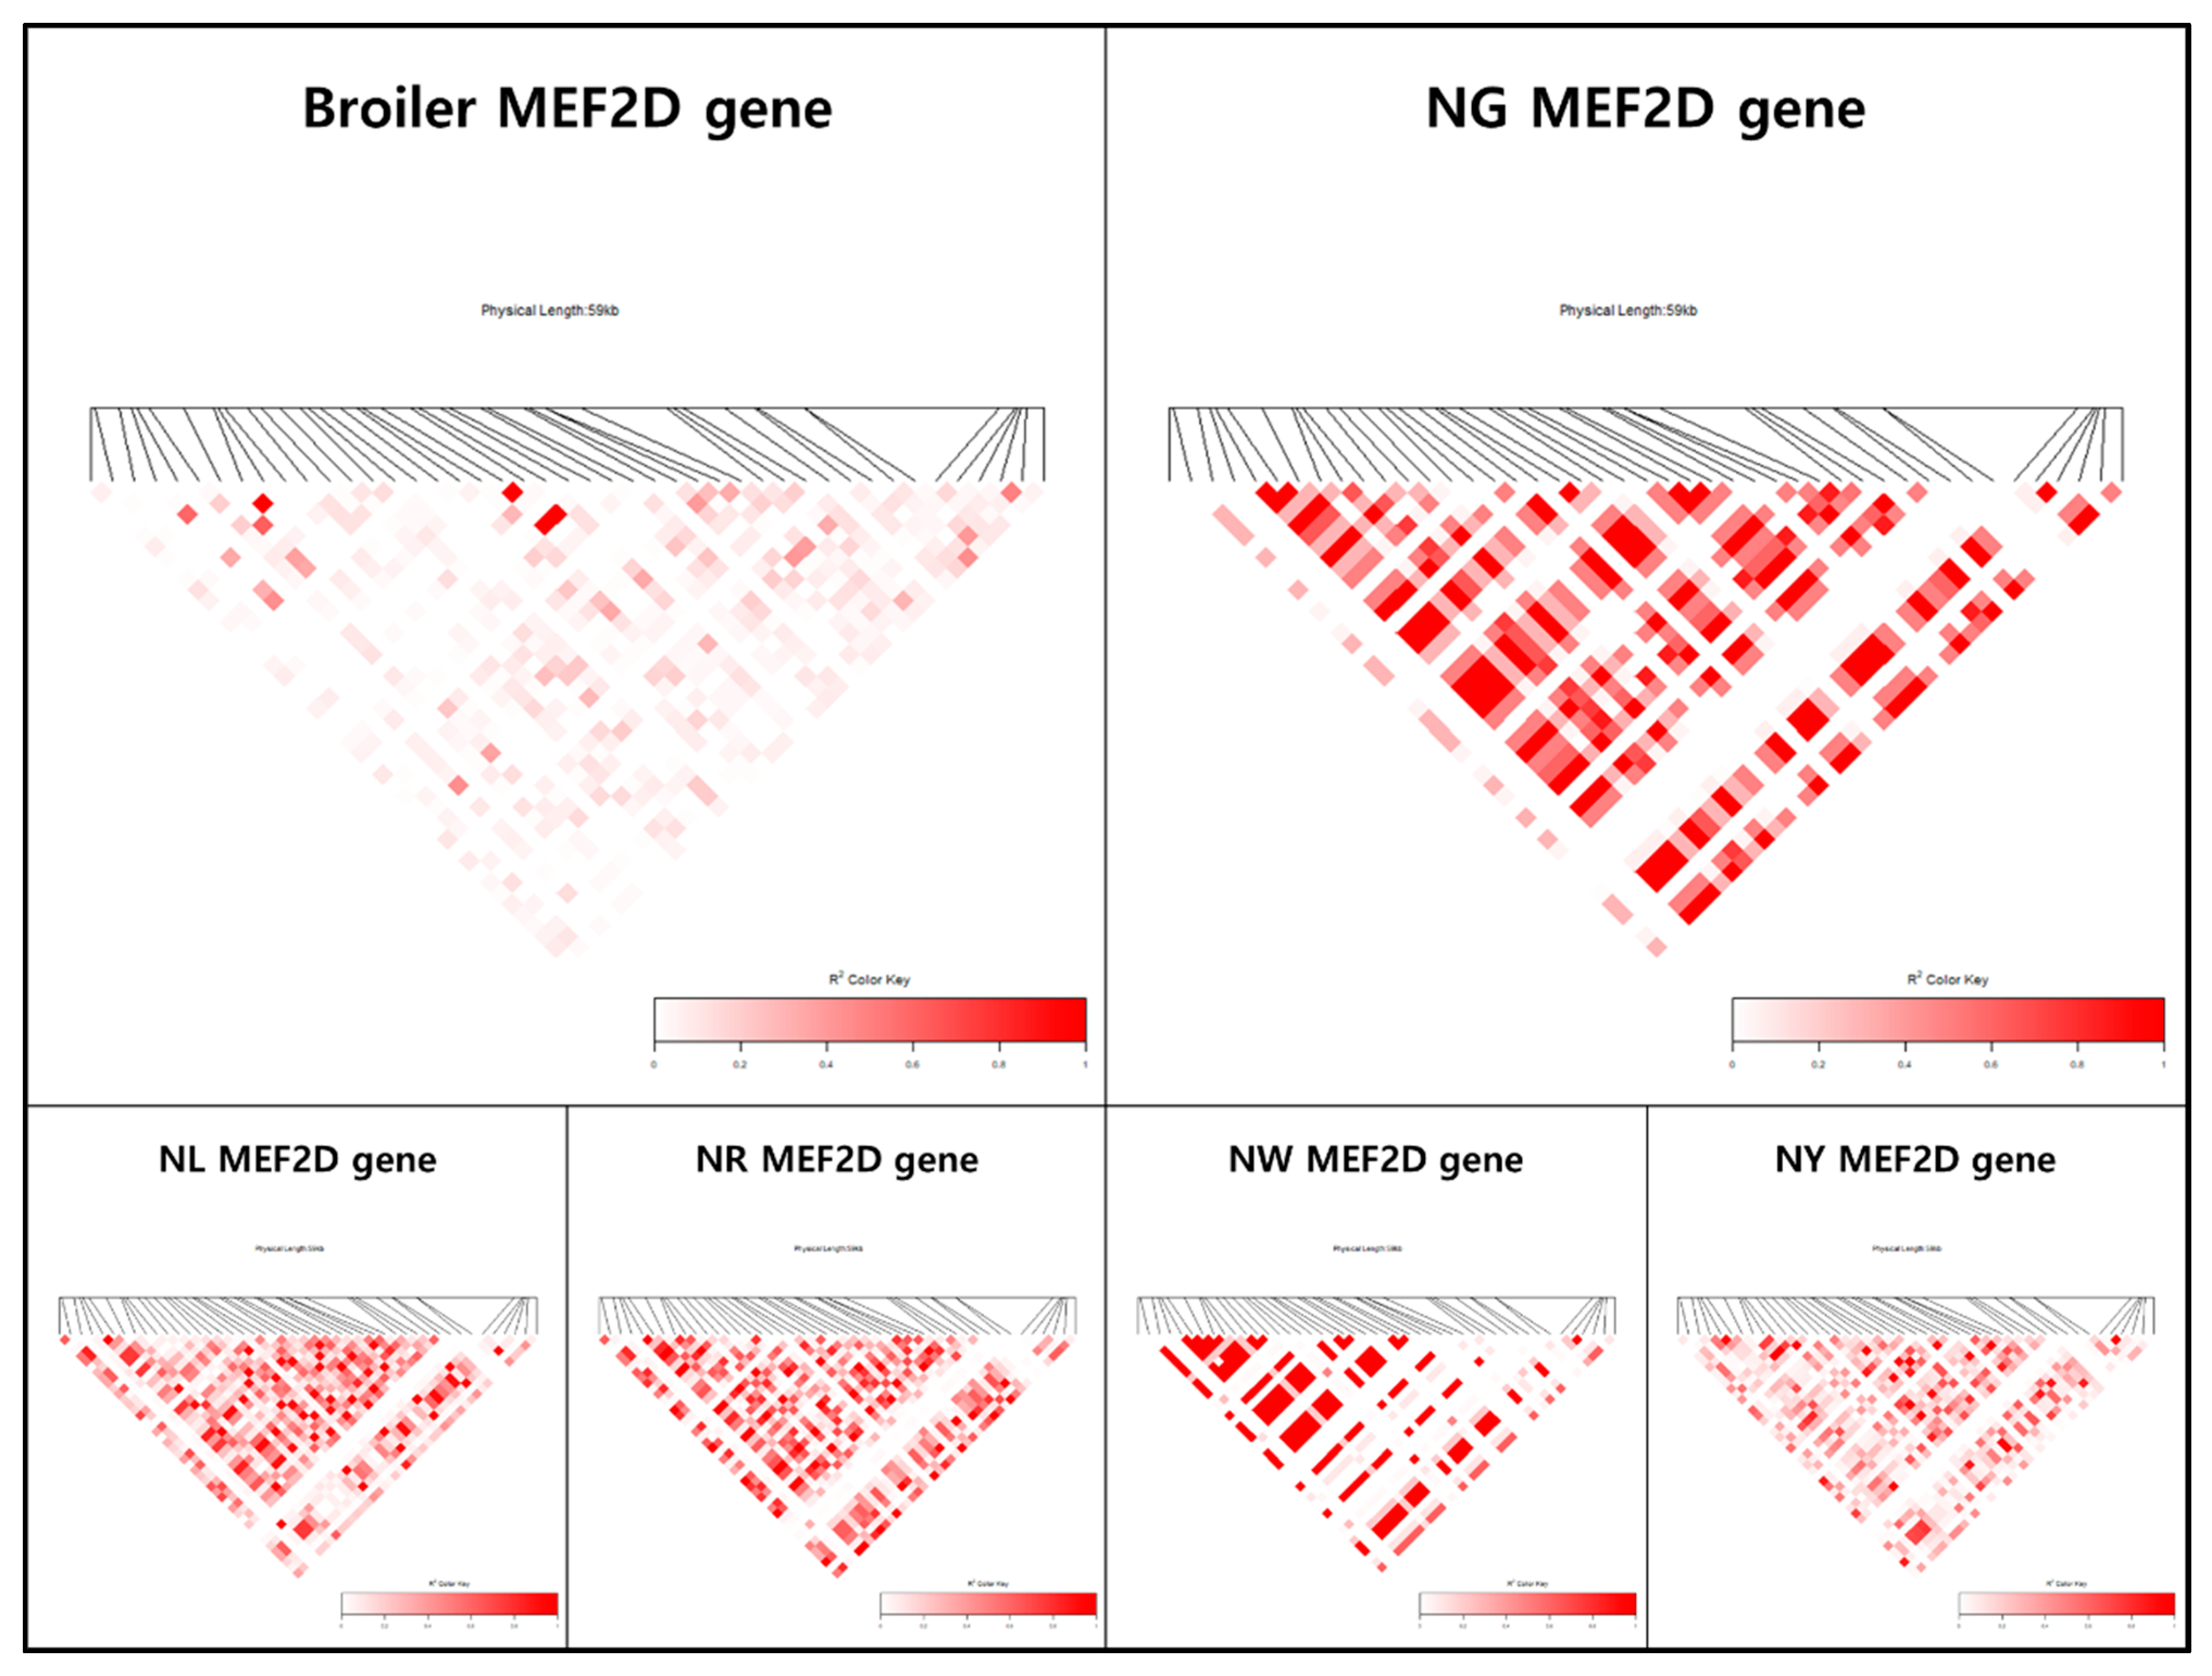
Backyard-reared chickens are able to move about freely, in contrast to cage-reared chickens. As KNCs can move continuously, differences related to motor abilities such as myocardial and muscle development are evident between these chickens and commercially bred chickens. In this study, candidate genes with these functions likely underwent selection (Figure S2). The double PHD fingers 3 (DPF3) gene was shown to function in heart development, through a genome-wide association study comparing congenitally malformed hearts exhibiting tetralogy of Fallot and normal hearts [16]. The DPF3 gene was specifically expressed during heart development in mice, chickens, and zebrafish, and the knockdown of DPF3 in zebrafish resulted in myocardial contractility and incomplete heart formation; thus, DPF3 was categorized as a major gene for heart development [17]. The CUGBP Elav-like family member 1 (CELF1) gene encodes an RNA-binding protein that greatly affects the heart and skeletal muscles during early human embryonic development by regulating pre-mRNA alternative splicing, deadenylation, and mRNA decay and translation [18]. The knockdown of the CELF1 gene in cardiomyocytes in chicken embryos confirmed that it is a major regulator of cardiomyocyte gene expression [19,20,21]. The myocyte-specific enhancer-binding factor 2D (MEF2D) gene is a member of the MEF2 family and acts as a major regulator in the production of various muscles [22,23,24]. Ouyang et al. (2020) [25] reported that the MEF2D gene generates four transcripts (MEF2D-V1, MEF2D-V2, MEF2D-V3, and MEF2D-V4), based on the results of tissue-specific transcriptome analysis at the embryonic stage in chickens. Among the four transcripts, MEF2D-V4 was significantly associated with the embryonic phenotype and was highly expressed in embryonic leg muscles. This study confirmed the association of a selection signal with the MEF2D gene (Chr 25: 1,557,867–1,620,174 bp) in all KNC lines, in which a strong LD block was present compared with the broiler population (Figure 5).
KNCs have largely been raised as backyard chickens; they are thus more resistant to diseases and viruses, compared with commercial chickens, and likely consume coarser feed. To adapt to these conditions, a selective sweep might have occurred across the QTL regions related to immune responses, disease sensitivity, and long-term development (Figure S3). Among the candidate selection signal genes, the LIM domain containing the preferred translocation partner in lipoma (LPP), immunoglobulin superfamily member 11 (IGSF11), and lamin B2 (LMNB2) genes has been associated with immune responses and disease sensitivity. The LPP gene encodes a zyxin-related cell adhesion protein that regulates cytoskeletal tissue and cell migration and has been associated with some immune responses [26]. According to Feng et al. (2019) [27], SNPs located at the 3′-untranslated region of the LPP gene in humans have been associated with immunoglobulin A nephropathy. Liu et al. (2020) [28] confirmed that sensitivity to Salmonella enteritidis is associated with the genotypes of SNPs located in the LPP gene in chickens. The IGSF11 gene is a member of the immunoglobulin superfamily and is mainly expressed in the brain and testes [29]. Zhang et al. (2019) [30] reported significant differences in IGSF11 expression levels in the spleen and bursa between chickens with normal and low immunity, when the low immunity was induced by high-temperature stress. This indicates that IGSF11 is associated with immune responses. Previous research revealed that the LMNB2 gene was upregulated in the spleens of chickens infected with the reticuloendotheliosis virus and Marek’s disease virus, implying an association with immune responses [31,32]. These selective sweeps in KNCs are presumably adaptations to rearing under non-standardized backyard conditions. Based on findings in previous studies, we presume that KNCs have stronger immune responses because they exhibit higher genetic diversity, compared with commercial chickens, in the major histocompatibility complex B region, which plays major roles in adaptive and innate immune responses [33,34].
Outdoor-reared KNCs are more closely related to wild chickens due to a comparative lack of selective breeding compared with commercially reared chickens, which have undergone such selection for a long time. Generally, domesticated chickens exhibit reduced levels of aggression and fear [35,36]. Therefore, KNCs can respond more sensitively to external factors for survival purposes, compared with commercial chickens. Among the candidate genes detected in our analysis, we identified selection signals in the Erb-b2 receptor tyrosine kinase 4 (ERBB4) and γ-aminobutyric acid type A receptor β 2 subunit (GABRB2) genes. ERBB4 is a major gene involved in fear responses [37], and the GABRB2 gene is reportedly associated with behavioral responses to anxiety in chickens and mice [38,39] (Figure S4).
Some of the genes exhibiting signals of selective sweep have functions related to reproductive organs (Figure S5). The neurotrimin (NTM) gene promotes outgrowth in resident sensory nerves in response to estrogen [40] and is associated with the regulation of oviduct development and differentiation in chickens, thus confirming a significant association with traits related to age at first egg [41,42]. The contactin 1 (CNTN1) gene encodes an immunoglobulin family of cell adhesion molecules that contribute to the formation of connections among axons during the nervous system development [43]. Although the exact mechanism has not been confirmed, the CNTN1 gene was reportedly differentially expressed (according to RNA sequencing analysis) in the ovaries and fallopian tubes (including the magnum, isthmus, and uterus) of chickens during egg production [44], and it has been identified as one of 25 candidate genes associated with an enhanced spawning ability [45]. Neurotensin receptor 1 (NTSR1) is a receptor that acts in various ways in the central nervous system [46]. In particular, the NTSR1 gene affects the anorexic pathway in chickens [47] and was identified as a major differentially expressed gene in a comparative ovarian transcriptome analysis of chickens exhibiting high and low levels of spawning [48]. The DNA polymerase α 1, catalytic subunit (POLA1) gene and the fatty acid and lipid metabolism-related apolipoprotein O (APOO) gene were identified as candidate genes that were strongly associated with weekly egg number [49]. The selective sweep of genes affecting the ovaries and fallopian tubes was confirmed in the KNC population, and this process presumably affected egg-laying and eggshell traits.
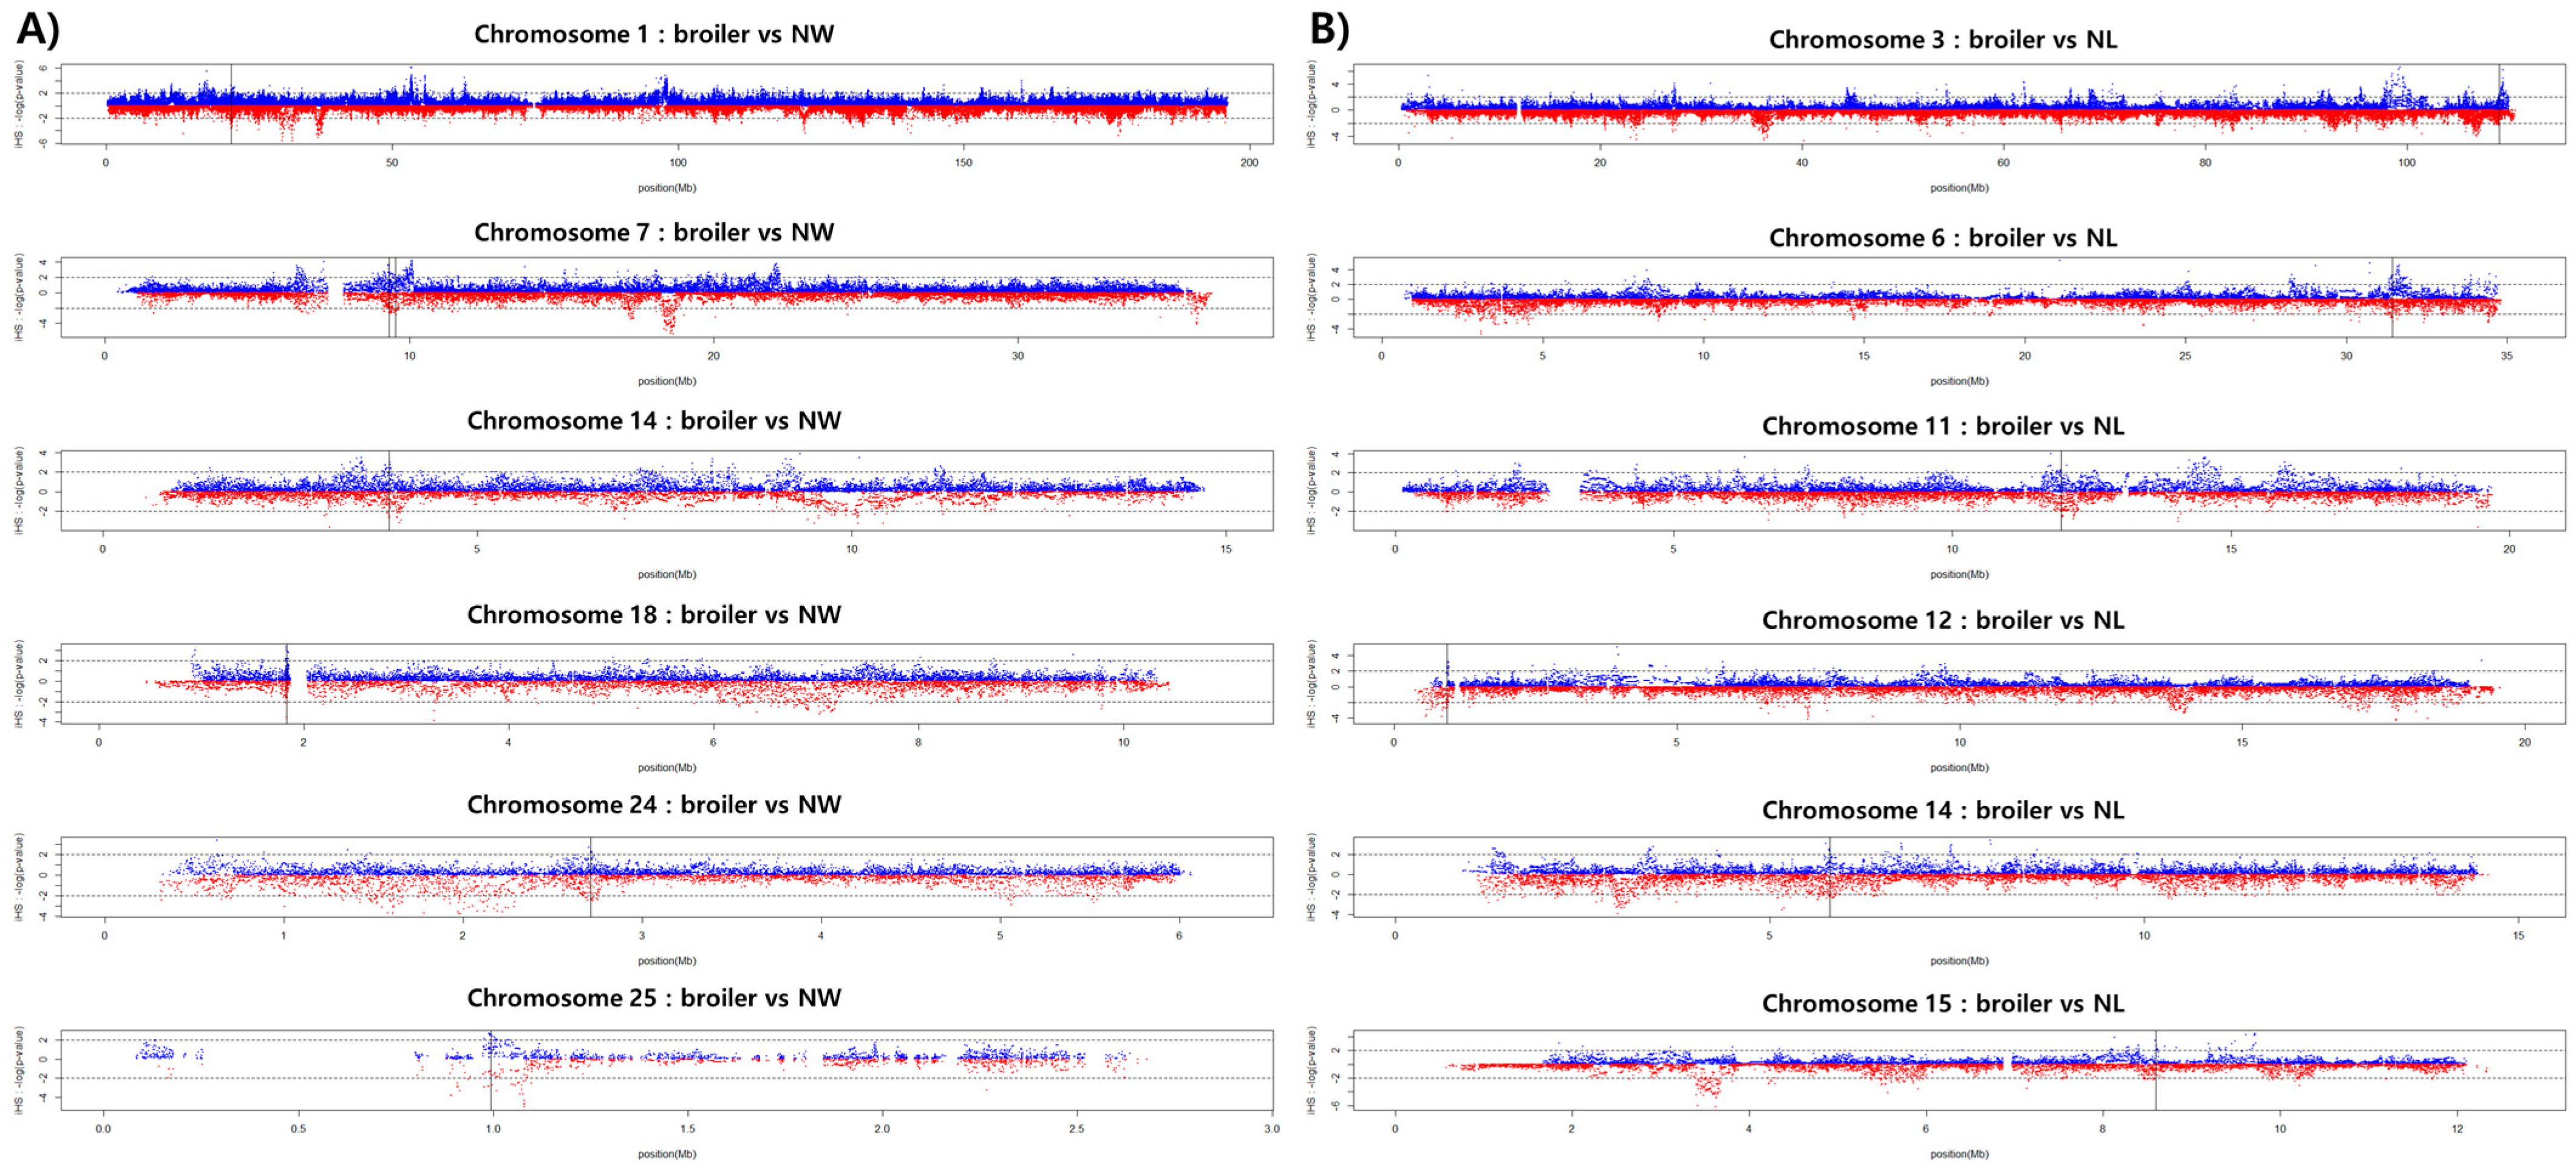
In this study, information regarding the selection signal regions and candidate selection signal genes in KNCs was elucidated. As genes exhibiting selection signals are related to immunity, fear behavioral responses, and myocardial development, positive selection might have been driven by the need to survive in a backyard environment. Although the selected genes are less related to economic traits, KNC traits can be used to maintain the robustness and environmental adaptability of commercially bred chickens. In addition, we indirectly confirmed the direction of improvement for each trait by comparing the within-group selection signals (iHS) between commercial chicken and KNC populations. Although phenotypic data were not included in our analysis, information regarding candidate selection signal genes and QTLs was extracted from the selective sweep regions shared between the commercial chicken and KNC populations (Table 2). Some notable results were observed. In the KNC NL line, shared selective sweep regions were not detected upon comparison with broiler chickens. However, a large number of shared regions were detected upon comparison with layer chickens. In contrast, shared selective sweep regions were detected between NW and broiler chickens, but not between NW and layer chickens (Figure 6). Based on a whole-genome study, the NL and NW lines both exhibit low genetic similarity with the commercial chicken, although they may be similar in terms of sharing selective sweep regions. Therefore, we presume that traits associated with the KNC NL and NW lines may be useful for improving egg and meat production, respectively, whereas the traits of other lines may be useful for improving both egg and meat production.
QTL regions specific to a chicken type were confirmed based on selective sweep regions identified through iHS and Rsb analyses of the commercial population (Table S4). QTL regions identified through iHS analysis in the layer population could be used to improve spawning ability, because they are associated with a small yellow follicle number, the FCR, ovary weight, and egg number. In the broiler population, selection signals were detected for QTL regions associated with growth properties (e.g., the FCR, breast muscle pH, and feed intake) and eggshell traits (e.g., eggshell strength and thickness). Similar results were obtained from the Rsb analysis. Significant QTL regions in the layer population were associated with feed intake, the FCR, ovary weight, albumen height and age at sexual maturity, whereas significant QTL regions in the broiler population were associated with the FCR, body weight, feed intake, and mean daily gain. Selection signals detected in the commercial population were found in specific QTL regions according to the chicken type; generally, there was continuous selection pressure on traits related to the FCR. QTLs associated with the FCR was detected in the G. gallus Chr 6: 7.9–12.1-Mb region, and it would be beneficial to improve these traits regardless of the chicken breed. Traits related to the FCR exhibit moderate heritability, and the FCR is used as an indicator of the degree of genetic improvement [50]. The KNC population has been maintained for the purpose of preservation, and the accumulation of relevant data is needed to improve their economic traits. To ensure profitability, chicken phenotypes should be continuously measured and recorded, and trait information regarding genes with selection signals should be used to improve the commercial population.

5. Conclusions

This study, we identified specific selective sweep regions in KNCs through selection signal analysis with commercial layers and broilers. Most QTL regions identified as candidate selection signal regions were associated with reproductive organs, eggshell traits, immunity, and organ development. The LPP, IGF11, LMNB2, ERBB4, GABRB2, NTM, APOO, PLOA1, CNTN1, NTSR1, DEF3, CELF1, and MEF2D genes produced haplotype block patterns with high LD values in regions exhibiting selection signals. Hence, the candidate regions likely underwent selection during environmental adaptation, and the selected traits may be useful for optimising productivity and further environmental adaptation in KNCs. From comparisons of selection signals with commercial chicken populations, we identified major economic traits that could be used for the efficient improvement of KNCs. According to comparative analysis with the layer population, major traits that underwent selection, were related to the FCR, ovary weight, albumen height, and age at sexual maturity. In contrast, major traits identified via comparative analysis with the broiler population were related to the FCR, body weight, feed intake, and mean daily gain. NL and NW lines contained a considerable number of selective sweep regions related to broilers and layers, respectively. This study provides novel insights into traits that underwent selective sweep, which could be used to genetically improve the KNC population.

Supplementary Materials

The following are available online at https://www.mdpi.com/article/10.3390/genes12060824/s1; Figure S1: result of admixture analysis cross-validation error plot, Figure S2: linkage disequilibrium block heatmap of myocardial development-related genes in commercial and Korean native chickens, Figure S3: linkage disequilibrium block heatmap of immune-related genes in commercial and Korean native chickens, Figure S4: linkage disequilibrium block heatmap of fear/behavior responses-related genes in commercial and Korean native chickens, Figure S5: linkage disequilibrium block heatmap of reproductive organ-related genes in commercial and Korean native chickens, Table S1: the results of candidate gene and QTL information contained in the selective sweep region identified through integrated haplotype homozygosity score (iHS) selection signal analysis in the Korean native chicken, Table S2: the results of candidate gene and QTL information contained in the selective sweep region identified through extended haplotype homozygosity ratio between populations comparative selection signal analysis (Rsb) between broiler and Korean native chicken, Table S3: the results of candidate gene and QTL information contained in the selective sweep region identified through extended haplotype homozygosity ratio between populations comparative selection signal analysis (Rsb) between layer and Korean native chicken, Table S4: the results of candidate gene and QTL information contained in the selective sweep region identified through integrated haplotype homozygosity score (iHS) and extended haplotype homozygosity ratio between populations comparative selection signal analysis (Rsb) between broiler and layer chicken.

Author Contributions

Conceptualization, D.S. and J.H.L.; methodology, S.C., P.M. and M.K.; software, S.C., P.M. and D.L.; data curation, S.C., P.M., M.K. and E.C.; validation, D.S., J.H.L., D.L. and S.H.L.; formal analysis, S.C.; under guidance of J.H.L. and D.S.; resources, J.H.L. and D.S.; writing—original draft preparation, S.C.; writing—review and editing, D.S., J.H.L. and S.H.L.; supervision, D.S. and J.H.L.; project administration, D.S. and J.H.L.; funding acquisition, D.S. and J.H.L. All authors have read and agreed to the published version of the manuscript.

Funding

This research was supported by the Basic Science Research Program through the National Research Foundation of Korea (NRF) funded by the Ministry of Science, ICT and Future Planning (2017R1C1B3009487).

Institutional Review Board Statement

All samples were obtained in accordance with the guidelines of the Institutional Animal Care and Use Committee of the National Institute of Animal Science (NIAS; 2012-C-037), and the guidelines of the Guide for the Care and Use of Laboratory Animals.

Informed Consent Statement

Not applicable.

Data Availability Statement

The datasets analyzed in this study are available upon request from corresponding authors.

Acknowledgments

This research was supported by the Basic Science Research Program through the National Research Foundation of Korea (NRF) funded by the Ministry of Science, ICT and Future Planning (2017R1C1B3009487) and partly supported by the Institute of Information and Communications Technology Planning and Evaluation (IITP) grant funded by the Korea government (MSIT) (No. 2020-0-01441, Artificial Intelligence Convergence Research Center (Chungnam National University)).

Conflicts of Interest

The authors declare no conflict of interest.

References

  1. Smith, J.M.; Haigh, J. The hitch-hiking effect of a favourable gene. Genet. Res. 1974, 23, 23–35. [Google Scholar] [CrossRef] [Green Version]
  2. Charlesworth, B. A hitch-hiking guide to the genome: A commentary on ‘The hitch-hiking effect of a favourable gene’by John Maynard Smith and John Haigh. Genet. Res. 2007, 89, 389–390. [Google Scholar] [CrossRef] [Green Version]
  3. Sabeti, P.C.; Varilly, P.; Fry, B.; Lohmueller, J.; Hostetter, E.; Cotsapas, C.; Xie, X.; Byrne, E.H.; McCarroll, S.A.; Gaudet, R. Genome-wide detection and characterization of positive selection in human populations. Nature 2007, 449, 913–918. [Google Scholar] [CrossRef]
  4. Sabeti, P.C.; Reich, D.E.; Higgins, J.M.; Levine, H.Z.; Richter, D.J.; Schaffner, S.F.; Gabriel, S.B.; Platko, J.V.; Patterson, N.J.; McDonald, G.J. Detecting recent positive selection in the human genome from haplotype structure. Nature 2002, 419, 832–837. [Google Scholar] [CrossRef]
  5. Browning, S.R.; Weir, B.S. Population structure with localized haplotype clusters. Genetics 2010, 185, 1337–1344. [Google Scholar] [CrossRef] [Green Version]
  6. Zuidhof, M.; Schneider, B.; Carney, V.; Korver, D.; Robinson, F. Growth, efficiency, and yield of commercial broilers from 1957, 1978, and 2005. Poult. Sci. 2014, 93, 2970–2982. [Google Scholar] [CrossRef]
  7. Shin, T.K.; Wickramasuriya, S.S.; Kim, E.; Cho, H.M.; Heo, J.M.; Yi, Y.-J. Comparative study of growth performances of six different Korean native chicken crossbreeds from hatch to twelve weeks of age. Korean J. Agric. Sci. 2017, 44, 244–253. [Google Scholar]
  8. Lee, K.; Jung, Y.; Jung, S.; Lee, J.H.; Heo, K.N.; Jo, C. Physiochemical Characteristics of the Meat from Korean Native Chicken and Broiler Reared and Slaughtered as the Same Conditions. Korean J. Poult. Sci. 2011, 38, 225–230. [Google Scholar] [CrossRef] [Green Version]
  9. Purcell, S.; Neale, B.; Todd-Brown, K.; Thomas, L.; Ferreira, M.A.; Bender, D.; Maller, J.; Sklar, P.; De Bakker, P.I.; Daly, M.J. PLINK: A tool set for whole-genome association and population-based linkage analyses. Am. J. Hum. Genet. 2007, 81, 559–575. [Google Scholar] [CrossRef] [PubMed] [Green Version]
  10. Alexander, D.H.; Lange, K. Enhancements to the ADMIXTURE algorithm for individual ancestry estimation. BMC Bioinform. 2011, 12, 246. [Google Scholar] [CrossRef] [PubMed] [Green Version]
  11. Kamvar, Z.N.; Tabima, J.F.; Grünwald, N.J. Poppr: An R package for genetic analysis of populations with clonal, partially clonal, and/or sexual reproduction. PeerJ 2014, 2, e281. [Google Scholar] [CrossRef] [Green Version]
  12. Loh, P.-R.; Danecek, P.; Palamara, P.F.; Fuchsberger, C.; Reshef, Y.A.; Finucane, H.K.; Schoenherr, S.; Forer, L.; McCarthy, S.; Abecasis, G.R. Reference-based phasing using the Haplotype Reference Consortium panel. Nat. Genet. 2016, 48, 1443. [Google Scholar] [CrossRef] [Green Version]
  13. Gautier, M.; Vitalis, R. rehh: An R package to detect footprints of selection in genome-wide SNP data from haplotype structure. Bioinformatics 2012, 28, 1176–1177. [Google Scholar] [CrossRef] [PubMed]
  14. Shin, J.-H.; Blay, S.; McNeney, B.; Graham, J. LDheatmap: An R function for graphical display of pairwise linkage disequilibria between single nucleotide polymorphisms. J. Stat. Softw. 2006, 16, 1–10. [Google Scholar] [CrossRef] [Green Version]
  15. Durinck, S.; Moreau, Y.; Kasprzyk, A.; Davis, S.; De Moor, B.; Brazma, A.; Huber, W. BioMart and Bioconductor: A powerful link between biological databases and microarray data analysis. Bioinformatics 2005, 21, 3439–3440. [Google Scholar] [CrossRef] [PubMed] [Green Version]
  16. Kaynak, B.; von Heydebreck, A.; Mebus, S.; Seelow, D.; Hennig, S.; Vogel, J.; Sperling, H.-P.; Pregla, R.; Alexi-Meskishvili, V.; Hetzer, R. Genome-wide array analysis of normal and malformed human hearts. Circulation 2003, 107, 2467–2474. [Google Scholar] [CrossRef] [PubMed]
  17. Lange, M.; Kaynak, B.; Forster, U.B.; Tönjes, M.; Fischer, J.J.; Grimm, C.; Schlesinger, J.; Just, S.; Dunkel, I.; Krueger, T. Regulation of muscle development by DPF3, a novel histone acetylation and methylation reader of the BAF chromatin remodeling complex. Genes Dev. 2008, 22, 2370–2384. [Google Scholar] [CrossRef] [PubMed] [Green Version]
  18. Dasgupta, T.; Ladd, A.N. The importance of CELF control: Molecular and biological roles of the CUG-BP, Elav-like family of RNA-binding proteins. Wiley Interdiscip. Rev. RNA 2012, 3, 104–121. [Google Scholar] [CrossRef] [Green Version]
  19. Ladd, A.N.; Stenberg, M.G.; Swanson, M.S.; Cooper, T.A. Dynamic balance between activation and repression regulates pre-mRNA alternative splicing during heart development. Dev. Dyn. 2005, 233, 783–793. [Google Scholar] [CrossRef]
  20. Blech-Hermoni, Y.; Stillwagon, S.J.; Ladd, A.N. Diversity and conservation of CELF1 and CELF2 RNA and protein expression patterns during embryonic development. Dev. Dyn. 2013, 242, 767–777. [Google Scholar] [CrossRef] [Green Version]
  21. Brimacombe, K.R.; Ladd, A.N. Cloning and embryonic expression patterns of the chicken CELF family. Dev. Dyn. 2007, 236, 2216–2224. [Google Scholar] [CrossRef]
  22. Du, M.; Perry, R.L.; Nowacki, N.B.; Gordon, J.W.; Salma, J.; Zhao, J.; Aziz, A.; Chan, J.; Siu, K.M.; McDermott, J.C. Protein kinase A represses skeletal myogenesis by targeting myocyte enhancer factor 2D. Mol. Cell. Biol. 2008, 28, 2952–2970. [Google Scholar] [CrossRef] [Green Version]
  23. Nebbioso, A.; Manzo, F.; Miceli, M.; Conte, M.; Manente, L.; Baldi, A.; De Luca, A.; Rotili, D.; Valente, S.; Mai, A. Selective class II HDAC inhibitors impair myogenesis by modulating the stability and activity of HDAC–MEF2 complexes. EMBO Rep. 2009, 10, 776–782. [Google Scholar] [CrossRef] [PubMed]
  24. Della Gaspera, B.; Armand, A.-S.; Lecolle, S.; Charbonnier, F.; Chanoine, C. Mef2d acts upstream of muscle identity genes and couples lateral myogenesis to dermomyotome formation in Xenopus laevis. PLoS ONE 2012, 7, e52359. [Google Scholar] [CrossRef] [PubMed] [Green Version]
  25. Ouyang, H.; Yu, J.; Chen, X.; Wang, Z.; Nie, Q. A novel transcript of MEF2D promotes myoblast differentiation and its variations associated with growth traits in chicken. PeerJ 2020, 8, e8351. [Google Scholar] [CrossRef] [PubMed]
  26. Hooper, C.L.; Paudyal, A.; Dash, P.R.; Boateng, S.Y. Modulation of stretch-induced myocyte remodeling and gene expression by nitric oxide: A novel role for lipoma preferred partner in myofibrillogenesis. Am. J. Physiol. Heart Circ. Physiol. 2013, 304, H1302–H1313. [Google Scholar] [CrossRef] [PubMed] [Green Version]
  27. Feng, Y.; Ma, C.; Zhang, Y.; Yang, X.; Zhang, D.; Xie, M.; Li, W.; Wei, J. 3′ UTR SNPs in the LPP gene associated with Immunoglobulin A nephropathy risk in the Chinese Han population. Int. Immunopharmacol. 2019, 74, 105668. [Google Scholar] [CrossRef]
  28. Liu, L.; Yan, Y.; Liu, L.; Xue, N.; Dong, Y.; Yang, N.; Li, X. Loci associated with the chicken resistance to Salmonella enteritidis infection revealed by genome-wide association study. J. Vet. Med. Anim. Sci. 2020, 3, 1018. [Google Scholar]
  29. Suzu, S.; Hayashi, Y.; Harumi, T.; Nomaguchi, K.; Yamada, M.; Hayasawa, H.; Motoyoshi, K. Molecular cloning of a novel immunoglobulin superfamily gene preferentially expressed by brain and testis. Biochem. Biophys. Res. Commun. 2002, 296, 1215–1221. [Google Scholar] [CrossRef]
  30. Zhang, W.; Xu, J.; Li, H.; Zhou, L.; Nie, Q.; Zhang, X.; Luo, Q. The Low Expression of DUSP1 and HSPA5 Inhibits Chicken Immune Response and Causes Decreased Immunity under Heat Stress. Res. Sq. 2019. preprints. [Google Scholar]
  31. Xue, M.; Zhao, Y.; Hu, S.; Shi, X.; Cui, H.; Wang, Y. Analysis of the spleen proteome of chickens infected with reticuloendotheliosis virus. Arch. Virol. 2017, 162, 1187–1199. [Google Scholar] [CrossRef] [PubMed] [Green Version]
  32. Thanthrige-Don, N.; Abdul-Careem, M.F.; Shack, L.A.; Burgess, S.C.; Sharif, S. Analyses of the spleen proteome of chickens infected with Marek’s disease virus. Virology 2009, 390, 356–367. [Google Scholar] [CrossRef] [PubMed] [Green Version]
  33. Manjula, P.; Bed’Hom, B.; Hoque, M.R.; Cho, S.; Seo, D.; Chazara, O.; Lee, S.H.; Lee, J.H. Genetic diversity of MHC-B in 12 chicken populations in Korea revealed by single-nucleotide polymorphisms. Immunogenetics 2020, 72, 367–379. [Google Scholar] [CrossRef]
  34. Manjula, P.; Fulton, J.E.; Seo, D.; Lee, J.H. Major histocompatibility complex B variability in Korean native chicken breeds. Poult. Sci. 2020, 99, 4704–4713. [Google Scholar] [CrossRef]
  35. Mignon-Grasteau, S.; Boissy, A.; Bouix, J.; Faure, J.-M.; Fisher, A.D.; Hinch, G.N.; Jensen, P.; Le Neindre, P.; Mormede, P.; Prunet, P. Genetics of adaptation and domestication in livestock. Livest. Prod. Sci. 2005, 93, 3–14. [Google Scholar] [CrossRef]
  36. Jensen, P. Domestication—From behaviour to genes and back again. Appl. Anim. Behav. Sci. 2006, 97, 3–15. [Google Scholar] [CrossRef]
  37. Chen, Y.; Lan, Y.; Zhang, S.; Li, W.; Luo, Z.; Lin, S.; Zhuang, J.; Li, X.; Li, S.; Yang, J. ErbB4 signaling in the prelimbic cortex regulates fear expression. Transl. Psychiatry 2017, 7, e1168. [Google Scholar] [CrossRef] [Green Version]
  38. Fallahsharoudi, A.; de Kock, N.; Johnsson, M.; Bektic, L.; Ubhayasekera, S.K.A.; Bergquist, J.; Wright, D.; Jensen, P. QTL mapping of stress related gene expression in a cross between domesticated chickens and ancestral red junglefowl. Mol. Cell. Endocrinol. 2017, 446, 52–58. [Google Scholar] [CrossRef]
  39. Johnsson, M.; Williams, M.J.; Jensen, P.; Wright, D. Genetical genomics of behavior: A novel chicken genomic model for anxiety behavior. Genetics 2016, 202, 327–340. [Google Scholar] [CrossRef] [PubMed] [Green Version]
  40. Krizsan-Agbas, D.; Pedchenko, T.; Smith, P.G. Neurotrimin is an estrogen-regulated determinant of peripheral sympathetic innervation. J. Neurosci. Res. 2008, 86, 3086–3095. [Google Scholar] [CrossRef] [Green Version]
  41. Song, G.; Seo, H.W.; Choi, J.W.; Rengaraj, D.; Kim, T.M.; Lee, B.R.; Kim, Y.M.; Yun, T.W.; Jeong, J.-W.; Han, J.Y. Discovery of candidate genes and pathways regulating oviduct development in chickens. Biol. Reprod. 2011, 85, 306–314. [Google Scholar] [CrossRef] [Green Version]
  42. Liu, Z.; Yang, N.; Yan, Y.; Li, G.; Liu, A.; Wu, G.; Sun, C. Genome-wide association analysis of egg production performance in chickens across the whole laying period. BMC Genet. 2019, 20, 67. [Google Scholar] [CrossRef] [PubMed] [Green Version]
  43. Berglund, E.O.; Ranscht, B. Molecular cloning and in situ localization of the human contactin gene (CNTN1) on chromosome 12q11-q12. Genomics 1994, 21, 571–582. [Google Scholar] [CrossRef] [PubMed]
  44. Yin, Z.; Lian, L.; Zhu, F.; Zhang, Z.H.; Hincke, M.; Yang, N.; Hou, Z.C. The transcriptome landscapes of ovary and three oviduct segments during chicken (Gallus gallus) egg formation. Genomics 2020, 112, 243–251. [Google Scholar] [CrossRef] [PubMed]
  45. Chen, L.-R.; Chao, C.-H.; Chen, C.-F.; Lee, Y.-P.; Chen, Y.-L.; Shiue, Y.-L. Expression of 25 high egg production related transcripts that identified from hypothalamus and pituitary gland in red-feather Taiwan country chickens. Anim. Reprod. Sci. 2007, 100, 172–185. [Google Scholar] [CrossRef] [PubMed]
  46. Kleczkowska, P.; Lipkowski, A.W. Neurotensin and neurotensin receptors: Characteristic, structure–activity relationship and pain modulation—A review. Eur. J. Pharmacol. 2013, 716, 54–60. [Google Scholar] [CrossRef] [PubMed]
  47. Richards, M. Genetic regulation of feed intake and energy balance in poultry. Poult. Sci. 2003, 82, 907–916. [Google Scholar] [CrossRef]
  48. Zhang, T.; Chen, L.; Han, K.; Zhang, X.; Zhang, G.; Dai, G.; Wang, J.; Xie, K. Transcriptome analysis of ovary in relatively greater and lesser egg producing Jinghai Yellow Chicken. Anim. Reprod. Sci. 2019, 208, 106114. [Google Scholar] [CrossRef]
  49. Schmidinger, B.; Weijler, A.M.; Schneider, W.J.; Hermann, M. Hepatosteatosis and estrogen increase apolipoprotein O production in the chicken. Biochimie 2016, 127, 37–43. [Google Scholar] [CrossRef]
  50. O’sullivan, N.; Dunnington, E.; Siegel, P. Correlated Responses in Lines of Chickens Divergently Selected for Fifty-Six–Day Body Weight.: 1. Growth, Feed Intake, and Feed Utilization. Poult. Sci. 1992, 71, 590–597. [Google Scholar] [CrossRef]
Figure 1. Principal component analysis results for commercial (broilers and layers) chicken breeds (Ab, Arbor Acre broiler; CB, Cobb broiler; RS, Ross broiler; HL, Hy-line Brown layer; and LO, Lohmann Brown layer) and five Korean native chicken (KNC) lines (NG, grey–brown; NL, black; NR, red–brown; NW, white; and NY, yellow–brown). (A) Plot with principal component (PC) 1 and PC2. (B) Plot with PC1 and PC3. (C) Plot with PC1 and PC4.
Genes 12 00824 g001
Figure 2. Phylogenetic tree including commercial (broilers and layers) chicken breeds (Ab, Arbor Acre broiler; CB, Cobb broiler; RS, Ross broiler; HL, Hy-line Brown layer; and LO, Lohmann Brown layer) and five KNC lines (NG, grey–brown; NL, black; NR, red–brown; NW, white; and NY, yellow–brown).
Genes 12 00824 g002
Figure 3. Results of admixture analysis of commercial (broilers and layers) chicken breeds (Ab, Arbor Acre broiler; CB, Cobb broiler; RS, Ross broiler; HL, Hy-line Brown layer; and LO, Lohmann Brown layer) and five KNC lines (NG, grey–brown; NL, black; NR, red–brown; NW, white; and NY, yellow–brown).
Genes 12 00824 g003
Figure 4. Results of comparative selection signal analysis between commercial chickens (broilers and layers) and KNCs based on the extended haplotype homozygosity ratio between populations (Rsb) and the integrated haplotype homozygosity score (iHS). (A) Regions in the KNC population exhibiting selection signals based on the iHS. (B) Pairwise Rsb indicating selection signals in the KNC population vs. the broiler population. (C) Pairwise Rsb indicating selection signals in the KNC population vs. the layer population. Black lines indicate threshold at p < 0.01.
Genes 12 00824 g004
Figure 5. Heatmap of linkage disequilibrium blocks including the myocyte-specific enhancer-binding factor 2D (MEF2D) gene (Chr 25: 1,557,867–1,620,174 bp) in broilers and five KNC lines.
Genes 12 00824 g005
Figure 6. Selective sweep regions shared between commercial chickens and KNCs. (A) Commercial broilers and the KNC NW line. (B) Commercial layers and the KNC NL line. Black lines indicate shared selective sweep regions.
Genes 12 00824 g006
Table 1. Candidate gene lists of identified Rsb selection regions for 5 lines of Korean native chickens.
Comparison of PopulationCandidate Gene (Excluded Unknown Gene)Genes in High LD RegionQTL Name in High LD Region
LayerNGADGRL2/AHR/BANP/CACYBP/CADPS2/CD200/CHTOP/CNOT2/DOT1L/DPF3/DYNC1I1/ELF1/EPHA4/FBXW11/GRM8/HDAC9/HGFAC/HPCAL1/KCTD1/LOC112532947/MOB2/MYO18B/NARS2/OTUD7B/PAWR/PDE3A/PDLIM4/PDZRN3/PEBP1/PHF14/PLXNB2/POLA1/PPHLN1/RCOR1/RHOV/RNF216/RUNX1/SDHAF3/SLC15A4/SLC4A5/SNX13/TAOK3/UMAD1/UPK1B/USP15/WNT3A/YAP1UPK1B/IGSF11/DPF3/PPHLN1/PPHLN1/PRICKLE1Breast muscle pH
NLAEBP2/ANAPC4/B3GAT1L/CAMK2G/CHAT/CNOT2/DDX10/DIAPH3/DSCAM/ELF1/GALNT7/GALNTL6/KCTD1/LSAMP/MAP4K4/MYBPC1/PDE3A/PDK3/PHF14/PLXNB2/POLA1/PTK2/QTRT2/RAP1B/RAPGEF5/SEPSECS/SLC36A4/SNX13/SRRM1/STIM2/TBC1D19/TDRD3/TMEM245/UPK1B/USP15/VWA8/WASL/WNT3A/ZMIZ1--
NRA4GNT/AGR2/ANKMY2/ANKRD28/BARX1/C1QTNF4/CELF1/CLASP1/CNTN5/CYP24A1/DIRC2/EP400/GALNTL6/GPR83/GRM8/IL1RAPL1/KAT2B/MAP4K4/MEOX2/MSRA/PAXIP1/PLXNB2/RAPGEF5/RPAP1/RYK/SDHAF3/SNX13/SPON1/STIM2/STK25/SYT10/TBC1D5/TOP2B/TSPAN7/USP25/WNT7A--
NWADCY9/AIFM3/ASB4/C22H2ORF42/CHN1/DDIAS/DPF3/DYNC1I1/EED/ELF1/EXT1/FSHR/GEMIN8/GPR158/HYAL6/IL1RAPL1/INO80/KIAA1217/LOC101751443/MCM5/ME3/MIPEP/MIR6672/NARS2/NOX4/OTUD7B/PDK3/POLA1/PRCP/RBFOX1/RGS6/SAT1/SDHAF3/SIPA1L1/SOSTDC1/STK3/SV2B/SYT1/TOP2B/TSPAN33/TSPAN7/TYRO3/UBE3B/UMAD1/USP15/VRK2/WDYHV1/YAP1/ZHX1/ZHX2SIPA1L1/SV2B/SDHAF3/NOX4Fear—tonic immobility duration, breast muscle pH, feather-crested head, pH of digestive tract contents, tibia length, dry matter intake, feed intake, albumen height
NYA1CF/AIFM3/AMBRA1/ANKRD33B/APPBP2/BRIP1/C22H2ORF42/CAMK2G/CERS6/CHN1/CREB3L1/CRIM1/DNAJC5/FBXW11/GALNTL6/GPR78/HTRA3/IGF2BP3/IL1RAPL1/KCTD1/KLHL41/LHX1/LRP2/LYPLAL1/MCM5/NEK6/PDE3A/PRPF6/RHOV/RNASEH2B/SERPINE3/SLC15A4/STIM2/STK3/TMEM132B/TTC3/VRK2/WASL/WDYHV1/ZFX/ZHX2--
BroilerNGACSBG2/AGRN/BMT2/CABIN1/CASTOR2/CNOT2/CNTN1/COMMD1/CUX1/DTNA/FARP2/FBXO42/GNA11/GPR132/HIF1A/INTS4/KCNC2/LOC112533299/MAP3K20/MIR6680/MOB1A/MOB2/MXD1/MYH10/NTSR1/OGFR/OTUD7B/P2RY8/PIAS4/PTPRF/PTPRT/PTTG1IP/RHOB/S100A6/SLCO4A1/TACR1/ZAP70/ZNF277CNTN1/NTSR1/MEF2DBreast muscle pH, feed conversion ratio, comb weight, wattles weight, ileum weight
NLADIPOQ/ANAPC10/AUTS2/CDK8/CELF1/CNOT2/EFL1/GAB1/GAP43/GRID1/IGSF11/IL6/KCNC2/LMNB2/LOC112533299/LSAMP/MARCH2/MPRIP/MTFR1L/MYH10/PROM1/PTK2/PTP4A3/PTTG1IP/RUNX3/S1PR4/SLC10A7/SLC38A1/SNCG/SPON1/TDRD3/TTC32MEF2D/LMNB2/LONP1/SLC1A6/RANBP3/KLHL33/NDUFA11/BTN1A1Feed conversion ratio, cecal bacterial burden after challenge with Salmonella T, ileum weight, comb weight, wattles weight
NRA4GNT/ADD2/ALG10/ALKBH8/BICD1/C23H1ORF94/CABIN1/CELF1/CELSR1/CHMP4B/CPNE8/DMD/DVL1/FARP2/HDGFL1/IGSF3/IKZF2/LOC396098/LOC419409/MIR6680/MYH10/PTPRN2/PTTG1IP/RARB/SEMA5B/SINHCAF/SPDYA/TBC1D22A/TMTC1/TNRC6C/TOP1/TSPAN7HDGFL1/RRNAD1/CRABP2/LOC425431/BCAN/HAPLN2/RHBG/MEF2DFeed conversion ratio, cecal bacterial burden after challenge with Salmonella T, ileum weight, comb weight, wattles weight
NWCABIN1/CHD2/CNOT2/DMD/EIF2S3/ERBB4/GABRB2/HNRNPDL/INTS4/JMJD1C/KCNC2/LOC101751443/LOC112533299/MIR6672/MYO7A/NTM/OFD1/OTUD7B/PAK1/PDK3/POLA1/PRKCD/SLC38A1/SPON1/ZAP70EIF2S3/APOO/MEF2D/POLA1/ERBB4/GABRB2/NTM/MIR1601Egg number, ovary weight, age at first egg, fear—tonic immobility duration, feed conversion ratio, feather pecking, testes weight
NYCDC42BPA/CEBPG/CHMP4B/COX10/DSCAM/EPHB2/FAM18B1/FGFRL1/IKBKE/JMJD1C/KCNJ9/KIF16B/MRGBP/MYH10/PROM1/PURG/RAB18L/RIC3/SNRPB2/SSH2/STX8/ULK2MEF2DFeed conversion ratio, ileum weight, comb weight, wattles weight
Table 2. Candidate gene lists of identical iHS selection regions for commercial and 5 lines of Korean native chickens.
Comparison of PopulationChromosomeCandidate GeneQTL Name in Shared Selective Sweep Region
LayerNG8, 9, 19ACSL3/DTX2/ENSGALG00000045942/ENSGALG00000037501/SSC4D/ENSGALG00000017358/ENSGALG00000001926/SRRM3/MDH2/TMEM120A/ENSGALG00000002053/TAF15Feathered feet, wattles weight, fecal egg count, feed intake, feather pecking, alternative complement activation by BRBC, feed conversion ratio
NL3, 6, 11, 12, 14, 15CUZD1/C10orf88/SFMBT1/LMF1/ENSGALG00000006648Abdominal fat percentage, breast muscle weight, age at sexual maturity, ovary weight, ovary percentage, breast muscle pH, feed intake, dry matter intake, jejunum weight, feathered feet, wattles length, body weight (36 days), body weight, ileum length, body temperature
NR8, 11, 18ENSGALG00000005377Feathered feet, breast muscle pH, dry matter intake, jejunum weight, feed intake, body weight (hatch)
NW---
NY2, 11, 14, 21, 22, 28ADGRB1/ENSGALG00000032326/LMF1/KIF1B/ENSGALG00000002797/ENSGALG00000024481/DFFA/PEX14/DOT1LWattles weight, breast muscle pH, feed intake, dry matter intake, jejunum weight, wattles length, body weight (36 days), body weight, gizzard weight, antibody titer to SRBC antigen, abdominal fat weight, breast muscle percentage, feather-crested head, gizzard percentage, eggshell color, small yellow follicle number, ovary weight, body weight (hatch)
BroilerNG7, 14, 24, 25SESTD1/ENSGALG00000004398Ovary weight, comb weight, body temperature, wattles length, breast muscle pH, fear—tonic immobility duration, feed conversion ratio, wattles weight
NL---
NR5RASGRP1/FAM98B-
NW1, 7, 14, 18, 24, 25ENSGALG00000001183/ENSGALG00000028706/ENSGALG00000024141/ENSGALG00000039987/ENSGALG00000028843/ENSGALG00000040425/ENSGALG00000045923/ENSGALG00000045397/ENSGALG00000037114/ENSGALG00000030308Breast muscle pH, ovary weight, comb weight, body weight (56 days), shank length, body temperature, wattles length, ileum weight, fear—tonic immobility duration, feed conversion ratio, wattles weight
NY7, 10, 14, 27ENSGALG00000033329/ENSGALG00000007687/ENSGALG00000004398/WNT9B/ENSGALG00000001079/ENSGALG00000001055Ovary weight, comb weight, body temperature, wattles length, wattles weight, pH of digestive tract contents, egg production rate
Publisher’s Note: MDPI stays neutral with regard to jurisdictional claims in published maps and institutional affiliations.