1. Introduction
Glaucoma is a group of eye diseases that damages the optic nerve and is the leading cause of irreversible blindness worldwide [
1]. Glaucoma is caused by multiple risk factors—such as high intraocular pressure (IOP), high blood pressure, diabetes, and genetic predisposition [
2]. During advanced glaucoma, blurred vision is induced by the degeneration of retinal neurons and the death of retinal ganglion cells (RGCs). RGCs are diverse and differ in their “physiological roles exhibiting varied responses to visual stimuli,” containing multiple subtypes [
3]. Since the mechanisms leading to the RGC degeneration are unclear, there are no known treatments to reverse this irreversible vision loss. Supplementary treatments are quite limited and range from pharmacological to surgical mitigation of intraocular pressure, such as eye drops, laser surgery, trabeculoplasty, etc. [
4]. Due to this complex and temporary rescue, researchers are looking for other pathways that may provide promising and permanent treatments. Scientists have recently explored using induced pluripotent stem cells for modeling glaucoma in a dish and for studying glaucomatous degeneration [
4]. Stem cells have self-regeneration ability and improved differentiation methods to generate highly purified and functional induced pluripotent stem cell derived RGCs (iPSC-RGCs) are essential for studying RGC cell diversity [
3,
5]. However extensive classification of human RGC subtypes has not been performed due to limited availability of human retinal tissues and very few studies on characterizing molecular signatures in iPSC-RGCs.
The use of single-cell sequencing technology can help with identifying smaller distinct cell populations and outline cell maps. The advantage of single-cell transcriptomics compared to conventional bulk-RNA Seq methods is that unique markers can be found in many unknown cell subtypes [
6]. RNA-sequencing methods include the isolation of a single cell (scRNA-seq) from a group of cells, followed by RNA extraction and amplification, and later processing to study cell mapping, cell segregation and cell classification [
7]. In addition to scRNA-seq analysis, clustering approaches are crucial in classifying cells based on their differential gene expression profiles. More recently, various clustering approaches, such as hierarchical clustering, K-means clustering, SNN-Cliq, pcaReduce, SC3, Seurat, SCANPY, RCA, and dropClust, were used to separate single cells based on differential gene expression and similarity [
8].
Methods have been published over the past few years trying to modify RNA-seq approaches to capture more information and identify molecular biomarkers. Some studies have focused on performing single-cell RNA-Seq in the vertebrate retina to understand cell populations of the central nervous system. One study analyzed murine bipolar cell markers from microarray hybridization to RNA-Seq to study their evolution, providing “a more in-depth examination of larger numbers of cells at a decreased cost” [
9]. In addition, other researchers have utilized other techniques such as FAC-Sorting, imaging analyses, and electrophysiology for improved cell examination [
9]. By finding expressed genes in populations of Parvalbumin-expressing cells, researchers detected possible candidates for ipRGC classification such as
Prph,
Ctxn3, and
Prkcq in RGCs derived from embryonic stem cells [
9]. A recent study also summarized the complexity of retina and pluripotent stem cell derived retinal organoids with single cell RNA sequencing [
10]. This methodology uses a combination of single-cell profiling, hierarchical clustering, and statistical analysis. Although these techniques have made great strides in determining numerous RGC subtypes, many challenges remain in the preparation of cells leading up to sequencing. One standardized method of RGC isolation involves isolating cells from Retinal Organoids using manual dissociation methods and using hierarchical clustering for cell classification. Such methods may introduce loss of mRNA, increase stress among cells and produces tissue damage during cell preparation and cause disruption of neuronal activity [
6]. Validation of such data to find correlation of a genetic marker to a functional phenotype is often challenging [
6].
To further understand the subtypes of RGCs and determine if we can differentiate iPSCs into RGC subtypes, we performed single-cell sequencing on purified and functional iPSC-RGCs obtained from a standardized two-step RGC differentiation protocol [
5]. To address shortcomings from previous methods, our protocol takes a holistic approach to identify marker genes, differential gene expression and retinal ganglion cell (RGC) subtypes in human iPSC-RGCs with minimal disruption. Specifically, by using 10X Genomics, single-cell RNA sequencing and Chromium Single Cell 3′ library preparation, we analyzed transcriptomes on a cell-to-cell base level. This then helped in identifying unique, modern-based markers to discern RGC subtypes within our iPSC-RGC clusters. Identifying the genes that code for these RGC specific subtypes will allow for better comprehension of the diversity within the retina [
3]. Further characterization of iPSC-RGC subtypes will deepen our understanding of how these cells differ and how they are “affected in disease states” and under different experimental conditions.
2. Materials and Methods
Differentiation of iPSC-RGC cultures: Our lab has a repository of human iPSCs that were generated from keratinocytes or blood cells via polycistronic lentiviral transduction (Human STEMCCA Cre-Excisable constitutive polycistronic (OKS/L-Myc) Lentivirus Reprogramming Kit, Millipore) and characterized with a hES/iPS cell pluripotency RT-PCR kit [
11]. The RGCs for our studies were derived using small molecules to inhibit BMP, TGF-β (SMAD) and Wnt signaling to differentiate retinal ganglion cells (RGCs) from iPSCs. The iPSCs were differentiated into pure iPSC-RGCs cells with structural and functional features characteristic of native RGC cells as described previously in Chavali et al., 2020, by Day 36 of differentiation [
5]. iPSC-RGCs were further matured and used for single-cell sequencing studies at Day 40.
FACS analysis: iPSC-RPCs and iPSC-RGCs cultures were lifted using TrypLE Express (Invitrogen, catalog #: 12605-010, Waltham, MA, USA) and collected by centrifugation at 1600 rpm for 5 min at 4 °C. The pelleted cells were resuspended in 1X PBS supplemented with 0.5% bovine serum albumin and 0.1% sodium azide (FACS buffer). Cells were fixed in 4% paraformaldehyde (PFA) (v/v) for 15 min at room temperature (RT) followed by permeabilization using 0.5% Tween-20 (v/v) for 10 min at RT. Cells were incubated with various antibodies: anti- Ki67/MK167 (Novus Biologicals, catalog #: NB500-170SS, Centennial, CO, USA), anti-Chx10 (Millipore, catalog #: AB9016, Burlington, MA, USA), anti-CD90 (Thy1; Novus Biologicals, catalog #: AF2067, Centennial, CO, USA), anti-sheep Alexa Fluor 405 (abcam, catalog #: ab175676, Cambridge, MA, USA), anti-BRN3 Alexa Fluor 594 (Santa Cruz, catalog #: sc-390780, Santa Cruz, CA, USA), anti-SNCG Alexa Fluor 488 (Santa Cruz, catalog #: sc-65979, Santa Cruz, CA, USA), and anti-RBPMS Alexa Fluor 647 (Novus Biologicals, catalog #: NBP273835AF647, Centennial, CO, USA). Stained cells were analyzed using LSR B and LSRFortessa B at Penn Cytomics and Cell Sorting Resource Laboratory. Data were further analyzed using the FCS Express software.
Single Cell Preparation of iPSC-RGCs: The iPSC-RGCs at Day 40 grown on 10 cm Matrigel coated plates were dissociated by incubation with 5 mL of Accutase (Millipore Sigma, Cat #A6964, Burlington, MA, USA) for 10 min. The cell suspension was centrifuged at 300× g for 5 min and the cell pellet was washed with 1X HBSS before suspending them in 1X PBS with 0.04% BSA. Single cell suspension was prepared by mixing the cells gently using a wide-bore glass tip and the cell count was determined using Countess II automatic cell counter (Life Technologies, Carlsbad, CA, USA). Single cells in suspension were also analyzed for their viability using a hemocytometer and Trypan Blue staining.
Generation of single cell gel beads in emulsion (GEM) and Sequencing libraries: Single cell suspensions of mature and functional iPSC-RGCs at day 40 were diluted to required concentrations and loaded onto 10X Genomics Single Cell 3′ Chips as per Chromium Single Cell 3’ V3 kit following manufacturers protocol. Single cells were partitioned using chromium controller (10X Genomics) into GEMs containing unique barcoded primers with unique molecular identifier (UMI), followed by cell lysis, reverse transcriptase (RT), amplification of barcoded cDNA and fragmentation to nearly 200 bp and sample indexing. cDNA libraries were quantified using the KAPA library Quantitation kits following manufacturer’s instructions (KAPA Biosystems, Wilmington, MA, USA).
Single Cell Data Sequencing and Data Analysis: Sequencing libraries were prepared from 8008 cells and were run on Illumina Novaseq 6000 in two lanes to generate 150 PE reads. The CellRanger 4.0.0 pipeline (10X Genomics) analysis was used to demultiplex raw base calls from FASTQ files, performs alignment, filtering, barcode and unique molecular identifier (UMI) counting. The demultiplex FASTQ files were mapped to the hg38 ref genome using STAR package. The output from 10X Genomics Cellranger 4.0.0 pipeline was used as input into the R analysis package Seurat version 3.2.2. Cells with high unique molecular index counts (nUMI), high mitochondrial transcript load were filtered out from the analysis. The data were then normalized, scaled, and explored using Seurat’s recommended workflow. Principal component analysis (PCA), Louvain clustering, and the Uniform Manifold Approximation and Projection (UMAP) were performed. Normalized gene expression was obtained by LogNormalize in Seurat using a scale factor of 10,000 in which feature counts for each cell were divided by the total counts for that cell and multiplied by the scale factor. The value was then transformed to natural-log using log1p. We performed cluster-to-cluster differential expression of the formed clusters and tested using the Wilcoxon-Rank Sum to identify unique gene markers for each cluster. QC analysis was performed after aggregating datasets in both lanes by removing the reads corresponding to ribosomal (>50%) and mitochondrial genes (>20%), as well as cells that had a mean absolute deviation (MAD) lower than 1X. Sub-populations of single cell clusters were identified using unsupervised clustering. Differential expression gene (DEG) analysis of the identified clusters was performed to characterize subsets of RGCs and their markers in the iPSC-RGCs. Gene expression patterns for marker genes among clusters was also performed.
4. Discussion
The iPSC derived RGCs will serve as unique cellular model systems to study the pathobiology of RGCs in conditions of ganglion cell loss like optic neuritis and primary open angle glaucoma. Our unique iPSC-RGC differentiation strategy involves two stages where iPSCs are initially differentiated to RPCs and then to RGCs [
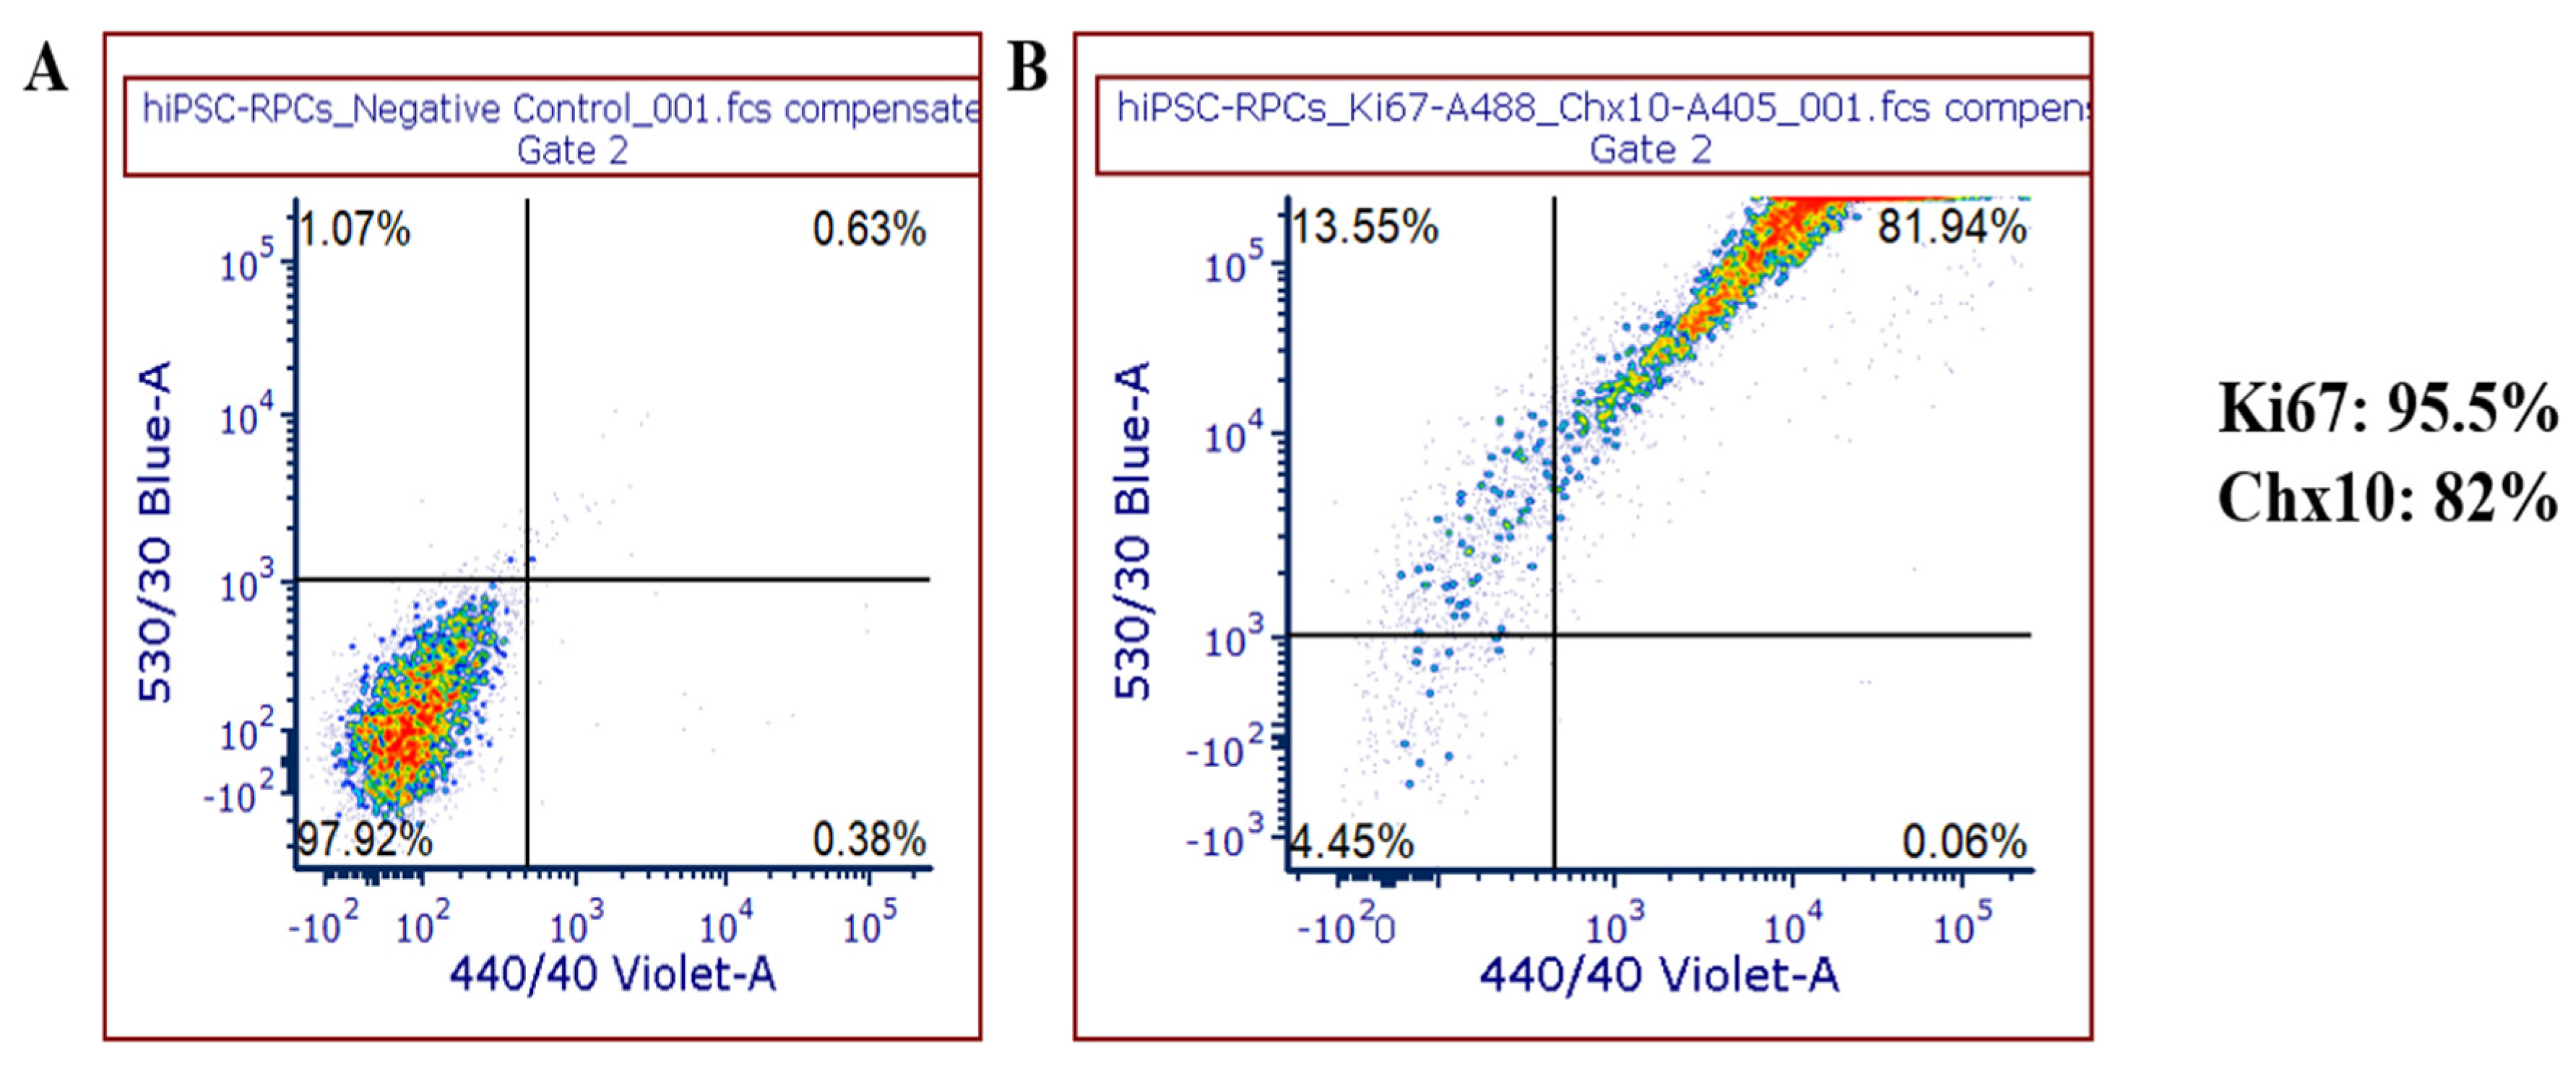
5]. The RPCs generated in our protocol showed highest amounts of expression for Ki67+ and Chx10+ markers by flow cytometry, which is a characteristic of proliferative cells. Expression of these markers in addition to
RAX, CRX and
PAX6 marker expression confirms the photoreceptor precursor identity of these cells [
5]. iPSC-RGCs generated from our protocol form extensive neurite projections and axonal bundles with cell bodies as early as Day 2 after crosshatching (Day 26) in the maturation media. Less than 5% of the differentiated neuroretinal progenitor cells appear to regain differentiation through mitosis in the late stages of iPSC-RGC maturation (after Day 40). Preliminary studies in our lab have shown that using anti-mitotic inhibitors like AraC prevented the growth and proliferation of these mitotic cells, thus promoting iPSC-RGC purity and maturation [
21]. Inhibition of SMAD and Wnt pathways generated enriched iPSC-RGC populations showing electrophysiological response like functional RGCs by Day 35.
The differentiated iPSC-RGCs consist of several RGC subtypes which can be identified based on their gene expression profiles, electrophysiology and morphology. Recent studies also showed differences in the susceptibility and resistance of iPSC-RGC subtypes to insults [
17,
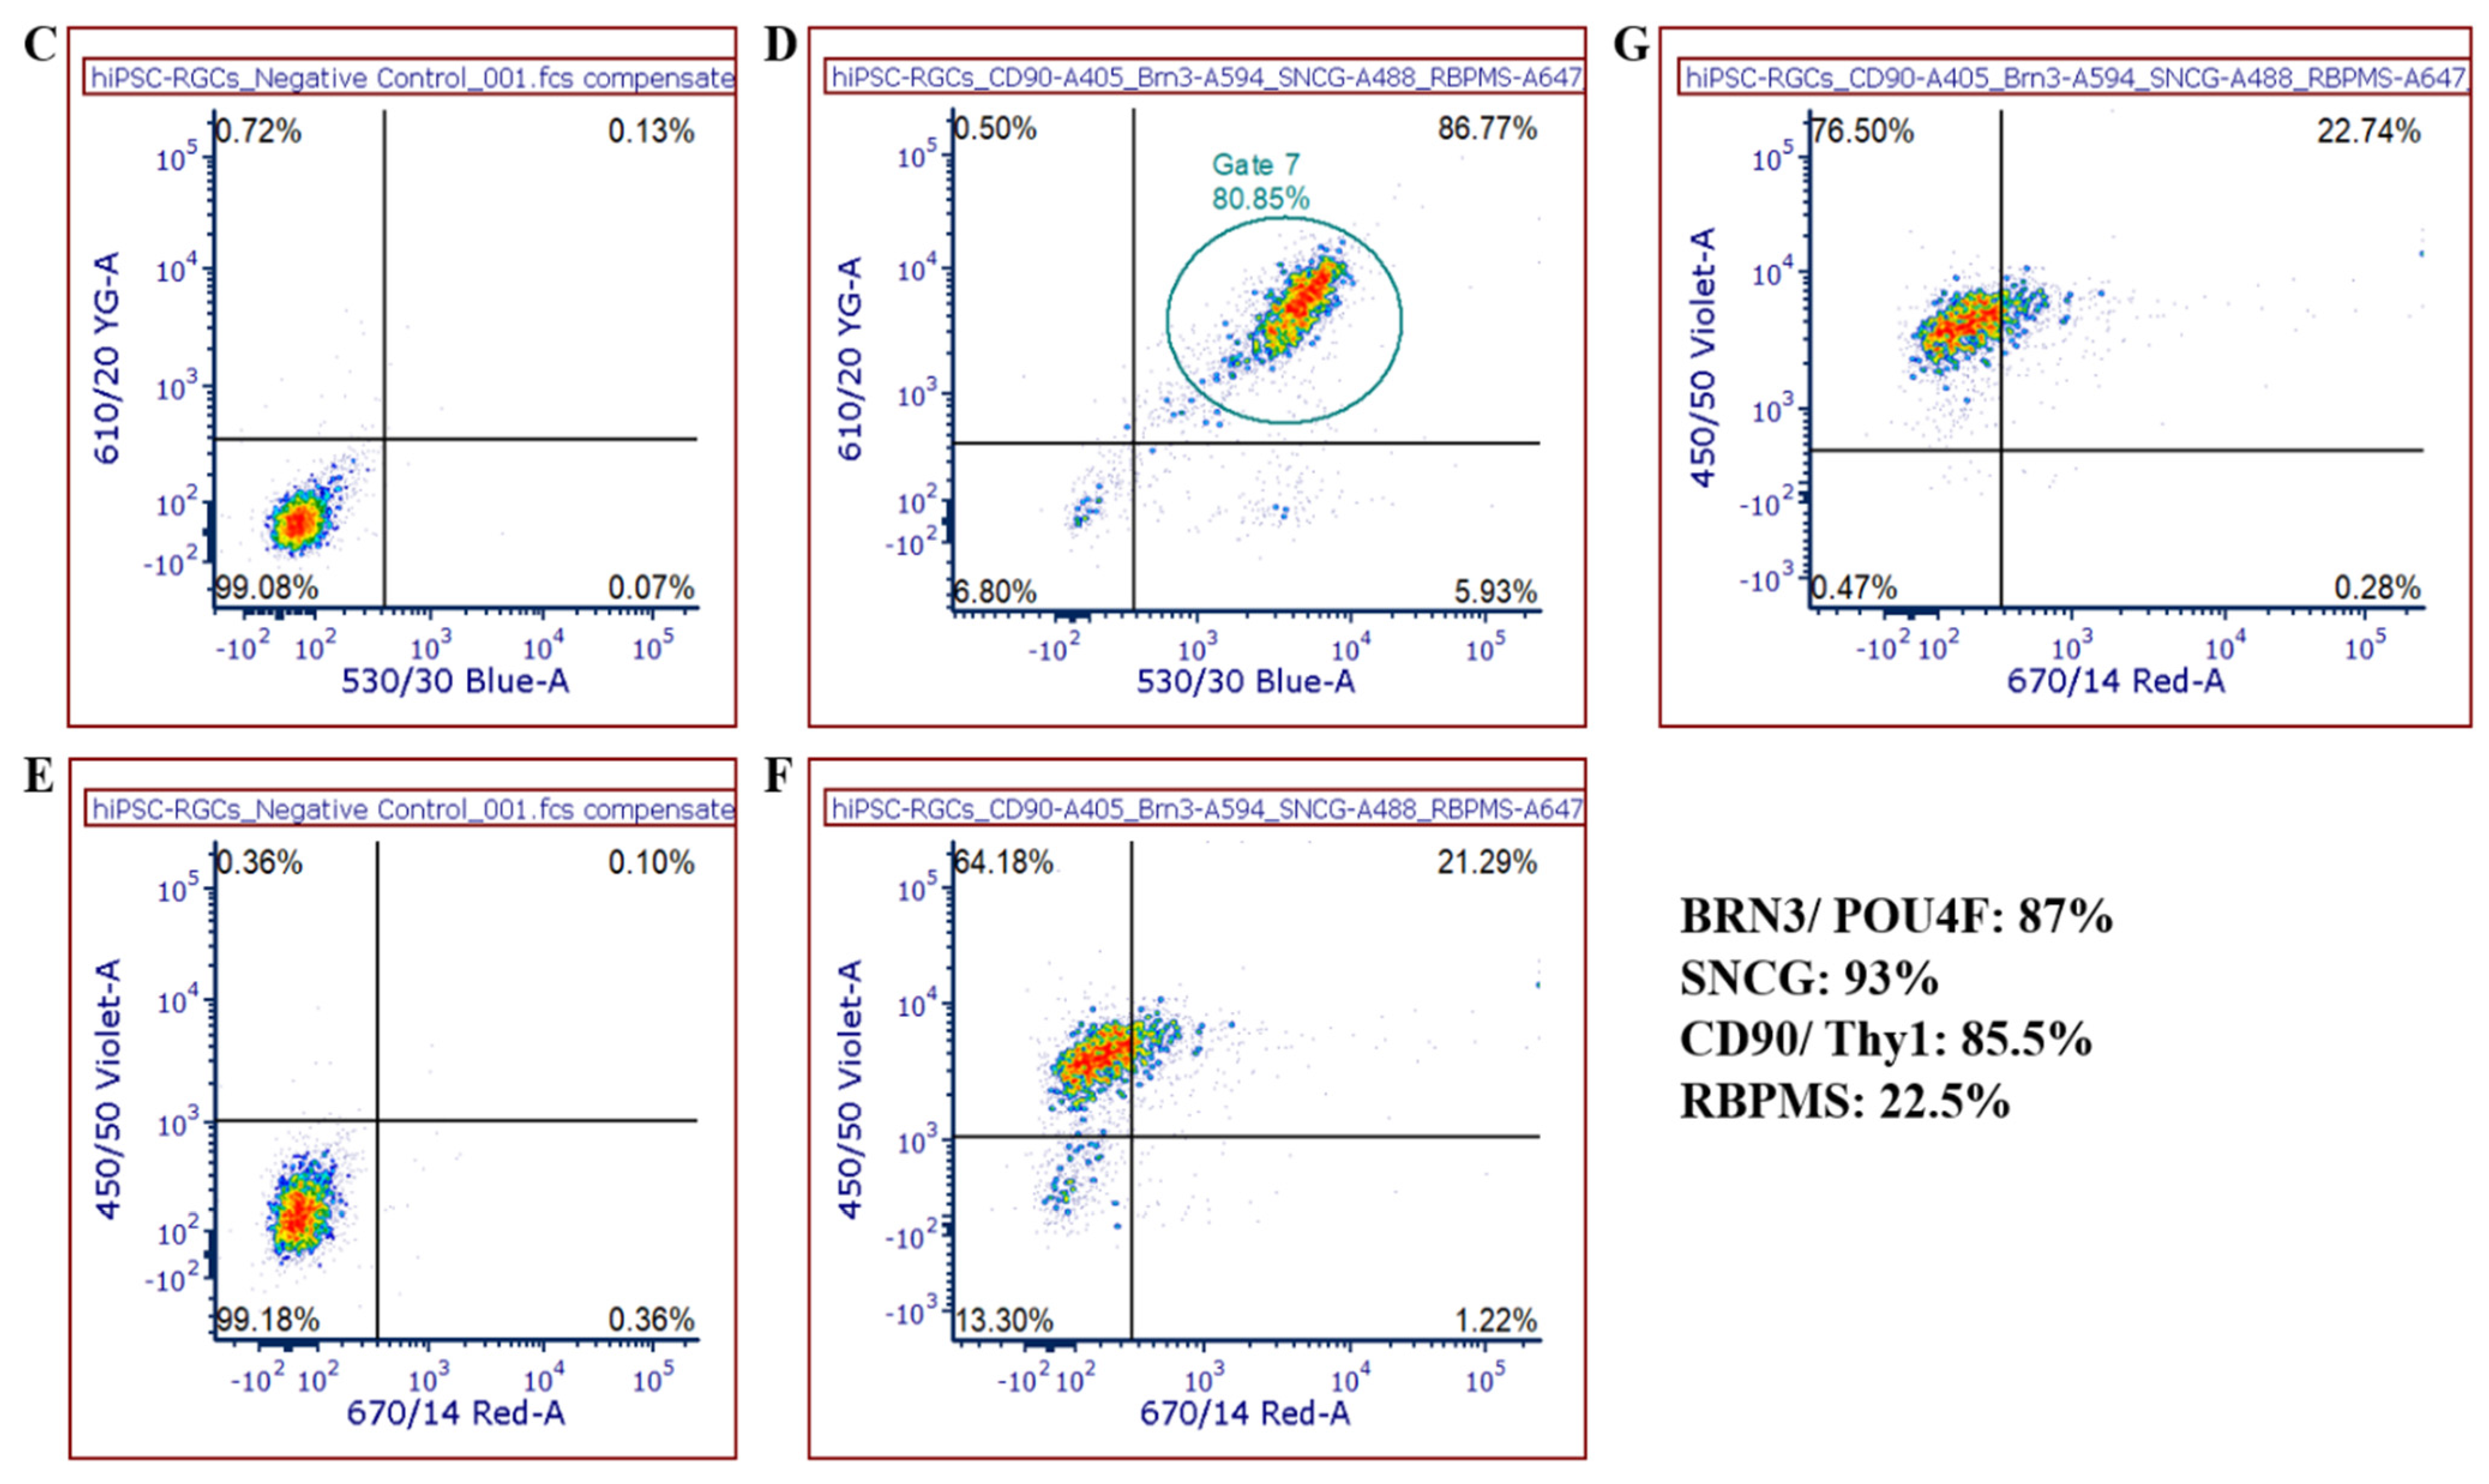
22]. iPSC-RGCs exhibit unique gene expression markers that distinguishes them from other retinal subtypes and serve as molecular biomarkers. We demonstrate that iPSC-RGCs can be identified by expression of high amounts of
BRN3B,
THY1, and
SNCG markers with over 85% of iPSC-RGCs staining for all three markers. Like other reported studies, we found that our iPSC-RGC populations express low levels of RBPMS [
3]. Hence, staining with RBPMS is not recommended for assessing percentages of mature RGCs from differentiation. Although RBPMS is considered a pan-RGC marker, its role in RGCs suggests that it may be an excellent marker for RGCs during degeneration [
23]. Increased expression of RGC markers shows that our differentiation methodology yields high percentage of mature iPSC-RGCs.
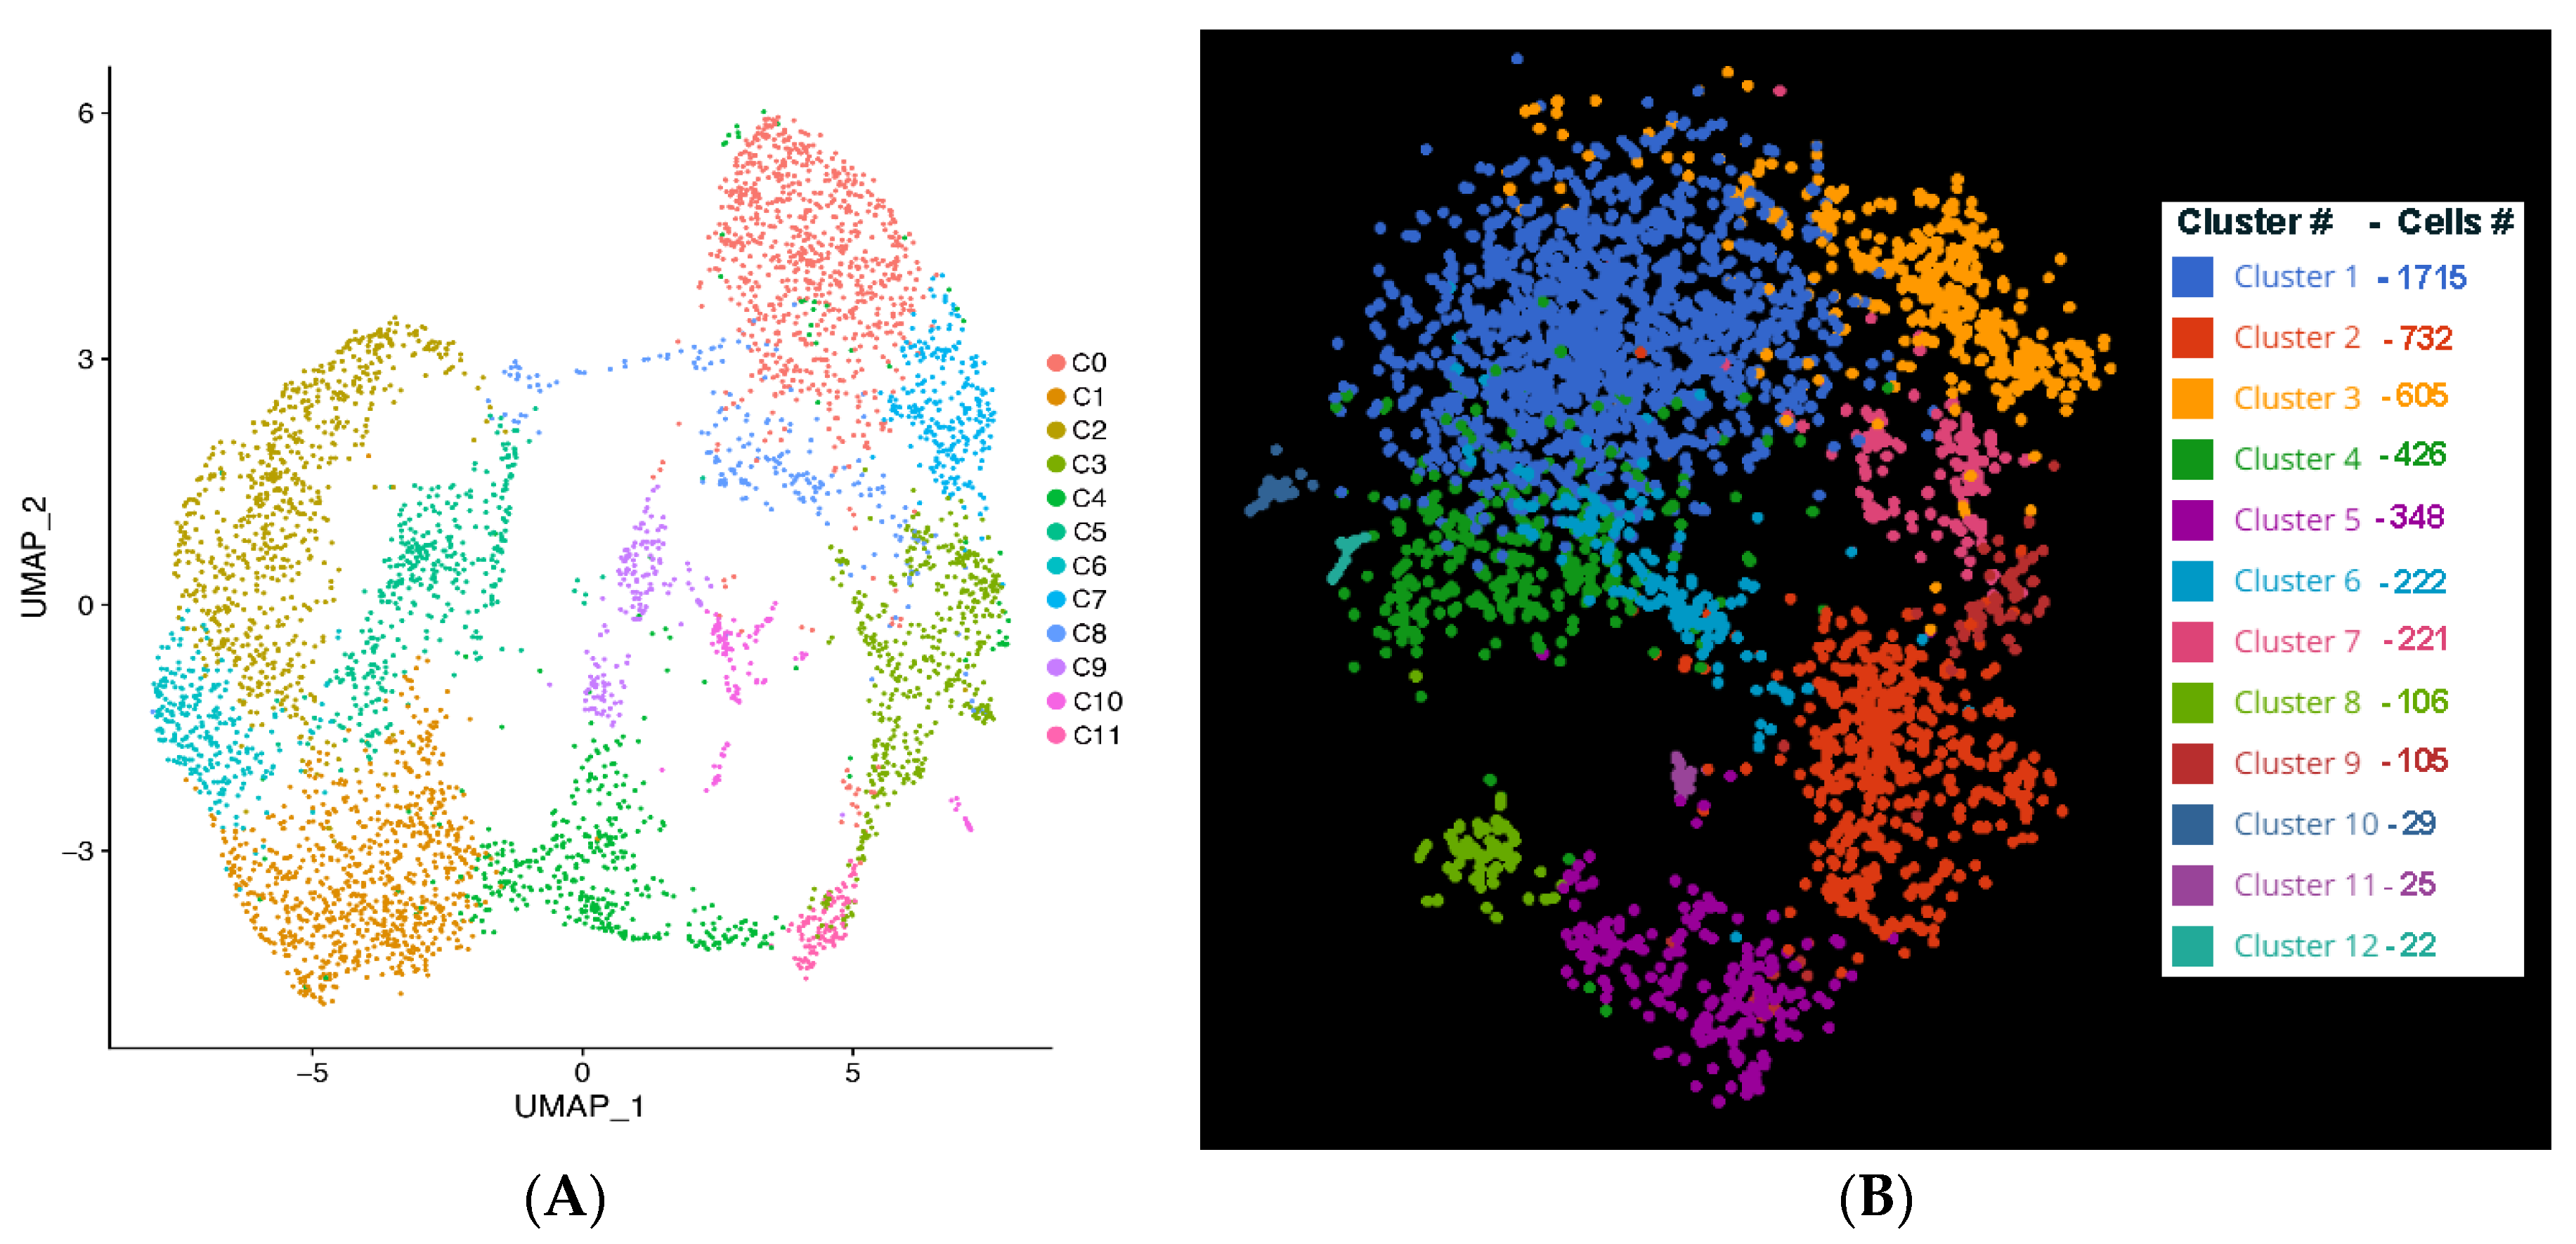
The clustering software used in our study (either with UMAP using Seurat or Louvain clustering in BBrowser2 software) segregated iPSC-RGCs into 11 clusters based on DEGs [
12]. Clusters with higher expression of RGC marker genes are predominant among all clusters indicating that differentiated iPSC-RGCs cells belong to RGC lineage. SRCCA analysis showed that majority of the iPSC-RGC clusters reported high expression of RGC specific genes like
MAP2,
GAP43,
STMN2, and
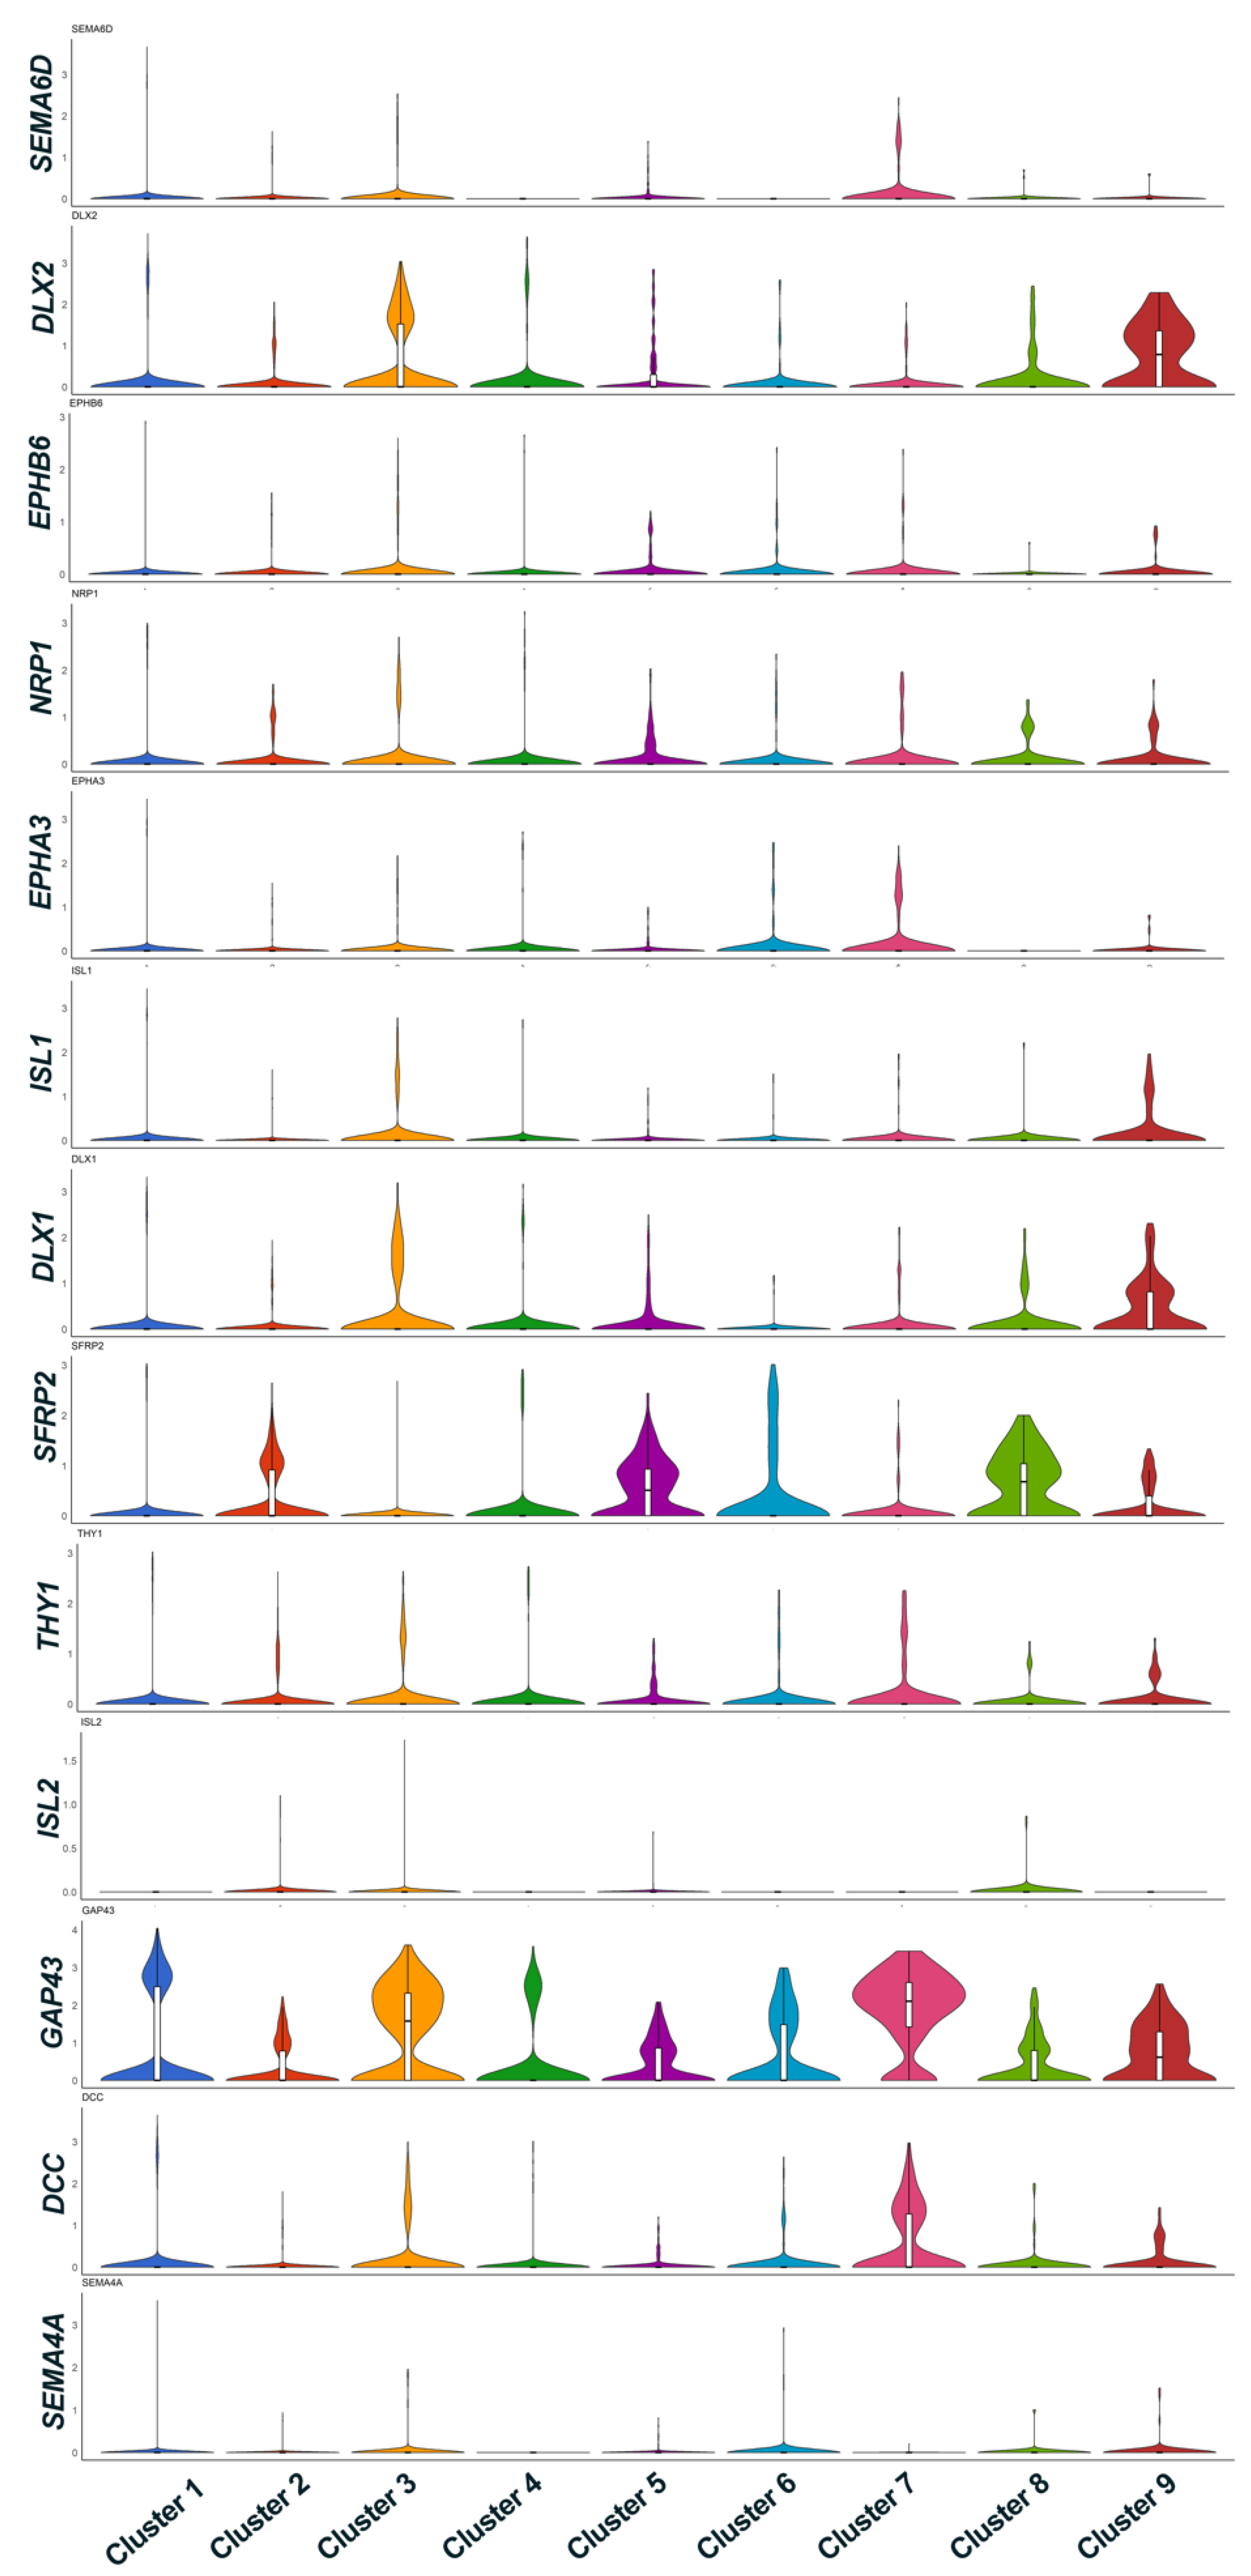
STMN3. Genes expressed in other clusters play a role in cell adhesion, neuronal cell migration, neuronal maturation, RGC lineage commitment and retinal axonal interaction. Expression of RGC characteristic genes like
RBPMS,
SNCG and
ISL1 are expressed with a lesser intensity indicating that varied transcript expression in iPSC-RGCs may be characteristic of RGC subtypes. Violin plot representation of maturation markers and axon representative genes showed cluster specific differential expression of genes for genes related to RGC axon interaction (
GAP43), axon guidance and survival (
SEMA6D and
DCC genes). Genes that are known to regulate Brn3B expression are also differentially expressed in selective clusters (
DLX1 and
DLX2). Clusters with DEG (up/down-regulation) related to maturation markers and axon extension reveal the diversity of RGC subtypes. The RGC subtype classification in humans is poorly understood. A recent study on human iPSC-RGCs using single-cell qRT-PCR for known RGC- and RGC-subtype-specific markers, reported expression of transcripts corresponding to DS-RGCs, α-RGCs, and IP-RGCs [
3]. In our study, we determined that majority of the iPSC-RGC belonged to ON–OFF direction select RGCs along with few RGC subtypes showing greater heterogeneity among RGC clusters. We also observed the presence of ON- and OFF-RGC subtypes segregated into few clusters indicating that differentiated clusters comprised of more than one RGC subtype.
GO analysis of markers genes for individual clusters showed that iPSC-RGC cells in these clusters are enriched for processes responsible for neuronal transport, axonogenesis and neuronal function. Only a few cells in Clusters 5, 7 and 8 showed marker genes for that enriched for cell division, chromatin remodeling and glial cell development. These clusters may have some cells RPCs or immature cells with neuronal origin as evidenced by the expression of SFRP2 in these clusters.
Strengths of our study include using highly purified unmodified iPSC-RGCs with little processing from a 2D culture with high viability before single cell sorting and RNA sequencing. A limitation of our study is that we classified iPSC-RGCs subtypes only based on expression of subtype specific molecular markers and their segregation in clusters based on gene expression. However, further characterization of RGC subsets using electrophysiology (functional) and dendritic branching (phenotypic) is warranted to identify RGC subtypes. However, future studies in our lab are aimed at further characterizing RGC subtypes based on DEG expression using qRT-PCR and immunohistochemistry. Additionally, transcriptome data from day 40 will be compared with single sequencing data obtained from iPSC-RGCs matured until days 74 and 110. Future studies must analyze the susceptibility of iPSC-RGC subtypes to oxidative stress, senescence, and excitotoxicity. DEGs associated with these induced conditions will identify RGC subtype specific expression/response/resistance to these induced conditions. The well-characterized iPSC-RGCs with a specific subtype susceptible for excitotoxicity and oxidative stress can be used as a promising cell based therapeutic approach to treat glaucoma by replacing degenerating RGCs with iPSC-RGCs in models of induced ganglion cell loss. Our studies will unravel pathways and mechanisms leading to ganglion cell loss and inform novel strategies for neuroprotection for all RGC subtypes.


