
Comparative Phylogeography and Phylogeny of Pennah Croakers (Teleostei: Sciaenidae) in Southeast Asian Waters


Abstract
1. Introduction
2. Materials and Methods
2.1. Ethical Statement
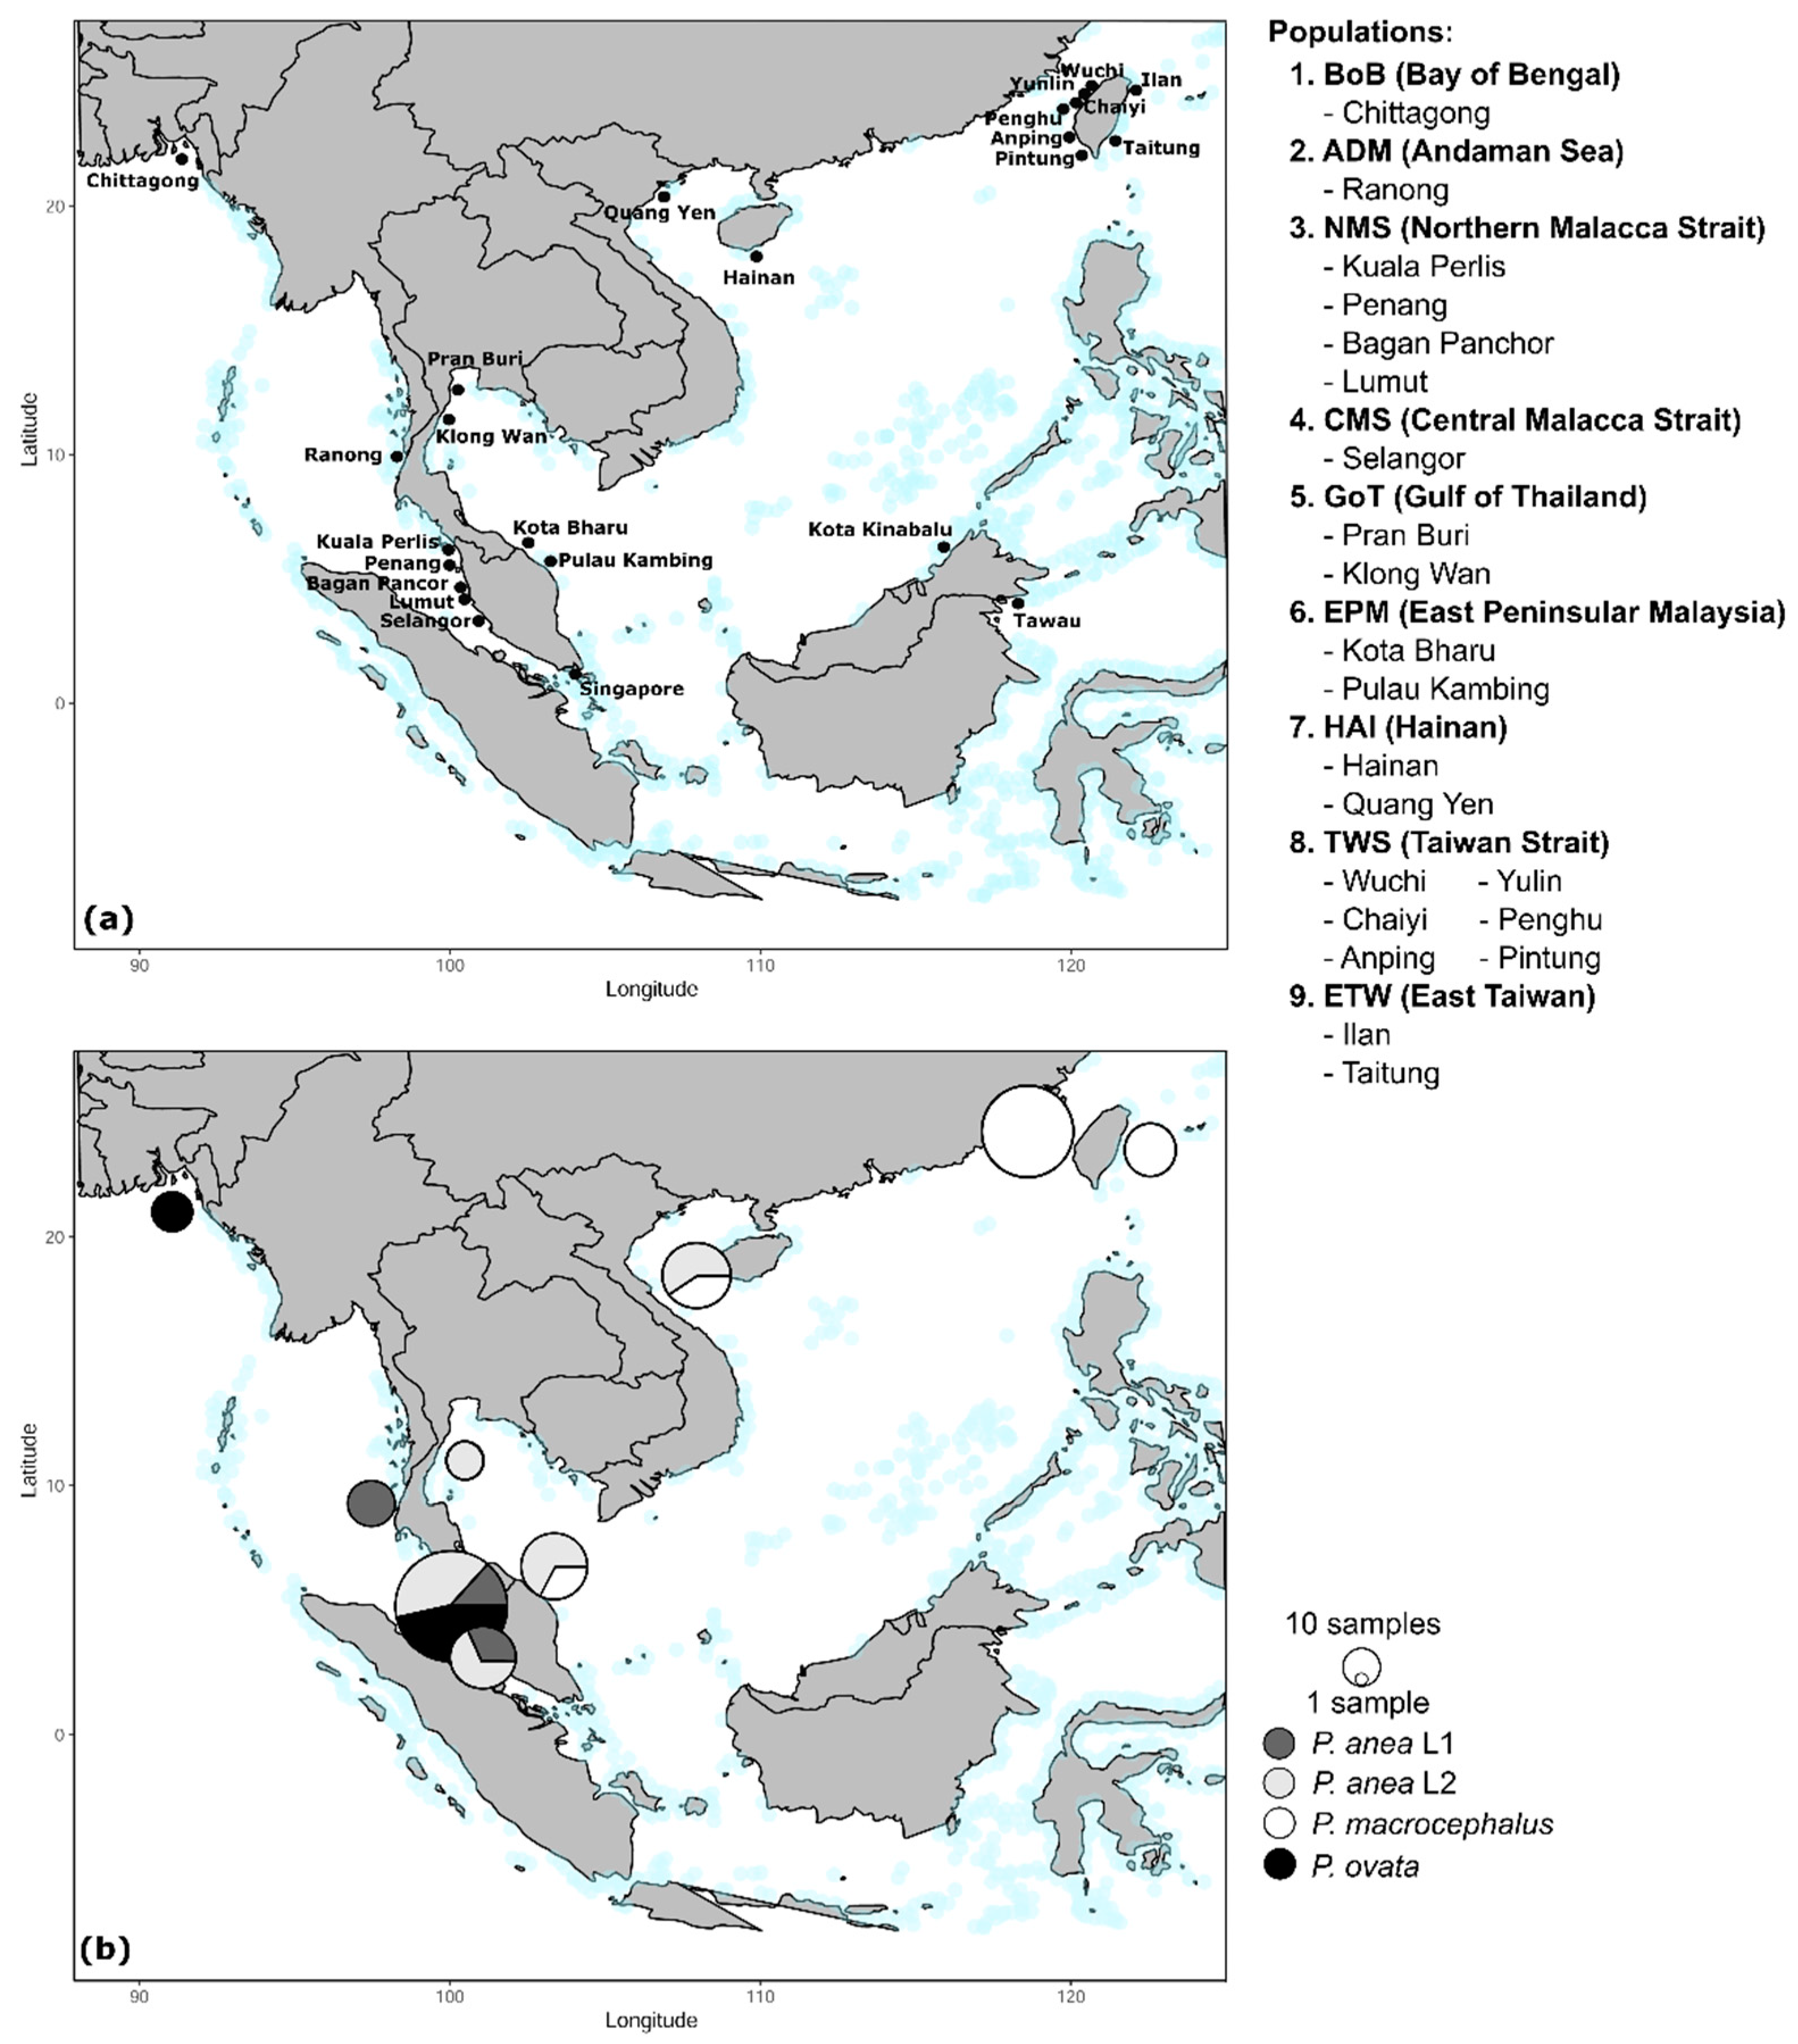
2.2. Specimen Collection
2.3. DNA Extraction, PCR Amplification, and Sequencing
2.4. Sequence Alignment and Datasets
2.5. Phylogenetic Inference, Haplotype Networks, and Genetic Distance
2.6. Genetic Diversity, Population Differentiation, and Demographic Analyses
2.7. Divergence Time Estimation
2.8. Ancestral Area Reconstruction
3. Results
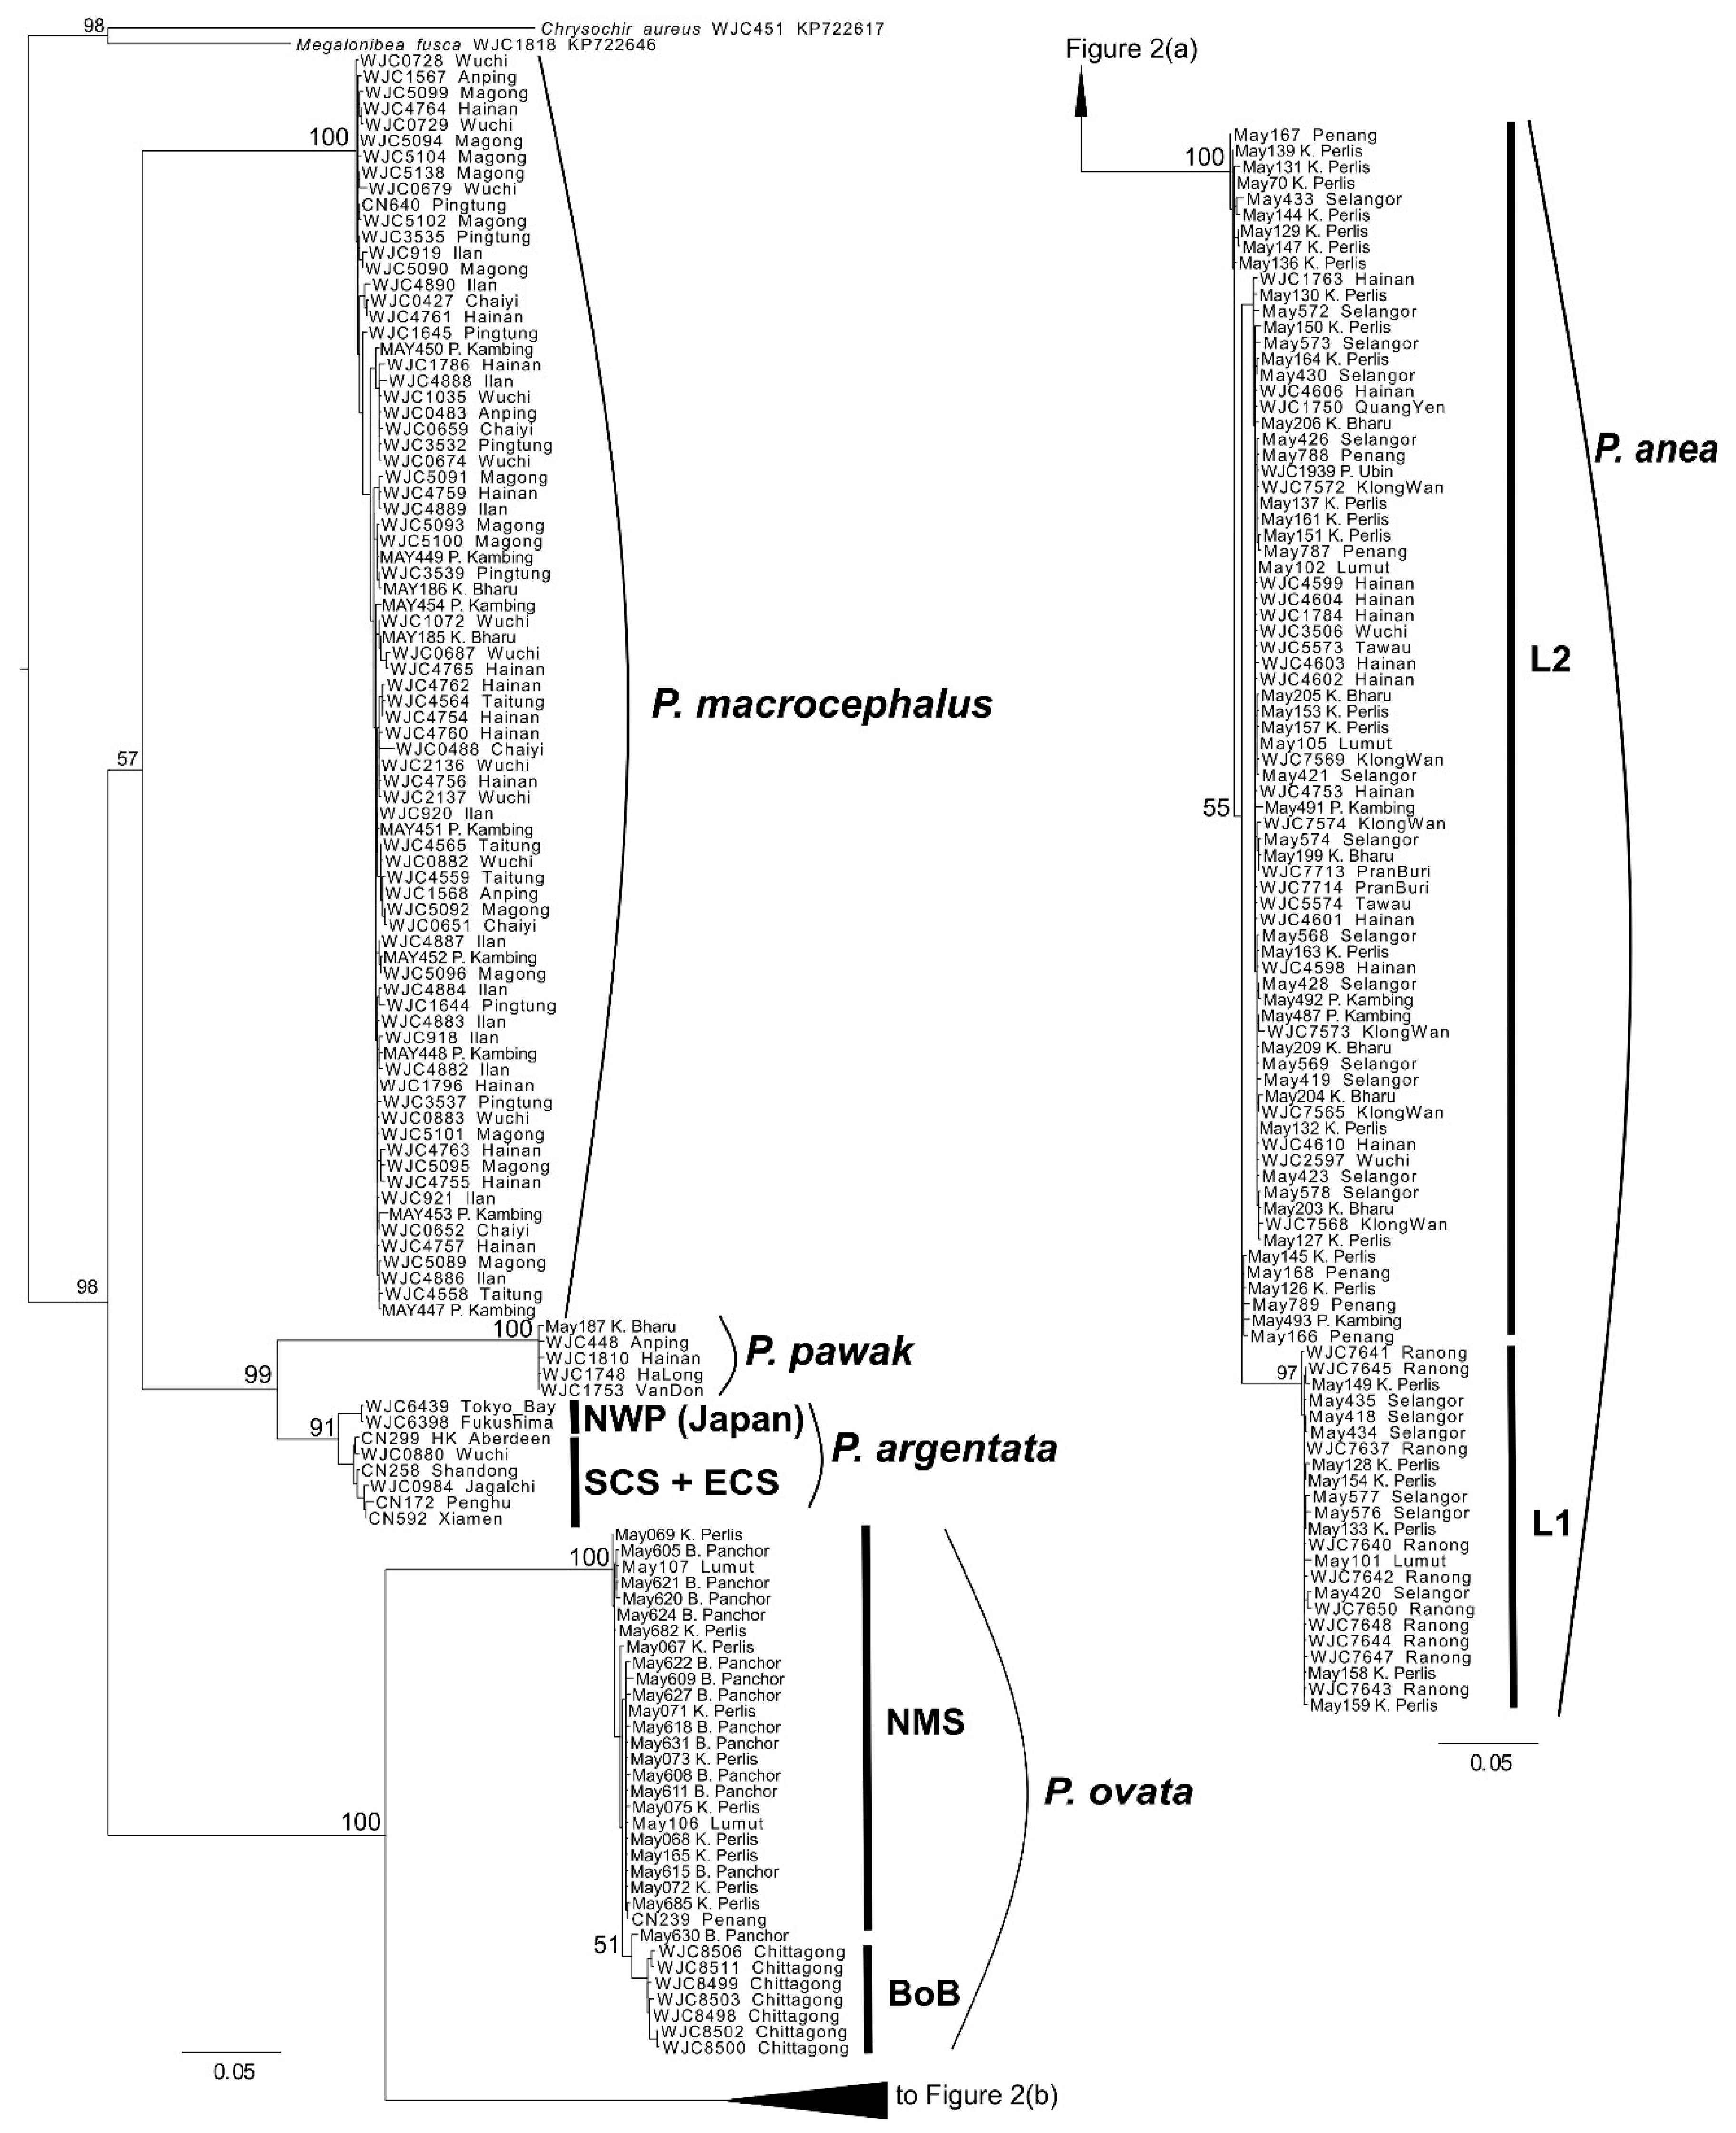
3.1. Phylogeny
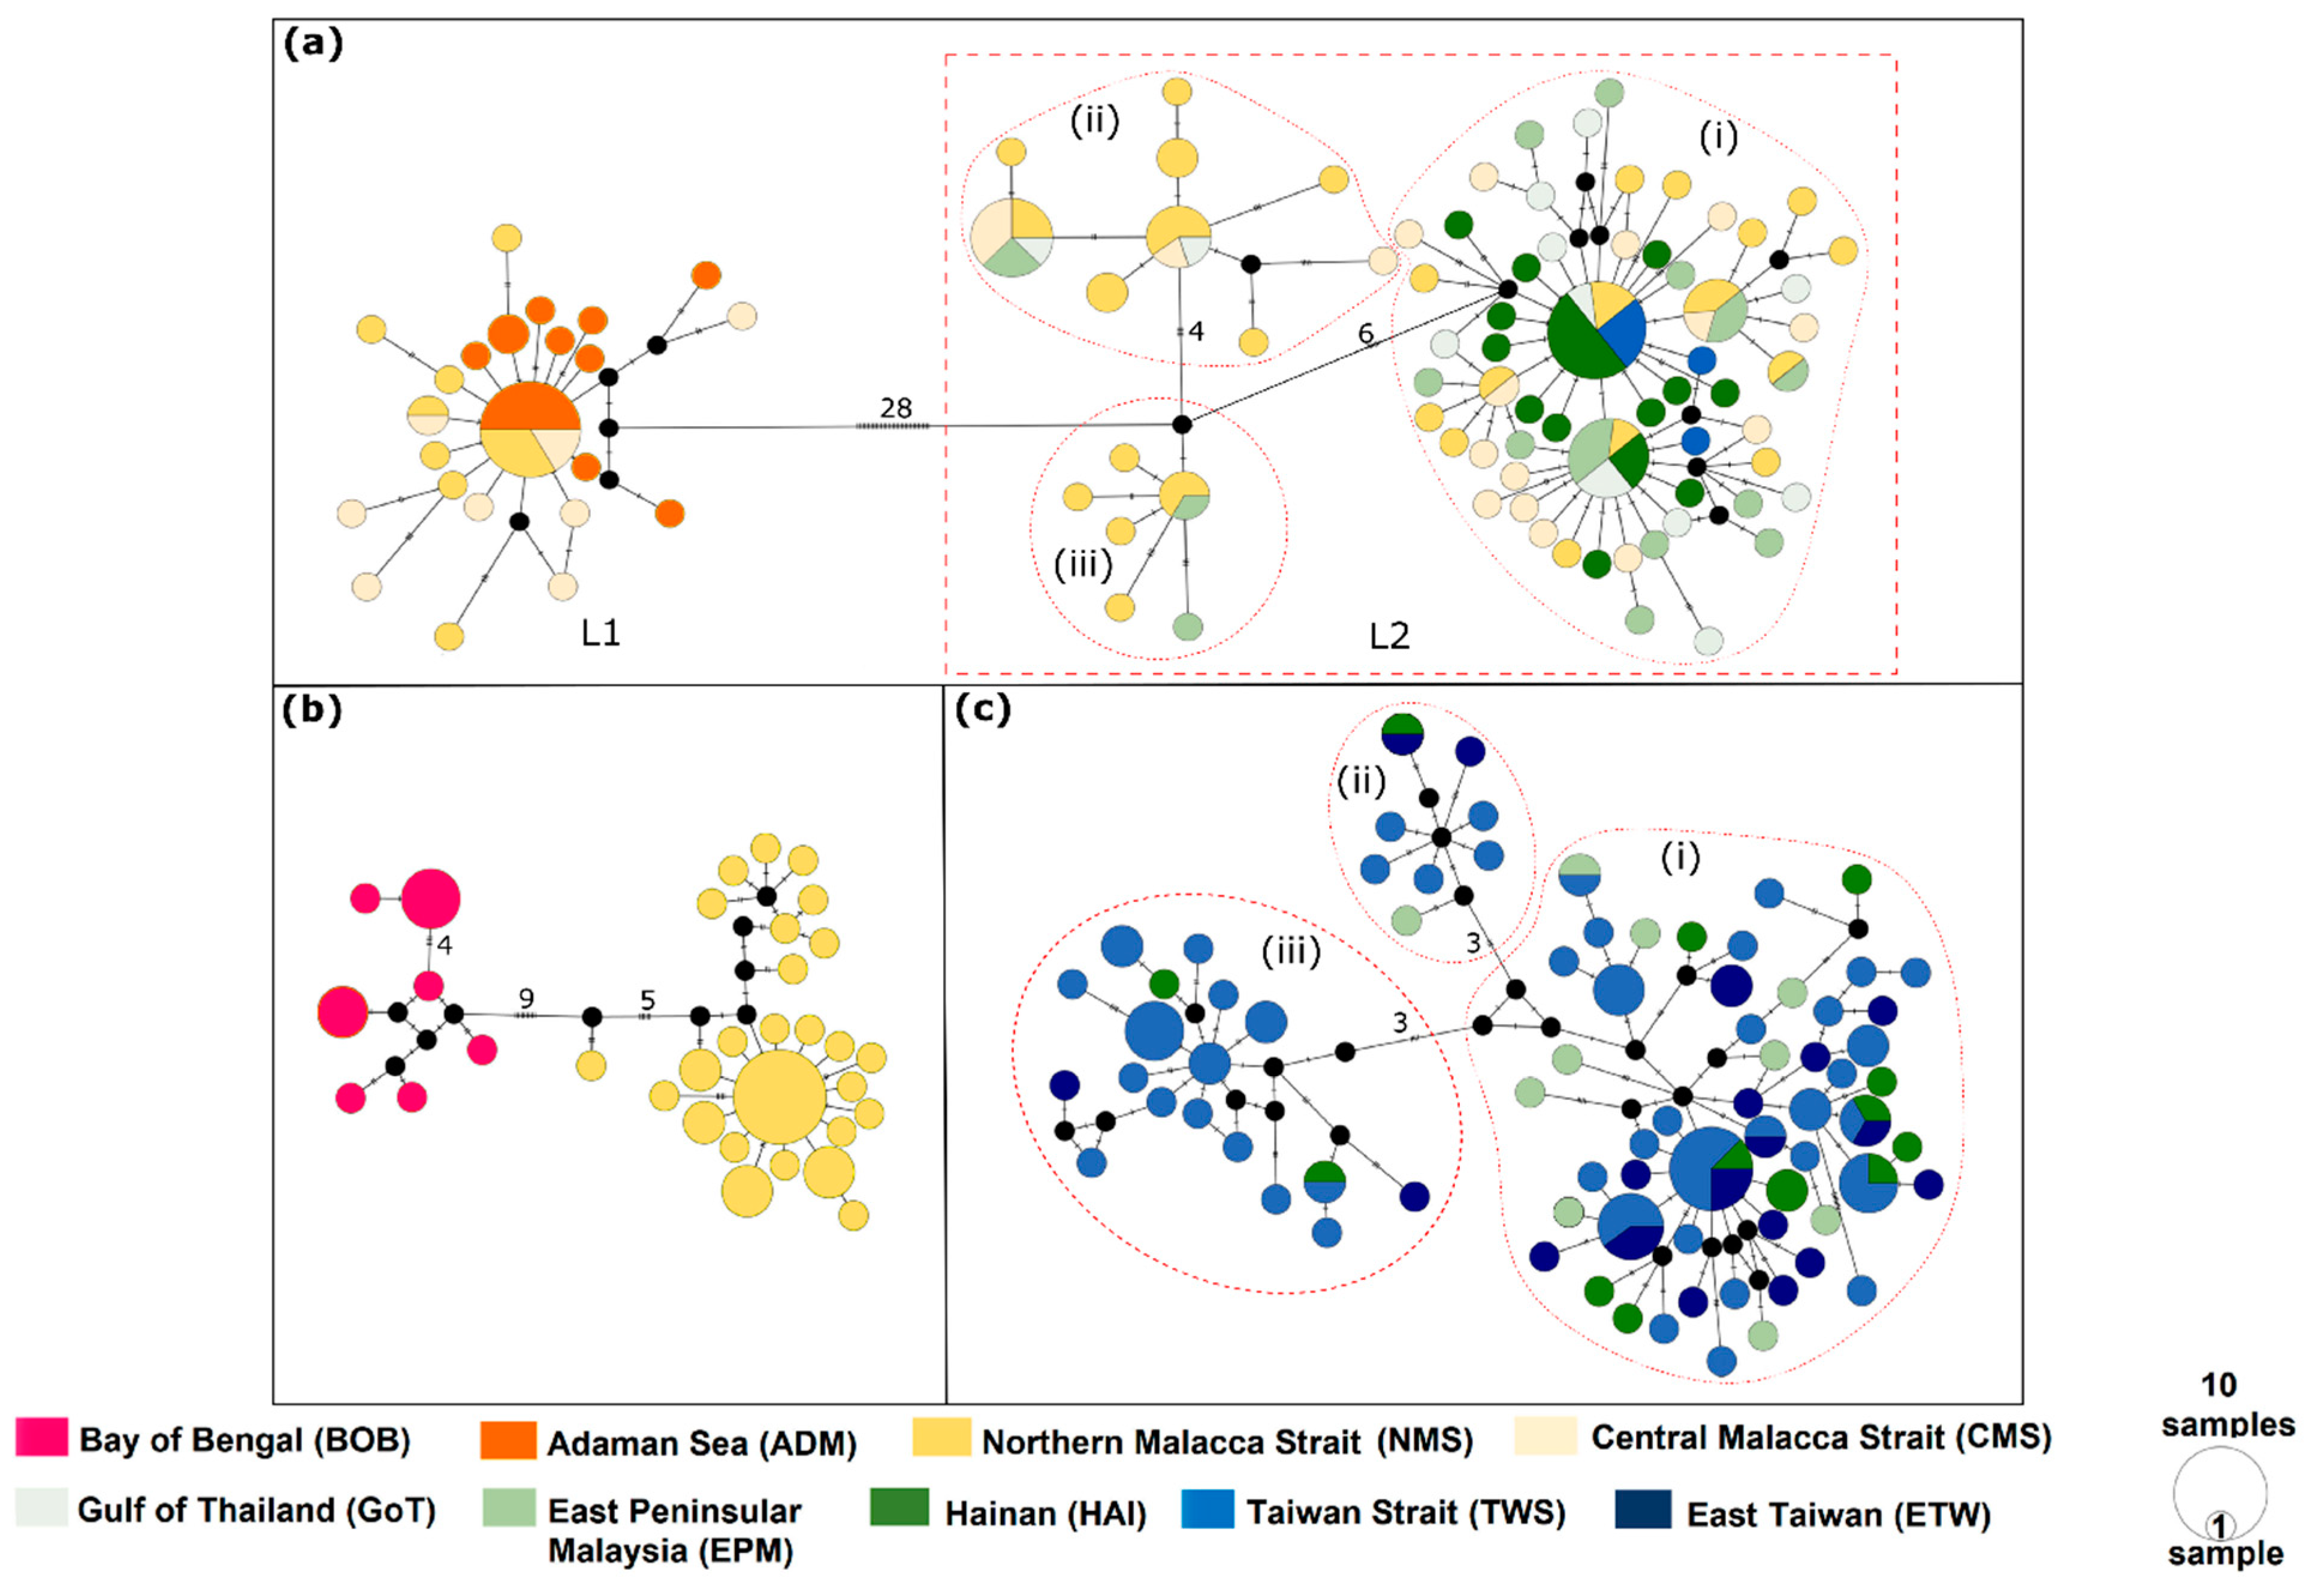
3.2. Haplotype Network
3.3. Genetic Diversity, Population Demography, and Population Structure
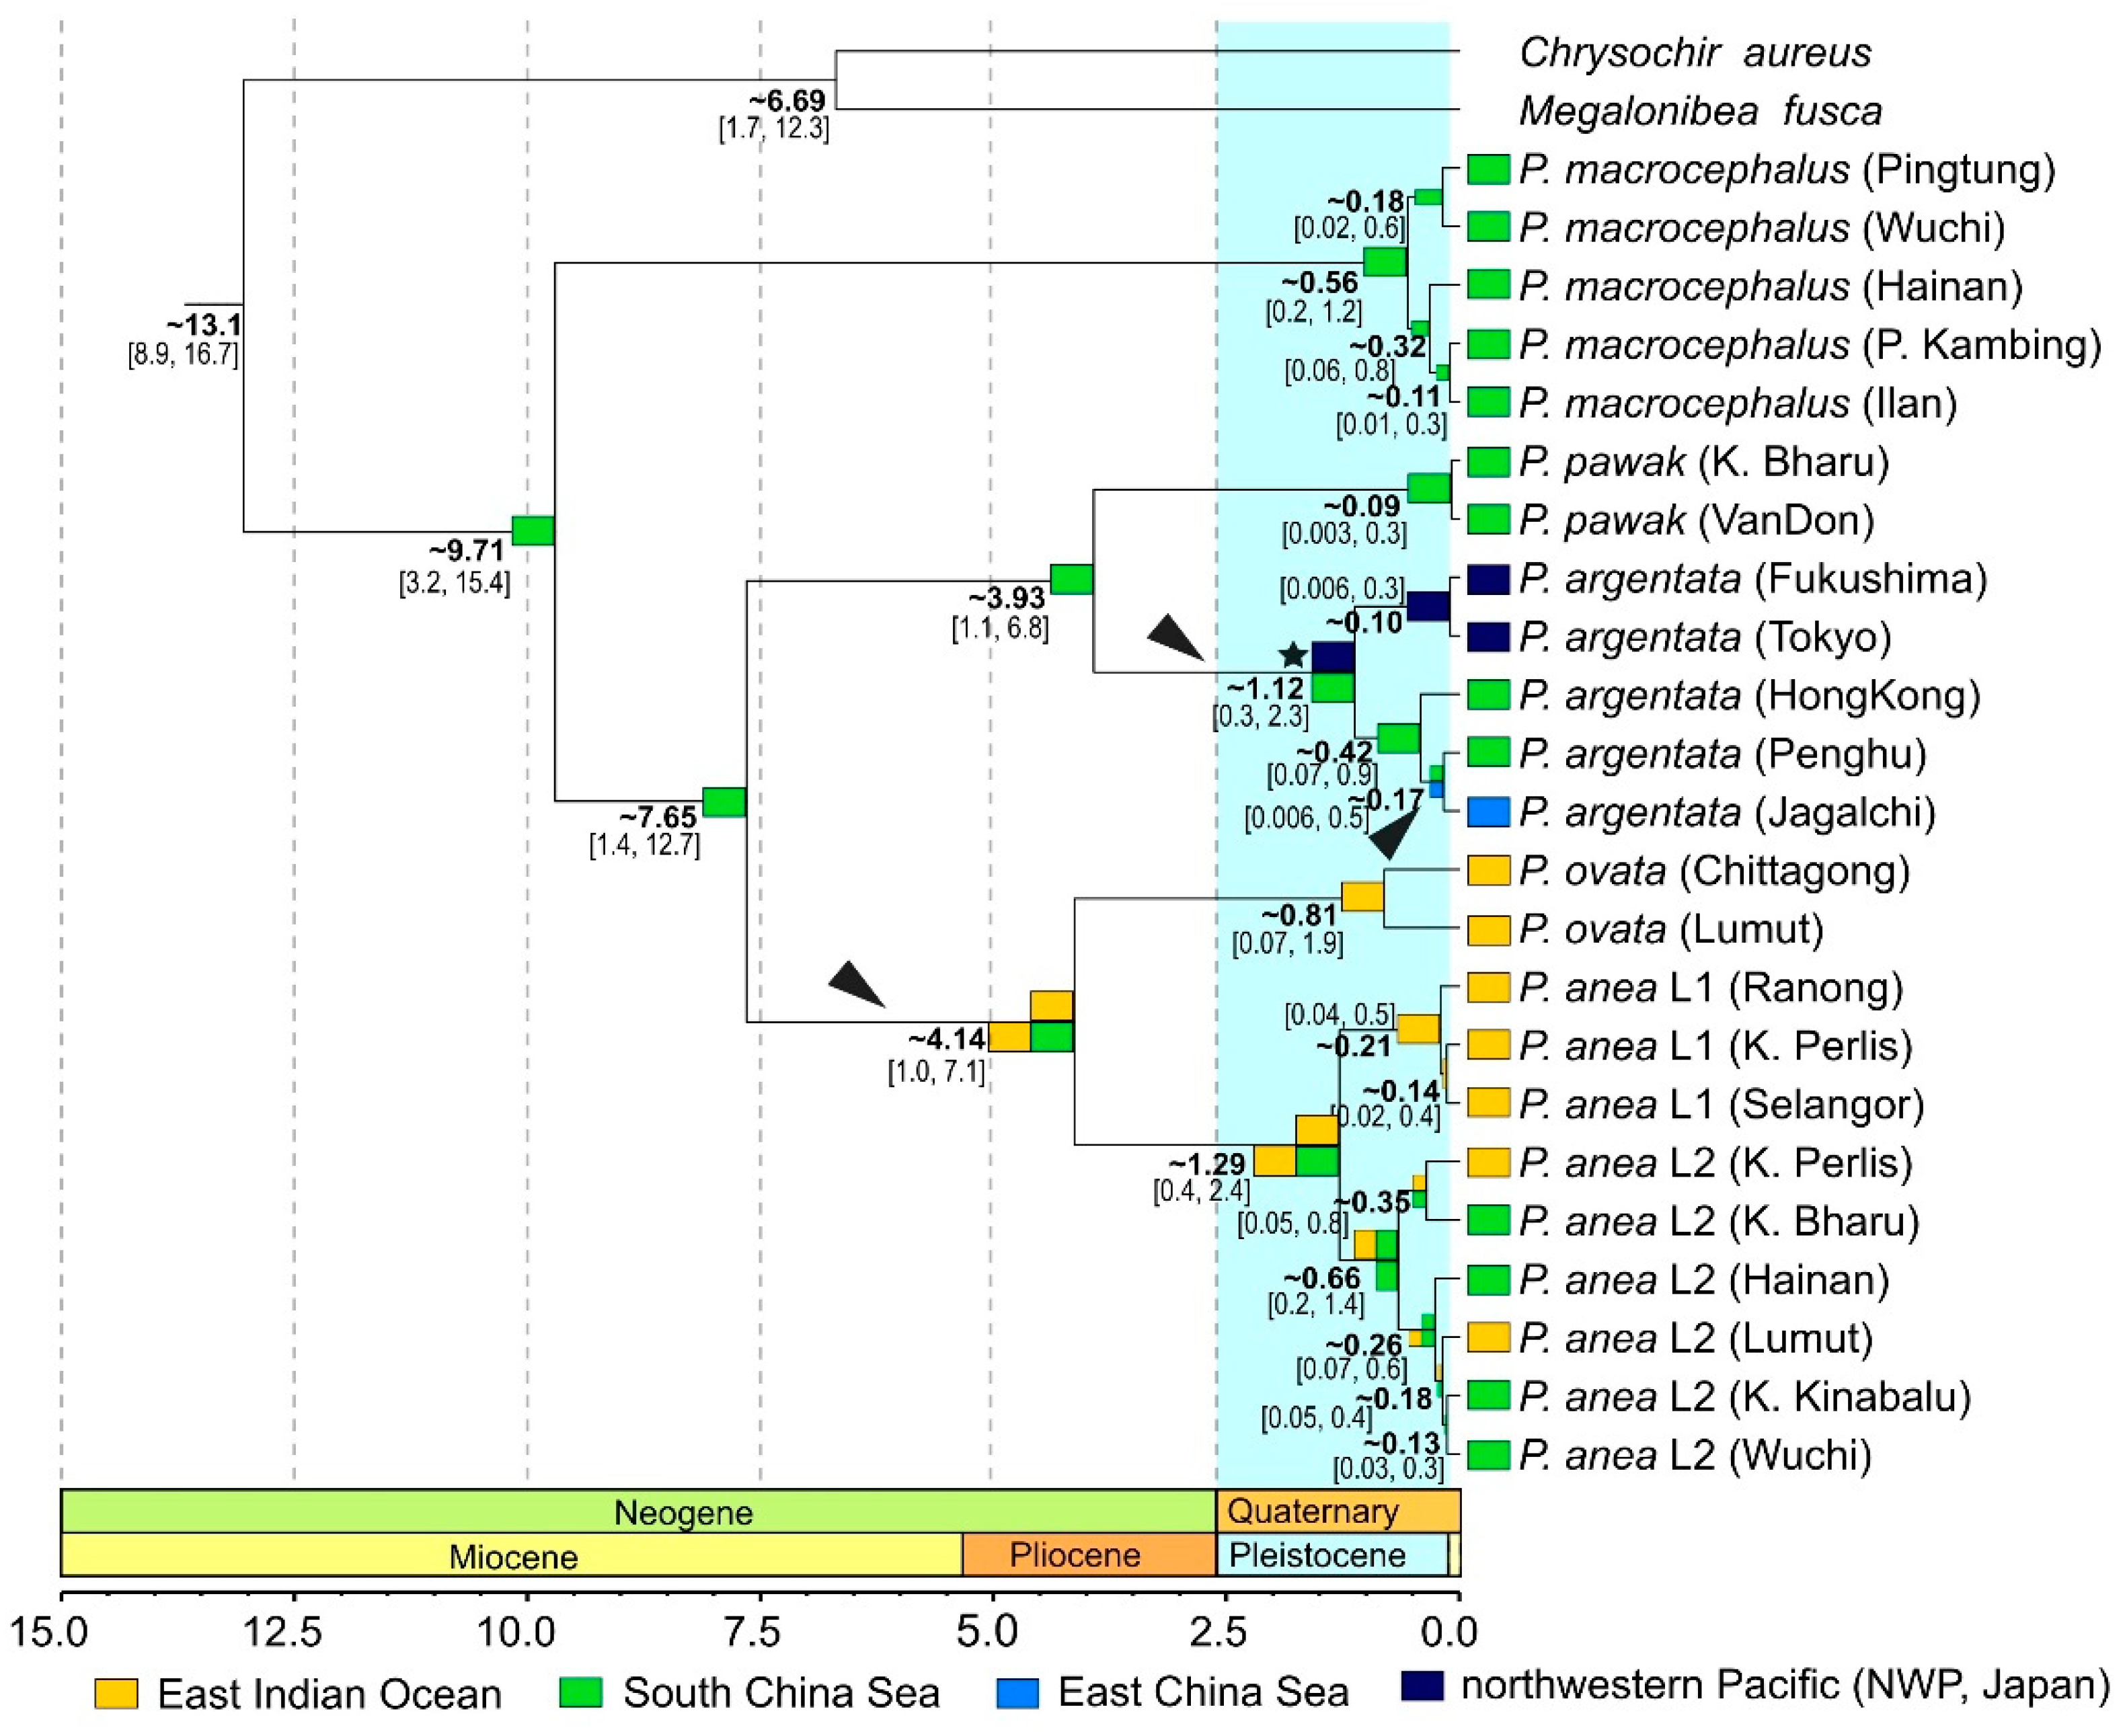
3.4. Reconstruction of Historical Biogeography
4. Discussion
4.1. Phylogeny, Diversity and Historical Biogeography
4.2. Distribution Pattern
4.3. Population Connectivity
Supplementary Materials
Author Contributions
Funding
Institutional Review Board Statement
Informed Consent Statement
Data Availability Statement
Acknowledgments
Conflicts of Interest
References
- Wyrtki, K. Physical Oceanography of the Southeast Asian Waters, 1st ed.; UC San Diego; Library—Scripps Digital Collection: La Jolla, CA, USA, 1916; Available online: https://escholarship.org/uc/item/49n9x3t4 (accessed on 1 September 2021).
- Sodhi, N.S.; Posa, M.R.C.; Lee, T.M.; Bickford, D.; Koh, L.P.; Brook, B. The state and conservation of Southeast Asian biodiversity. Biodivers. Conserv. 2009, 19, 317–328. [Google Scholar] [CrossRef]
- Tittensor, D.P.; Mora, C.; Jetz, W.; Lotze, H.K.; Ricard, D.; Berghe, E.V.; Worm, B. Global patterns and predictors of marine biodiversity across taxa. Nature 2010, 466, 1098–1101. [Google Scholar] [CrossRef]
- Spalding, M.D.; Fox, H.E.; Allen, G.R.; Davidson, N.; Ferdaña, Z.A.; Finlayson, M.; Halpern, B.S.; Jorge, M.A.; Lombana, A.; Lourie, S.A.; et al. Marine Ecoregions of the World: A Bioregionalization of Coastal and Shelf Areas. Bioscience 2007, 57, 573–583. [Google Scholar] [CrossRef]
- Palumbi, S.R. Genetic divergence, reproductive isolation, and marine speciation. Annu. Rev. Ecol. Syst. 1994, 25, 547–572. [Google Scholar] [CrossRef]
- Rocha, L.A.; Bowen, B.W. Speciation in coral-reef fishes. J. Fish Biol. 2008, 72, 1101–1121. [Google Scholar] [CrossRef]
- Gaither, M.R.; Rocha, L.A. Origins of species richness in the Indo-Malay-Philippine biodiversity hotspot: Evidence for the centre of overlap hypothesis. J. Biogeogr. 2013, 40, 1638–1648. [Google Scholar] [CrossRef]
- Carpenter, K.E.; Barber, P.H.; Crandall, E.D.; Ablan-Lagman, M.C.A.; Ambariyanto; Mahardika, G.N.; Manjaji-Matsumoto, B.M.; Juinio-Meñez, M.A.; Santos, M.D.; Starger, C.J.; et al. Comparative Phylogeography of the Coral Triangle and Implications for Marine Management. J. Mar. Biol. 2010, 2011, 1–14. [Google Scholar] [CrossRef]
- Ekman, S. Zoogeography of the Sea; Sidgwick & Jackson: London, UK, 1953. [Google Scholar]
- Ladd, H.S. Origin of the Pacific island molluscan fauna. Am. J. Sci. 1960, 258, 137–150. [Google Scholar]
- Rosen, B.R. Progress, problems and patterns in the biogeography of reef corals and other tropical marine organisms. Helgol. Mar. Res. 1988, 42, 269–301. [Google Scholar] [CrossRef]
- Woodland, D.J. Zoogeography of the Siganidae (Pisces): An interpretation of distribution and richness patterns. Bull. Mar. Sci. 1983, 33, 713–717. [Google Scholar]
- Bellwood, D.R.; Wainwright, P.C. The History and Biogeography of Fishes on Coral Reefs. In Coral Reef Fishes; Elsevier BV: Amsterdam, The Netherlands, 2002; pp. 5–32. [Google Scholar]
- Chen, W.-J.; Borsa, P. Diversity, phylogeny, and historical biogeography of large-eye seabreams (Teleostei: Lethrinidae). Mol. Phylogenet. Evol. 2020, 151, 106902. [Google Scholar] [CrossRef]
- Cowman, P.F.; Bellwood, D.R. Vicariance across major marine biogeographic barriers: Temporal concordance and the relative intensity of hard versus soft barriers. Proc. R. Soc. B: Biol. Sci. 2013, 280, 20131541. [Google Scholar] [CrossRef] [PubMed]
- Oshiro, Y.; Kinjo, K.; Nakasone, K. Validation of internal reference genes for gene expression analysis in Montipora digitata, Pocillopora damicornis and Acropora nasuta by quantitative real-time PCR. Galax-J. Coral Reef Stud. 2013, 15, 1–11. [Google Scholar] [CrossRef]
- Tornabene, L.; Valdez, S.; Erdmann, M.; Pezold, F. Support for a ‘Center of Origin’ in the Coral Triangle: Cryptic diversity, recent speciation, and local endemism in a diverse lineage of reef fishes (Gobiidae: Eviota). Mol. Phylogenet. Evol. 2015, 82, 200–210. [Google Scholar] [CrossRef] [PubMed]
- Tornabene, L.; Valdez, S.; Erdmann, M.V.; Pezold, F.L. Multi-locus sequence data reveal a new species of coral reef goby (Teleostei: Gobiidae: Eviota), and evidence of Pliocene vicariance across the Coral Triangle. J. Fish Biol. 2016, 88, 1811–1834. [Google Scholar] [CrossRef] [PubMed]
- Crandall, E.D.; Riginos, C.; Bird, C.E.; Liggins, L.; Treml, E.; Beger, M.; Barber, P.H.; Connolly, S.R.; Cowman, P.F.; DiBattista, J.D.; et al. The molecular biogeography of the Indo-Pacific: Testing hypotheses with multispecies genetic patterns. Glob. Ecol. Biogeogr. 2019, 28, 943–960. [Google Scholar] [CrossRef]
- Rocha, L.A.; Craig, M.T.; Bowen, B.W. Phylogeography and the conservation of coral reef fishes. Coral Reefs 2007, 26, 501–512. [Google Scholar] [CrossRef]
- Sorenson, L.; Allen, G.R.; Erdmann, M.V.; Dai, C.-F.; Liu, S.-Y.V. Pleistocene diversification of the Pomacentrus coelestis species complex (Pisces: Pomacentridae): Historical biogeography and species boundaries. Mar. Biol. 2014, 161, 2495–2507. [Google Scholar] [CrossRef]
- Avise, J.C. Phylogeography: The History and Formation of Species; Harvard University Press: Cambridge, MA, USA, 2000. [Google Scholar]
- Barber, P.H.; Cheng, S.H.; Erdmann, M.V.; Tenggardjaja, K.; Ambariyant. Evolution and conservation of ma-rine biodiversity in the Coral Triangle: Insights from stomatopod Crustacea. Crustacean Issues 2011, 19, 1–32. [Google Scholar]
- Barber, P.H.; Erdmann, M.V.; Palumbi, S.R. Comparative phylogeography of three codistributed stomatopods: Origins and timing of regional lineage diversification in the coral triangle. Evolution 2006, 60, 1825–1839. [Google Scholar] [CrossRef]
- Reid, D.G.; Lal, K.; Mackenzie-Dodds, J.; Kaligis, F.; Littlewood, D.T.J.; Williams, S. Comparative phylogeography and species boundaries in Echinolittorina snails in the central Indo-West Pacific. J. Biogeogr. 2006, 33, 990–1006. [Google Scholar] [CrossRef]
- Horne, J.B.; Momigliano, P.; Welch, D.J.; Newman, S.J.; Van Herwerden, L. Limited ecological population connectivity suggests low demands on self-recruitment in a tropical inshore marine fish (Eleutheronema tetradactylum: Polynemidae). Mol. Ecol. 2011, 20, 2291–2306. [Google Scholar] [CrossRef] [PubMed]
- Crandall, E.D.; Frey, M.A.; Grosberg, R.K.; Barber, P.H. Contrasting demographic history and phylogeographical patterns in two Indo-Pacific gastropods. Mol. Ecol. 2007, 17, 611–626. [Google Scholar] [CrossRef] [PubMed]
- Dibattista, J.D.; Rocha, L.; Craig, M.T.; Feldheim, K.A.; Bowen, B.W. Phylogeography of Two Closely Related Indo-Pacific Butterflyfishes Reveals Divergent Evolutionary Histories and Discordant Results from mtDNA and Microsatellites. J. Hered. 2012, 103, 617–629. [Google Scholar] [CrossRef] [PubMed]
- Borsa, P.; Durand, J.-D.; Chen, W.-J.; Hubert, N.; Muths, D.; Mou-Tham, G.; Kulbicki, M. Comparative phylogeography of the western Indian Ocean reef fauna. Acta Oecologica 2016, 72, 72–86. [Google Scholar] [CrossRef]
- Kunal, S.P.; Kumar, G.; Menezes, M.R.; Meena, R.M. Mitochondrial DNA analysis reveals three stocks of yellowfin tuna Thunnus albacares (Bonnaterre, 1788) in Indian waters. Conserv. Genet. 2013, 14, 205–213. [Google Scholar] [CrossRef]
- Kunal, S.P.; Kumar, G.; Menezes, M.R.; Meena, R.M. Genetic homogeneity in longtail tuna Thunnus tonggol (Bleeker, 1851) from the northwest coast of India inferred from direct sequencing analysis of the mitochondrial DNA D-loop region. Mar. Biol. Res. 2014, 10, 738–743. [Google Scholar] [CrossRef]
- Lim, H.-C.; Ahmad, A.T.; Nuruddin, A.A.; Nor, S.A.M. Cytochromebgene reveals panmixia among Japanese Threadfin Bream, Nemipterus japonicus (Bloch, 1791) populations along the coasts of Peninsular Malaysia and provides evidence of a cryptic species. Mitochondrial DNA 2014, 27, 575–584. [Google Scholar] [CrossRef]
- Habib, A.; Sulaiman, Z. High genetic connectivity of narrow-barred Spanish mackerel (Scomberomorus commerson) from the South China, Bali and Java Seas. Zoöl. Ecol. 2016, 26, 93–99. [Google Scholar] [CrossRef]
- Gao, T.; Li, L.; Fang, R.; Liu, G.; Wang, L.; Xu, H.; Song, N. Shallow Genetic Structure of Pholis fangi in Bohai Sea and Yellow Sea Inferred from mtDNA Control Region. J. Ocean Univ. China 2019, 18, 947–952. [Google Scholar] [CrossRef]
- Chanthran, S.S.D.; Lim, P.-E.; Li, Y.; Liao, T.-Y.; Poong, S.-W.; Du, J.; Hussein, M.A.S.; Sade, A.; Rumpet, R.; Loh, K.-H. Genetic diversity and population structure of Terapon jarbua (Forskål, 1775) (Teleostei, Terapontidae) in Malaysian waters. ZooKeys 2020, 911, 139–160. [Google Scholar] [CrossRef] [PubMed]
- Sasaki, K. Sciaenidae. In FAO Species Identification Guide for Fishery Purposes. The Living Marine Resources of the Western Central Pacific; Carpenter, K., Niem, V., Eds.; FAO: Rome, Italy, 2001. [Google Scholar]
- Yamada, U. Sciaenidea. In Fishes of Japan with Pictorial Keys to the Species, English Edition; Tokai University Press: Tokyo, Japan, 2002; pp. 867–870. [Google Scholar]
- Yamaguchi, A.; Todoroki, T.; Kume, G. Reproductive cycle, sexual maturity and diel-reproductive periodicity of white croaker, Pennahia argentata (Sciaenidae), in Ariake Sound, Japan. Fish. Res. 2006, 82, 95–100. [Google Scholar] [CrossRef]
- Tuuli, C.D.; De Mitcheson, Y.S.; Liu, M. Reproductive biology of the greyfin croaker Pennahia anea in the northern South China Sea. Ichthyol. Res. 2011, 58, 302–309. [Google Scholar] [CrossRef]
- Muktha, M.; Maheswarudu, G.; Rohit, P.; Laxmilatha, P.; Das, M.; Rao, K.N. Biology and stock assessment of the bigeye croaker Pennahia anea (Bloch, 1793) landed along Andhra Pradesh, north-east coast of India. Indian J. Fish. 2015, 62, 46–51. [Google Scholar]
- Bloch, M.E. Mit Sechs und Dreissig Ausgemalten Kupfern Nach Originalen. 2011. Available online: https://gdz.sub.uni-goettingen.de/id/PPN595240917 (accessed on 1 September 2021).
- Houttuyn, M. Beschryving van eenige Japanese Visschen, en andere zee-schepzelen. Verhandelingen der Hollandsche Maatschappij der Wetenschappen. Haarlem 1782, 20, 311–350. [Google Scholar]
- Tang, D.-S. A study of sciaenoid fishes of China. Amoy Mar. Biol. Bull. 1937, 2, 47–88. [Google Scholar]
- Sasaki, K. Pennahia ovata, a new sciaenid from the Bay of Bengal. Ichthyol. Res. 1996, 43, 11–16. [Google Scholar] [CrossRef]
- Lin, S.-Y. Croakers of the South China Sea. J. Hong Kong Fish. Res. Stn. 1940, 1, 243–254. [Google Scholar]
- Fricke, R.; Eschmeyer, W.N.; van der Laan, R. Eschmeyer’s Catalog of Fishes: Genera, Species, References. Electronic Version. 2021. Available online: http://researcharchive.calacademy.org (accessed on 10 June 2021).
- FAO. Yearbook. In Fishery and Aquaculture Statistics; Food and Agriculture Organisation of the United Nation: Rome, Italy, 2016. [Google Scholar]
- Lo, P.-C.; Liu, S.-H.; Chao, N.L.; Nunoo, F.K.E.; Mok, H.-K.; Chen, W.-J. A multi-gene dataset reveals a tropical New World origin and Early Miocene diversification of croakers (Perciformes: Sciaenidae). Mol. Phylogenet. Evol. 2015, 88, 132–143. [Google Scholar] [CrossRef]
- Shen, S.-C.; Lee, S.-C.; Shao, K.-T.; Mok, H.-K.; Chen, C.-W.; Chen, C.-T. Sciaenidae. In Fishes of Taiwan; Department of Zoology, National Taiwan University: Taipei, Taiwan, 1993; pp. 374–385. [Google Scholar]
- Séret, B.; Opic, P. Poissons de Mer de l’Ouest Africain Tropical; ORSTOM: Paris, France, 1990. [Google Scholar]
- Bertrand, J.A.; Borsa, P.; Chen, W.-J. Phylogeography of the sergeants Abudefduf sexfasciatus and A. vaigiensisreveals complex introgression patterns between two widespread and sympatric Indo-West Pacific reef fishes. Mol. Ecol. 2017, 26, 2527–2542. [Google Scholar] [CrossRef]
- Lo, P.-C.; Liu, S.-H.; Nor, S.A.M.; Chen, W.-J. Molecular exploration of hidden diversity in the Indo-West Pacific sciaenid clade. PLoS ONE 2017, 12, e0176623. [Google Scholar] [CrossRef]
- López, J.A.; Chen, W.-J.; Orti, G. Esociform Phylogeny. Copeia 2004, 2004, 449–464. [Google Scholar] [CrossRef]
- Chen, W.-J.; Santini, F.; Carnevale, G.; Chen, J.-N.; Liu, S.-H.; Lavoué, S.; Mayden, R.L. New insights on early evolution of spiny-rayed fishes (Teleostei: Acanthomorpha). Front. Mar. Sci. 2014, 1. [Google Scholar] [CrossRef]
- Lee, S.-H.; Lee, M.-Y.; Matsunuma, M.; Chen, W.-J. Exploring the Phylogeny and Species Diversity of Chelidoperca (Teleostei: Serranidae) From the Western Pacific Ocean by an Integrated Approach in Systematics, With Descriptions of Three New Species and a Redescription of C. lecromi Fourmanoir, 1982. Front. Mar. Sci. 2019, 6. [Google Scholar] [CrossRef]
- Kumar, S.; Stecher, G.; Tamura, K. MEGA7: Molecular Evolutionary Genetics Analysis Version 7.0 for Bigger Datasets. Mol. Biol. Evol. 2016, 33, 1870–1874. [Google Scholar] [CrossRef] [PubMed]
- Stamatakis, A. RAxML version 8: A tool for phylogenetic analysis and post-analysis of large phylogenies. Bioinformatics 2014, 30, 1312–1313. [Google Scholar] [CrossRef] [PubMed]
- Rambaut, A.; Drummond, A.J. Molecular Evolution, Phylogenetics and Epidemiology. FigTree v1.3.1. Available online: http://tree.bio.ed.ac.uk/software/figtree/. (accessed on 5 January 2021).
- Librado, P.; Rozas, J. DnaSP v5: A software for comprehensive analysis of DNA polymorphism data. Bioinformatics 2009, 25, 1451–1452. [Google Scholar] [CrossRef]
- Excoffier, L.; Lischer, H.E.L. Arlequin suite ver 3.5: A new series of programs to perform population genetics analyses under Linux and Windows. Mol. Ecol. Resour. 2010, 10, 564–567. [Google Scholar] [CrossRef]
- Benjamini, Y.; Hochberg, Y. Controlling the False Discovery Rate: A Practical and Powerful Approach to Multiple Testing. J. R. Stat. Soc. Ser. B Methodol. 1995, 57, 289–300. [Google Scholar] [CrossRef]
- Excoffier, L.; Smouse, P.E.; Quattro, J.M. Analysis of molecular variance inferred from metric distances among DNA haplotypes: Application to human mitochondrial DNA restriction data. Genetics 1992, 131, 479–491. [Google Scholar] [CrossRef]
- Tajima, F. Statistical method for testing the neutral mutation hypothesis by DNA polymorphism. Genetics 1989, 123, 585–595. [Google Scholar] [CrossRef]
- Fu, Y.-X. Statistical Tests of Neutrality of Mutations against Population Growth, Hitchhiking and Background Selection. Genetics 1997, 147, 915–925. [Google Scholar] [CrossRef] [PubMed]
- Bouckaert, R.; Heled, J.; Kühnert, D.; Vaughan, T.; Wu, C.-H.; Xie, D.; Suchard, M.A.; Rambaut, A.; Drummond, A.J. BEAST 2: A Software Platform for Bayesian Evolutionary Analysis. PLoS Comput. Biol. 2014, 10, e1003537. [Google Scholar] [CrossRef] [PubMed]
- Rambaut, A.; Drummond, A.X.; Baele, G.; Suchard, M.A. Tracer v1.6. 2015. Available online: http://beast.bio.ed.ac.uk (accessed on 1 September 2021).
- Drummond, A.J.; Suchard, M.A.; Xie, D.; Rambaut, A. Bayesian Phylogenetics with BEAUti and the BEAST 1.7. Mol. Biol. Evol. 2012, 29, 1969–1973. [Google Scholar] [CrossRef] [PubMed]
- Ree, R.H.; Moore, B.R.; Webb, C.O.; Donoghue, M.J. A likelihood framework for inferring the evolution of geographic range on phylogenetic trees. Evolution 2005, 59, 2299–2311. [Google Scholar] [CrossRef] [PubMed]
- Ree, R.H.; Smith, S. Maximum Likelihood Inference of Geographic Range Evolution by Dispersal, Local Extinction, and Cladogenesis. Syst. Biol. 2008, 57, 4–14. [Google Scholar] [CrossRef]
- Han, Z.-Q.; Gao, T.-X.; Yanagimoto, T.; Sakurai, Y. Deep phylogeographic break among white croaker Pennahia argentata (Sciaenidae, Perciformes) populations in North-western Pacific. Fish. Sci. 2008, 74, 770–780. [Google Scholar] [CrossRef]
- Grant, W. Shallow population histories in deep evolutionary lineages of marine fishes: Insights from sardines and anchovies and lessons for conservation. J. Hered. 1998, 89, 415–426. [Google Scholar] [CrossRef]
- Hsu, K.-C.; Shih, N.-T.; Ni, I.-H.; Shao, K.-T. Speciation and population structure of three Trichiurus species based on mitochondrial DNA. Zool. Stud. 2009, 48, 835–849. [Google Scholar]
- Cowman, P.F.; Bellwood, D.R. The historical biogeography of coral reef fishes: Global patterns of origination and dispersal. J. Biogeogr. 2013, 40, 209–224. [Google Scholar] [CrossRef]
- Cheng, J.; Sha, Z.-L. Cryptic diversity in the Japanese mantis shrimp Oratosquilla oratoria (Crustacea: Squillidae): Allopatric diversification, secondary contact and hybridization. Sci. Rep. 2017, 7, 1–13. [Google Scholar] [CrossRef]
- Barber, P.H.; Bellwood, D.R. Biodiversity hotspots: Evolutionary origins of biodiversity in wrasses (Halichoeres: Lab-ridae) in the Indo-Pacific and new world tropics. Mol. Phylogenet. Evol. 2005, 35, 235–253. [Google Scholar] [CrossRef] [PubMed]
- Williams, S.T.; Duda, T.F., Jr. Did tectonic activity stimulate oligomiocene speciation in the indo-west pacific. Evolution 2008, 62, 1618–1634. [Google Scholar] [CrossRef]
- Renema, W.; Bellwood, D.R.; Braga, J.C.; Bromfield, K.; Hall, R.; Johnson, K.G.; Lunt, P.; Meyer, C.P.; McMonagle, L.B.; Morley, R.J.; et al. Hopping Hotspots: Global Shifts in Marine Biodiversity. Science 2008, 321, 654–657. [Google Scholar] [CrossRef]
- Benzie, J.A. Genetic structure of marine organism and SE Asian biogeography. In Biogeography and Geological Evolution of SE Asian; Hall, R., Holloway, J.D., Eds.; Backhuys Publishers: Kerkwerve, The Netherlands, 1998; pp. 197–209. [Google Scholar]
- Bowen, B.W.; Gaither, M.; DiBattista, J.D.; Iacchei, M.; Andrews, K.R.; Grant, W.S.; Toonen, R.; Briggs, J.C. Comparative phylogeography of the ocean planet. Proc. Natl. Acad. Sci. USA 2016, 113, 7962–7969. [Google Scholar] [CrossRef] [PubMed]
- Li, Y.; Chen, G.; Yu, J.; Wu, S.; Xiong, D.; Li, X.; Cui, K.; Li, Y. Population genetics of Thamnaconus hypargyreus (Tetraodontiformes: Monacanthidae) in the South China Sea. Mitochondrial DNA 2014, 27, 798–805. [Google Scholar] [CrossRef] [PubMed]
- Willette, D.A.; Santos, M.; Leadbitter, D. Longtail tuna Thunnus tonggol (Bleeker, 1851) shows genetic partitioning across, but not within, basins of the Indo-Pacific based on mitochondrial DNA. J. Appl. Ichthyol. 2016, 32, 318–323. [Google Scholar] [CrossRef]
- Sun, P.; Tang, B.; Yin, F. Population genetic structure and genetic diversity of Chinese pomfret at the coast of the East China Sea and the South China Sea. Mitochondrial DNA Part A 2017, 29, 643–649. [Google Scholar] [CrossRef]
- Niu, S.-F.; Wu, R.-X.; Zhai, Y.; Zhang, H.; Li, Z.-L.; Liang, Z.-B.; Chen, Y.-H. Demographic history and population genetic analysis of Decapterus maruadsi from the northern South China Sea based on mitochondrial control region sequence. PeerJ 2019, 7, e7953. [Google Scholar] [CrossRef]
- Sun, D.; Ge, Y.; Cheng, Q. Genetic diversity of eight wild populations of Pampus argenteus along the coast of China inferred from fifteen polymorphic microsatellite markers. Braz. J. Oceanogr. 2019, 67. [Google Scholar] [CrossRef]
- Jamaludin, N.-A.; Mohd-Arshaad, W.; Akib, N.A.M.; Abidin, D.H.Z.; Nghia, N.V.; Nor, S.-A.M. Phylogeography of the Japanese scad, Decapterus maruadsi (Teleostei; Carangidae) across the Central Indo-West Pacific: Evidence of strong regional structure and cryptic diversity. Mitochondrial DNA Part A 2020, 31, 298–310. [Google Scholar] [CrossRef] [PubMed]
- Hu, J.; Kawamura, H.; Hong, H.; Qi, Y. A Review on the Currents in the South China Sea: Seasonal Circulation, South China Sea Warm Current and Kuroshio Intrusion. J. Oceanogr. 2000, 56, 607–624. [Google Scholar] [CrossRef]
- Horne, J.B.; van Herwerden, L.; Choat, J.H.; Robertson, D. High population connectivity across the Indo-Pacific: Congruent lack of phylogeographic structure in three reef fish congeners. Mol. Phylogenetics Evol. 2008, 49, 629–638. [Google Scholar] [CrossRef] [PubMed]
- Reece, J.S.; Bowen, B.W.; Joshi, K.; Goz, V.; Larson, A. Phylogeography of Two Moray Eels Indicates High Dispersal throughout the Indo-Pacific. J. Hered. 2010, 101, 391–402. [Google Scholar] [CrossRef]
- Rizal, S.; Damm, P.; Wahid, M.A.; Sündermann, J.; Ilhamsyah, Y.; Iskandar, T. Muhammad general circulation in the malacca strait and andaman sea: A numerical model study. Am. J. Environ. Sci. 2012, 8, 479–488. [Google Scholar] [CrossRef]
- Mansor, K.N.A.A.K.; Pa’Suya, M.F.; Abbas, M.A.; Ali, T.A.T.; Aziz, M.A.C.; Din, A.H.M. Ocean surface circulation in strait of malacca using satellite altimeter and low cost GPS-tracked drifting buoys. In Proceedings of the 2016 7th IEEE Control and System Graduate Research Colloquium (ICSGRC), Shah Alam, Malaysia, 8 August 2016; IEEE: Piscataway, NJ, USA, 2016; pp. 175–180. [Google Scholar]


| Statistics | Locus | |||
|---|---|---|---|---|
| cytb (all species/P. anea/P. ovata/P. macrocephalus/P. argentata/P. pawak) | COI (all selected samples) | RAG1 (all selected samples) | Combined gene (all selected samples) | |
| No. sequence | 330/152/53/111/8/6 | 22 | 23 | 23 |
| Length of fragment (bp) | 1113/1017/1017/1113/1137/1104 | 618 | 1472 | 3203 |
| No. parsimony-informative sites | 342/74/29/60/27/0 | 157 | 107 | 583 |
| No. variable sites (in %) | 368 (33.1%)/135 (13.3%)/58 (5.7%)/105 (9.4%)/38 (3.3%)/9 (0.8%) | 175 (28.3%) | 122 (8.3%) | 631 (19.7%) |
| Species | Population | n | nh | h | π | Tajima’s D | Fu’s Fs |
|---|---|---|---|---|---|---|---|
| P. anea L1 | |||||||
| ADM | 16 | 10 | 0.8667 | 0.0020 | −2.1986 | −5.7904 | |
| NMS L1 | 11 | 8 | 0.8909 | 0.0027 | −1.9260 | −3.3664 | |
| CMS L1 | 9 | 8 | 0.9722 | 0.0034 | −1.5903 | −3.8665 | |
| All samples | 36 | 23 ** | 0.8920 | 0.0025 | −2.4664 | −21.4200 | |
| P. anea L2 | |||||||
| NMS L2 | 36 | 28 | 0.9857 | 0.0085 | −0.7953 | −13.7489 | |
| CMS L2 | 19 | 17 | 0.9825 | 0.0084 | −0.7899 | −7.3497 | |
| EPM | 20 | 16 | 0.9737 | 0.0066 | −1.2525 | −6.2285 | |
| GoT | 12 | 11 | 0.9848 | 0.0070 | −1.2807 | −4.0468 | |
| HAI | 20 | 14 | 0.9158 | 0.0018 | −2.2030 | −12.5861 | |
| TWS | 5 | 3 | 0.7000 | 0.0012 | −1.0485 | −0.1859 | |
| All samples | 112 | 73 ** | 0.9760 | 0.0071 | −1.8848 | −24.8560 | |
| P. anea L2i | 82 | 58 | 0.9681 | 0.0030 | −2.5560 | −26.4080 | |
| P. anea L2ii | 22 | 9 | 0.8268 | 0.0026 | −1.4757 | −1.9738 | |
| P. anea L2iii | 8 | 6 | 0.8929 | 0.0025 | −1.7415 | −2.0500 | |
| P. ovata | |||||||
| BoB | 12 | 7 | 0.8636 | 0.0047 | 0.1259 | −0.1384 | |
| NMS | 41 | 26 | 0.9354 | 0.0044 | −2.0022 | −16.9494 | |
| All samples | 53 | 33 ** | 0.9550 | 0.0089 | −1.0051 | −12.6100 | |
| P. macrocephalus | |||||||
| EPM | 10 | 10 | 1.0000 | 0.0068 | −1.2504 | −4.3504 | |
| HAI | 14 | 13 | 0.9890 | 0.0085 | −1.3133 | −4.4778 | |
| TWS | 65 | 47 | 0.9856 | 0.0088 | −1.4130 | −24.6058 | |
| ETW | 22 | 19 | 0.9870 | 0.0072 | −1.7346 | −8.7578 | |
| All samples | 111 | 79 ** | 0.9890 | 0.0084 | −1.7253 | −24.5060 | |
| P. macrocephalus i | 77 | 53 | 0.9809 | 0.0053 | −2.0149 | −25.2652 | |
| P. macrocephalus ii | 9 | 8 | 0.9722 | 0.0038 | −1.5388 | −3.1764 | |
| P. macrocephalus iii | 25 | 18 | 0.9667 | 0.0044 | −1.5800 | −8.9588 |
| (a) | ||||||
| ADM | NMS L1 | CMS L1 | ||||
| ADM | ||||||
| NMS L1 | 0.0013 | |||||
| CMS L1 | 0.0232 | 0.0000 | ||||
| (b) | ||||||
| NMS L2 | CMS L2 | EPM | GoT | HAI | TWS | |
| NMS L2 | ||||||
| CMS L2 | 0.0443 | |||||
| EPM | 0.1044 | 0.0000 | ||||
| GoT | 0.0972 | 0.0000 | 0.0000 | |||
| HAI | 0.2765 | 0.1219 | 0.0695 | 0.0667 | ||
| TWS | 0.1923 | 0.0197 | 0.0000 | 0.0000 | 0.0000 | |
| (c) | ||||||
| BoB | NMS | |||||
| BoB | ||||||
| NMS | 0.5000 | |||||
| (d) | ||||||
| EPM | HAI | TWS | ETW | |||
| EPM | ||||||
| HAI | 0.0138 | |||||
| TWS | 0.0609 | 0.0150 | ||||
| ETW | 0.0042 | 0.0000 | 0.0409 |
| Group | ФST | ФSC | ФCT | Among Groups (%) | Among Populations within Groups (%) | Within Populations (%) |
|---|---|---|---|---|---|---|
| P. anea | ||||||
| Based on the phylogenetic inference L1 [ADM, NMS L1, CMS L1] L2 [NMS L2, CMS L2, EPM, GoT, HAI, TWS] | 0.8551 | 0.0921 | 0.8404 | 84.04 | 1.47 | 14.49 |
| Based on the ocean region (L2 only) EIO [NMS L2, CMS L2] SCS [EPM, GoT, HAI, TWS] | 0.1405 | 0.0207 | 0.1224 | 12.23 | 1.82 | 85.95 |
| Based on pairwise ΦST (L2 only) Group 1 [NMS L2, CMS L2, EPM, GoT, TWS] Group 2 [HAI] | 0.1396 | 0.0749 | 0.0700 | 7.00 | 6.96 | 86.04 |
| P. macrocephalus | ||||||
| Based on ecoregion following Spalding et al. (2007) [4] 3 ecoregions southern SCS [EPM] northern SCS [HAI] northeastern SCS [TWS, ETW] | 0.0240 | 0.0418 | 0.000 | −1.86 | 4.26 | 97.60 |
| Based on pairwise ΦST Group 1 [EPM] Group 2 [HAI, ETW] Group 3 [TWS] | 0.0352 | 0.0182 | 0.0172 | 1.74 | 1.79 | 96.48 |
Publisher’s Note: MDPI stays neutral with regard to jurisdictional claims in published maps and institutional affiliations. |
© 2021 by the authors. Licensee MDPI, Basel, Switzerland. This article is an open access article distributed under the terms and conditions of the Creative Commons Attribution (CC BY) license (https://creativecommons.org/licenses/by/4.0/).
Share and Cite
Lim, H.-C.; Habib, A.; Chen, W.-J. Comparative Phylogeography and Phylogeny of Pennah Croakers (Teleostei: Sciaenidae) in Southeast Asian Waters. Genes 2021, 12, 1926. https://doi.org/10.3390/genes12121926
Lim H-C, Habib A, Chen W-J. Comparative Phylogeography and Phylogeny of Pennah Croakers (Teleostei: Sciaenidae) in Southeast Asian Waters. Genes. 2021; 12(12):1926. https://doi.org/10.3390/genes12121926
Chicago/Turabian StyleLim, Hong-Chiun, Ahasan Habib, and Wei-Jen Chen. 2021. "Comparative Phylogeography and Phylogeny of Pennah Croakers (Teleostei: Sciaenidae) in Southeast Asian Waters" Genes 12, no. 12: 1926. https://doi.org/10.3390/genes12121926
APA StyleLim, H.-C., Habib, A., & Chen, W.-J. (2021). Comparative Phylogeography and Phylogeny of Pennah Croakers (Teleostei: Sciaenidae) in Southeast Asian Waters. Genes, 12(12), 1926. https://doi.org/10.3390/genes12121926