Genetic Diversity and Genome-Wide Association Study of Seed Aspect Ratio Using a High-Density SNP Array in Peanut (Arachis hypogaea L.)

 ,
,  , and
, and
Abstract
1. Introduction
1.1. Peanut Information
1.2. Peanut Germplasms and Core Collection
1.3. Characteristic of Peanut Genome
1.4. Development of Molecular Markers Using Next Generation Sequencing (NGS) Technology
1.5. Applications of High-Density SNP Arrays in Crops
1.6. Purpose
2. Materials and Methods
2.1. Plant Materials, DNA Extraction, and Genotyping
2.2. Screening of Seed Aspect Ratio
2.3. Population Structure Analysis
2.4. Genome-Wide Association Analysis
2.5. Linkage Disequilibrium (LD) Analysis
2.6. Regularization Method
3. Results
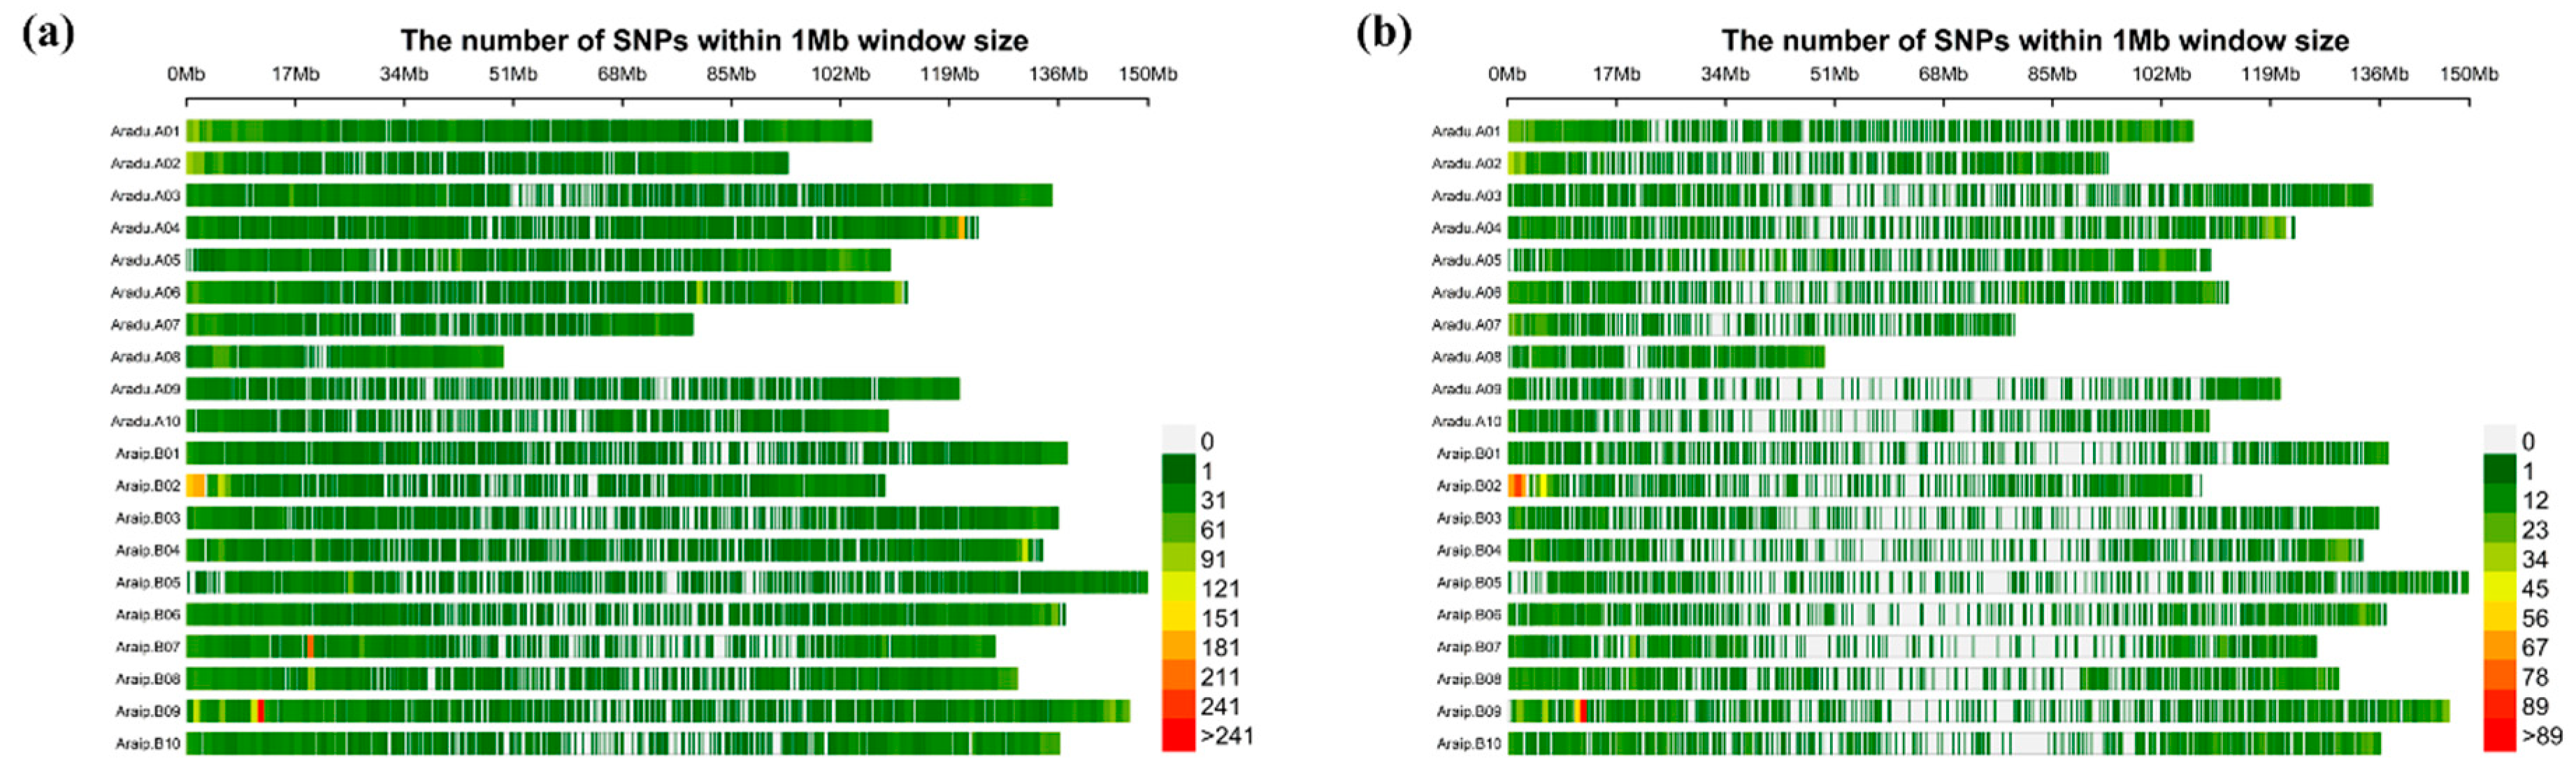
3.1. SNP Genotyping
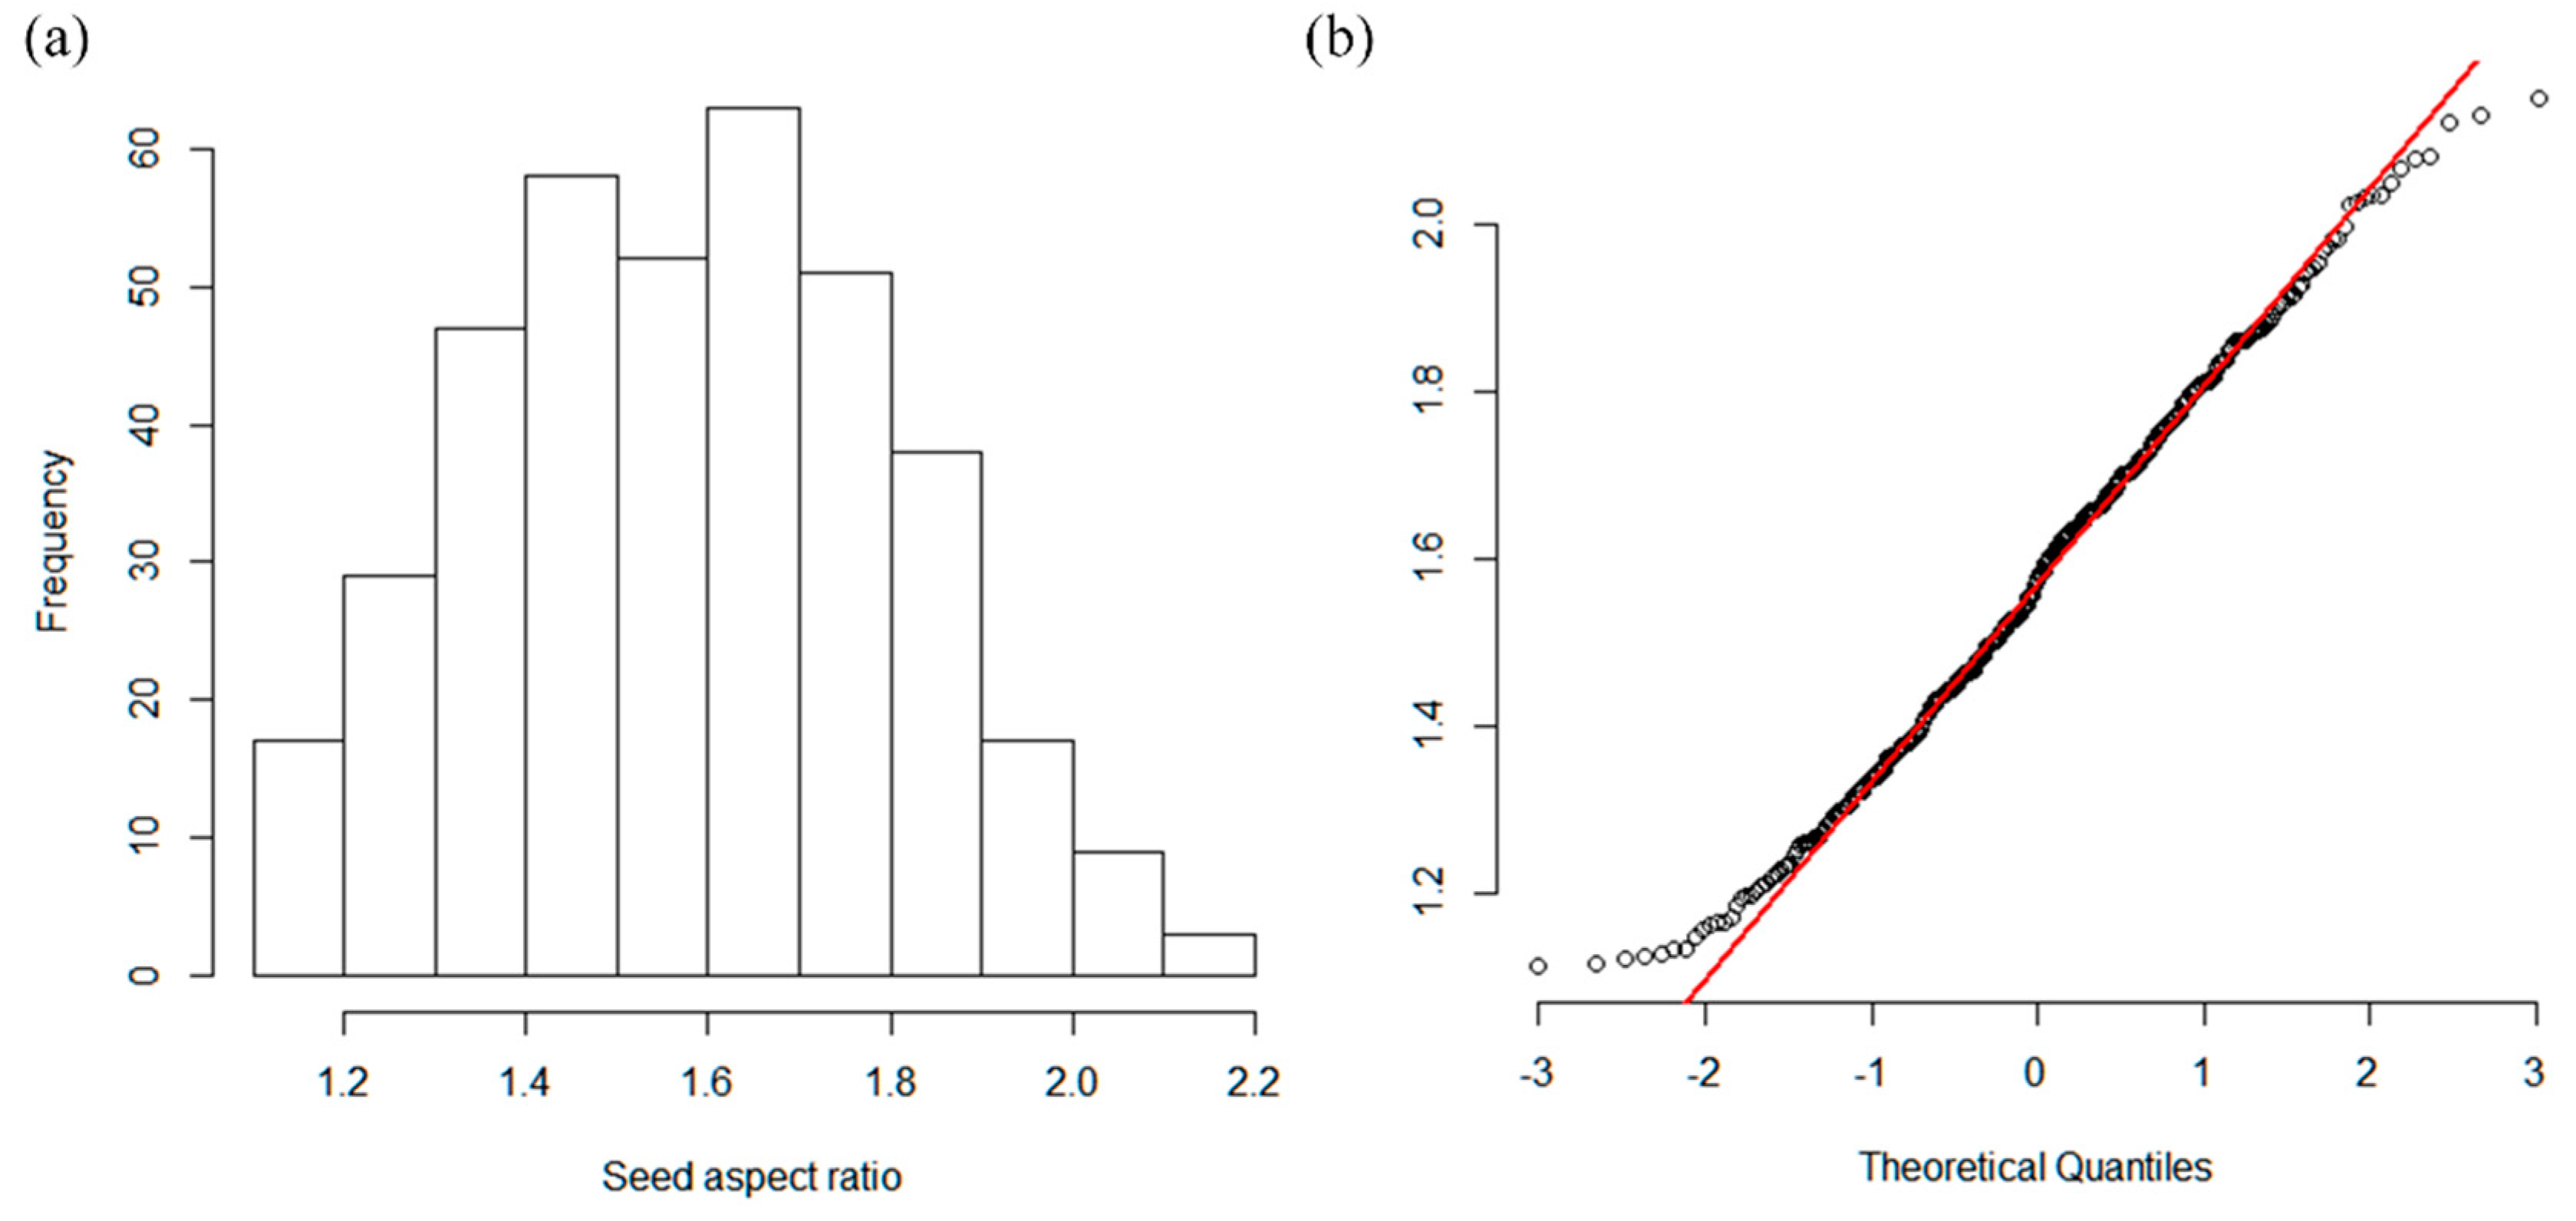
3.2. Phenotype Data Analysis
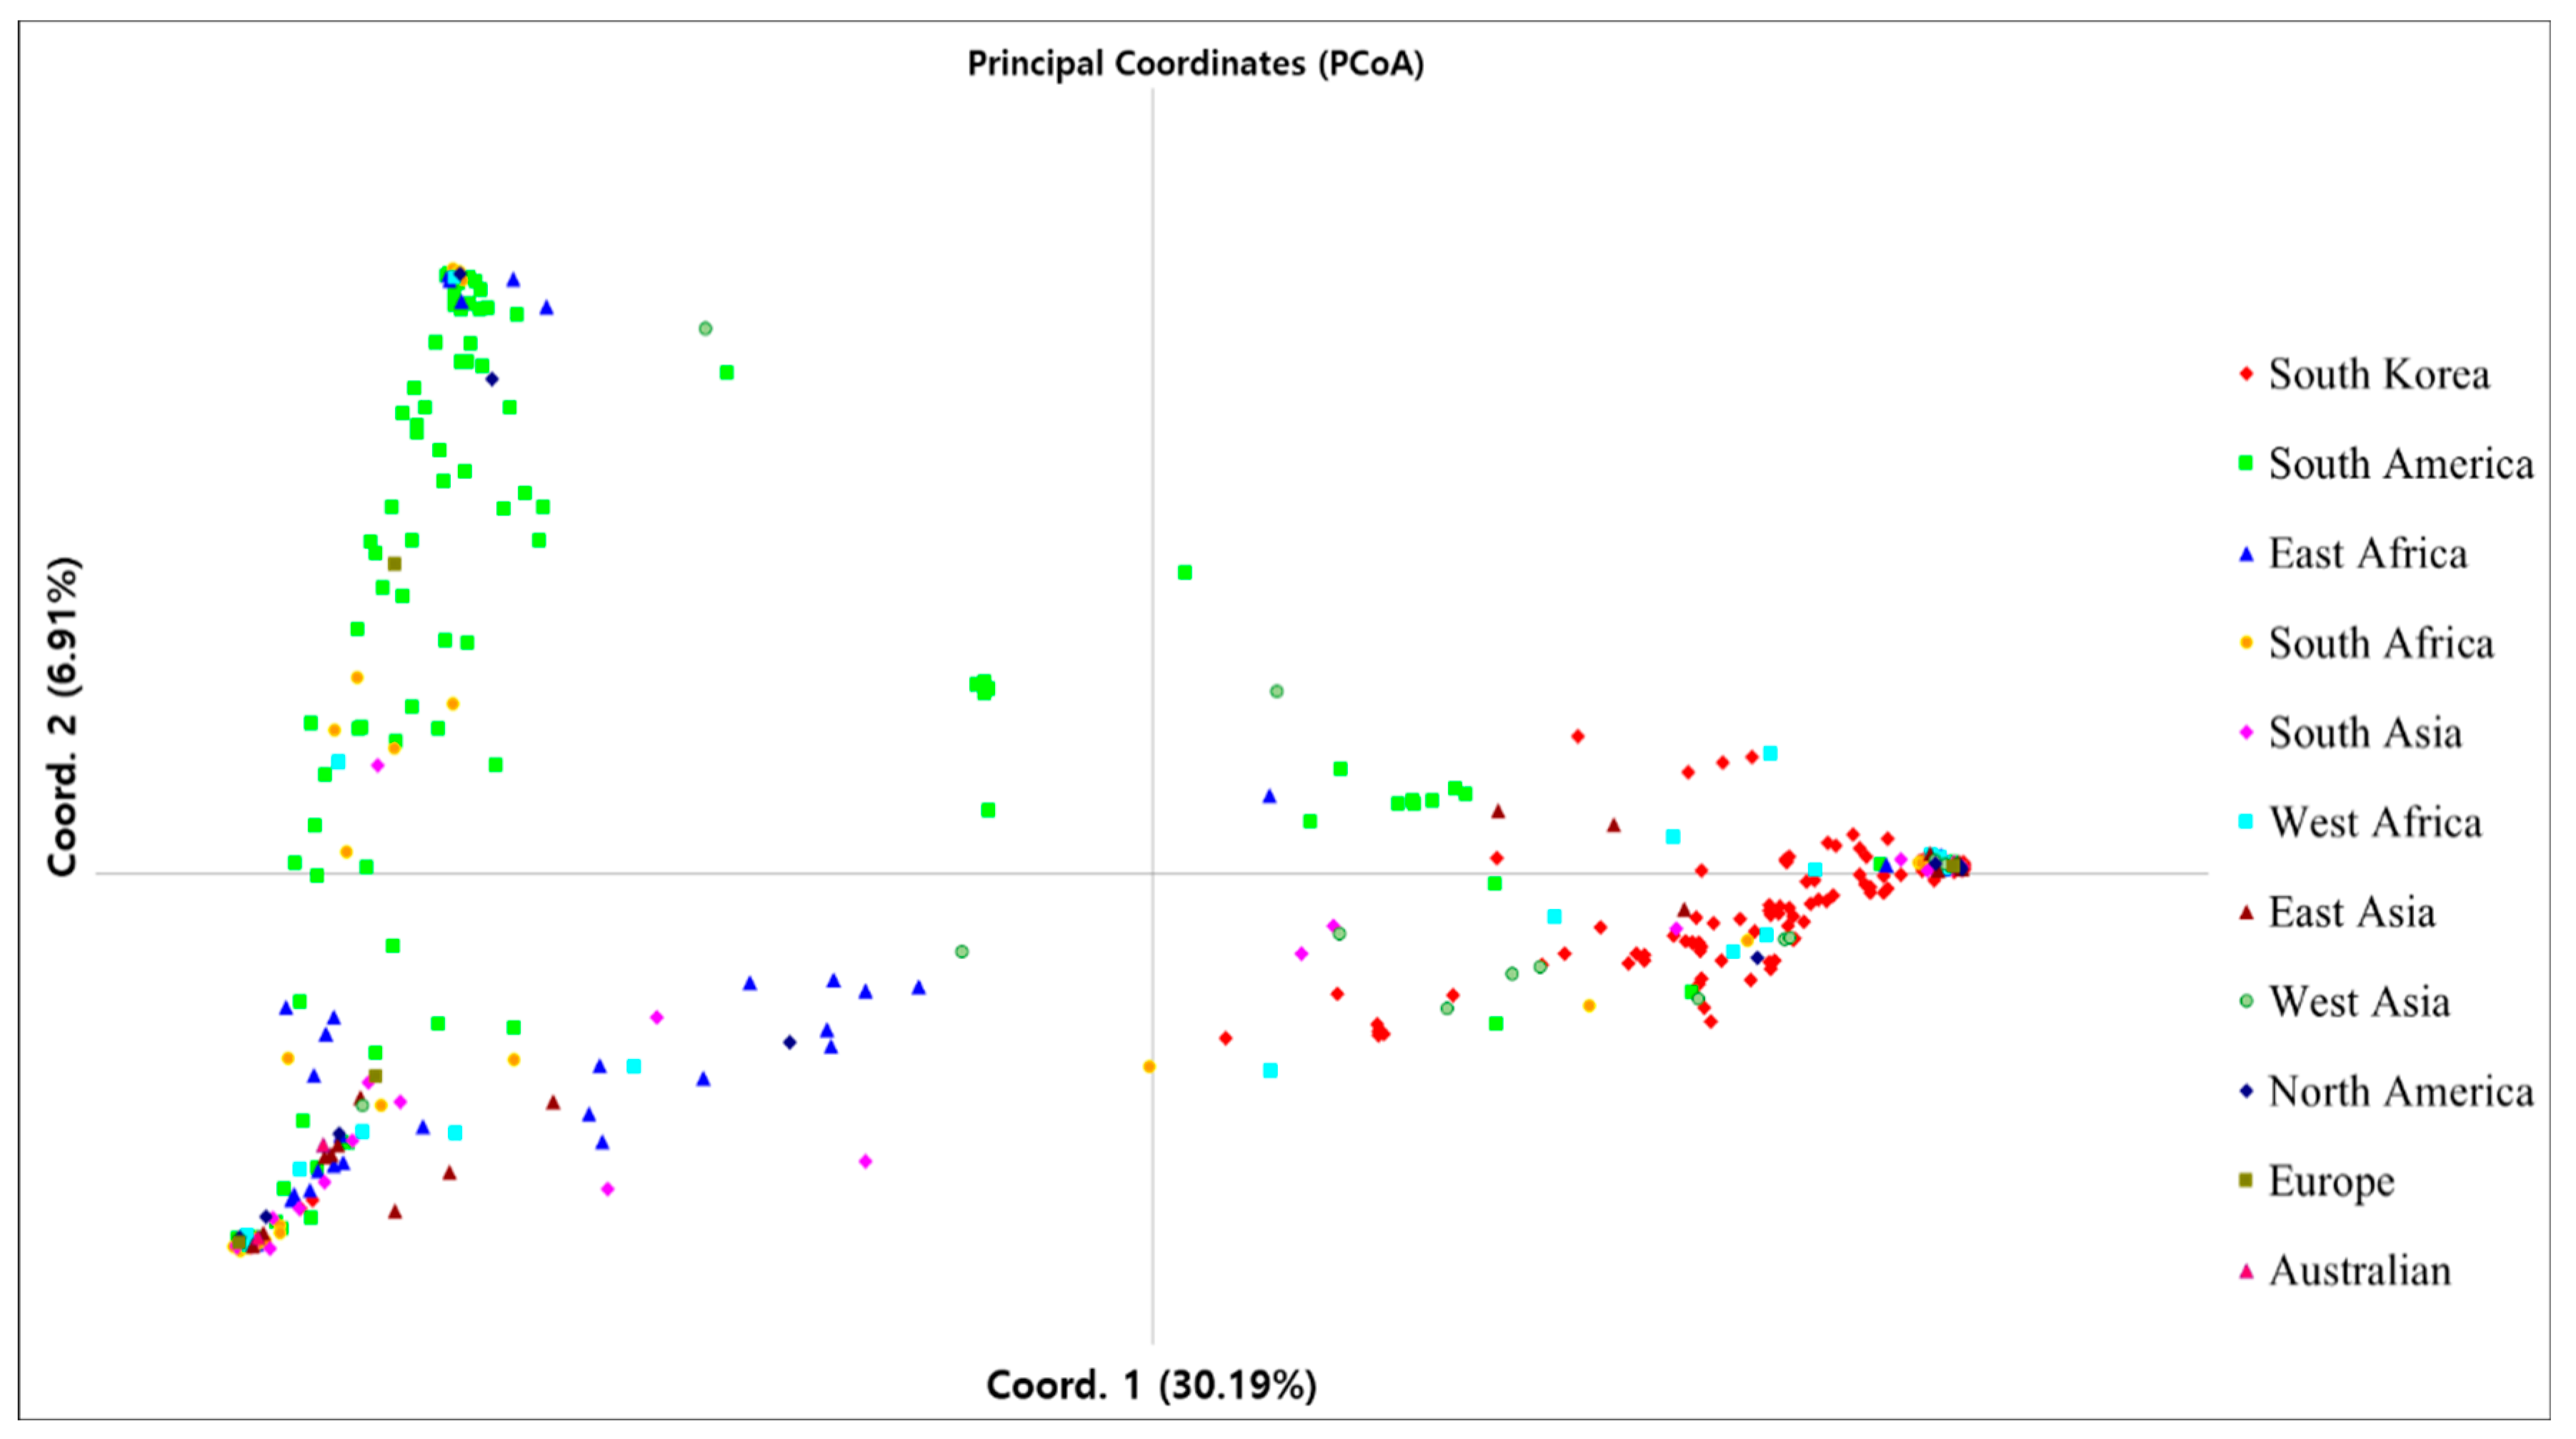
3.3. Genetic Diversity
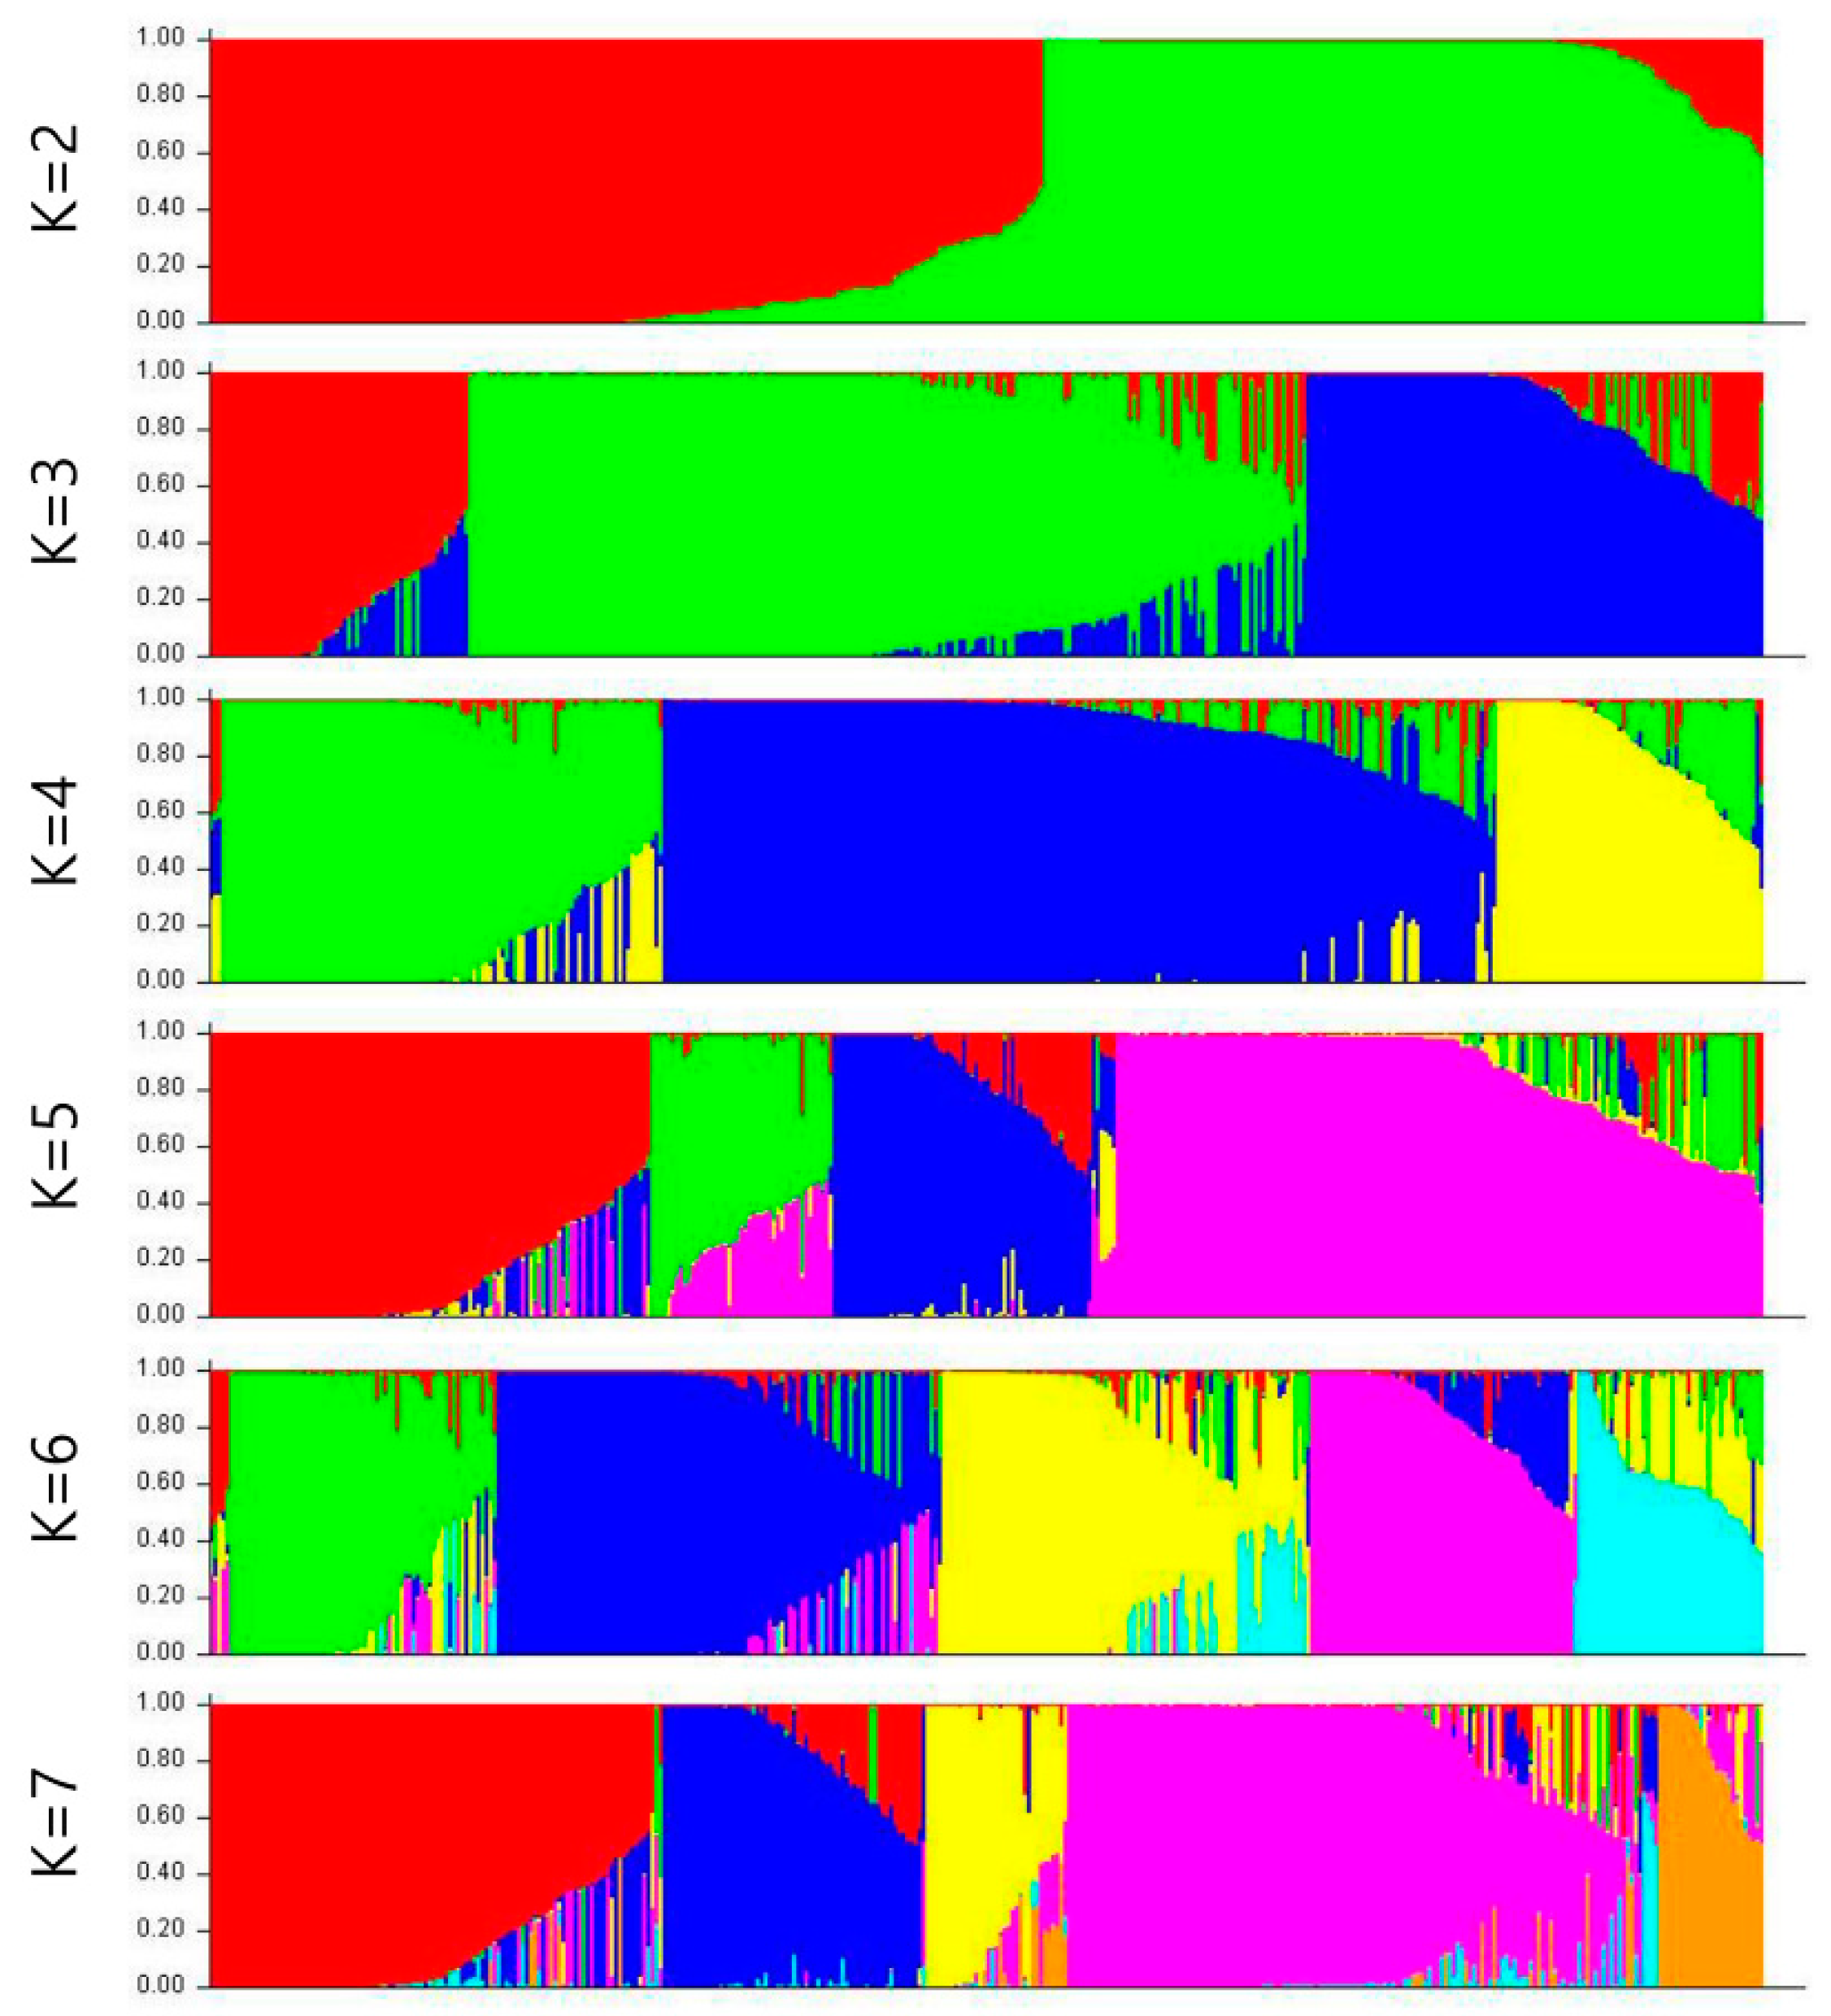
3.4. Genetic Structure
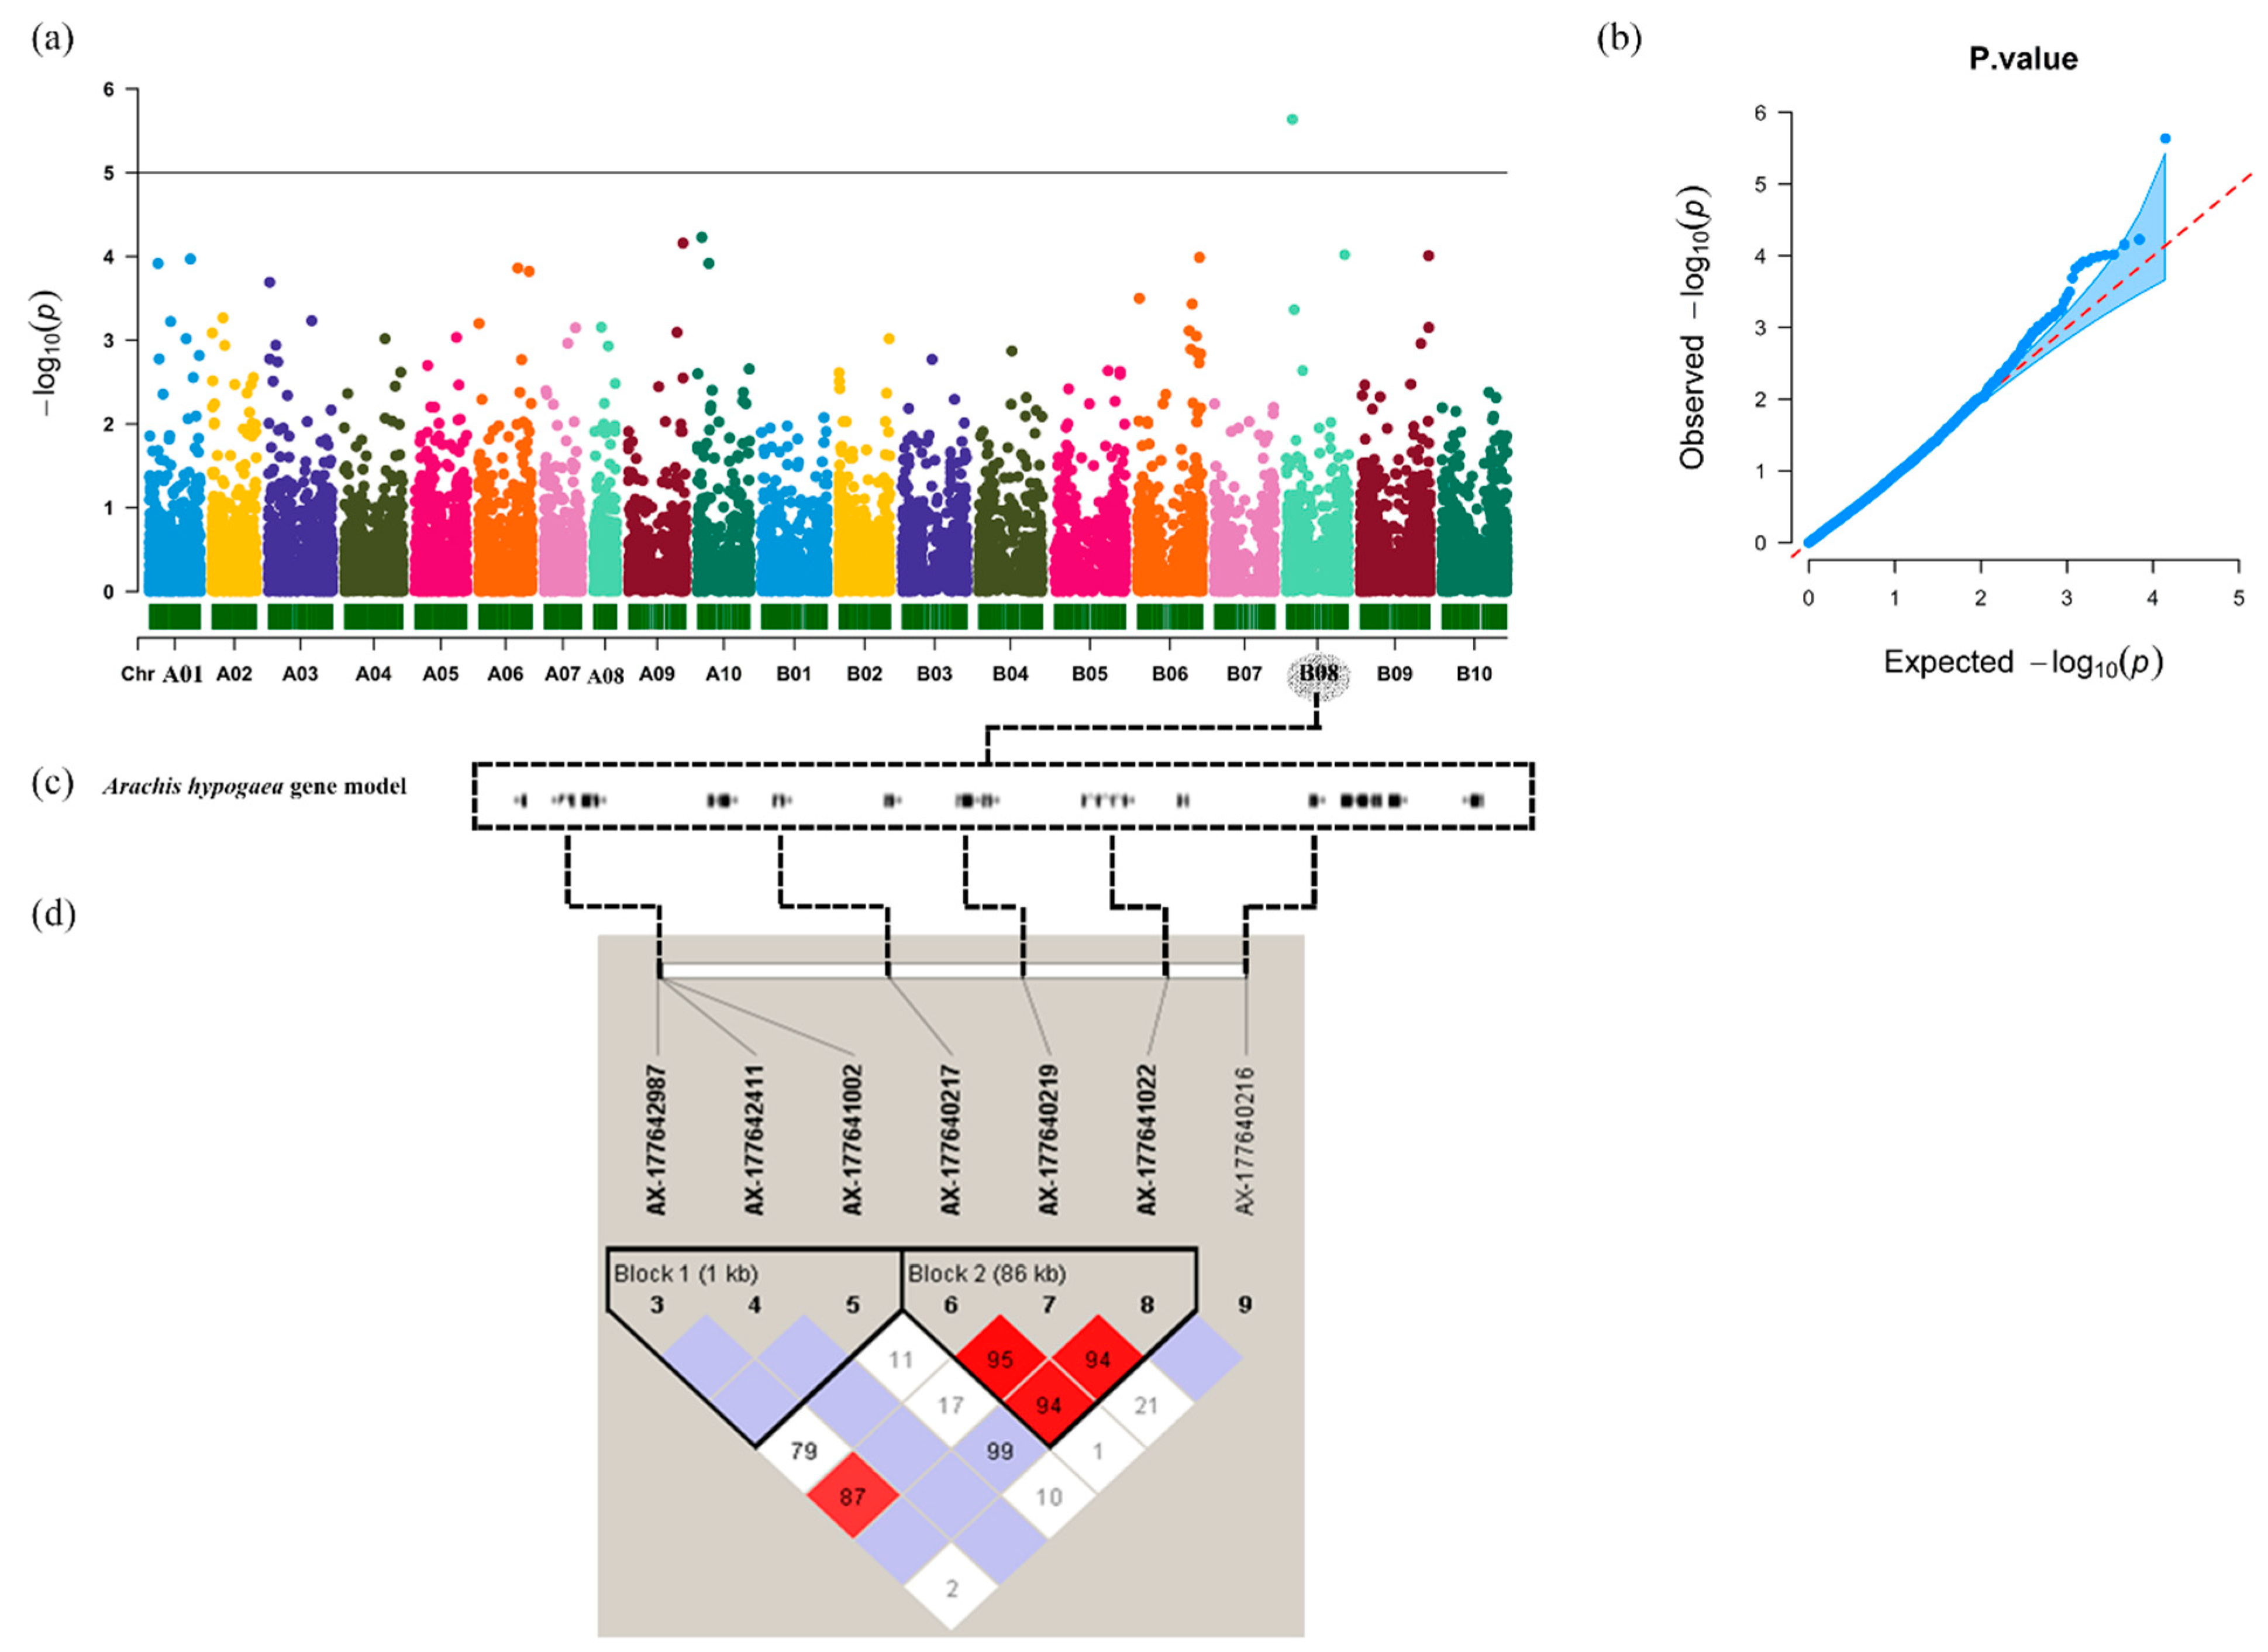
3.5. Genome-Wide Association Study (GWAS)
3.6. LD and Candidate Genes Analysis
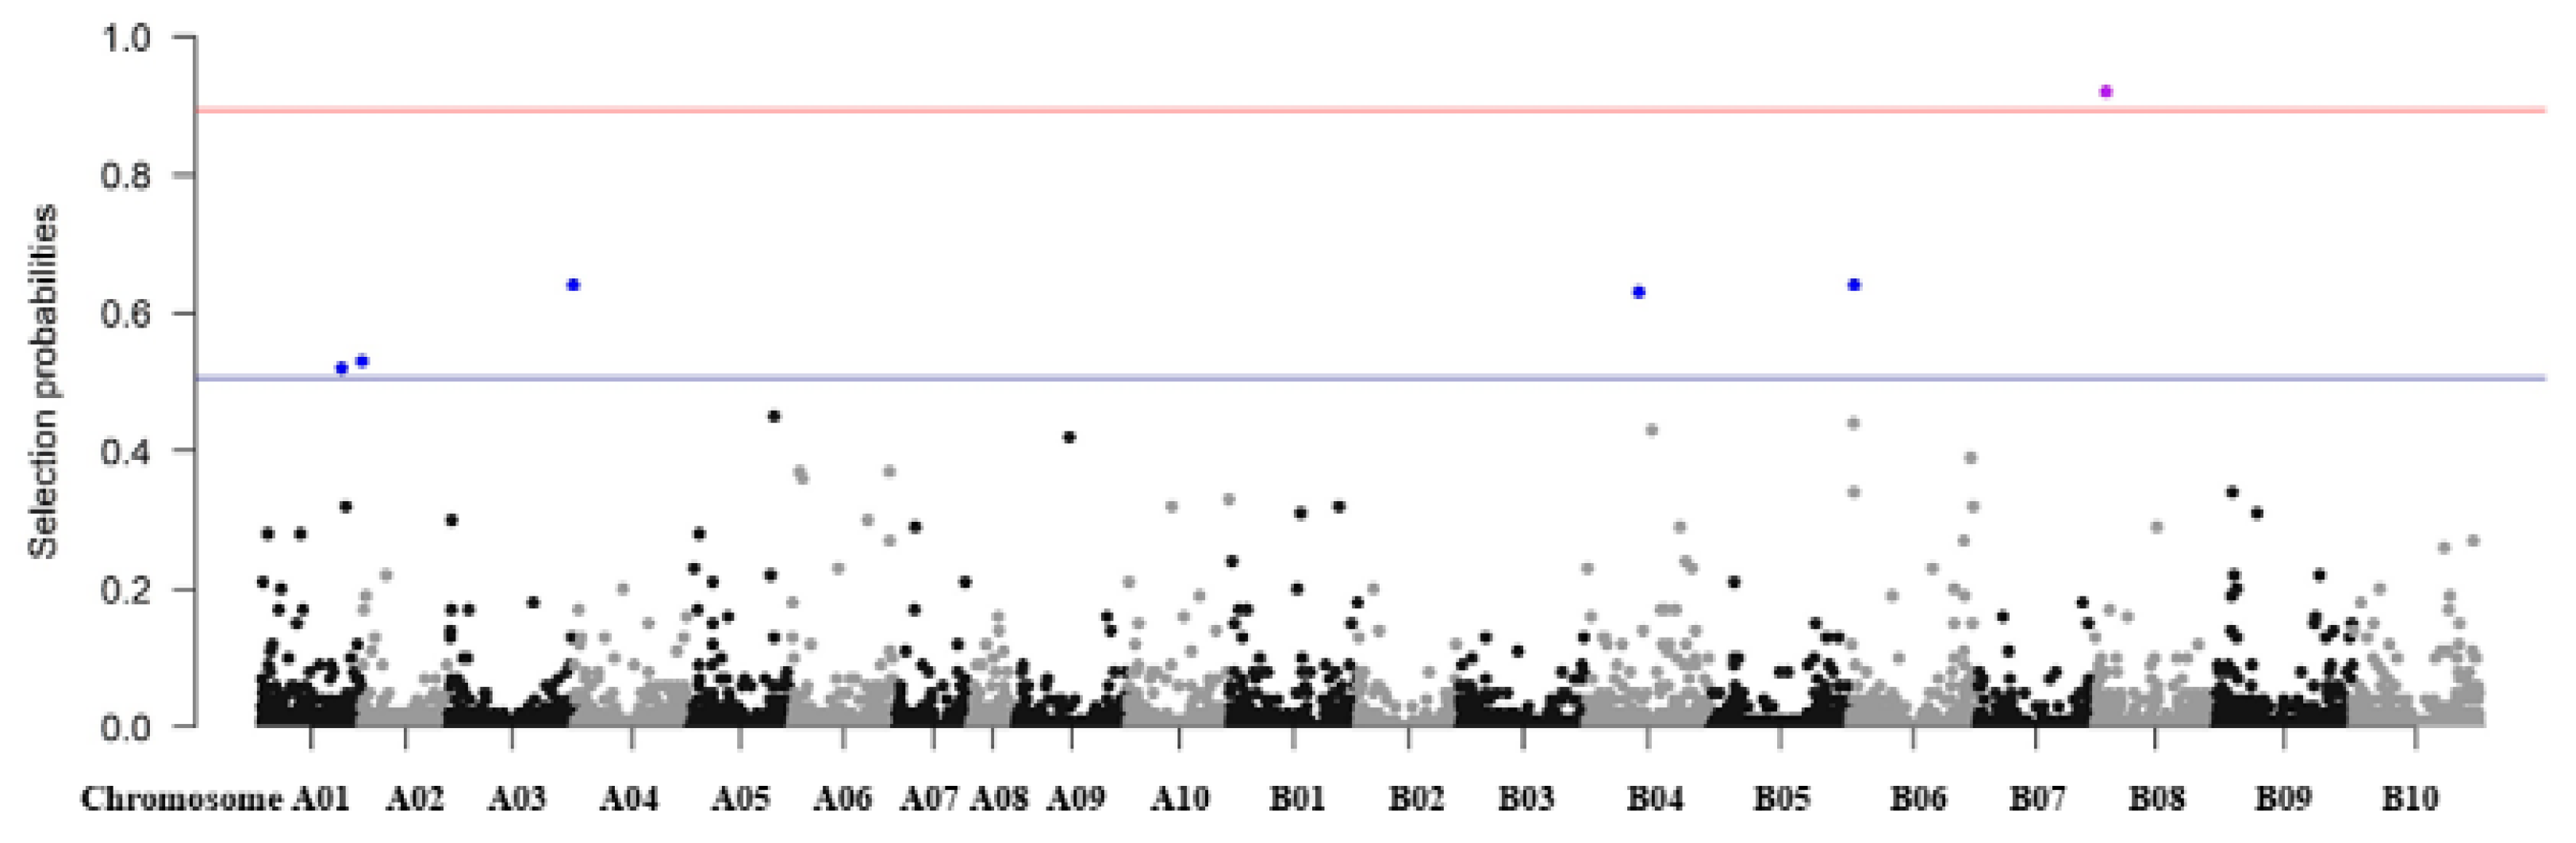
3.7. Regularization Method
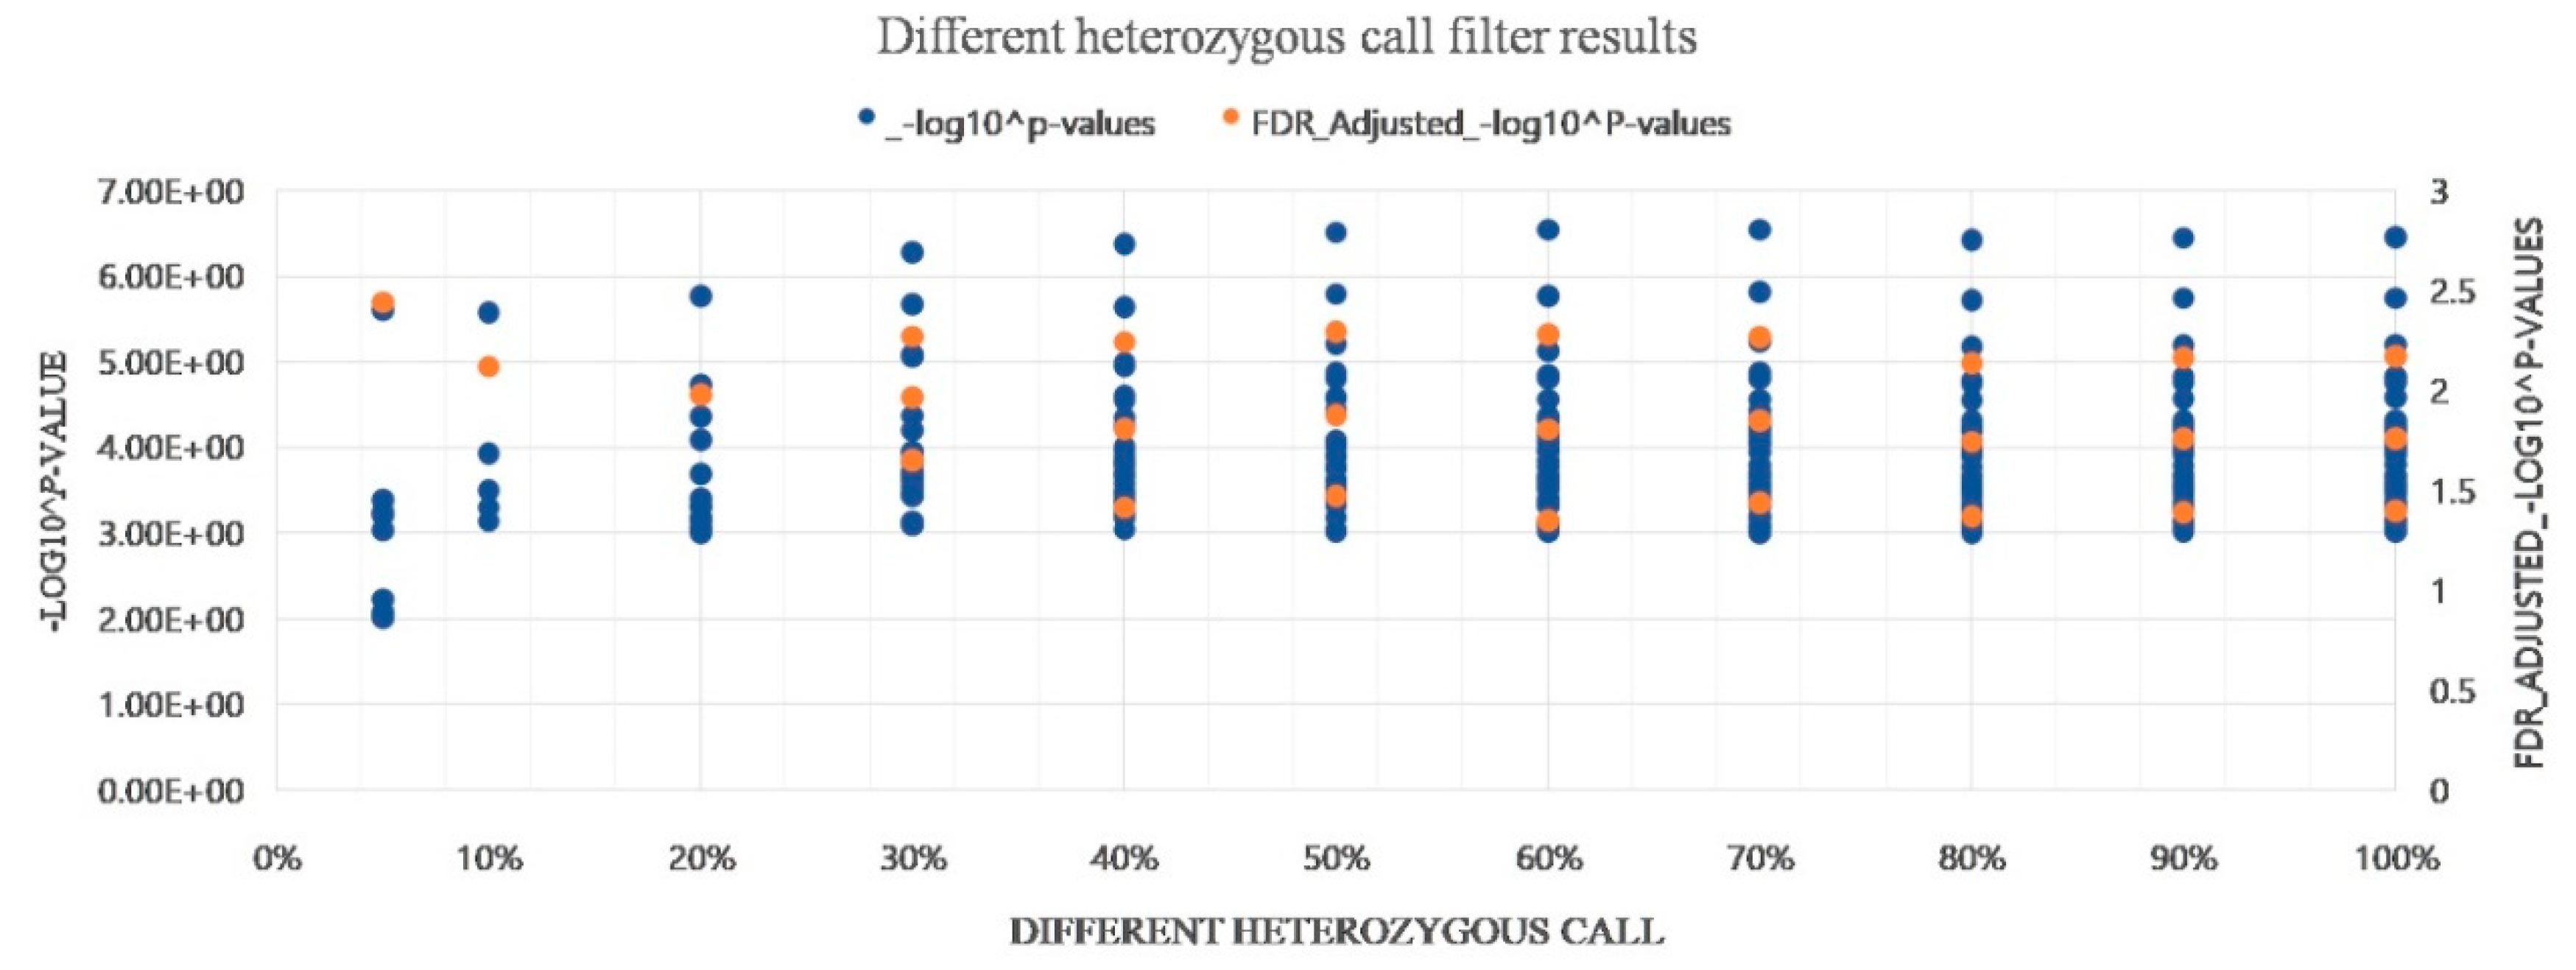
3.8. Evaluation of Heterozygous Rate
4. Discussion
5. Conclusions
Supplementary Materials
Author Contributions
Funding
Institutional Review Board Statement
Informed Consent Statement
Data Availability Statement
Conflicts of Interest
References
- Dhillon, S.S.; Rake, A.V.; Miksche, J.P. Reassociation kinetics and cytophotometric characterization of peanut (Arachis hypogaea L.) DNA. Plant Physiol. 1980, 65, 1121–1127. [Google Scholar] [CrossRef] [PubMed]
- Win, M.M.; Abdul-Hamid, A.; Baharin, B.S.; Anwar, F.; Sabu, M.C.; Pak-Dek, M.S. Phenolic compounds and antioxidant activity of peanut’s skin, hull, raw kernel and roasted kernel flour. Pak. J. Bot. 2011, 43, 1635–1642. [Google Scholar]
- Pasupuleti, J.; Nigam, S.N.; Pandey, M.K.; Nagesh, P.; Varshney, R.K. Groundnut improvement: Use of genetic and genomic tools. Front. Plant Sci. 2013, 4, 23. [Google Scholar] [CrossRef]
- Radhakrishnan, R.; Pae, S.B.; Lee, B.K.; Baek, I.Y. Evaluation of luteolin from shells of Korean peanut cultivars for industrial utilization. Afr. J. Biotechnol. 2013, 12, 4477–4480. [Google Scholar] [CrossRef]
- Musa, Ö.M. Some nutritional characteristics of kernel and oil of peanut (Arachis hypogaea L.). J. Oleo Sci. 2010, 59, 1–5. [Google Scholar] [CrossRef]
- Sales, J.M.; Resurreccion, A.V. Resveratrol in peanuts. Crit. Rev. Food Sci. Nutr. 2014, 54, 734–770. [Google Scholar] [CrossRef]
- Sundaresan, V. Control of seed size in plants. Proc. Natl. Acad. Sci. USA 2005, 102, 17887–17888. [Google Scholar] [CrossRef]
- Chu, Y.; Chee, P.; Isleib, T.G.; Holbrook, C.C.; Ozias-Akins, P. Major seed size QTL on chromosome A05 of peanut (Arachis hypogaea) is conserved in the US mini core germplasm collection. Mol. Breed. 2020, 40, 6. [Google Scholar] [CrossRef]
- Fonceka, D.; Tossim, H.A.; Rivallan, R.; Vignes, H.; Faye, I.; Ndoye, O.; Rami, J.F. Fostered and left behind alleles in peanut: Interspecific QTL mapping reveals footprints of domestication and useful natural variation for breeding. BMC Plant Biol. 2012, 12, 26. [Google Scholar] [CrossRef]
- Gomez Selvaraj, M.; Narayana, M.; Schubert, A.M.; Ayers, J.L.; Baring, M.R.; Burow, M.D. Identification of QTLs for pod and kernel traits in cultivated peanut by bulked segregant analysis. Electron. J. Biotechnol. 2009, 12, 3–4. [Google Scholar] [CrossRef]
- Zhao, Z.; Tseng, Y.C.; Peng, Z.; Lopez, Y.; Chen, C.Y.; Tillman, B.L.; Dang, P.; Wang, J. Refining a major QTL controlling spotted wilt disease resistance in cultivated peanut (Arachis hypogaea L.) and evaluating its contribution to the resistance variations in peanut germplasm. BMC Genet. 2018, 19, 17. [Google Scholar] [CrossRef] [PubMed]
- Arber, W.; Illmensee, K.; Peacock, W.J.; Starlinger, P. (Eds.) Genetic Manipulation: Impact on Man and Society (No. 1); Cambridge University Press: Cambridge, UK, 1984. [Google Scholar]
- Frankel, O.H.; Brown, A.H.D. Current Plant Genetic Resources—A Critical Appraisal; Oxford and IBH Publishing Co.: New Delhi, India, 1984. [Google Scholar]
- Zhang, H.; Zhang, D.; Wang, M.; Sun, J.; Qi, Y.; Li, J.; Han, L.; Qiu, Z.; Tang, S.; Li, Z. A core collection and mini core collection of Oryza sativa L. in China. Theor. Appl. Genet. 2011, 122, 49–61. [Google Scholar] [CrossRef] [PubMed]
- Hao, C.Y.; Zhang, X.Y.; Wang, L.F.; Dong, Y.S.; Shang, X.W.; Jia, J.Z. Genetic diversity and core collection evaluations in common wheat germplasm from the Northwestern Spring Wheat Region in China. Mol. Breed. 2006, 17, 69–77. [Google Scholar] [CrossRef]
- Yang, X.; Gao, S.; Xu, S.; Zhang, Z.; Prasanna, B.M.; Li, L.; Li, J.; Yan, J. Characterization of a global germplasm collection and its potential utilization for analysis of complex quantitative traits in maize. Mol. Breed. 2011, 28, 511–526. [Google Scholar] [CrossRef]
- Xiao, Y.; Cai, D.; Yang, W.; Ye, W.; Younas, M.; Wu, J.; Liu, K. Genetic structure and linkage disequilibrium pattern of a rapeseed (Brassica napus L.) association mapping panel revealed by microsatellites. Theor. Appl. Genet. 2012, 125, 437–447. [Google Scholar] [CrossRef]
- Holbrook, C.C.; Anderson, W.F.; Pittman, R.N. Selection of a core collection from the US germplasm collection of peanut. Crop Sci. 1993, 33, 859–861. [Google Scholar] [CrossRef]
- Jiang, H.F.; Ren, X.P.; Huang, J.Q.; Liao, B.S.; Lei, Y. Establishment of peanut mini core collection in China and exploration of new resource with high oleat. Chin. J. Oil Crop Sci. 2008, 30, 294–299. [Google Scholar]
- Hui-Fang, J.; Xiao-Ping, R.; Bo-Shou, L.; Jia-Quan, H.; Yong, L.; Ben-Yin, C.; Guo, B.Z.; Holbrook, C.C.; Upadhyaya, H.D. Peanut core collection established in China and compared with ICRISAT mini core collection. Acta Agron. Sin. 2008, 34, 25–30. [Google Scholar] [CrossRef][Green Version]
- Holbrook, C.C.; Dong, W. Development and evaluation of a mini core collection for the US peanut germplasm collection. Crop Sci. 2005, 45, 1540–1544. [Google Scholar] [CrossRef]
- Kottapalli, K.R.; Rakwal, R.; Shibato, J.; Burow, G.; Tissue, D.; Burke, J.; Puppala, N.; Burow, M.; Payton, P. Physiology and proteomics of the water-deficit stress response in three contrasting peanut genotypes. Plant Cell Environ. 2009, 32, 380–407. [Google Scholar] [CrossRef]
- Smartt, J.; Gregory, W.C.; Gregory, M.P. The genomes of Arachis hypogaea. 1. Cytogenetic studies of putative genome donors. Euphytica 1978, 27, 665–675. [Google Scholar] [CrossRef]
- Seijo, G.; Lavia, G.I.; Fernández, A.; Krapovickas, A.; Ducasse, D.A.; Bertioli, D.J.; Moscone, E.A. Genomic relationships between the cultivated peanut (Arachis hypogaea, L.) and its close relatives revealed by double GISH. Am. J. Bot. 2007, 94, 1963–1971. [Google Scholar] [CrossRef] [PubMed]
- Robledo, G.; Lavia, G.I.; Seijo, G. Species relations among wild Arachis species with the A genome as revealed by FISH mapping of rDNA loci and heterochromatin detection. Theor. Appl. Genet. 2009, 118, 1295–1307. [Google Scholar] [CrossRef] [PubMed]
- Bertioli, D.J.; Cannon, S.B.; Froenicke, L.; Huang, G.; Farmer, A.D.; Cannon, E.K.; Liu, X.; Gao, D.; Clevenger, J.; Dash, S.; et al. The genome sequences of Arachis duranensis and Arachis ipaensis, the diploid ancestors of cultivated peanut. Nat. Genet. 2016, 48, 438–446. [Google Scholar] [CrossRef]
- Kim, K.S.; Lee, D.; Bae, S.B.; Kim, Y.C.; Choi, I.S.; Kim, S.T.; Lee, T.H.; Jun, T.H. Development of SNP-Based Molecular Markers by Re-Sequencing Strategy in Peanut. Plant Breed. Biotechnol. 2017, 5, 325–333. [Google Scholar] [CrossRef]
- Moretzsohn, M.C.; Gouvea, E.G.; Inglis, P.W.; Leal-Bertioli, S.C.; Valls, J.F.; Bertioli, D.J. A study of the relationships of cultivated peanut (Arachis hypogaea) and its most closely related wild species using intron sequences and microsatellite markers. Ann. Bot. 2012, 111, 113–126. [Google Scholar] [CrossRef] [PubMed]
- Nielen, S.; Vidigal, B.S.; Leal-Bertioli, S.C.; Ratnaparkhe, M.; Paterson, A.H.; Garsmeur, O.; D’Hont, A.; Guimaraes, P.M.; Bertioli, D.J. Matita, a new retroelement from peanut: Characterization and evolutionary context in the light of the Arachis A–B genome divergence. Mol. Genet. Genom. 2012, 287, 21–38. [Google Scholar] [CrossRef] [PubMed]
- Temsch, E.M.; Greilhuber, J. Genome size variation in Arachis hypogaea and A. monticola re-evaluated. Genome 2000, 43, 449–451. [Google Scholar] [CrossRef] [PubMed]
- Chen, X.; Li, H.; Pandey, M.K.; Yang, Q.; Wang, X.; Garg, V.; Li, H.; Chi, X.; Doddamani, D.; Hong, Y.; et al. Draft genome of the peanut A-genome progenitor (Arachis duranensis) provides insights into geocarpy, oil biosynthesis, and allergens. Proc. Natl. Acad. Sci. USA 2016, 113, 6785–6790. [Google Scholar] [CrossRef]
- Chen, X.; Lu, Q.; Liu, H.; Zhang, J.; Hong, Y.; Lan, H.; Li, H.; Wang, J.; Liu, H.; Li, S.; et al. Sequencing of cultivated peanut, Arachis hypogaea, yields insights into genome evolution and oil improvement. Mol. Plant 2019, 12, 920–934. [Google Scholar] [CrossRef]
- Margulies, M.; Egholm, M.; Altman, W.E.; Attiya, S.; Bader, J.S.; Bemben, L.A.; Berka, J.; Braverman, M.S.; Chen, Y.J.; Chen, Z.; et al. Genome sequencing in micro fabricated high-density picolitre reactors. Nature 2005, 437, 376–380. [Google Scholar] [CrossRef] [PubMed]
- Yang, H.; Tao, Y.; Zheng, Z.; Li, C.; Sweetingham, M.W.; Howieson, J.G. Application of next-generation sequencing for rapid marker development in molecular plant breeding: A case study on anthracnose disease resistance in Lupinus angustifolius L. BMC Genom. 2012, 13, 318. [Google Scholar] [CrossRef] [PubMed]
- Lee, J.; Izzah, N.K.; Jayakodi, M.; Perumal, S.; Joh, H.J.; Lee, H.J.; Lee, S.C.; Park, J.Y.; Yang, K.W.; Nou, I.S.; et al. Genome-wide SNP identification and QTL mapping for black rot resistance in cabbage. BMC Plant Biol. 2015, 15, 32. [Google Scholar] [CrossRef]
- Kang, Y.J.; Ahn, Y.K.; Kim, K.T.; Jun, T.H. Resequencing of Capsicum annuum parental lines (YCM334 and Taean) for the genetic analysis of bacterial wilt resistance. BMC Plant Biol. 2016, 16, 235. [Google Scholar] [CrossRef] [PubMed]
- Zhou, X.; Xia, Y.; Ren, X.; Chen, Y.; Huang, L.; Huang, S.; Liao, B.; Lei, Y.; Yan, L.; Jiang, H. Construction of a SNP-based genetic linkage map in cultivated peanut based on large scale marker development using next-generation double-digest restriction-site-associated DNA sequencing (ddRADseq). BMC Genom. 2014, 15, 351. [Google Scholar] [CrossRef]
- Pandey, M.K.; Monyo, E.; Ozias-Akins, P.; Liang, X.; Guimarães, P.; Nigam, S.N.; Upadhyaya, H.D.; Janila, P.; Zhang, X.; Guo, B.; et al. Advances in Arachis genomics for peanut improvement. Biotechnol. Adv. 2012, 30, 639–651. [Google Scholar] [CrossRef]
- Pandey, M.K.; Agarwal, G.; Kale, S.M.; Clevenger, J.; Nayak, S.N.; Sriswathi, M.; Chitikineni, A.; Chavarro, C.; Chen, X.; Upadhyaya, H.D.; et al. Development and evaluation of a high density genotyping ‘Axiom_Arachis’ array with 58 K SNPs for accelerating genetics and breeding in groundnut. Sci. Rep. 2017, 7, 40577. [Google Scholar] [CrossRef]
- Varshney, R.K.; Mohan, S.M.; Gaur, P.M.; Gangarao, N.V.P.R.; Pandey, M.K.; Bohra, A.; Sawargaonkar, S.L.; Chitikineni, A.; Kimurto, P.K.; Janila, P.; et al. Achievements and prospects of genomics-assisted breeding in three legume crops of the semi-arid tropics. Biotechnol. Adv. 2013, 31, 1120–1134. [Google Scholar] [CrossRef]
- Pandey, M.K.; Roorkiwal, M.; Singh, V.K.; Ramalingam, A.; Kudapa, H.; Thudi, M.; Chitikineni, A.; Rathore, A.; Varshney, R.K. Emerging genomic tools for legume breeding: Current status and future prospects. Front. Plant Sci. 2016, 7, 455. [Google Scholar] [CrossRef]
- Otyama, P.I.; Wilkey, A.; Kulkarni, R.; Assefa, T.; Chu, Y.; Clevenger, J.; Anglin, N.L. Evaluation of linkage disequilibrium, population structure, and genetic diversity in the US peanut mini core collection. BMC Genom. 2019, 20, 481. [Google Scholar] [CrossRef]
- Patil, A.S.; Popovsky, S.; Levy, Y.; Chu, Y.; Clevenger, J.; Ozias-Akins, P.; Hovav, R. Genetic insight and mapping of the pod constriction trait in Virginia-type peanut. BMC Genet. 2018, 19, 93. [Google Scholar] [CrossRef] [PubMed]
- Peng, Z.; Zhao, Z.; Clevenger, J.P.; Chu, Y.; Paudel, D.; Ozias-Akins, P.; Wang, J. Comparison of SNP Calling Pipelines and NGS Platforms to Predict the Genomic Regions Harboring Candidate Genes for Nodulation in Cultivated Peanut. Front. Genet. 2020, 11, 222. [Google Scholar] [CrossRef] [PubMed]
- Li, X.; Singh, J.; Qin, M.; Li, S.; Zhang, X.; Zhang, M.; Khan, A.; Zhang, S.; Wu, J. Development of an integrated 200K SNP genotyping array and application for genetic mapping, genome assembly improvement and genome wide association studies in pear (Pyrus). Plant Biotechnol. J. 2019, 17, 1582–1594. [Google Scholar] [CrossRef] [PubMed]
- Tam, V.; Patel, N.; Turcotte, M.; Bossé, Y.; Paré, G.; Meyre, D. Benefits and limitations of genome-wide association studies. Nat. Rev. Genet. 2019, 20, 467–484. [Google Scholar] [CrossRef]
- Korte, A.; Farlow, A. The advantages and limitations of trait analysis with GWAS: A review. Plant Methods 2013, 9, 29. [Google Scholar] [CrossRef]
- Salem, M.; Al-Tobasei, R.; Ali, A.; Lourenco, D.; Gao, G.; Palti, Y.; Leeds, T.D. Genome-wide association analysis with a 50K transcribed gene SNP-chip identifies QTL affecting muscle yield in rainbow trout. Front. Genet. 2018, 9, 387. [Google Scholar] [CrossRef]
- Bayer, M.M.; Rapazote-Flores, P.; Ganal, M.; Hedley, P.E.; Macaulay, M.; Plieske, J.; Waugh, R. Development and evaluation of a barley 50k iSelect SNP array. Front. Plant Sci. 2017, 8, 1792. [Google Scholar] [CrossRef]
- Comadran, J.; Kilian, B.; Russell, J.; Ramsay, L.; Stein, N.; Ganal, M.; Hedley, P. Natural variation in a homolog of Antirrhinum CENTRORADIALIS contributed to spring growth habit and environmental adaptation in cultivated barley. Nat. Genet. 2012, 44, 1388–1392. [Google Scholar] [CrossRef]
- Allen, A.M.; Winfield, M.O.; Burridge, A.J.; Downie, R.C.; Benbow, H.R.; Barker, G.L.; Scopes, G. Characterization of a Wheat Breeders’ Array suitable for high-throughput SNP genotyping of global accessions of hexaploid bread wheat (Triticum aestivum). Plant Biotechnol. J. 2017, 15, 390–401. [Google Scholar] [CrossRef]
- Saghai-Maroof, M.A.; Soliman, K.M.; Jorgensen, R.A.; Allard, R.W.L. Ribosomal DNA spacer-length polymorphisms in barley: Mendelian inheritance, chromosomal location, and population dynamics. Proc. Natl. Acad. Sci. USA 1984, 81, 8014–8018. [Google Scholar] [CrossRef]
- Ya, N.; Raveendar, S.; Bayarsukh, N.; Ya, M.; Lee, J.R.; Lee, K.J.; Shin, M.J.; Cho, G.T.; Ma, K.H.; Lee, G.A. Genetic diversity and population structure of Mongolian wheat based on SSR markers: Implications for conservation and management. Plant Breed. Biotechnol. 2017, 5, 213–220. [Google Scholar] [CrossRef]
- Singh, N.; Choudhury, D.R.; Singh, A.K.; Kumar, S.; Srinivasan, K.; Tyagi, R.K.; Singh, N.K.; Singh, R. Comparison of SSR and SNP markers in estimation of genetic diversity and population structure of Indian rice varieties. PLoS ONE 2013, 8, e84136. [Google Scholar] [CrossRef] [PubMed]
- Tang, Y.; Liu, X.; Wang, J.; Li, M.; Wang, Q.; Tian, F.; Buckler, E.S. GAPIT version 2: An enhanced integrated tool for genomic association and prediction. Plant Genome 2016, 9. [Google Scholar] [CrossRef] [PubMed]
- Yu, J.; Buckler, E.S. Genetic association mapping and genome organization of maize. Curr. Opin. Biotechnol. 2006, 17, 155–160. [Google Scholar] [CrossRef] [PubMed]
- Bradbury, P.J.; Zhang, Z.; Kroon, D.E.; Casstevens, T.M.; Ramdoss, Y.; Buckler, E.S. TASSEL: Software for association mapping of complex traits in diverse samples. Bioinformatics 2007, 23, 2633–2635. [Google Scholar] [CrossRef] [PubMed]
- Zhang, C.; Dong, S.S.; Xu, J.Y.; He, W.M.; Yang, T.L. PopLDdecay: A fast and effective tool for linkage disequilibrium decay analysis based on variant call format files. Bioinformatics 2019, 35, 1786–1788. [Google Scholar] [CrossRef]
- Chu, C.W.; Zhang, G.P. A comparative study of linear and nonlinear models for aggregate retail sales forecasting. Int. J. Prod. Econ. 2003, 86, 217–231. [Google Scholar] [CrossRef]
- Barrett, J.C.; Fry, B.; Maller, J.; Daly, M.J. Haploview: Analysis and visualization of LD and haplotype maps. Bioinformatics 2005, 21, 263–265. [Google Scholar] [CrossRef]
- Lewontin, R.C. The interaction of selection and linkage. I. General considerations; heterotic models. Genetics 1964, 49, 49–67. [Google Scholar]
- Wu, T.T.; Chen, Y.F.; Hastie, T.; Sobel, E.; Lange, K. Genome-wide association analysis by lasso penalized logistic regression. Bioinformatics 2009, 25, 714–721. [Google Scholar] [CrossRef]
- Zhou, H.; Sehl, M.E.; Sinsheimer, J.S.; Lange, K. Association screening of common and rare genetic variants by penalized regression. Bioinformatics 2010, 26, 2375. [Google Scholar] [CrossRef] [PubMed]
- Alexander, D.H.; Lange, K. Stability selection for genome-wide association. Genet. Epidemiol. 2011, 35, 722–728. [Google Scholar] [CrossRef] [PubMed]
- Sun, H.; Wang, S. Penalized logistic regression for high-dimensional DNA methylation data with case-control studies. Bioinformatics 2012, 28, 1368–1375. [Google Scholar] [CrossRef] [PubMed]
- Sun, H.; Wang, S. Network-based regularization for matched case-control analysis of high-dimensional DNA methylation data. Stat. Med. 2013, 32, 2127–2139. [Google Scholar] [CrossRef]
- Okser, S.; Pahikkala, T.; Airola, A.; Salakoski, T.; Ripatti, S.; Aittokallio, T. Regularized machine learning in the genetic prediction of complex traits. PLoS Genet. 2014, 10, e1004754. [Google Scholar] [CrossRef]
- Sun, H.; Wang, Y.; Chen, Y.; Li, Y.; Wang, S. pETM: A penalized Exponential Tilt Model for analysis of correlated high-dimensional DNA methylation data. Bioinformatics 2017, 33, 1765–1772. [Google Scholar] [CrossRef]
- Tibshirani, R. Regression shrinkage and selection via the lasso. J. R. Stat. Soc. Ser. B 1996, 58, 267–288. [Google Scholar] [CrossRef]
- Nicolai, M.; Bühlmann, P. Stability Selection: Stability Selection. J. R. Stat. Soc. Ser. B 2010, 72, 417–473. [Google Scholar] [CrossRef]
- Kim, K.; Koo, J.; Sun, H. An empirical threshold of selection probability for analysis of high-dimensional correlated data. J. Stat. Comput. Simul. 2020, 90, 1606–1617. [Google Scholar] [CrossRef]
- Zhang, S.; Hu, X.; Miao, H.; Chu, Y.; Cui, F.; Yang, W.; Wang, C.; Shen, Y.; Xu, T.; Zhao, L.; et al. QTL identification for seed weight and size based on a high-density SLAF-seq genetic map in peanut (Arachis hypogaea L.). BMC Plant Biol. 2019, 19, 537. [Google Scholar] [CrossRef]
- Hu, Z.; Zhang, H.; Kan, G.; Ma, D.; Zhang, D.; Shi, G.; Hong, D.; Zhang, G.; Yu, D. Determination of the genetic architecture of seed size and shape via linkage and association analysis in soybean (Glycine max L. Merr.). Genetica 2013, 141, 247–254. [Google Scholar] [CrossRef] [PubMed]
- Bertioli, D.J.; Jenkins, J.; Clevenger, J.; Dudchenko, O.; Gao, D.; Samoluk, S.S. The genome sequence of segmental allotetraploid peanut Arachis hypogaea. Nature genetics 2019, 51, 877–884. [Google Scholar] [CrossRef] [PubMed]
- Otyama, P.I.; Kulkarni, R.; Chamberlin, K.; Ozias-Akins, P.K.; Chu, J.; Fernández-Baca, D.F. Genotypic characterization of the US peanut core collection. BioRxiv 2020. [Google Scholar] [CrossRef]
- Hammons, R.O.; Herman, D.; Stalker, H.T. Origin and early history of the peanut. In Peanuts; AOCS Press: Urbana, IL, USA, 2016; pp. 1–26. [Google Scholar] [CrossRef]
- Simpson, C.E.; Krapovickas, A.; Valls, J.F.M. History of Arachis including evidence of A. hypogaea L. progenitors. Peanut Sci. 2001, 28, 78–80. [Google Scholar] [CrossRef]
- Stalker, H.T.; Dhesi, J.S.; Kochert, G. Genetic diversity within the species Arachis duranensis Krapov. & W. C. Gregory, a possible progenitor of cultivated peanut. Genome 1995, 38, 1201–1212. [Google Scholar] [CrossRef]
- Stalker, H.T.; Tallury, S.P.; Seijo, G.R.; Leal-Bertioli, S.C. Biology, speciation, and utilization of peanut species. In Peanuts; AOCS Press: Urbana, IL, USA, 2016; pp. 27–66. [Google Scholar] [CrossRef]
- Simon, N.; Friedman, J.; Hastie, T.; Tibshirani, R. A sparse-group lasso. J. Comput. Graph. Stat. 2013, 22, 231–245. [Google Scholar] [CrossRef]
- Li, C.; Li, H. Network-constrained regularization and variable selection for analysis of genomic data. Bioinformatics 2008, 24, 1175–1182. [Google Scholar] [CrossRef]
- Anderson, C.A.; Pettersson, F.H.; Clarke, G.M.; Cardon, L.R.; Morris, A.P.; Zondervan, K.T. Data quality control in genetic case-control association studies. Nat. Protoc. 2010, 5, 1564–1573. [Google Scholar] [CrossRef]
- Rao, X.; Thapa, K.S.; Chen, A.B.; Lin, H.; Gao, H.; Reiter, J.L.; Hargreaves, K.A.; Ipe, J.; Lai, D.; Xuei, X.; et al. Allele-specific expression and high-throughput reporter assay reveal functional genetic variants associated with alcohol use disorders. Mol. Psychiatry 2019, 1–10. [Google Scholar] [CrossRef]
- Oliveira, J.C.D.; Rufino, P.B.; Azêvedo, H.S.F.D.S.; Sousa, A.C.B.D.; Assis, G.M.L.D.; Silva, L.M.D.; Campos, T.D. Inferring mating system parameters in forage peanut, Arachis pintoi, for Brazilian Amazon conditions. Acta Amazonica 2019, 49, 277–282. [Google Scholar] [CrossRef]
- Baud, S. Seeds as oil factories. Plant Reprod. 2018, 31, 213–235. [Google Scholar] [CrossRef]
- Smith, A.J.; Rinne, R.W.; Seif, R.D. Phosphoenolpyruvate carboxylase and pyruvate kinase involvement in protein and oil biosynthesis during soybean seed development. Crop Sci. 1989, 29, 349–353. [Google Scholar] [CrossRef]
- Feria, A.B.; Alvarez, R.; Cochereau, L.; Vidal, J.; García-Mauriño, S.; Echevarría, C. Regulation of phosphoenolpyruvate carboxylase phosphorylation by metabolites and abscisic acid during the development and germination of barley seeds. Plant Physiol. 2008, 148, 761–774. [Google Scholar] [CrossRef] [PubMed]
- Aivalakis, G.; Dimou, M.; Flemetakis, E.; Plati, F.; Katinakis, P.; Drossopoulos, J.B. Immunolocalization of carbonic anhydrase and phosphoenolpyruvate carboxylase in developing seeds of Medicago sativa. Plant Physiol. Biochem. 2004, 42, 181–186. [Google Scholar] [CrossRef] [PubMed]
- Golombek, S.; Rolletschek, H.; Wobus, U.; Weber, H. Control of storage protein accumulation during legume seed development. J. Plant Physiol. 2001, 158, 457–464. [Google Scholar] [CrossRef]
- Pan, L.J.; Yang, Q.L.; Chi, X.Y.; Chen, M.N.; Zhen, Y.A.N.G.; Na, C.H.E.N.; Yu, S.L. Functional analysis of the phosphoenolpyruvate carboxylase on the lipid accumulation of peanut (Arachis hypogaea L.) seeds. J. Integr. Agric. 2013, 12, 36–44. [Google Scholar] [CrossRef]


| SNP | Chromosome | Position (bp) | p-Value (p) | FDR_Adjusted_p-Values |
|---|---|---|---|---|
| AX-177640219 | Araip.B08 | 12829161 | 2.31 × 10⁻⁶ | 0.032 |
| AX-147235444 | Aradu.A10 | 8911644 | 5.91 × 10⁻⁵ | NS a |
| AX-176807953 | Aradu.A09 | 113907685 | 6.95 × 10⁻⁵ | NS |
| AX-176822392 | Araip.B08 | 121783058 | 9.55 × 10⁻⁵ | NS |
| AX-147262340 | Araip.B09 | 143554366 | 9.80 × 10⁻⁵ | NS |
Publisher’s Note: MDPI stays neutral with regard to jurisdictional claims in published maps and institutional affiliations. |
© 2020 by the authors. Licensee MDPI, Basel, Switzerland. This article is an open access article distributed under the terms and conditions of the Creative Commons Attribution (CC BY) license (http://creativecommons.org/licenses/by/4.0/).
Share and Cite
Zou, K.; Kim, K.-S.; Kim, K.; Kang, D.; Park, Y.-H.; Sun, H.; Ha, B.-K.; Ha, J.; Jun, T.-H. Genetic Diversity and Genome-Wide Association Study of Seed Aspect Ratio Using a High-Density SNP Array in Peanut (Arachis hypogaea L.). Genes 2021, 12, 2. https://doi.org/10.3390/genes12010002
Zou K, Kim K-S, Kim K, Kang D, Park Y-H, Sun H, Ha B-K, Ha J, Jun T-H. Genetic Diversity and Genome-Wide Association Study of Seed Aspect Ratio Using a High-Density SNP Array in Peanut (Arachis hypogaea L.). Genes. 2021; 12(1):2. https://doi.org/10.3390/genes12010002
Chicago/Turabian StyleZou, Kunyan, Ki-Seung Kim, Kipoong Kim, Dongwoo Kang, Yu-Hyeon Park, Hokeun Sun, Bo-Keun Ha, Jungmin Ha, and Tae-Hwan Jun. 2021. "Genetic Diversity and Genome-Wide Association Study of Seed Aspect Ratio Using a High-Density SNP Array in Peanut (Arachis hypogaea L.)" Genes 12, no. 1: 2. https://doi.org/10.3390/genes12010002
APA StyleZou, K., Kim, K.-S., Kim, K., Kang, D., Park, Y.-H., Sun, H., Ha, B.-K., Ha, J., & Jun, T.-H. (2021). Genetic Diversity and Genome-Wide Association Study of Seed Aspect Ratio Using a High-Density SNP Array in Peanut (Arachis hypogaea L.). Genes, 12(1), 2. https://doi.org/10.3390/genes12010002