Article

Characterization of Quantitative Trait Loci for Germination and Coleoptile Length under Low-Temperature Condition Using Introgression Lines Derived from an Interspecific Cross in Rice

1
Department of Agronomy, Chungnam National University, Daejeon 34134, Korea
2
Department of Southern Area Crop Science, National Institute of Crop Science, RDA, Miryang 50424, Korea
*
Author to whom correspondence should be addressed.
Genes 2020, 11(10), 1200; https://doi.org/10.3390/genes11101200
Submission received: 24 August 2020 / Revised: 8 October 2020 / Accepted: 9 October 2020 / Published: 15 October 2020
(This article belongs to the Special Issue Recent Advances in Genetics and Breeding of Major Staple Food Crops)

Abstract

:
Previously, five putative quantitative trait loci (QTLs) for low-temperature germination (LTG) have been detected using 96 BC3F8 lines derived from an interspecific cross between the Korean japonica cultivar “Hwaseong” and Oryza rufipogon. In the present study, two introgression lines, CR1517 and CR1518, were used as parents to detect additional QTLs and analyze interactions among QTLs for LTG. The F2 population (154 plants) along with parental lines, Hwaseong and O. rufipogon, were evaluated for LTG and coleoptile length under low-temperature conditions (13 °C). Among five QTLs for LTG, two major QTLs, qLTG1 and qLTG3, were consistently detected at 6 and 7 days after incubation. Three minor QTLs were detected on chromosomes 8 and 10. Two QTLs, qLTG10.1 and qLTG10.2, showing linkage on chromosome 10, exerted opposite effects with the Hwaseong allele at qLTG10.2 and the O. rufipogon allele at qLTG10.1 respectively, in turn, increasing LTG. Interactions among QTLs were not significant, implying that the QTLs act in an additive manner. Near-isogenic line plants with the combination of favorable alleles from O. rufipogon and Hwaseong exhibited higher LTG than two introgression lines. With regard to coleoptile length, three QTLs observed on chromosomes 1, 3, and 8 were colocalized with QTLs for LTG, suggesting the pleiotropy of the single gene at each locus. According to the results, the introgression of favorable O. rufipogon alleles could hasten the development of rice with high LTG and high coleoptile elongation in japonica cultivars.

1. Introduction

Rice is one of the most important crops, feeding more than a third of the global population. Global rice demand is projected to rise from 723 million tons in 2015 to 763 million tons by 2020 and is expected to increase further to 852 million tons by 2035 [1]. To feed the growing population, rice production needs to be improved and stabilized, globally and regionally. Improving potential yield and incorporation of biotic and abiotic stress tolerance mechanisms would facilitate the achievement of such goals. Wild relatives of rice are rich sources of desirable genes, not only with regard to yield but also with regard to disease resistance, stress tolerance, and other traits [2,3]. Exploring wild and exotic rice germplasm for desirable genes and transferring them into cultivars through crossing and marker-assisted selection (MAS) has been demonstrated to be feasible approaches of increasing rice yield and augmenting stress tolerance [4].
Rice is cultivated in tropical, subtropical, and temperate regions of the globe. Low-temperature is one of the abiotic stress factors that lead to growth retardation and yield loss in rice cultivated at high latitudes and in the northern regions of the globe [5]. Throughout the rice cultivation period, decreasing temperatures to levels lower than the optimum could influence rice development significantly and can result in severe yield loss [6]. During the seed development period, various factors, such as environment and genetic background, influence low-temperature germination [7]. In rice cultivating regions, in areas where rice is irrigated with cold water, weak seedling growth and slow growth reduce yield significantly [8,9,10,11,12,13].
Along with rapid low-temperature germination (LTG), vigorous coleoptile growth is essential in direct seeding rice, when rice seeds are sown in flooded paddy fields and watered with cold irrigation water [14]. The rice coleoptile is a small and ephemeral organ that emerges first in imbibed rice seeds [15].
To determine the genetic basis of low-temperature germinability and coleoptile elongation in rice, numerous independent studies have been conducted using biparental populations and genome-wide association studies [6,8,9,12,16,17,18,19,20,21]. A total of 11 QTLs have been associated with low-temperature germination ability in the population derived from a cross between indica (N22) and japonica (USSR5) rice [12]. Three QTLs associated with low-temperature germination have been detected, and among them, qLTG-9 was fine mapped to a 72.3-kbp region on chromosome 9 [22]. In addition, Lee et al. (2015) detected two colocalized QTLs for LTG and coleoptile length under a low-temperature condition (13 °C) [6]. Fukuda et al. (2015) also identified two QTLs associated with coleoptile length under 16 °C conditions [23]. Using the genome-wide association (GWAS) method, two QTLs associated with germination under cold tolerance, qCTGERM8-1 and qCTGERM8-2, were identified in 421 accessions from a rice diversity panel (RDP1) [24]. In addition, Fujino et al. (2015) detected qLTG8 on the RM5647 marker locus in 63 Japanese landraces [18]. Li et al. (2019) reported that Chinese Dongxiang wild rice (O. rufipogon Griff.) alleles at all five QTLs resulted in delayed germination rates, and QTL pyramiding line DX71 led to rapid germination and vigorous seedling survival under low-temperature conditions (15 °C and 8 °C) [25]. RNAseq analysis was conducted with two indica rice genotypes under cold treatment and detected 1361 differentially expressed transcripts [26].
Such studies indicate that low-temperature germination QTLs are distributed widely throughout the rice genome. However, the stability of such putative QTLs has not been tested in near-isogenic backgrounds, and studies analyzing interactions among QTLs are limited. Characterization of the QTLs underlying LTG and their interactions could provide more insights into the mechanisms of low-temperature germinability in rice and would be potentially more useful for pyramiding QTLs aimed at improving LTG in rice.
In our previous study, five QTLs for low-temperature germinability, qLTG1, qLTG3, qLTG4, qLTG10, and qLTG11 were mapped using a BC4F8 population including 96 introgression lines (ILs) derived from an interspecific cross between a Korean elite line Hwaseong and O. rufipogon [27]. Recently, qLTG1 was fine mapped using introgression lines and the new qLTG3-1 allele of the O. rufipogon was identified [28,29]. In the present study, we used two introgression lines, CR1517 and CR1518, which consistently exhibit higher LTG than Hwaseong due to O. rufipogon introgression segments in the Hwaseong genetic background, as parents. Using 154 F2 plants derived from a cross between CR1517 and CR1518, we aimed to: (1) identify and characterize QTLs for low-temperature germinability and coleoptile length, (2) analyze interactions among LTG QTLs, and (3) develop QTL pyramiding lines with enhanced LTG and coleoptile length.

2. Materials and Methods

2.1. Plant Materials

Two introgression lines, CR1517 and CR1518, which were derived from crossing between Hwaseong and O. rufipogon, were used as parents. We selected the two parental lines from an interspecific cross population, BC4F8 [27]. CR1517 has O. rufipogon chromosomal segments on chromosomes 8 and 10, and CR1518 has O. rufipogon segments on chromosomes 1, 3, 9, and 10 (Figure 1). Two introgression lines were crossed to produce F1 seeds. During the winter season of 2018–2019, F1 seeds were sown in a greenhouse to produce F2 seeds. In the middle of April 2019, F2 seeds were sown in a greenhouse and 30-day-old seedlings were transplanted into the experimental paddy field. The F2 population (154 plants) was grown in a field belonging to Chungnam National University, Daejeon, South Korea. The plants were used for further phenotypic and genotypic analyses. To verify minor QTLs, two F2 plants (CR8017-4 and CR8020-6) were selected based on the genotypes to verify qLTG10.1 and qLTG10.2, respectively. CR8017-4 is heterozygous at qLTG10.1 and qLTG8, while O. rufipogon homozygous for qLTG3, and Hwaseong homozygous for qLTG1 and qLTG10.2. CR8020-6 is heterozygous at qLTG10.2, while O. rufipogon homozygous for qLTG1 and Hwaseong homozygous for qLTG3 and qLTG10.1. The F3 plants were grown in the 2019/2020 winter season and dormancy was broken for seeds harvested from each F3 plant.

2.2. Evaluation of LTG and Coleoptile Length

Seeds from each F2 plant were harvested five weeks after heading and dried in a greenhouse for two weeks. To break dormancy, seeds were stored in a dry oven at 50 °C for 72 h. For normal temperature and low-temperature germination tests, 20 and 30 seeds were used with three replicates, respectively. Healthy and normal seeds were carefully selected and used in the germination test. The seeds from each plant were placed into 9-cm Petri dishes onto one layer of filter paper and 5 mL of distilled water added. Dormancy breakage was checked at the normal germination temperature (30 °C) for four days. The low-temperature germination test was conducted at 13 °C under the dark condition for eight days. Germinated seeds of each plant were counted daily and defined as germination rate. The germination rate (%) was calculated as follows: Germination rate (%) for a given day = (number of germinated seeds until the given day/total number of seeds) × 100. The germination tests were repeated two times under similar conditions. The seeds were considered germinated when coleoptile emerged from the seed (Figure S1).
Coleoptile length measurement was conducted based on previous studies [6,14]. F3 seeds of F2 plants were used to measure coleoptile length. Twenty normal and healthy seeds per plant were placed on one layer of filter paper in 9-cm Petri dishes and 10 mL of distilled water was poured into each Petri dish. The measurements were performed with two replicates using parental lines under normal (30 °C) and low-temperature (13 °C) conditions. In the F3 generation, coleoptile length was measured under low-temperature conditions (13 °C) with one replicate. Distilled water was renewed daily and maintained at 30 °C and 13 °C conditions for the normal and low-temperature conditions, respectively. Coleoptile length was measured using a ruler. In the normal temperature treatments, measurements were carried out from 1 to 4 days after incubation (DAI) and, in the low-temperature treatments, measurements were carried out from 5 to 10 DAI. For the normal and low-temperature conditions, coleoptile lengths of the grains were measured at room temperature (26 °C) and at seed storage temperature (10 °C) conditions, respectively, and mean lengths of the coleoptile were used in further analyses.

2.3. DNA Extraction and Marker Analysis

Booting stage plant leaves were gathered for use in extracting genomic DNA, and extraction was performed based on the method of Causse et al. (1994) with some minor modifications [30]. The Cetyl trimethylammonium bromide (CTAB) method was used to extract plant DNA. Leaf fragments from each plant were placed in a 2.0-mL microcentrifuge tube with aluminum beads (4 mm) and 500 µL of CTAB extraction buffer added. The tubes were incubated at 55 °C in a dry oven in CTAB buffer (2% CTAB, 100 mM pH 8.0 Tris-HCI, 20 mM EDTA, 1.4 M NaCl, 0.2% β-mercaptoethanol) for 30 min right after grinding. An equal volume of chloroform was added and the solution was mixed well. The tubes were centrifuged at 4 °C for 15 min at 13,000 rpm. The 200-µL upper supernatant layer was transferred into a new 1.5-mL tube and mixed with 2/3 volume of isopropanol, and after gently mixing, incubated at 4 °C for 15 min at 12,000 rpm. The supernatant was discarded very carefully, and the DNA pellets were washed with 70% ethanol once. After washing the DNA pellets, they were kept at room temperature to dry out the rest of ethanol and then diluted in 100 μL TE buffer (10 mM Tris pH 8, 1 mM EDTA). The concentration of the DNA was checked with a NanoDropTM 2000 spectrophotometer (Thermo Scientific Inc., Wilmington, DE, USA).
A 15-µL of PCR reaction mixture containing 5 µL DNA template (2~5 ng/µL), 1 µL of forward and reverse primer (10 pmol each), 1.5 µL of 10× PCR buffer (10 mM Tris-HCl pH 8.3, 50 mM KCl, 1.5 mM MgCl2, 0.1% Gelatin), 1 µL of dNTP (2.5 mM each), 0.1 µL of Taq polymerase (5 unit/µL), and 6.4 µL triple distilled water was used. The PCR was performed as described in Panaud et al. (1996) with minor modifications: 94 °C for 5 min, followed by 33–35 cycles of 94 °C for 30–40 s, 52–60 °C (based on annealing temperature of each marker) for 30 s, and 72 °C for 30 s, and a final extension at 5 min at 72 °C [31]. Separation of PCR products was conducted on 3% of metaphor agarose gel stained with Staining Safe Nucleic Acid Gel Stain (RBC, Taiwan). A total of 18 markers, including 15 Simple Sequence Repeat (SSR) and 3 Insertion-Deletion (InDel) markers were used to map QTLs (Table S1). Three InDel markers (qLTG3-1_18D, qLTG10_InDel3, and qLTG10_InDel4) and one SSR marker (CRM22) were designed and used for mapping [27,28].

2.4. Statistical Analysis and QTL Analysis

QTL analyses were conducted in Minitab 16.2.4 (Minitab Inc., State College, PA, USA) using one-way Analysis of Variance and Tukey’s test for mean comparisons. QTLs were detected using single-marker analysis, and the QTL was declared when the association between phenotype and genotype of markers was significant at p < 0.05. Gene actions were calculated by the following formula; additive effect (a) = (mean germination rate of O. rufipogon homozygote − mean germination rate of Hwaseong homozygote)/2; dominant effect (d) = mean germination rate of heterozygote − (mean germination rate of O. rufipogon homozygote + mean germination rate of Hwaseong homozygote)/2; degree of dominance = d/a. To analyze the interaction between QTLs, a general multiple regression model with two QTLs as independent variables and interaction term was employed in Minitab 16.2.4. Nomenclature of the QTLs has been described previously [32].

3. Results

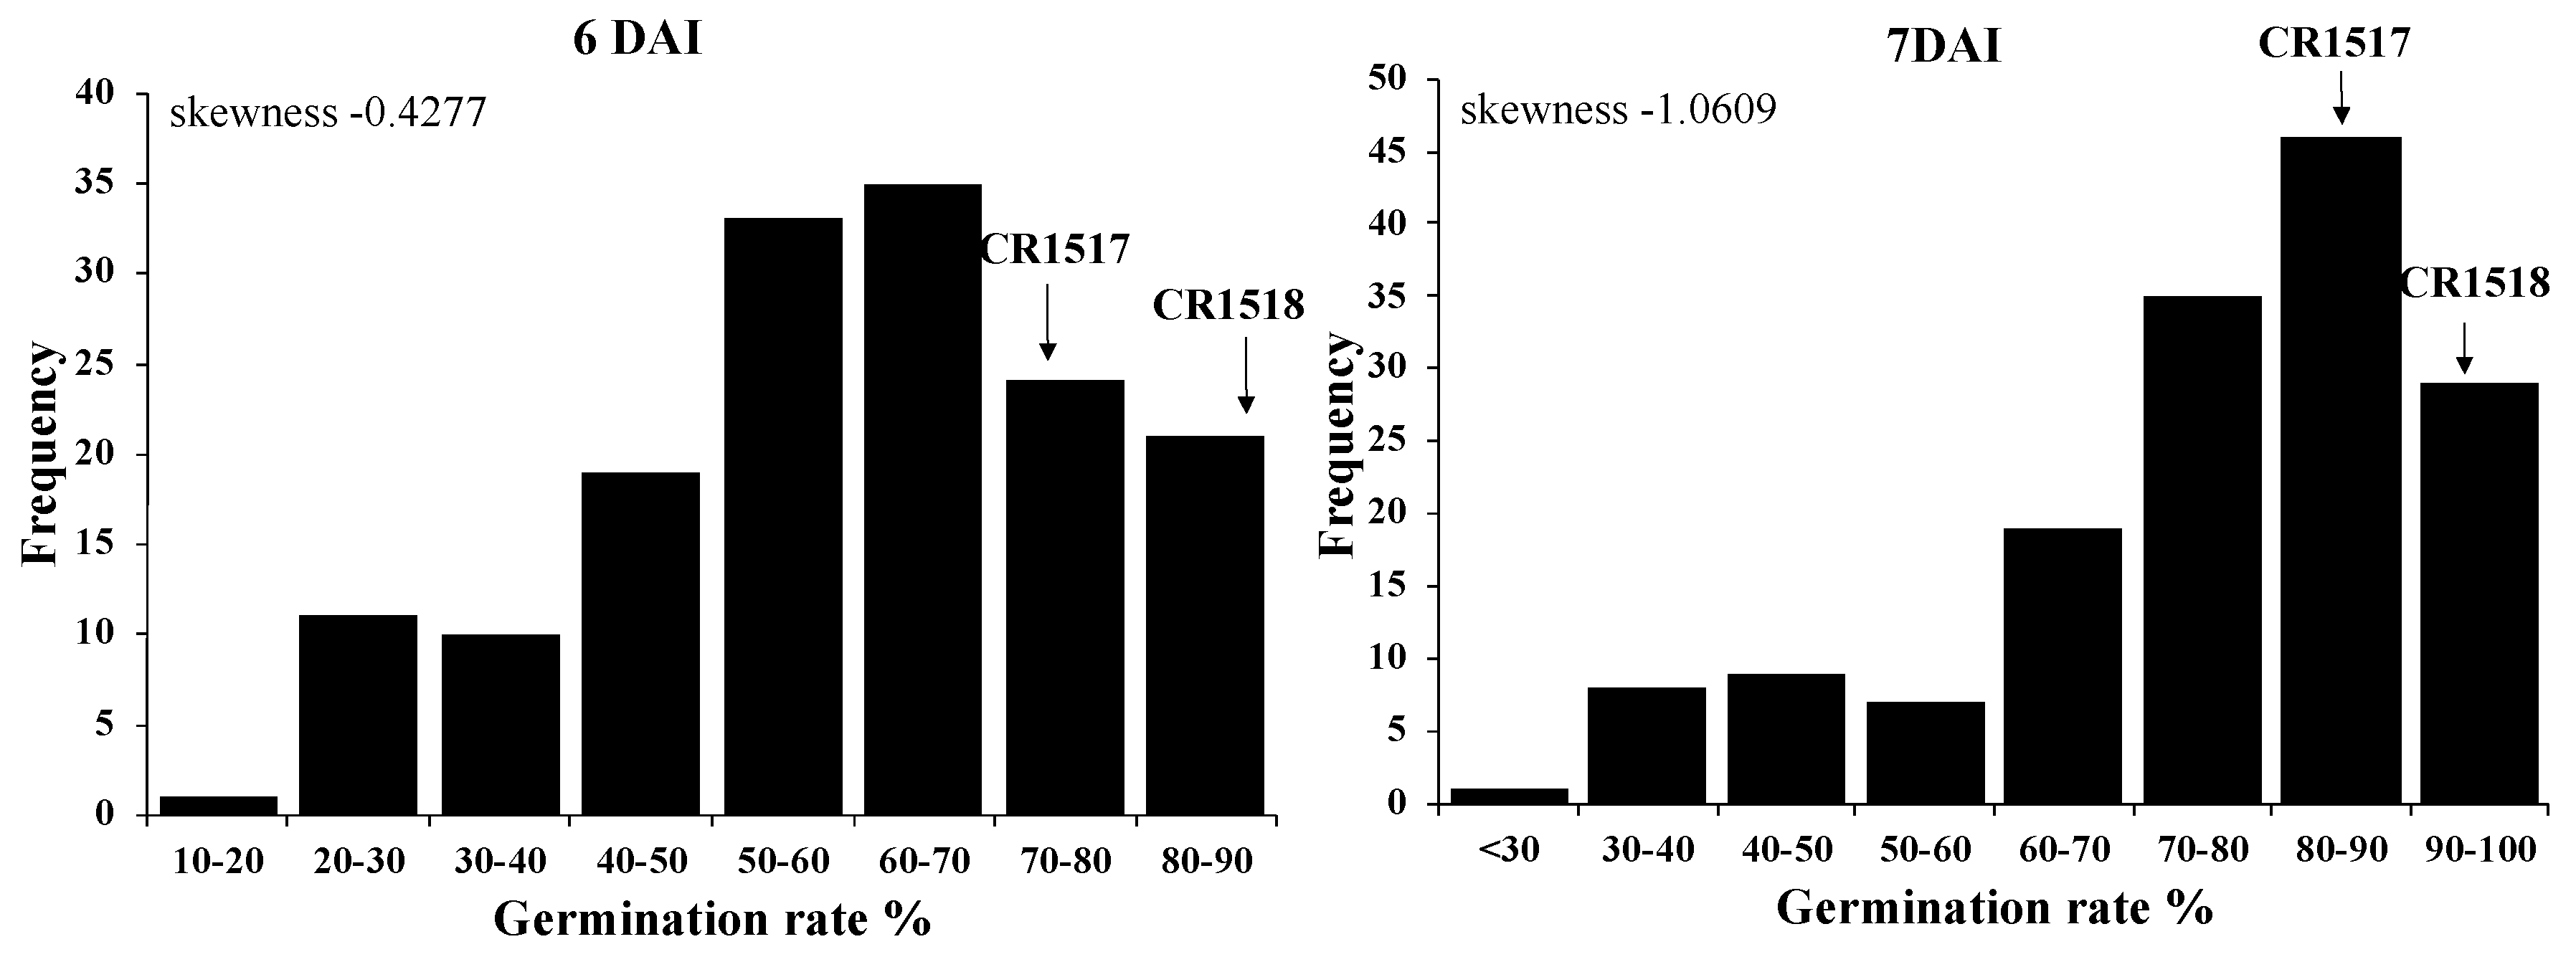
3.1. Low-Temperature Germination Rate of Parental Lines and F2 Population

Germination rates of four parental lines (Hwaseong, O. rufipogon, CR1517, and CR1518) were compared under control conditions (30 °C). The seeds of O. rufipogon began germinating at 1 DAI, with a 47% germination rate. At 4 DAI, O. rufipogon germination rate reached 100%. Hwaseong, CR1517, and CR1518 began germinating 2 DAI. Subsequently, the germination rate of the lines achieved nearly 100% at 4 DAI. O. rufipogon exhibited a significantly higher germination rate than those of other lines from 1 to 2 DAI. There were no significant differences in germination rate among the parental lines from 3 to 4 DAI under the control temperature (Figure S2). However, there were differences in the germination rate between 4 lines under the low-temperature condition (13 °C). O. rufipogon began germinating at 3 DAI and attained 100% germination rate at 7 DAI. In contrast, Hwaseong began germinating 4 DAI, and achieved 80% germination 8 DAI. Two introgression parental lines, CR1517 and CR1518, began germinating at 3 DAI, and the lines attained 85% and 94% germination rates, respectively, 7 DAI. They exhibited much more vigorous germinability than that of Hwaseong and lower than that of O. rufipogon (Figure S2). Germination rates in F2 plants ranged from 0 to 100% during the incubation period for 1–8 DAI (Table 1). The results revealed that O. rufipogon segments increased LTG in the Hwaseong background.

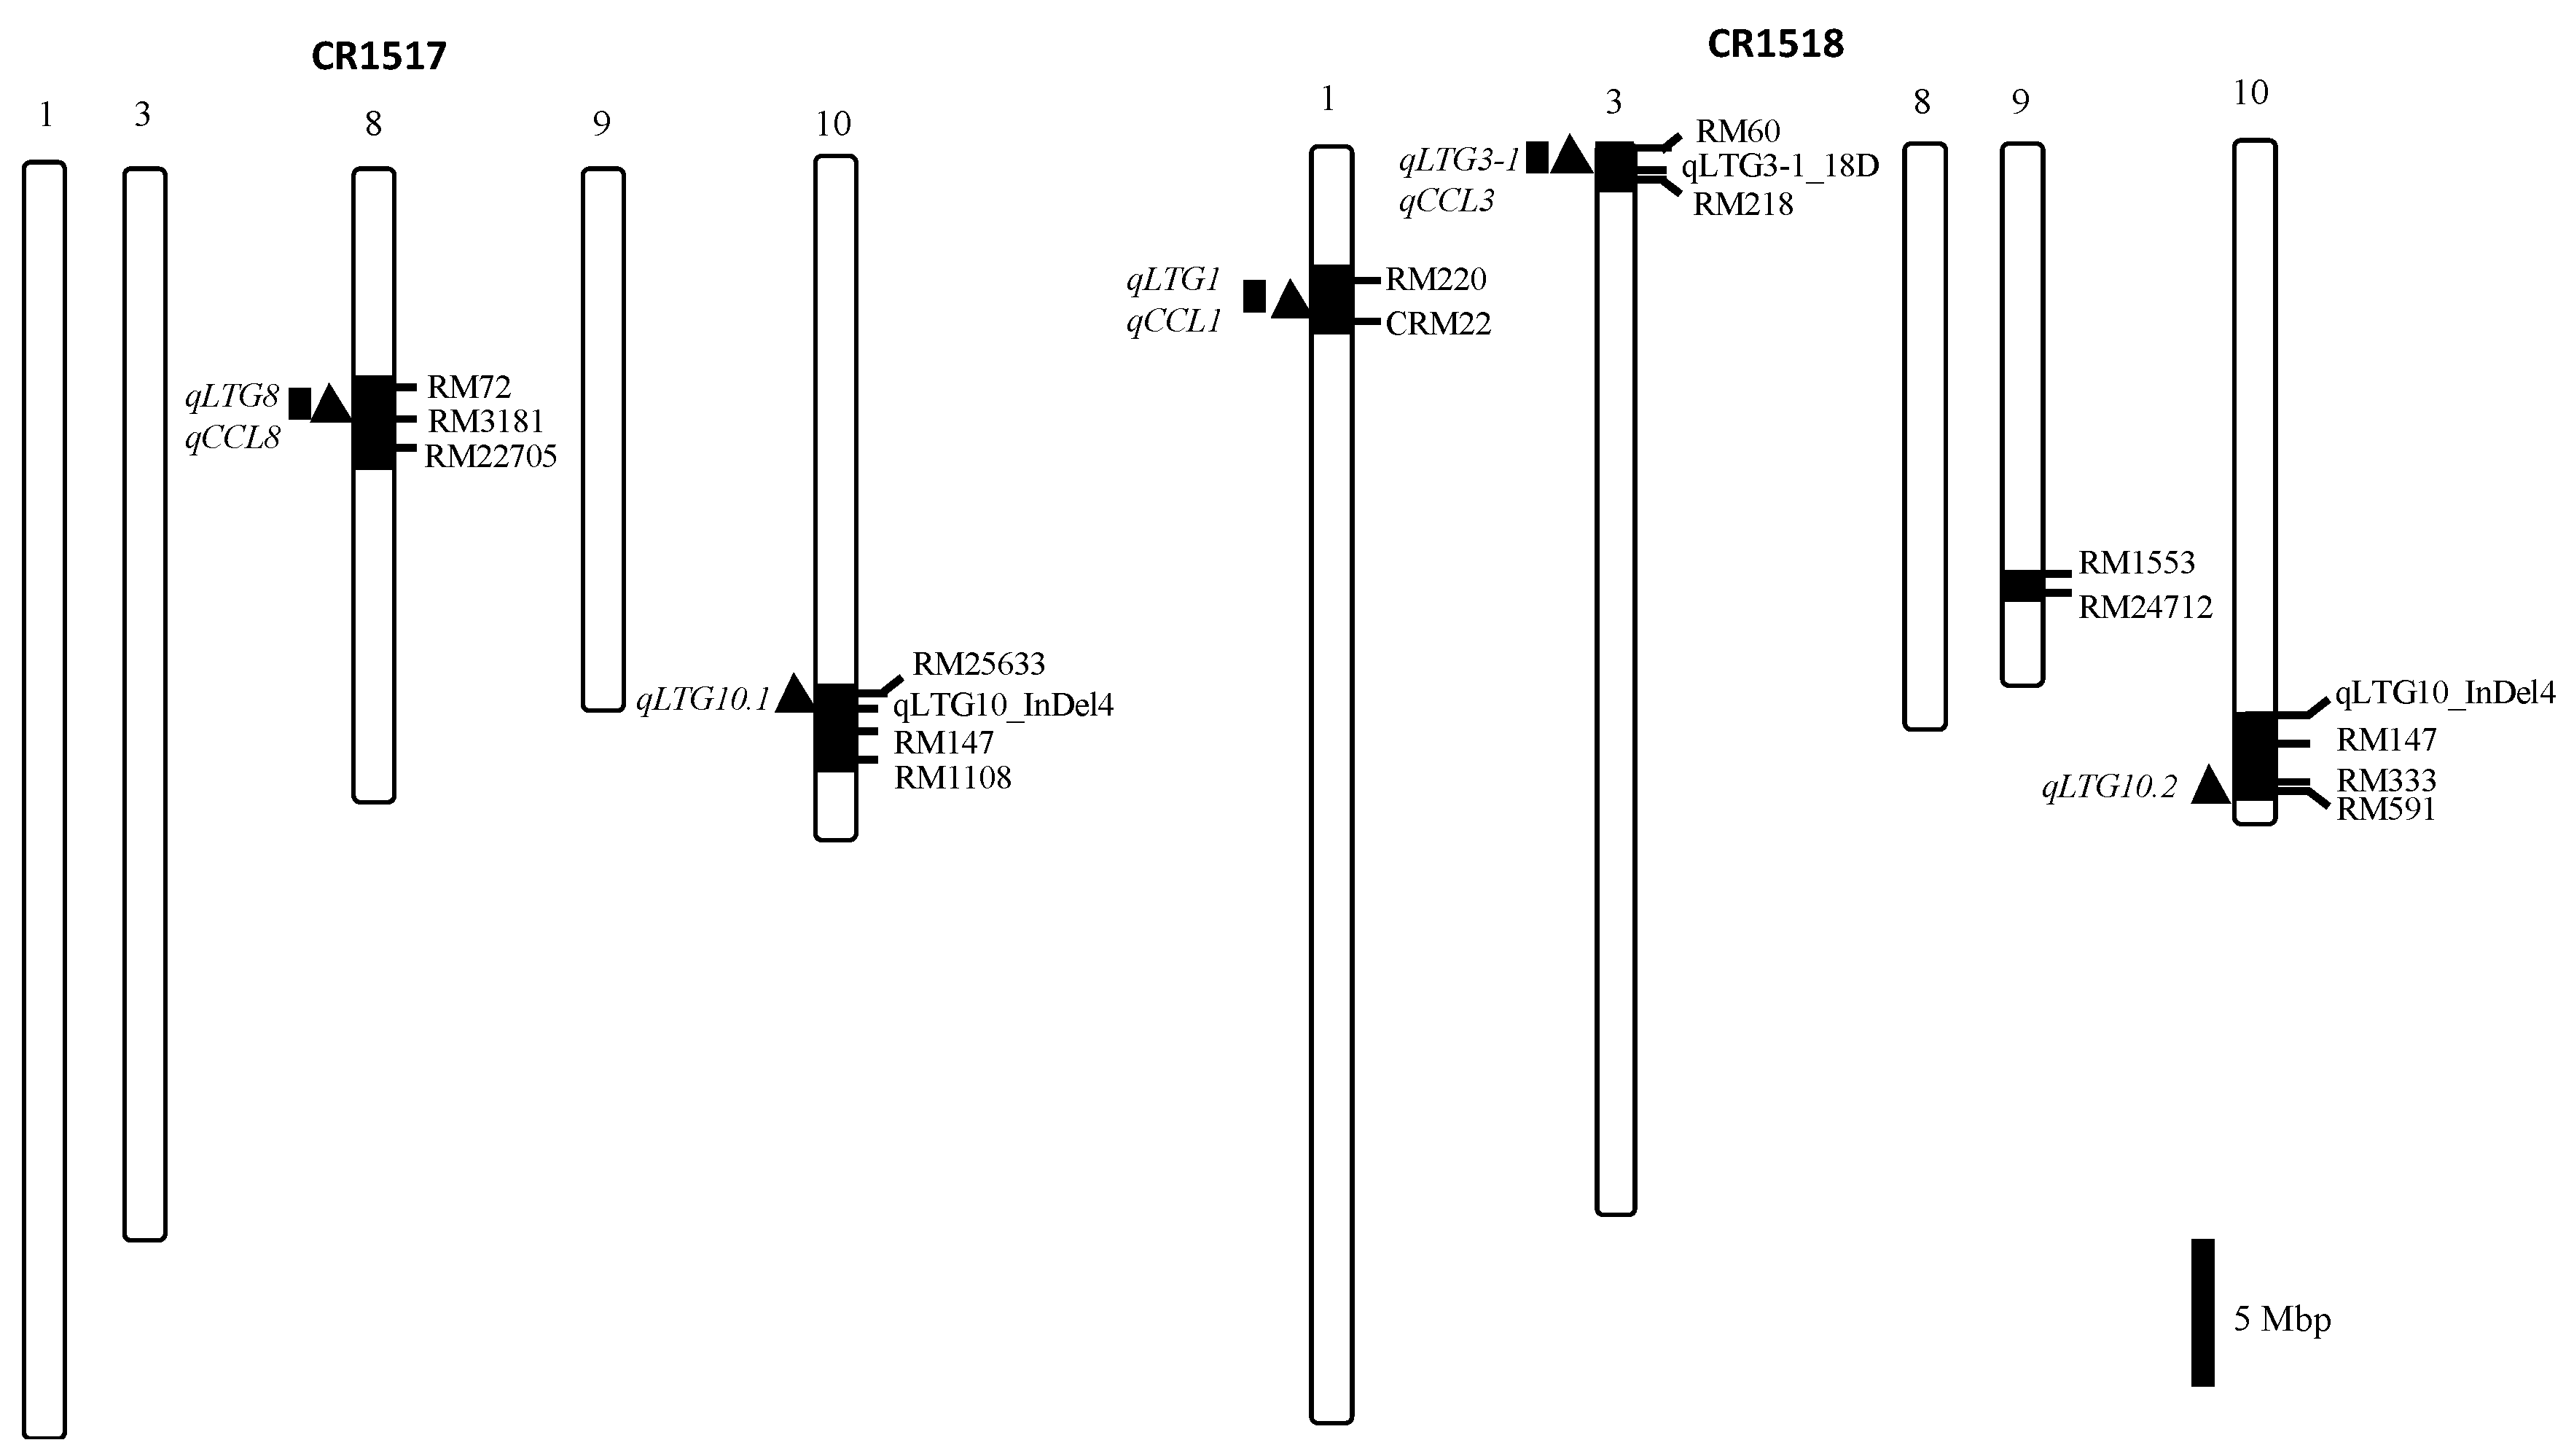
3.2. Mapping QTLs for Low-Temperature Germinability

We used low-temperature germination rate of the F2 population at 6 and 7 DAI for the QTL analysis because we observed larger differences among the parental lines (CR1517 and CR1518) at the periods. The F2 population exhibited nearly normal distribution of the LTG rate at 6 DAI (skewness = −0.4277) and was skewed to the left at 7 DAI (skewness = −1.0609) (Figure 2). Using QTL-linked SSR markers and one InDel marker, we consistently detected qLTG1 and qLTG3 6 and 7 DAI, respectively. qLTG1 was detected between RM220 and CRM22 markers, while qLTG3 was detected on qLTG3-1_18D marker on chromosomes 1 and 3, respectively. The qLTG1 explained 16.0% and 12.0% phenotypic variation 6 and 7 DAI, respectively, while qLTG3 explained 23.8% and 22.1% phenotypic variation 6 and 7 DAI, respectively. Based on gene action analysis 6 DAI, the additive effect (a) and dominant effect (d) of O. rufipogon allele on qLTG1 locus (RM220–CRM22) were 10.0 and 0.2, respectively. O. rufipogon allele of qLTG1 had 7.7 and 2.1% of the additive and dominant effects, respectively, 7 DAI. In the qLTG3 locus (qLTG3-1_18D), O. rufipogon allele accounted for 9.6 and 8.1% of the additive effects 6 and 7 DAI, respectively. The dominant effect was 9.7% on both days. Degrees of dominance were 1.0 and 1.2 at 6 and 7 DAI, respectively (Table 2). In addition, we detected two minor QTLs on chromosome 8 and 10. No QTLs were detected between markers RM72 and RM22705 (p = 0.086) on chromosome 8 at 6 DAI. qLTG8 was detected when the significant difference had a p value of 0.014 at 7 DAI. The phenotypic variation explained by qLTG8 was 5.45%. In addition, we identified other QTLs on chromosome 10. The QTLs were detected on the most distal end of the short arm of chromosome 10 by RM25633 and RM333-RM591, respectively. The phenotypic variation explained by qLTG10.1 was 4.6% at 7 DAI. qLTG10.2 explained 4.2 and 6.6% of the phenotypic variation at 6 and 7 DAI, respectively. In addition, additive and dominant effects of O. rufipogon alleles at the qLTG8 locus (RM72-RM22705) were 4.9 and 2.4% at 7 DAI, respectively. qLTG10.1 had 2.9 and −1.9% additive and dominant effects, respectively, at 7 DAI. The additive effects of qLTG10.2 were −4.2 and −5.3% at 6 and 7 DAI, and the dominant effects of the QTL were 5.1 and 5.5% at 6 and 7 DAI, respectively. Although two QTLs, qLTG10.1 and qLTG10.2, were linked on the short arm of chromosome 10, the effect for LTG of O. rufipogon allele was different. O. rufipogon introgression had a −0.6 degree of dominance at the qLTG10.1 locus at 7 DAI, while −1.2 and −1.0 degrees of dominance were observed at qLTG10.2 at 6 and 7 DAI, respectively (Table 2). The gene actions of O. rufipogon are different in the five QTLs. The O. rufipogon allele is partially dominant at qLTG8 and qLTG10.2, partially recessive at qLTG10.1, completely dominant at qLTG3, and completely recessive at qLTG1 with regard to regulating LTG (Table 2).

3.3. Interaction between LTG QTLs

Analysis of interactions among QTLs was carried out using the average low-temperature germination rate of nine genotypic classes at 7 DAI in the F2 population. Based on the general regression model, no significant interaction was detected between five QTLs. Although two QTL, qLTG3 and qLTG8 (p = 0.145) showed relatively high QTL interaction at 7 DAI, no significant QTL interaction at p < 0.05 was observed. In addition, the presence of O. rufipogon allele at the qLTG8 locus increased LTG in three genotype classes at the qLTG1 and qLTG3 loci (Figure S3A,D). The highest LTG scores were observed in the genotype classes with O. rufipogon homozygous at qLTG10.1 and Hwaseong homozygous at qLTG10.2. The results suggest that the O. rufipogon alleles at qLTG1, qLTG3, qLTG8, and qLTG10.1 and the Hwaseong allele at qLTG10.2 increased LTG, and QTLs act in an additive manner to regulate LTG.

3.4. QTL Pyramiding Line for LTG

We compared the mean low-temperature germination rates of the F2 QTL-pyramiding lines (QTL-PL) with those of the parental lines (O. rufipogon, Hwaseong, CR1517, and CR1518) (Table S2). QTL-PL represents O. rufipogon alleles at four QTLs, qLTG1, qLTG3, qLTG8, and qLTG10.1, and Hwaseong allele at qLTG10.2 locus. QTL-PL had higher germination rates than CR1517, CR1518, and Hwaseong, and lower germination rates than O. rufipogon at 6 and 7 DAI under the 13 °C condition. Although an 87.3% germination rate was observed in QTL-PL, this rate was significantly higher than that of CR1517 but not different from CR1518 at 6 DAI. The results indicate that pyramiding the QTLs with the combination of O. rufipogon alleles at qLTG1, qLTG3, and qLTG8, qLTG10.1 and Hwaseong allele at qLTG10.2 led to robust germinability under low-temperature conditions (13 °C). The lines could be useful material for developing rice varieties with enhanced LTG capacity (Table S2).

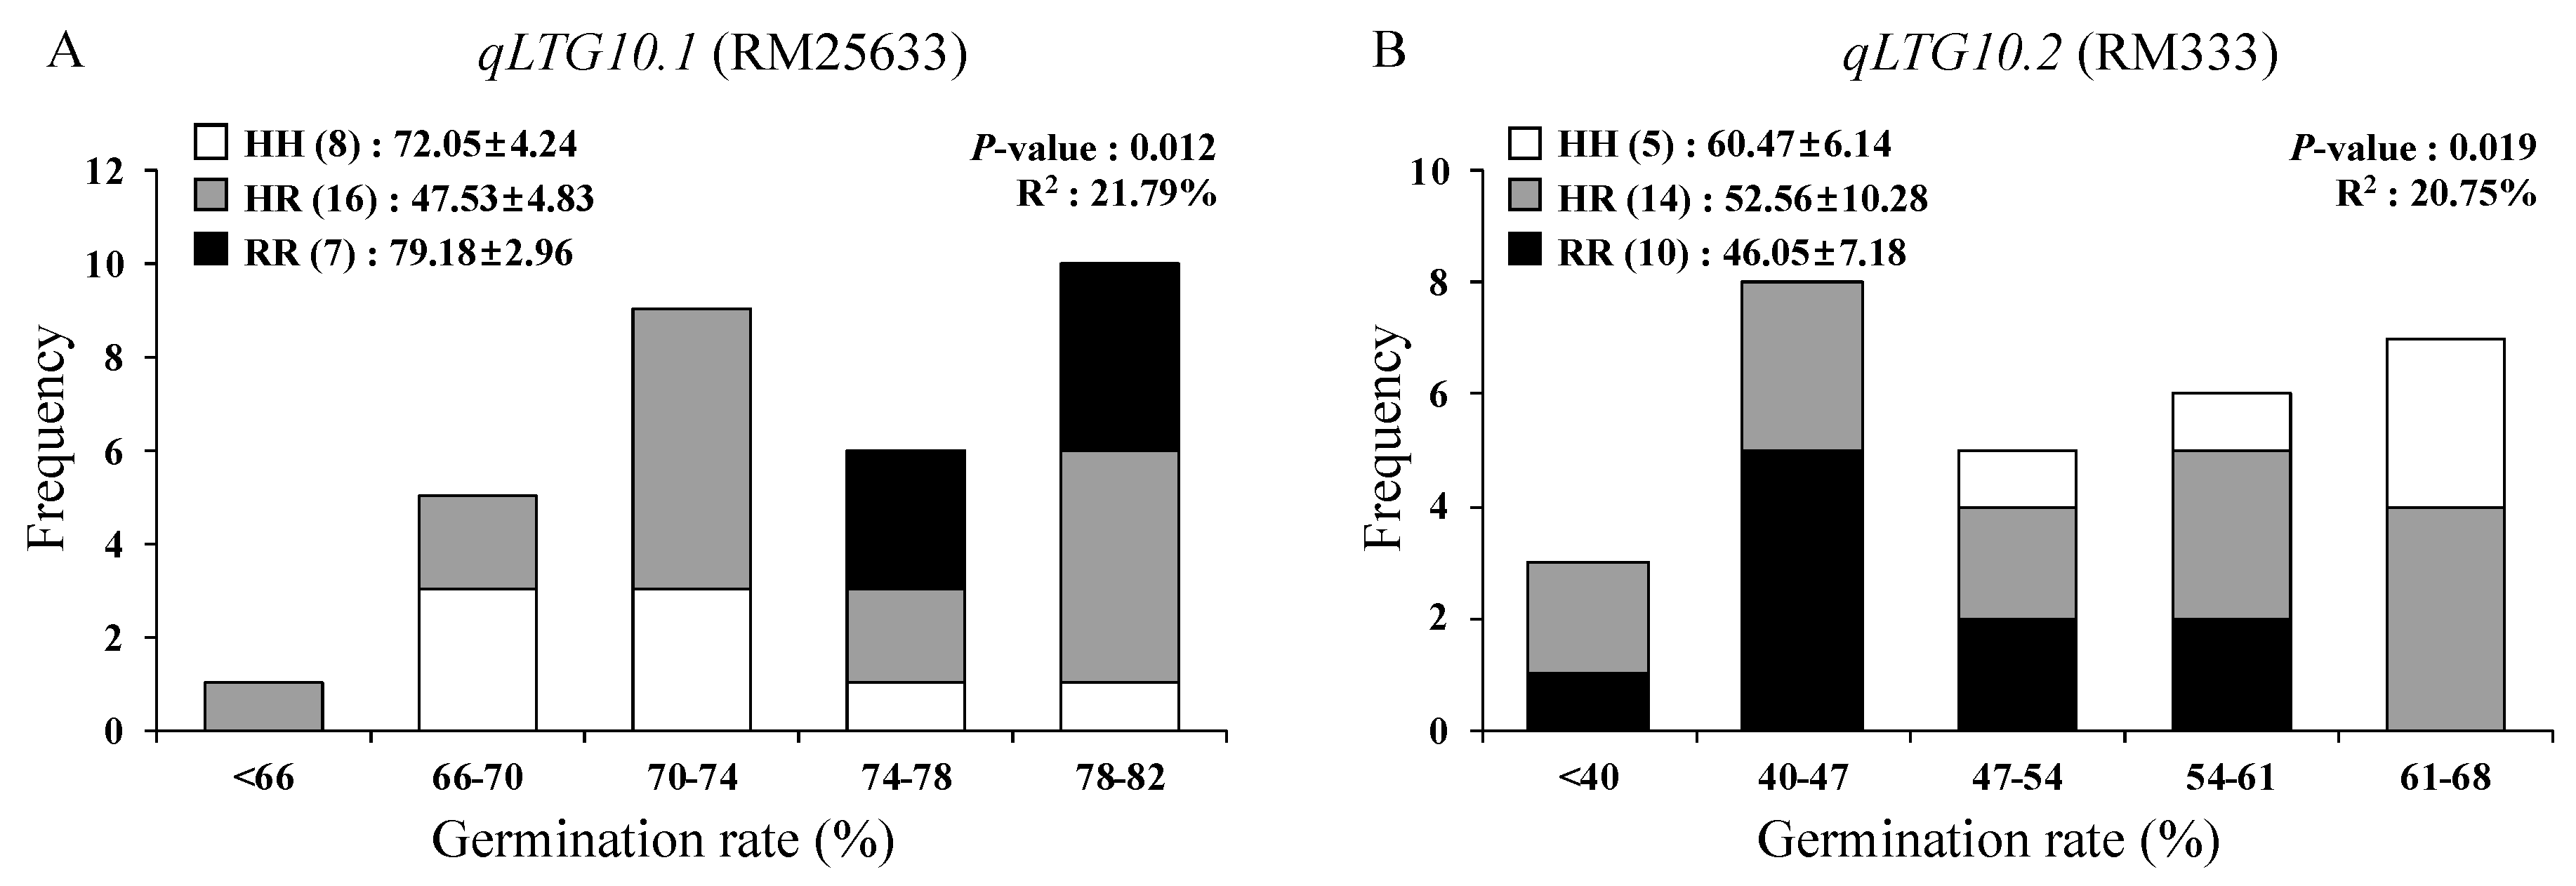
3.5. Verification of LTG QTL Using F3 Population

Two F2 plants (CR8017-4 and CR8020-6) were selected based on their genotypes to verify qLTG10.1 and qLTG10.2, respectively. CR8017-4 is heterozygous at qLTG10.1 and qLTG8, while O. rufipogon homozygous for qLTG3 and Hwaseong homozygous for qLTG1 and qLTG10.2. CR8020-6 is heterozygous at qLTG10.2, while O. rufipogon homozygous for qLTG1 and Hwaseong homozygous for qLTG3 and qLTG10.1. The F3 plants were grown in the 2019/2020 winter season and dormancy was broken for seeds harvested from each F3 plant. We used low-temperature germination rates of two F3 populations at 6 and 7 DAI for the QTL analysis. QTL analysis indicated that RM25633 explained 21.79% of the phenotypic variance in the CR8017-4 population, confirming the presence of qLTG10.1 (Figure 3A). However, we failed to detect the effect of qLTG8 (p = 0.21). Additional experiments using larger populations are needed to verify the effect of qLTG8. QTL analysis indicated that qLTG10.2 explained 20.75% of the phenotypic variance in the CR8020-6 population (Figure 3B). The Hwaseong allele at qLTG10.2 contributed to an increase in LTG. The results indicate that two linked QTLs (qLTG10.1 and qLTG10.2) on chromosome 10 are associated with LTG. Because O. rufipogon allele at qLTG10.1 and Hwaseong at qLTG10.2 contributed to higher LTG, the O. rufipogon qLTG10.1 could be selectively introgressed into japonica rice using MAS. Two QTLs, qLTG10.1 and qLTG10.2, explained 21.79% and 20.75% of the phenotypic variance, respectively, in the near-isogenic background. The low contribution of the QTL is partly due to the small population size and other environmental factors. The F3 plants were grown in the 2019/2020 winter season. We recorded the heading date of each plant and harvested them 30 days after heading. However, some late-flowering F3 plants failed to set adequate seeds to be tested for LTG, leading to the small population size and uneven distribution of three genotypic classes in the F3 population.

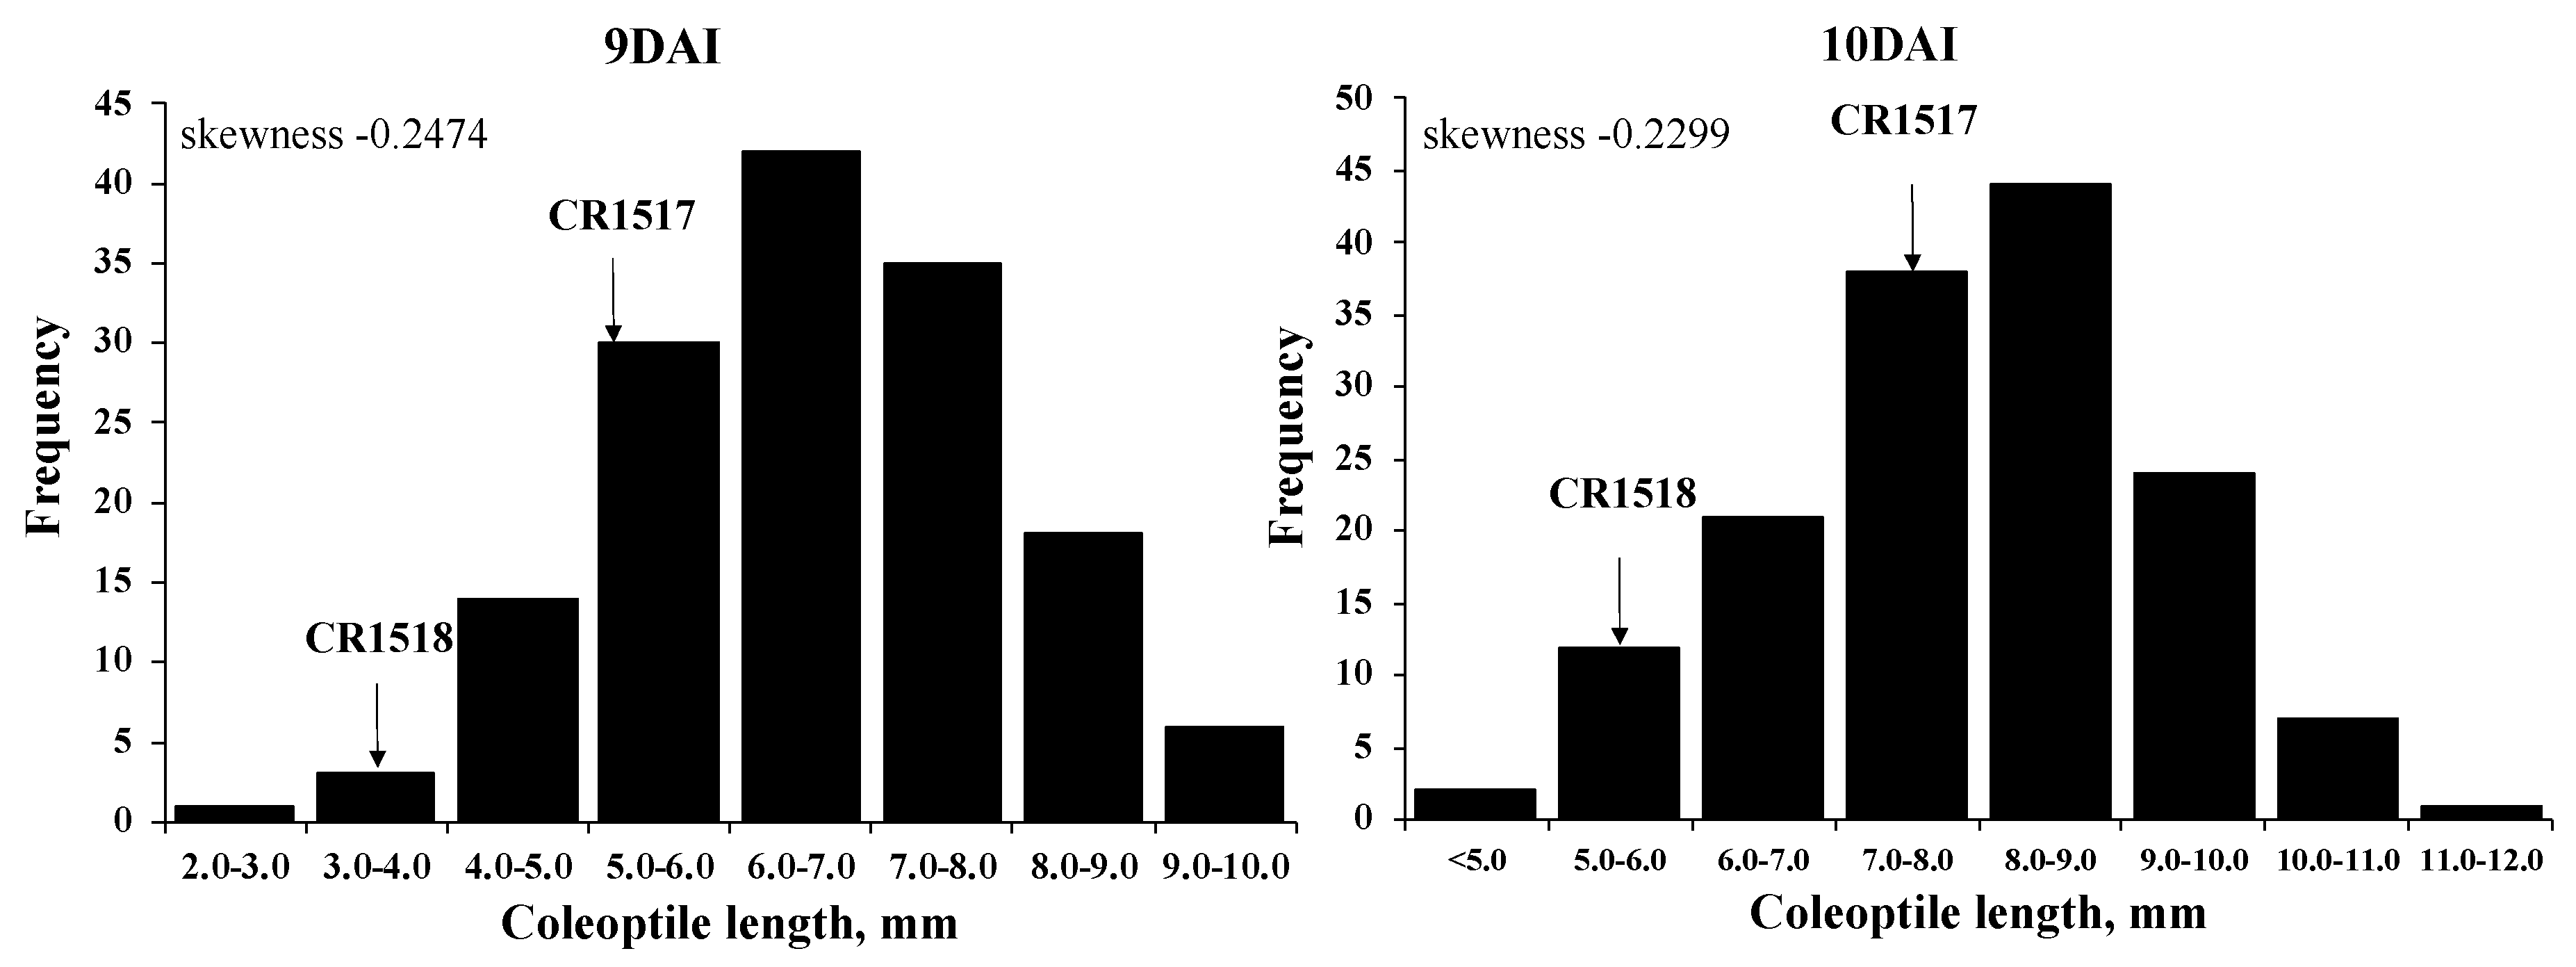
3.6. Coleoptile Length in Parental Lines and F2 Population

O. rufipogon showed significantly higher coleoptile length during 2–3 DAI at optimal condition than Hwaseong, CR1517, and CR1518, while no significant difference was observed in coleoptile length among Hwaseong, CR1517, and CR1518 at 30 °C (Figure S4A). At 1 DAI, mean coleoptile lengths were 0.6 mm and 0.3 mm in O. rufipogon and Hwaseong, respectively, while CR1517 and CR1518 were 0.4 mm in length on average. Coleoptile length varied from 12.4 mm to 14.6 mm at 4 DAI among parental lines (Figure S4A).
Coleoptile length varied markedly among parental lines under the 13 °C condition (Figure S4B). The mean length of the coleoptile in O. rufipogon was longer than those of Hwaseong, CR1517, and CR1518. The average coleoptile length in O. rufipogon at 5 DAI was 1.5 mm, while it reached 9 mm at 10 DAI. In Hwaseong, it was close to zero at 5 DAI and attained 4 mm at 10 DAI. While the average coleoptile length in CR1518 was slightly greater than that in Hwaseong at 5 to 9 DAI, the difference was much greater at 10 DAI. CR1517 had a longer coleoptile than CR1518 and Hwaseong, and a shorter coleoptile than O. rufipogon. The differences in coleoptile length between parental lines were more significant at 9 and 10 DAI than at other scoring dates (Figure S4, Table 3).
In the F2 population, the coleoptile length varied from 0 to 12 mm from 5 to 10 DAI. The mean coleoptile lengths of 149 F2 plants were 0.4, 0.7, 1.2, and 3.2 mm at 5, 6, 7, and 8 DAI, respectively. At 9 DAI, the average coleoptile length was 6.6 mm, and it reached 7.9 mm at 10 DAI (Table 4, Figure 4). The F2 population exhibited nearly normally distributed coleoptile elongation at 9 and 10 DAI (Figure 4).

3.7. QTLs for Coleoptile Length

QTL analysis of coleoptile length was carried out for two scoring dates (9 and 10 DAI) considering that the two parental lines had the greatest difference in coleoptile length (Table 3). A total of three QTLs associated with coleoptile length were detected and they were colocalized with the LTG QTLs (qLTG1, qLTG3, and qLTG8). At 9 DAI, qCCL3 (qLTG3-1_18D) and qCCL8 (RM22689-RM22705) were identified and they explained 12.0 and 6.4% of the phenotypic variance, respectively. The qCCL1 on chromosome 1 between markers RM220 and CRM22 was not significant (p = 0.059) at 9 DAI (data not shown).
At 10 DAI, qCCL1, qCCL3, and qCCL8 were detected (Table 4). The QTLs explained 6.4%, 9.2%, and 7.1% of the total phenotypic variance, respectively. No QTL was detected on the other O. rufipogon introgression segments on chromosomes 9 and 10 at 9 and 10 DAI. O. rufipogon alleles are partially recessive at qCCL1 and qCCL8 loci, and dominant at the qCCL3 locus similar to the case in LTG (Table 2 and Table 4). qLTG8 in this study was colocalized with the qCCL8 for coleoptile length under cold stress in the study [6] and the allelic relationship between two QTLs remains to be clarified.

4. Discussion

Rice is one of the most important staple food crops globally, being consumed by approximately 50% of the global population [33]. Low-temperature germinability (LTG) is one of the major factors influencing stable crop establishment in the direct seeding method of rice cultivation in tropical and subtropical regions of the world. Along with rapid low-temperature germination, vigorous coleoptile growth is essential in the direct-seeding method of rice when rice seeds are sown in flooded paddy fields and watered with cold irrigation water [14]. Rapid coleoptile elongation after germination is necessary to improve seedling establishment rate [6].
In the present study, we analyzed LTG and coleoptile length in rice cultivated under 13 °C conditions. Using the F2 population derived from a cross between two introgression lines, CR1517 and CR1518, we detected a total of five and three QTLs for LTG and coleoptile length, respectively, over two scoring dates. QTLs associated with LTG were detected on chromosomes 1, 3, 8, and 10. Among them, two major QTLs, qLTG1 and qLTG3, were detected on chromosomes 1 and 3, respectively. One minor QTL for coleoptile elongation, qLTG8, together with qCCL8, was detected between RM72 and RM22705 markers on chromosome 8. We failed to detect the QTL using 96 introgression lines in a previous study [27], which could be due to a masking effect of the major QTLs (qLTG1 and qLTG3) and the genetic structure of the population [27]. Several studies have reported the presence of QTLs for LTG and coleoptile elongation on chromosome 8 [5,6,18,34]. For example, Najeeb et al. (2020) detected an LTG QTL, qLTG(III)8 (497SNP_8_8509144), which is located near qLTG8 in the present study [34]. The results suggest that the region on chromosome 8 participates in the regulation of germination and coleoptile elongation under low-temperature conditions. Identification of such genes from diverse varieties could enhance our understanding of the roles of the region in germination activities.
Low-temperature germination QTLs are distributed widely throughout the rice genome, including on chromosome 10 [12,17]. We detected two linked QTLs, qLTG10.1 and qLTG10.2 for LTG, with an LTG-increasing allele originating from O. rufipogon at qLTG10.1 and Hwaseong at qLTG10.2. The results were confirmed in the near-isogenic background in the F3 population. Notably, the locations of qLTG10.1 and qLTG10.2 (20.0~22.9 Mb region) are similar to that of qGR-10 for low-temperature germination ability detected between C809 and C797 on chromosome 10 (21.0~22.0 Mb region) in a study by Ji et al. (2009) [17]. They mapped qGR10 using a recombinant inbred line population derived from a cross between Asominori and IR24. At qGR-10, the IR24 allele increased germination rate at two scoring dates (8 and 9 DAI), whereas the Asominori allele increased germination rate at later scoring dates (10 and 14 DAI). Similar results have been observed, where the beneficial alleles for LTG originate from two parents, WTR-1 and Haoannong, at two linked loci, qLTG(I1)11 and qLTG(III)11, on chromosome 11 [34]. Li et al. (2019) also observed that Dongxiang wild rice (O. rufipogon Griff.) introgressions at five detected QTLs in 94 BC1F7 population delayed germination rates under 15 °C conditions in the background of indica variety, Xieqingzao. Among them, two QTLs, qLTG10-1 and qLTG10-2, were identified on chromosome 10 [25]. The results indicate that two linked QTLs potentially act in opposite directions in such QTL regions. Such genetic linkage is common in rice [35]. A linkage between two desirable genes would be advantageous in the selection of improved lines. For example, the tight linkage of two QTLs (qSPP5 for spikelet no. and qTGW5 for grain weight) could be valuable for improving rice yield [36]. However, linkage between desirable and undesirable genes is complex in terms of its application in rice breeding [37]. Since two LTG QTLs, qLTG10.1 and qLTG10.2, acting in opposite directions are linked and have minor effects, selection of the high LTG lines with qLTG10.1 from O. rufipogon and qLTG10.2 could be accomplished using DNA markers. In a previous study, we detected qLTG10.1 and not qLTG10.2, possibly due to the buffering effect of two QTLs and interactions among QTLs in the population [27]. Overall, it appears that the region carries gene(s) with a strong effect on germination performance and represent additional genetic targets for MAS directed development of rice varieties with improved LTG.
The interactions among the four QTLs, qLTG1, qLTG3, qLTG8, qLTG10.1, and qLTG10.2 were examined using general regression models. The plants that harbor the O. rufipogon alleles at qLTG1, qLTG3, qLTG8, and qLTG10.1 exhibited the highest germination rates at 13 °C in the nine groups, and the five QTLs cumulatively explained 42.0% of the phenotypic variance in LTG. The results imply that five QTLs control the LTG in an additive manner. Pyramiding the four QTLs from the O. rufipogon into cultivated rice with qLTG10.2 would facilitate breeding programs aimed at enhancing LTG for direct-seeding production systems. It is also notable that the plants with four O. rufipogon alleles at qLTG1, qLTG3, qLTG8, and qLTG10.1 exhibited lower LTG than O. rufipogon, the donor parent at 5–7 DAI, indicating the presence of additional QTLs for LTG in O. rufipogon. Further experiments are underway to detect and characterize such unknown QTLs in O. rufipogon.
Also, three QTLs for coleoptile length detected on chromosomes 1, 3, and 8 shared their locations with three LTG QTLs, qLTG1, qLTG3, and qLTG8, respectively, and the O. rufipogon alleles at all three loci increased the coleoptile length, suggesting a pleiotropy of a single QTL at each locus.

5. Conclusions

In the present study, we performed QTL analysis and identified QTLs for LTG and coleoptile length in the F2 population. Among the five QTLs for LTG, two major QTLs, qLTG1 and qLTG3, and three minor QTLs were detected on chromosomes 8 and 10. Fine mapping revealed that two QTLs, qLTG10.1 and qLTG10.2, were linked on chromosome 10 and exerted opposite effects with the Hwaseong allele at qLTG10.2 and the O. rufipogon at qLTG10.1, respectively, in turn, increasing LTG. Because two LTG QTLs, qLTG10.1 and qLTG10.2, which act in opposite directions are linked, the DNA markers could improve the selection efficiency of the high LTG lines with qLTG10.1 from O. rufipogon and qLTG10.2 from Hwaseong. Interactions among QTLs were not significant, implying that the QTLs act in an additive manner. NIL plants with combinations of favorable alleles from O. rufipogon and Hwaseong exhibited the highest LTG among all groups, supporting the absence of interactions. With regard to coleoptile length, three QTLs observed on chromosomes 1, 3, and 8 were colocalized with QTLs for LTG, suggesting the pleiotropy of the single gene at each locus. According to the results, the introgression of favorable O. rufipogon alleles should hasten the breeding of high LTG and coleoptile elongation in japonica cultivars.

Supplementary Materials

The following are available online at https://www.mdpi.com/2073-4425/11/10/1200/s1, Figure S1: Measurement of low-temperature germination rate of parental lines (O. rufipogon, Hwaseong, CR1517 and CR1518) for 4–8 days after incubation (DAI). Seeds were considered as germinated when coleoptile emerged. Arrows indicate emerged coleoptile, Figure S2: Comparison of germination rates of O. rufipogon (Ru), Hwaseong (Hs), CR1517 and CR1518 at normal (30 °C) (A) and low-temperature conditions (13 °C) (B). Different letters at each DAI indicate significant difference at p < 0.05 based on Tukey’s test. ns: no significant. Error bars indicate standard deviation, Figure S3: Interaction analysis of qLTG1 and qLTG3 with other QTL for LTG based on LTG scores of the F2 population. HH, HR and RR indicate Hwaseong homozygous, heterozygous (Hwaseong/O. rufipogon) and O. rufipogon homozygous at two QTLs, respectively. Low-temperature germination rates at 7 days after incubation were compared. Error bars indicate standard deviations. Interaction was determined by general linear regression model, Figure S4: Comparison of coleoptile length of parental lines at normal (30 °C) (A) and low-temperature (13 °C) (B) Error bars at each DAI indicate standard deviation. Different letters at each DAI indicate significant difference at p < 0.05 based on Tukey’s test. ns: no significant. Ru: O. rufipogon; Hs: Hwaseong, Table S1: List of primers used in this study, Table S2: Comparison of germination rates among parental lines and pyramiding lines at 6 and 7 DAI.

Author Contributions

M.A. performed experiments and analyzed data. M.A., K.-C.S., C.A., and S.-N.A. conceived the study, designed, and supervised the study. H.-S.L., S.H.K., Y.-AJ., C.A., N.H.L., J.-Y.L. and J.-W.K. investigated the traits. M.A., and K.-C.S. wrote and C.A. and S.-N.A. edited the manuscript. All authors have read and agreed to the published version of the manuscript.

Funding

This research was carried out with the support of “Cooperative Research Program for Agriculture Science and Technology Development (Project No. PJ01321401)”, Rural Development Administration and of Korea Institute of Planning and Evaluation for Technology in Food, Agriculture, Forestry and Fisheries (IPET) through Golden Seed Project funded by the Ministry of Agriculture, Food and Rural Affairs (MAFRA) (213009-05-3-WT312), Republic of Korea.

Conflicts of Interest

The authors declare no conflict of interest. The funders had no role in the design of the study; in the collection, analyses, or interpretation of data; in the writing of the manuscript, or in the decision to publish the results.

References

  1. Brar, D.S.; Khush, G.S. Wild relatives of rice: A valuable genetic resource for genomics and breeding research. In The Wild Oryza Genomes; Springer: Cham, Switzerland, 2018; pp. 1–25. [Google Scholar]
  2. Brar, D.; Khush, G. Cytogenetic manipulation and germplasm enhancement of rice (Oryza sativa L.). Genet. Resour. Chromosome Eng. Crop. Improv. 2006, 2, 115–158. [Google Scholar]
  3. Luo, X.D.; Jun, Z.; Dai, L.F.; Zhang, F.T.; Yi, Z.; Yong, W.; Xie, J.K. Linkage map construction and QTL mapping for cold tolerance in Oryza rufipogon Griff. at early seedling stage. J. Integr. Agric. 2016, 15, 2703–2711. [Google Scholar] [CrossRef] [Green Version]
  4. McCouch, S.R.; Sweeney, M.; Li, J.; Jiang, H.; Thomson, M.; Septiningsih, E.; Edwards, J.; Moncada, P.; Xiao, J.; Garris, A. Through the genetic bottleneck: O. rufipogon as a source of trait-enhancing alleles for O. sativa. Euphytica 2007, 154, 317–339. [Google Scholar] [CrossRef]
  5. Wang, Z.F.; Wang, F.H.; Zhou, R.; Wang, J.F.; Zhang, H.S. Identification of quantitative trait loci for cold tolerance during the germination and seedling stages in rice (Oryza sativa L.). Euphytica 2011, 181, 405–413. [Google Scholar] [CrossRef]
  6. Lee, J.; Kwon, S.W. Analysis of quantitative trait loci associated with seed germination and coleoptile length under low temperature condition. J. Crop Sci. Biotechnol. 2015, 18, 273–278. [Google Scholar] [CrossRef]
  7. Sun, Q.; Wang, J.H.; Sun, B.Q. Advances on seed vigor physiological and genetic mechanisms. Agric. Sci. China 2007, 6, 1060–1066. [Google Scholar] [CrossRef]
  8. Teng, S.; Zeng, D.L.; Qian, Q.; Yasufumi, K.; Huang, D.I.; Zhu, L.H. QTL analysis of rice low temperature germinability. Chin. Sci. Bull. 2001, 46, 1800–1804. [Google Scholar] [CrossRef]
  9. Fujino, K.; Sekiguchi, H.; Sato, T.; Kiuchi, H.; Nonoue, Y.; Takeuchi, Y.; Ando, T.; Lin, S.Y.; Yano, M. Mapping of quantitative trait loci controlling low-temperature germinability in rice (Oryza sativa L.). Appl. Genet. 2004, 108, 794–799. [Google Scholar] [CrossRef]
  10. Chen, L.; Lou, Q.; Sun, Z.; Xing, Y.; Yu, X.; Luo, L. QTL mapping of low temperature germinability in rice. Zhongguo Shuidao Kexue 2006, 20, 159–164. [Google Scholar]
  11. Hou, M.Y.; Wang, C.M.; Jiang, L.; Wan, J.M.; Yasui, H.; Yoshimura, A. Inheritance and QTL mapping of low temperature germinability in rice (Oryza sativa L.). Acta Genet. Sin. 2004, 31, 701–706. [Google Scholar]
  12. Jiang, L.; Liu, S.J.; Hou, M.Y.; Tang, J.Y.; Chen, L.M.; Zhai, H.Q.; Wan, J.M. Analysis of QTLs for seed low temperature germinability and anoxia germinability in rice (Oryza sativa L.). Field Crop. Res. 2006, 98, 68–75. [Google Scholar] [CrossRef]
  13. Satoh, T.; Tezuka, K.; Kawamoto, T.; Matsumoto, S.; Satoh-Nagasawa, N.; Ueda, K.; Sakurai, K.; Watanabe, A.; Takahashi, H.; Akagi, H. Identification of QTLs controlling low-temperature germination of the East European rice (Oryza sativa L.) variety Maratteli. Euphytica 2016, 207, 245–254. [Google Scholar] [CrossRef]
  14. Adachi, Y.; Sugiyama, M.; Sakagami, J.I.; Fukuda, A.; Ohe, M.; Watanabe, H. Seed Germination and Coleoptile Growth of New Rice Lines Adapted to Hypoxic Conditions. Plant Prod. Sci. 2015, 18, 471–475. [Google Scholar] [CrossRef]
  15. Inada, N.; Sakai, A.; Kuroiwa, H.; Kuroiwa, T. Three-dimensional progression of programmed death in the rice coleoptile. Int. Rev. Cytol. 2002, 218, 221–258. [Google Scholar]
  16. Miura, K.; Lin, S.Y.; Yano, M.; Nagamine, T. Mapping quantitative trait loci controlling low temperature germinability in rice (Oryza sativa L.). Breed. Sci. 2001, 51, 293–299. [Google Scholar] [CrossRef] [Green Version]
  17. Ji, S.L.; Jiang, L.; Wang, Y.H.; Zhang, W.W.; Liu, X.; Liu, S.J.; Chen, L.M.; Zhai, H.Q.; Wan, J.M. Quantitative trait loci mapping and stability for low temperature germination ability of rice. Plant Breed. 2009, 128, 387–392. [Google Scholar] [CrossRef]
  18. Fujino, K.; Obara, M.; Shimizu, T.; Koyanagi, K.O.; Ikegaya, T. Genome-wide association mapping focusing on a rice population derived from rice breeding programs in a region. Breed. Sci. 2015, 65, 403–410. [Google Scholar] [CrossRef] [Green Version]
  19. Ji, S.L.; Ling, J.; Wang, Y.H.; Liu, S.J.; Liu, X.; Zhai, H.Q.; Yoshimura, A.; Wan, J.M. QTL and epistasis for low temperature germinability in rice. Acta Agron. Sin. 2008, 34, 551–556. [Google Scholar]
  20. Wang, X.; Zou, B.; Shao, Q.; Cui, Y.; Lu, S.; Zhang, Y.; Huang, Q.; Huang, J.; Hua, J. Natural variation reveals that OsSAP16 controls low-temperature germination in rice. J. Exp. Bot. 2018, 69, 413–421. [Google Scholar] [CrossRef]
  21. Xie, L.X.; Tan, Z.W.; Zhou, Y.; Xu, R.B.; Feng, L.B.; Xing, Y.Z.; Qi, X.Q. Identification and fine mapping of quantitative trait loci for seed vigor in germination and seedling establishment in rice. J. Integr. Plant Biol. 2014, 56, 749–759. [Google Scholar] [CrossRef]
  22. Li, L.F.; Liu, X.; Xie, K.; Wang, Y.H.; Liu, F.; Lin, Q.Y.; Wang, W.Y.; Yang, C.Y.; Lu, B.Y.; Liu, S.J.; et al. qLTG-9, a stable quantitative trait locus for low-temperature germination in rice (Oryza sativa L.). Appl. Genet. 2013, 126, 2313–2322. [Google Scholar] [CrossRef] [PubMed]
  23. Fukuda, A.; Kataoka, T.; Shiratsuchi, H.; Fukushima, A.; Yamaguchi, H.; Mochida, H.; Ogiwara, H. QTLs for Seedling Growth of Direct Seeded Rice under Submerged and Low Temperature Conditions. Plant Prod. Sci. 2014, 17, 41–46. [Google Scholar] [CrossRef] [Green Version]
  24. Shakiba, E.; Edwards, J.D.; Jodari, F.; Duke, S.E.; Baldo, A.M.; Korniliev, P.; McCouch, S.R.; Eizenga, G.C. Genetic architecture of cold tolerance in rice (Oryza sativa) determined through high resolution genome-wide analysis. PLoS ONE 2017, 12, e0172133. [Google Scholar] [CrossRef] [PubMed]
  25. Li, L.Y.; Chen, H.P.; Mao, D.H. Pyramiding of rapid germination loci from Oryza Sativa cultivar ‘Xieqingzao B’ and cold tolerance loci from Dongxiang wild rice to increase climate resilience of cultivated rice. Mol. Breed. 2019, 39, 85. [Google Scholar] [CrossRef]
  26. Dametto, A.; Sperotto, R.A.; Adamski, J.M.; Blasi, E.A.R.; Cargnelutti, D.; de Oliveira, L.F.V.; Ricachenevsky, F.K.; Fregonezi, J.N.; Mariath, J.E.A.; da Cruz, R.P.; et al. Cold tolerance in rice germinating seeds revealed by deep RNAseq analysis of contrasting indica genotypes. Plant Sci. 2015, 238, 1–12. [Google Scholar] [CrossRef] [PubMed]
  27. Nguyen, H.N.; Park, I.K.; Yeo, S.M.; Yun, Y.T.; Ahn, S.N. Mapping quantitative trait loci controlling low-temperature germinability in rice. Korean J. Agric. Sci. 2012, 39, 477–482. [Google Scholar] [CrossRef]
  28. Shim, K.C.; Kim, S.; Le, A.Q.; Lee, H.S.; Adeva, C.; Jeon, Y.A.; Luong, N.H.; Kim, W.J.; Akhtamov, M.; Ahn, S.N. Fine mapping of a low-temperature Germinability QTL qLTG1 using introgression lines derived from Oryza rufipogon. Plant Breed. Biotechnol. 2019, 7, 141–150. [Google Scholar] [CrossRef]
  29. Shim, K.C.; Kim, S.H.; Lee, H.S.; Adeva, C.; Jeon, Y.A.; Luong, N.H.; Kim, W.J.; Akhtamov, M.; Park, Y.J.; Ahn, S.N. Characterization of a New qLTG3-1 Allele for Low-temperature Germinability in Rice from the Wild Species Oryza rufipogon. Rice 2020, 13, 10. [Google Scholar] [CrossRef]
  30. Causse, M.A.; Fulton, T.M.; Cho, Y.G.; Ahn, S.N.; Chunwongse, J.; Wu, K.S.; Xiao, J.H.; Yu, Z.H.; Ronald, P.C.; Harrington, S.E.; et al. Saturated Molecular Map of the Rice Genome Based on an Interspecific Backcross Population. Genetics 1994, 138, 1251–1274. [Google Scholar]
  31. Panaud, O.; Chen, X.; McCouch, S.R. Development of microsatellite markers and characterization of simple sequence length polymorphism (SSLP) in rice (Oryza sativa L). Mol. Gen. Genet. 1996, 252, 597–607. [Google Scholar] [CrossRef]
  32. McCouch, S.R.; Cooperative, R.G. Gene Nomenclature System for Rice. Rice 2008, 1, 72–84. [Google Scholar] [CrossRef] [Green Version]
  33. Shinada, H.; Iwata, N.; Sato, T.; Fujino, K. QTL pyramiding for improving of cold tolerance at fertilization stage in rice. Breed. Sci. 2014, 63, 483–488. [Google Scholar] [CrossRef] [Green Version]
  34. Najeeb, S.; Ali, J.; Mahender, A.; Pang, Y.L.; Zilhas, J.; Murugaiyan, V.; Vemireddy, L.R.; Li, Z. Identification of main-effect quantitative trait loci (QTLs) for low-temperature stress tolerance germination- and early seedling vigor-related traits in rice (Oryza sativa L.). Mol. Breed. 2020, 40, 10. [Google Scholar] [CrossRef] [Green Version]
  35. Xiao, J.; Li, J.; Grandillo, S.; Ahn, S.N.; Yuan, L.; Tanksley, S.D.; McCouch, S.R. Identification of trait-improving quantitative trait loci alleles from a wild rice relative, Oryza rufipogon. Genetics 1998, 150, 899–909. [Google Scholar] [PubMed]
  36. Luo, X.; Ji, S.-D.; Yuan, P.-R.; Lee, H.-S.; Kim, D.-M.; Balkunde, S.; Kang, J.-W.; Ahn, S.-N. QTL mapping reveals a tight linkage between QTLs for grain weight and panicle spikelet number in rice. Rice 2013, 6, 33. [Google Scholar] [CrossRef] [PubMed] [Green Version]
  37. Fukuoka, S.; Saka, N.; Koga, H.; Ono, K.; Shimizu, T.; Ebana, K.; Hayashi, N.; Takahashi, A.; Hirochika, H.; Okuno, K. Loss of function of a proline-containing protein confers durable disease resistance in rice. Science 2009, 325, 998–1001. [Google Scholar] [CrossRef] [PubMed]
Figure 1. Graphical genotypes of two parental lines (CR1517 and CR1518) with the locations of five and three QTLs for low-temperature (qLTG in filled triangle) and coleoptile length (qCCL in filled box), respectively, on the left of the chromosomes. Black and white bars represent O. rufipogon and Hwaseong chromosome segments, respectively.
Genes 11 01200 g001
Figure 2. Frequency distribution of germination rate in 154 F2 plants at 6 and 7 days after incubation (DAI) at 13 °C. Germination rate was measured at 4–8 (DAI). Arrows indicate mean germination rate of CR1517 and CR1518 lines.
Genes 11 01200 g002
Figure 3. Frequency distribution of LTG at 7 days after incubation in the two F3 population. Plants in each population are segregating in (A) RM25633 for qLTG10.1 and (B) RM333 for qLTG10.2 in the different genetic background. The numbers in parenthesis indicate plants number followed by mean germination rate ± standard deviation of genotype group. p-value and R2 were determined by one-way ANOVA. HH: Hwaseong homozygoutes, RR: O. rufipogon homozygotes, HR: heterozygotes.
Genes 11 01200 g003
Figure 4. Frequency distribution of coleoptile length in 149 F2 plants at 13 °C at 9 and 10 DAI. Arrows indicate mean coleoptile length of CR1517 and CR1518 lines.
Genes 11 01200 g004
Table 1. Mean germination rates in O. rufipogon, Hwaseong, two introgression lines, and F2 population.
Germination Rate (%)
Trait (x)Lines (n = 5 (z))F2 Population
O. rufipogonHwaseongCR1517CR1518MeanRange
4 DAI60.0 a (y)3.3 c30.4 b34.8 b15.6 ± 10.11.1–48.9
5 DAI91.9 a11.1 c49.3 b56.7 b38.3 ± 15.24.4–72.2
6 DAI97.4 a33.9 d70.4 c78.5 b58.6 ± 17.712.2–88.9
7 DAI100 a62.2 d84.2 c91.9 b74.9 ± 16.525.6–95.6
8 DAI100 a80.7 b99.3 a100 a90.7 ± 11.651.1–100
(x) DAI: days after incubation. Data are presented as mean germination rate or mean ± standard deviation. (y) Different letters indicate significant differences among lines at each DAI based on Tukey’s test (p < 0.05). (z) n: number of plants.
Table 2. List of QTLs identified for low-temperature germinability in F2 population.
PopulationTrait (x)QTLChr.MarkersF-Valuep-ValueR2 (%) (y)Gene Action (z)
add/a
F2LTG
(6 DAI)
qLTG11RM220-CRM2214.40.00016.010.00.20.0
qLTG33qLTG3-1_18D23.10.00023.89.69.71.0
qLTG10.210RM333-RM5913.30.0384.2−4.25.1−1.2
Total38.9
LTG
(7 DAI)
qLTG11RM220-CRM2210.30.00012.07.72.10.3
qLTG33qLTG3-1_18D21.00.00022.18.19.71.2
qLTG88RM72-RM227054.40.0145.44.92.40.5
qLTG10.110RM256334.20.0414.62.9−1.9−0.6
qLTG10.210RM333-RM5915.40.0066.6−5.35.5−1.0
Total42.0
(x) LTG: low-temperature germination. (y) R2: Coefficient of determination. (z) a: Additive effect = (O. rufipogon homozygote − Hwaseong homozygote)/2, d: Dominant effect = Heterozygote − (O. rufipogon homozygote + Hwaseong homozygote)/2, d/a: degree of dominance.
Table 3. Mean coleoptile lengths (mm) in O. rufipogon, Hwaseong, two introgression lines, and F2 population.
Coleoptile Lengths (mm)
Trait (x)Lines (n = 5 (z))F2 Population
O. rufipogonHwaseongCR1517CR1518MeanRange
7 DAI2.6 a (y)0.7 c1.6 b1.1 bc1.2 ± 0.70.2–9.2
8 DAI4.5 a1.4 d2.8 b2.0 c3.2 ± 0.50.6–9.5
9 DAI7.0 a2.8 c5.0 b3.5 c6.6 ± 1.32.0–10.0
10 DAI9.0 a3.8 d7.4 b5.6 c7.9 ± 1.45.0–12.0
(x) DAI: days after incubation. Data are presented as mean germination rate or mean ± standard deviation. (y) Different letters in each row indicate significant difference at p < 0.05 based on Tukey’s test. (z) n: number of plants.
Table 4. List of QTLs identified for coleoptile length under low-temperature condition.
PopulationTrait (x)QTLChr.MarkersF-Valuep-ValueR2 (%) (y)Gene Action (z)
add/a
F2CCL
9 DAI
qCCL33qLTG3-1_18D9.820.00012.00.0320.082.6
qCCL88RM22689-RM227054.770.0016.20.0430.020.6
CCL
10 DAI
qCCL11RM220-CRM224.970.0086.40.0370.020.1
qCCL33qLTG3-1_18D7.300.0019.20.0330.072.3
qCCL88RM22689-RM227055.270.0067.10.0460.030.7
(x) CCL: Coleoptile length, (y) Coefficient of determination, (z) a: Additive effect = (O. rufipogon homozygote-Hwaseong homozygote)/2, d: Dominant effect = Heterozygote − (O. rufipogon homozygote + Hwaseong homozygote)/2, d/a: Degree of dominance.
Publisher’s Note: MDPI stays neutral with regard to jurisdictional claims in published maps and institutional affiliations.

