Mass Spectrometry Based-Proteomic Analysis of Anisakis spp.: A Preliminary Study towards a New Diagnostic Tool

 , ,
, , 
Abstract
1. Introduction
2. Materials and Methods
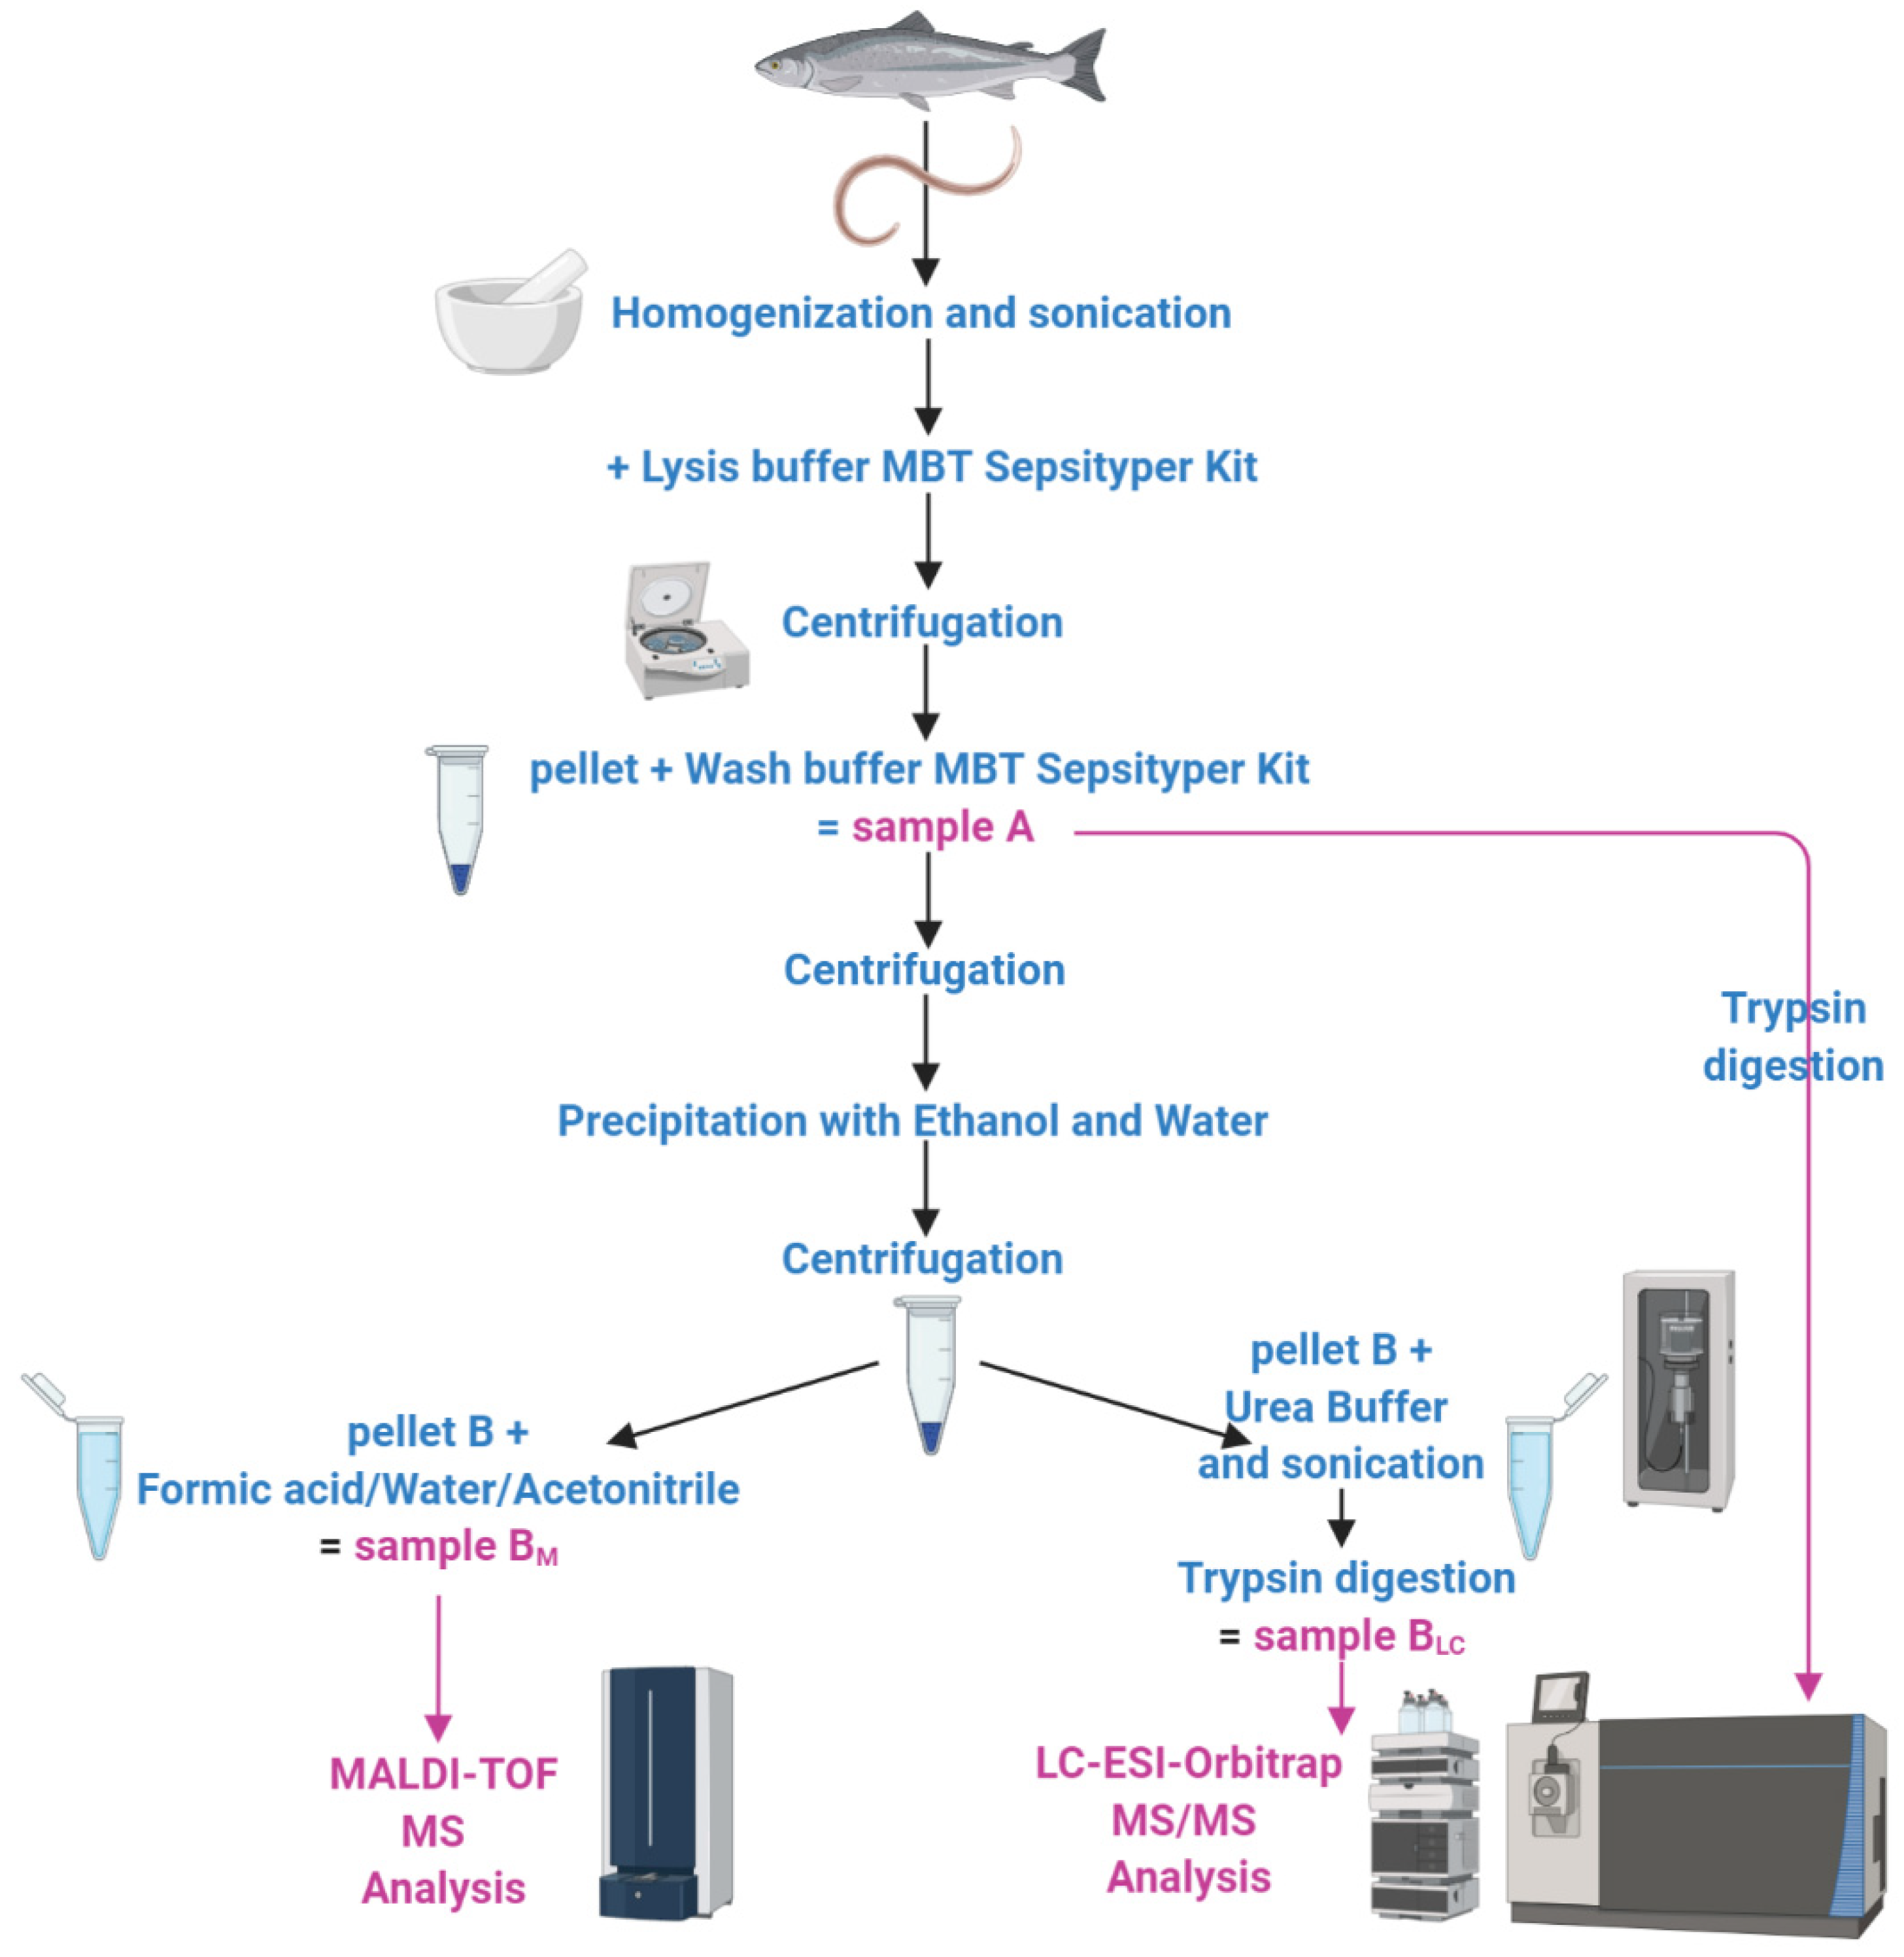
2.1. Protein Extraction
2.2. Matrix-Assisted Laser Desorption/Ionization–Time of Flight Mass Spectrometry (MALDI–TOF MS)
2.3. In-Solution Protein Digestion
2.4. Liquid Chromatography–Electrospray Ionization–Tandem MS (LC–ESI–MS/MS)
2.5. Database Searching and Protein Identification
2.6. Functional Analysis
3. Results
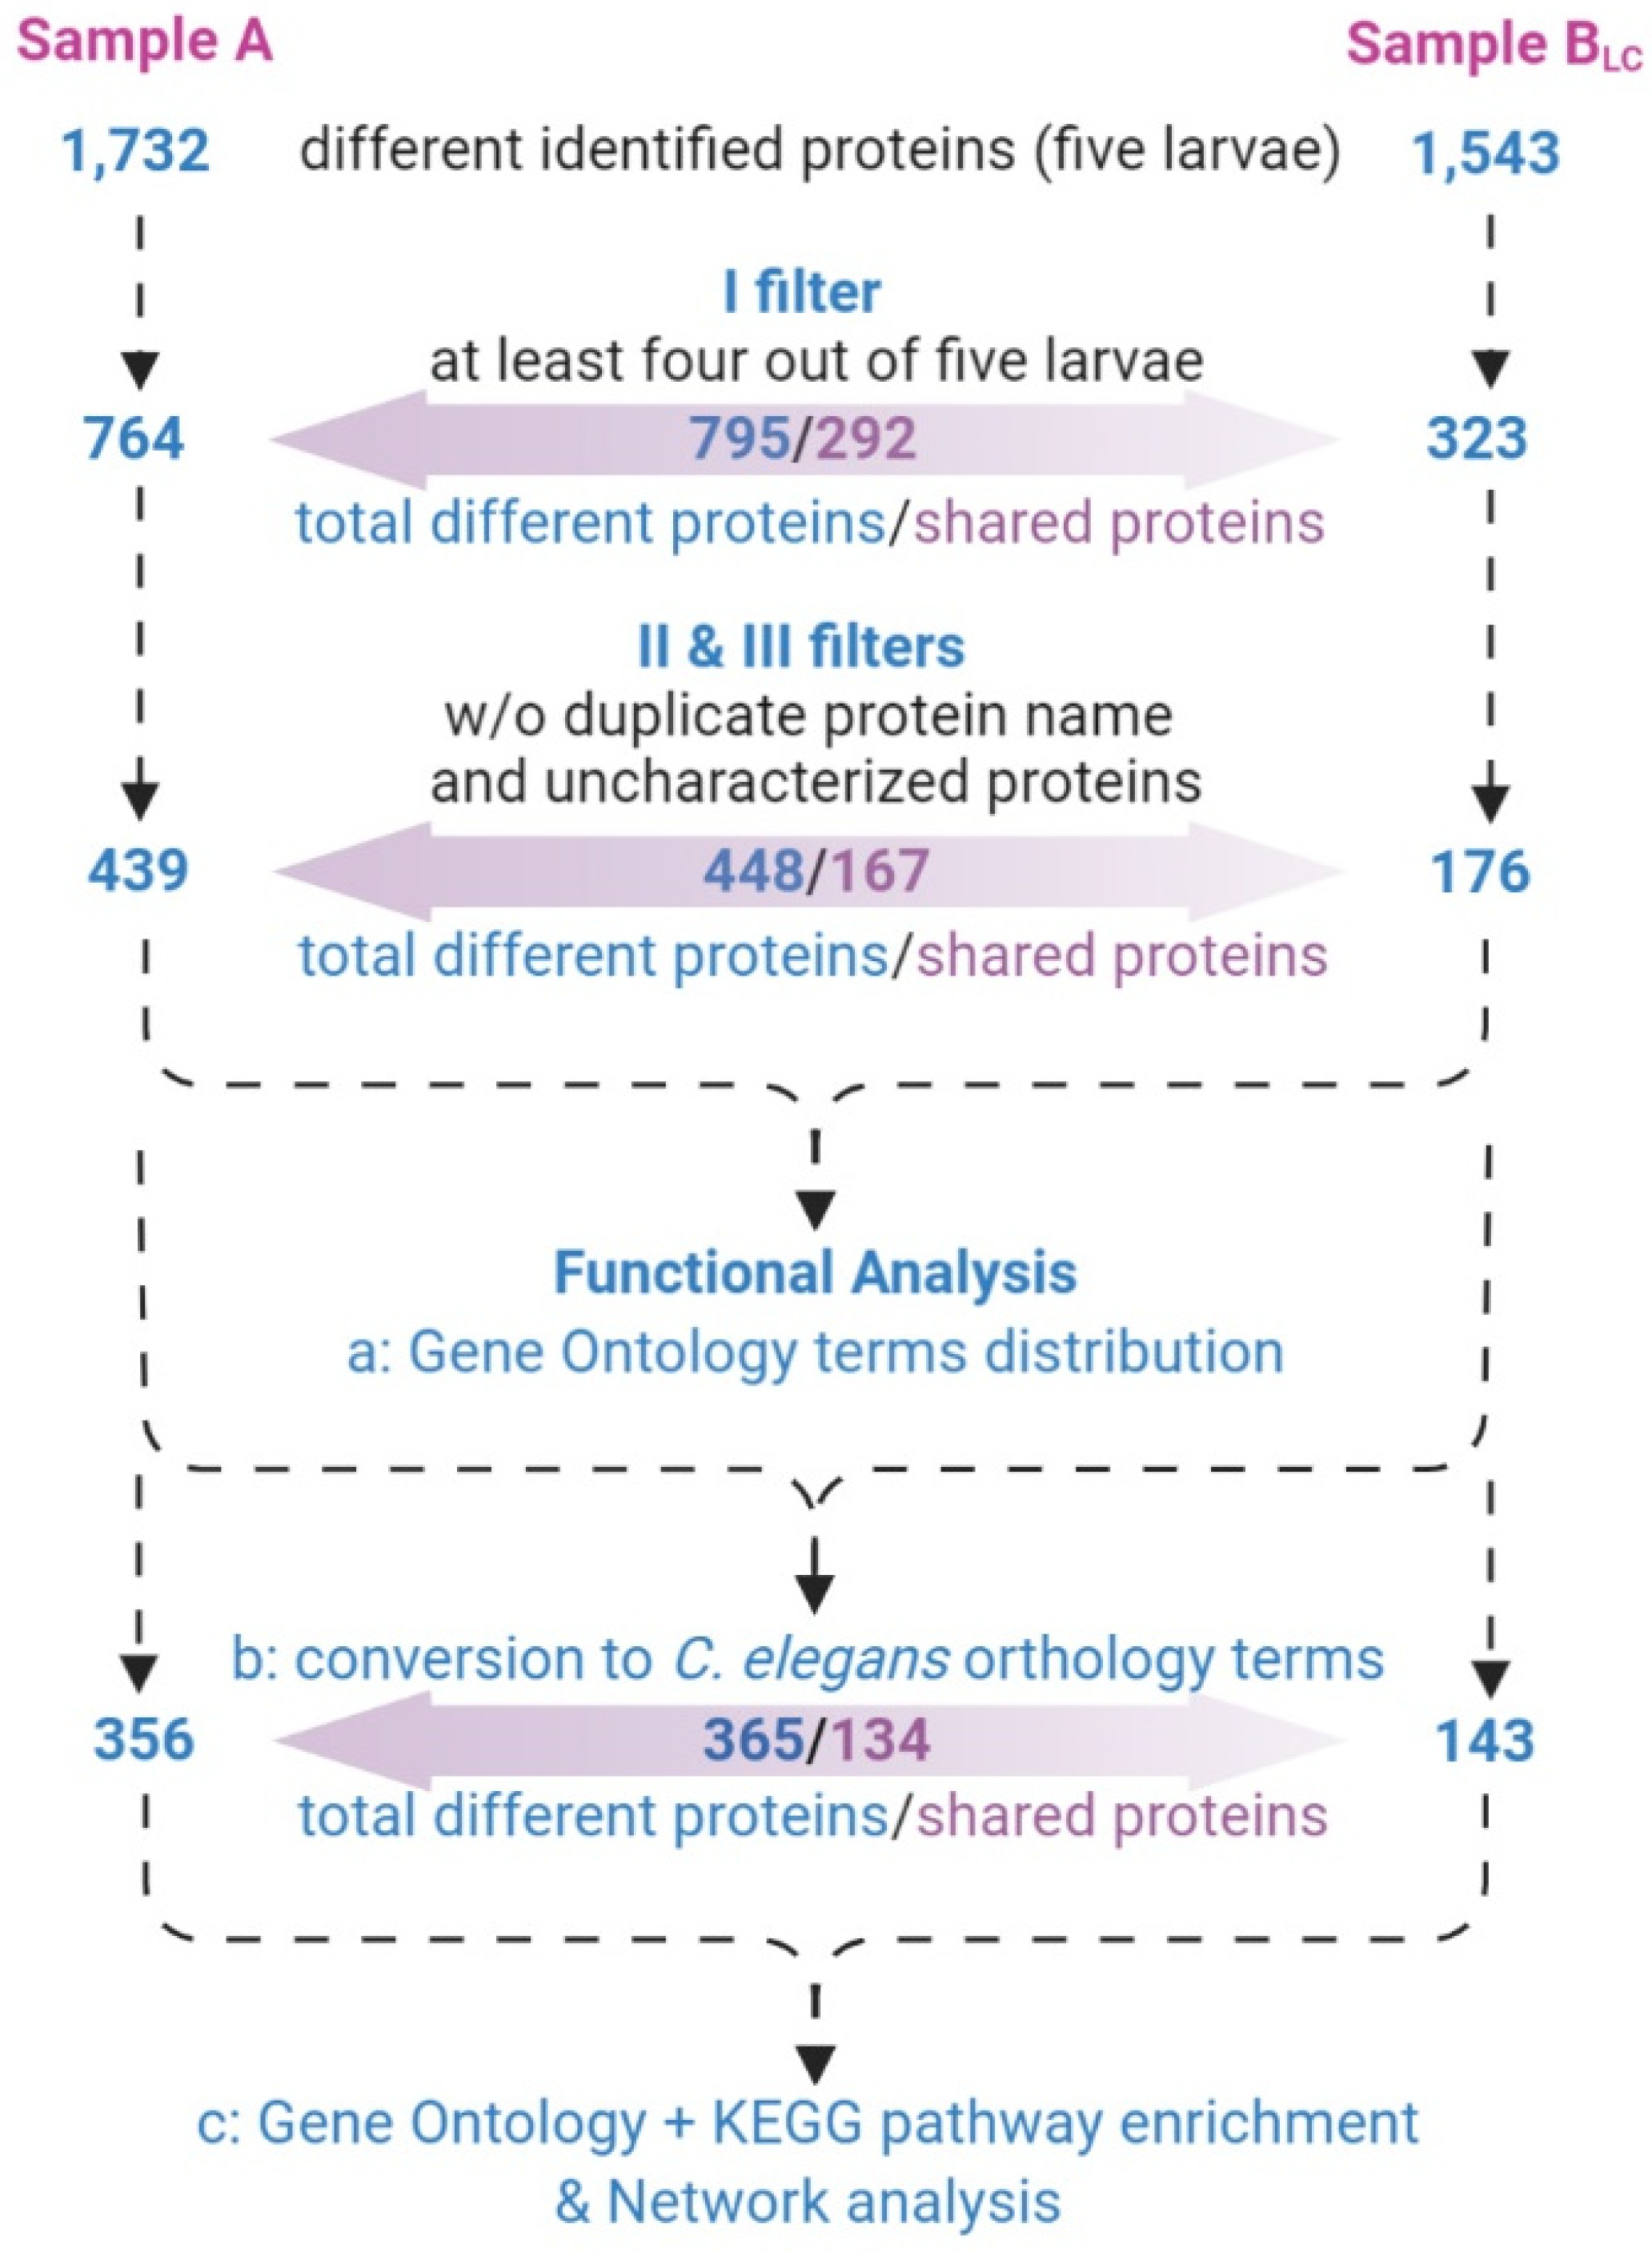
3.1. Experimental Pipeline
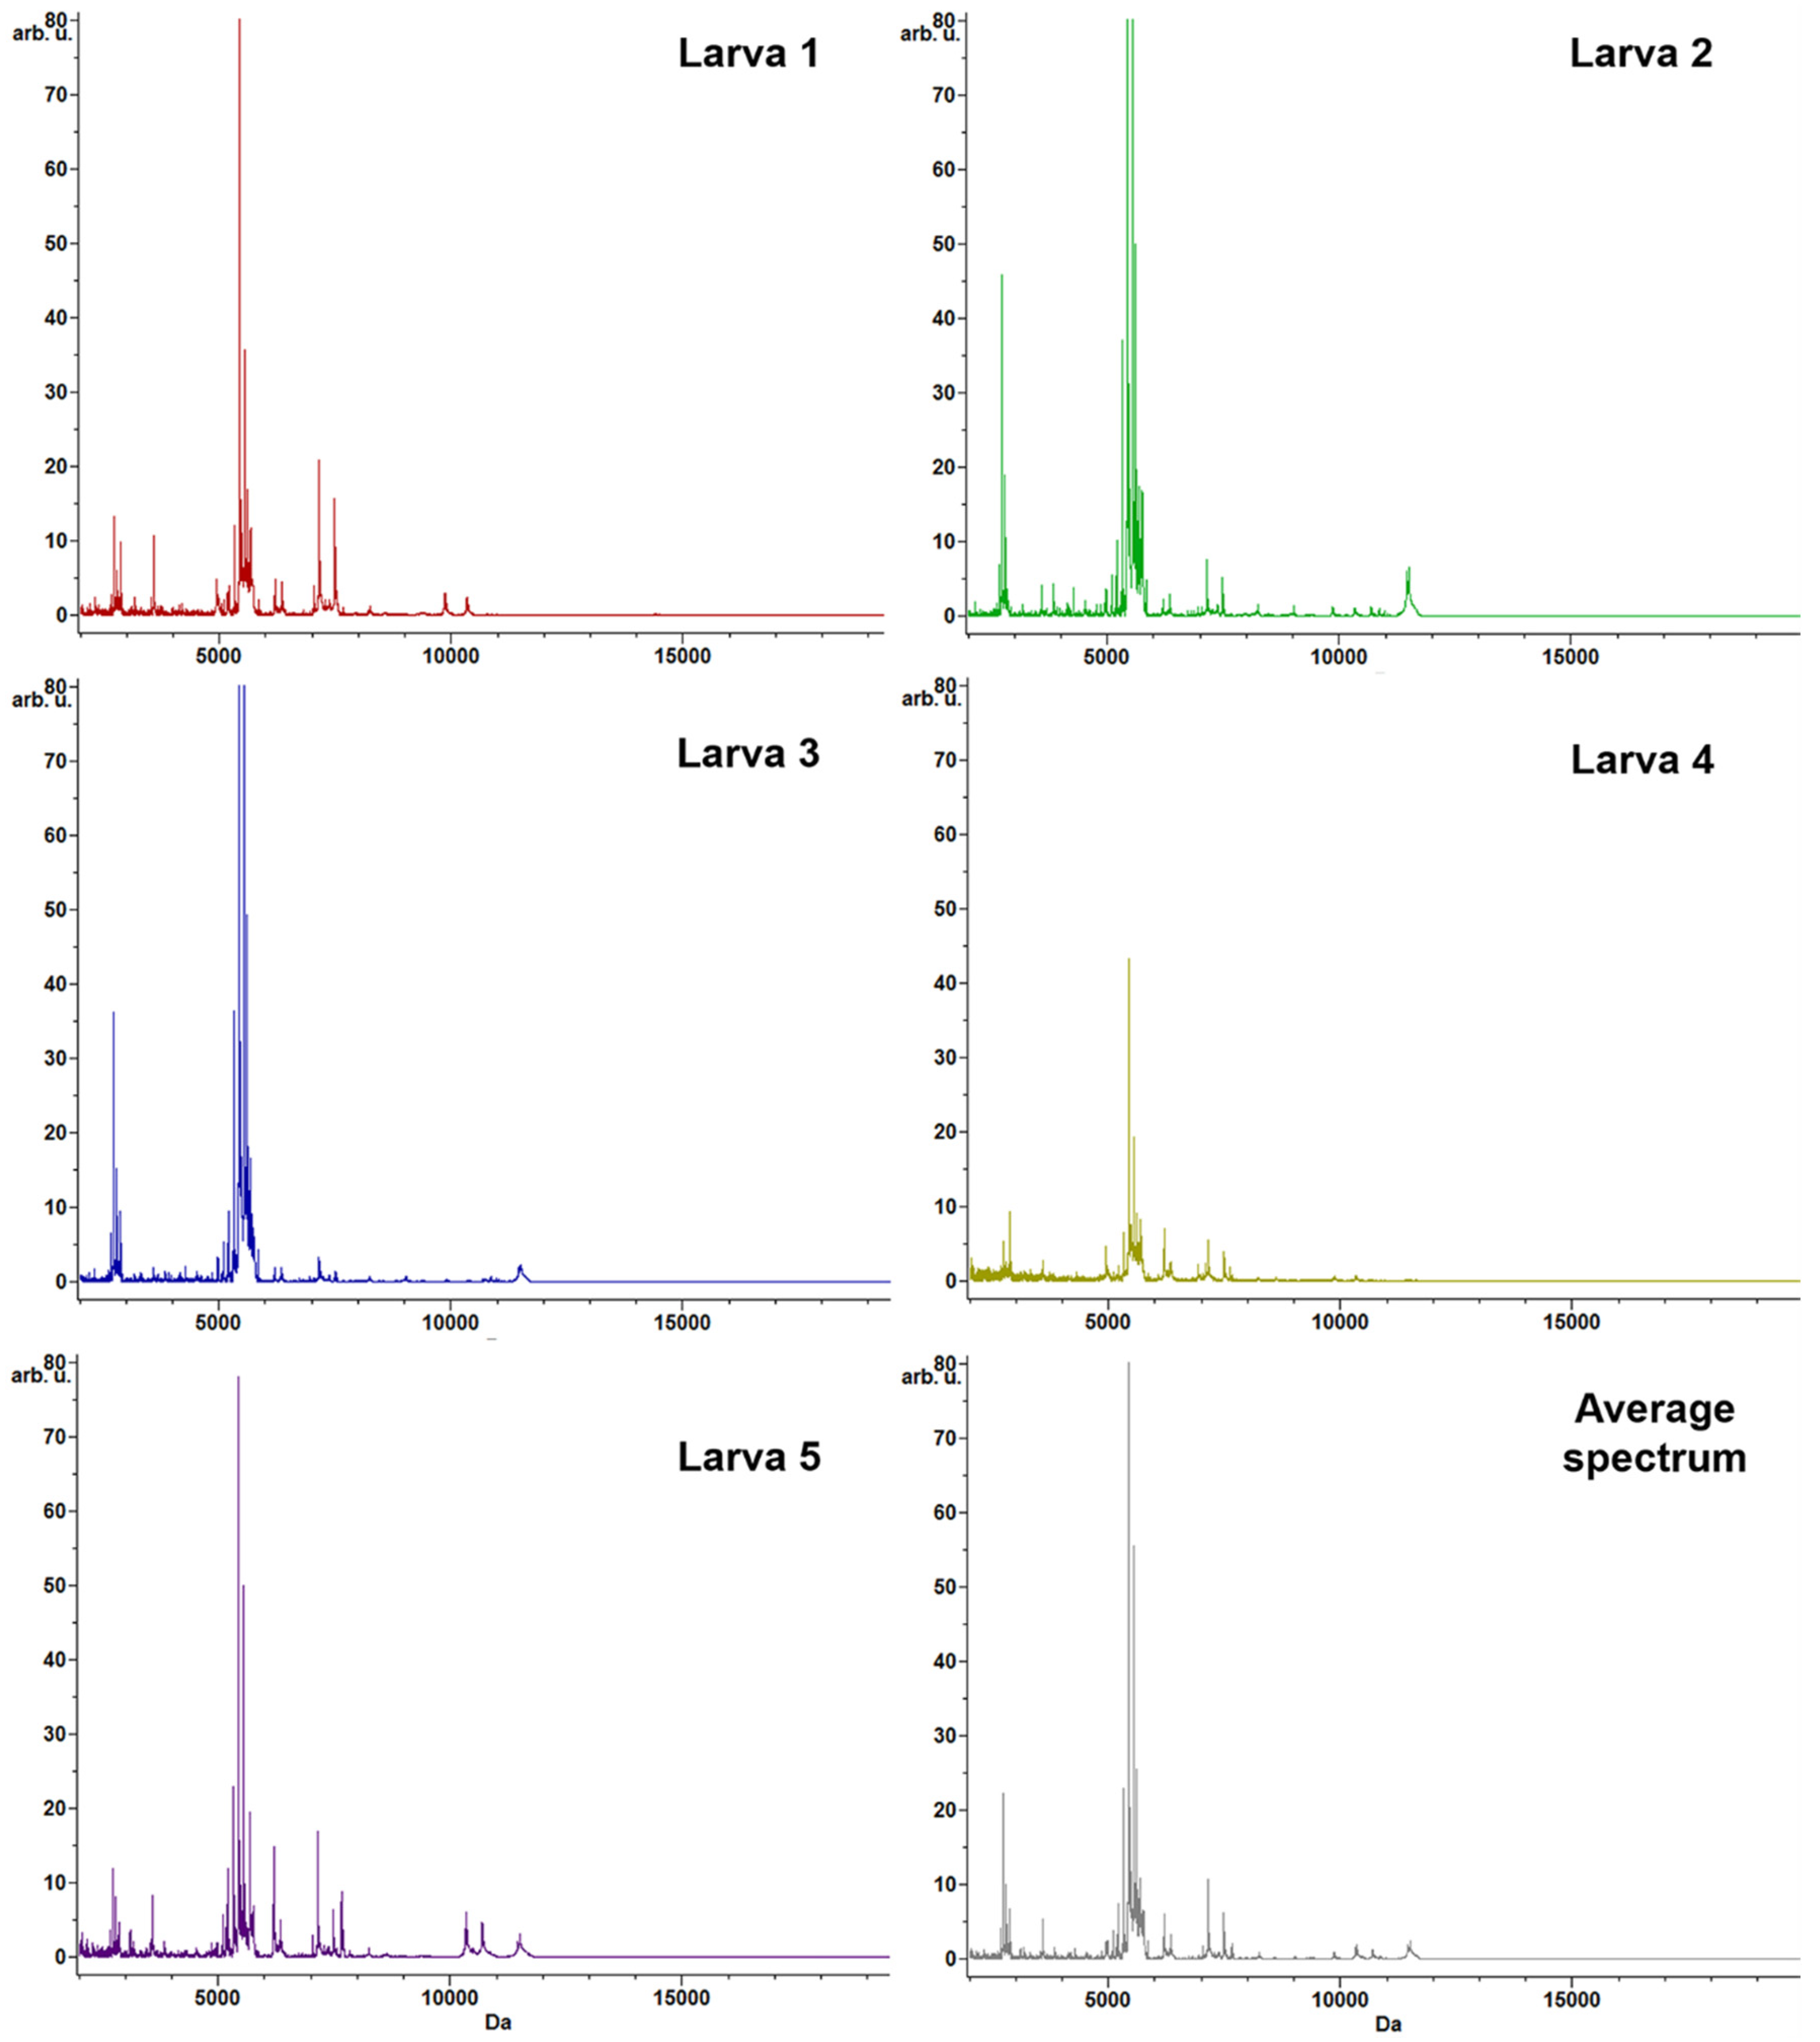
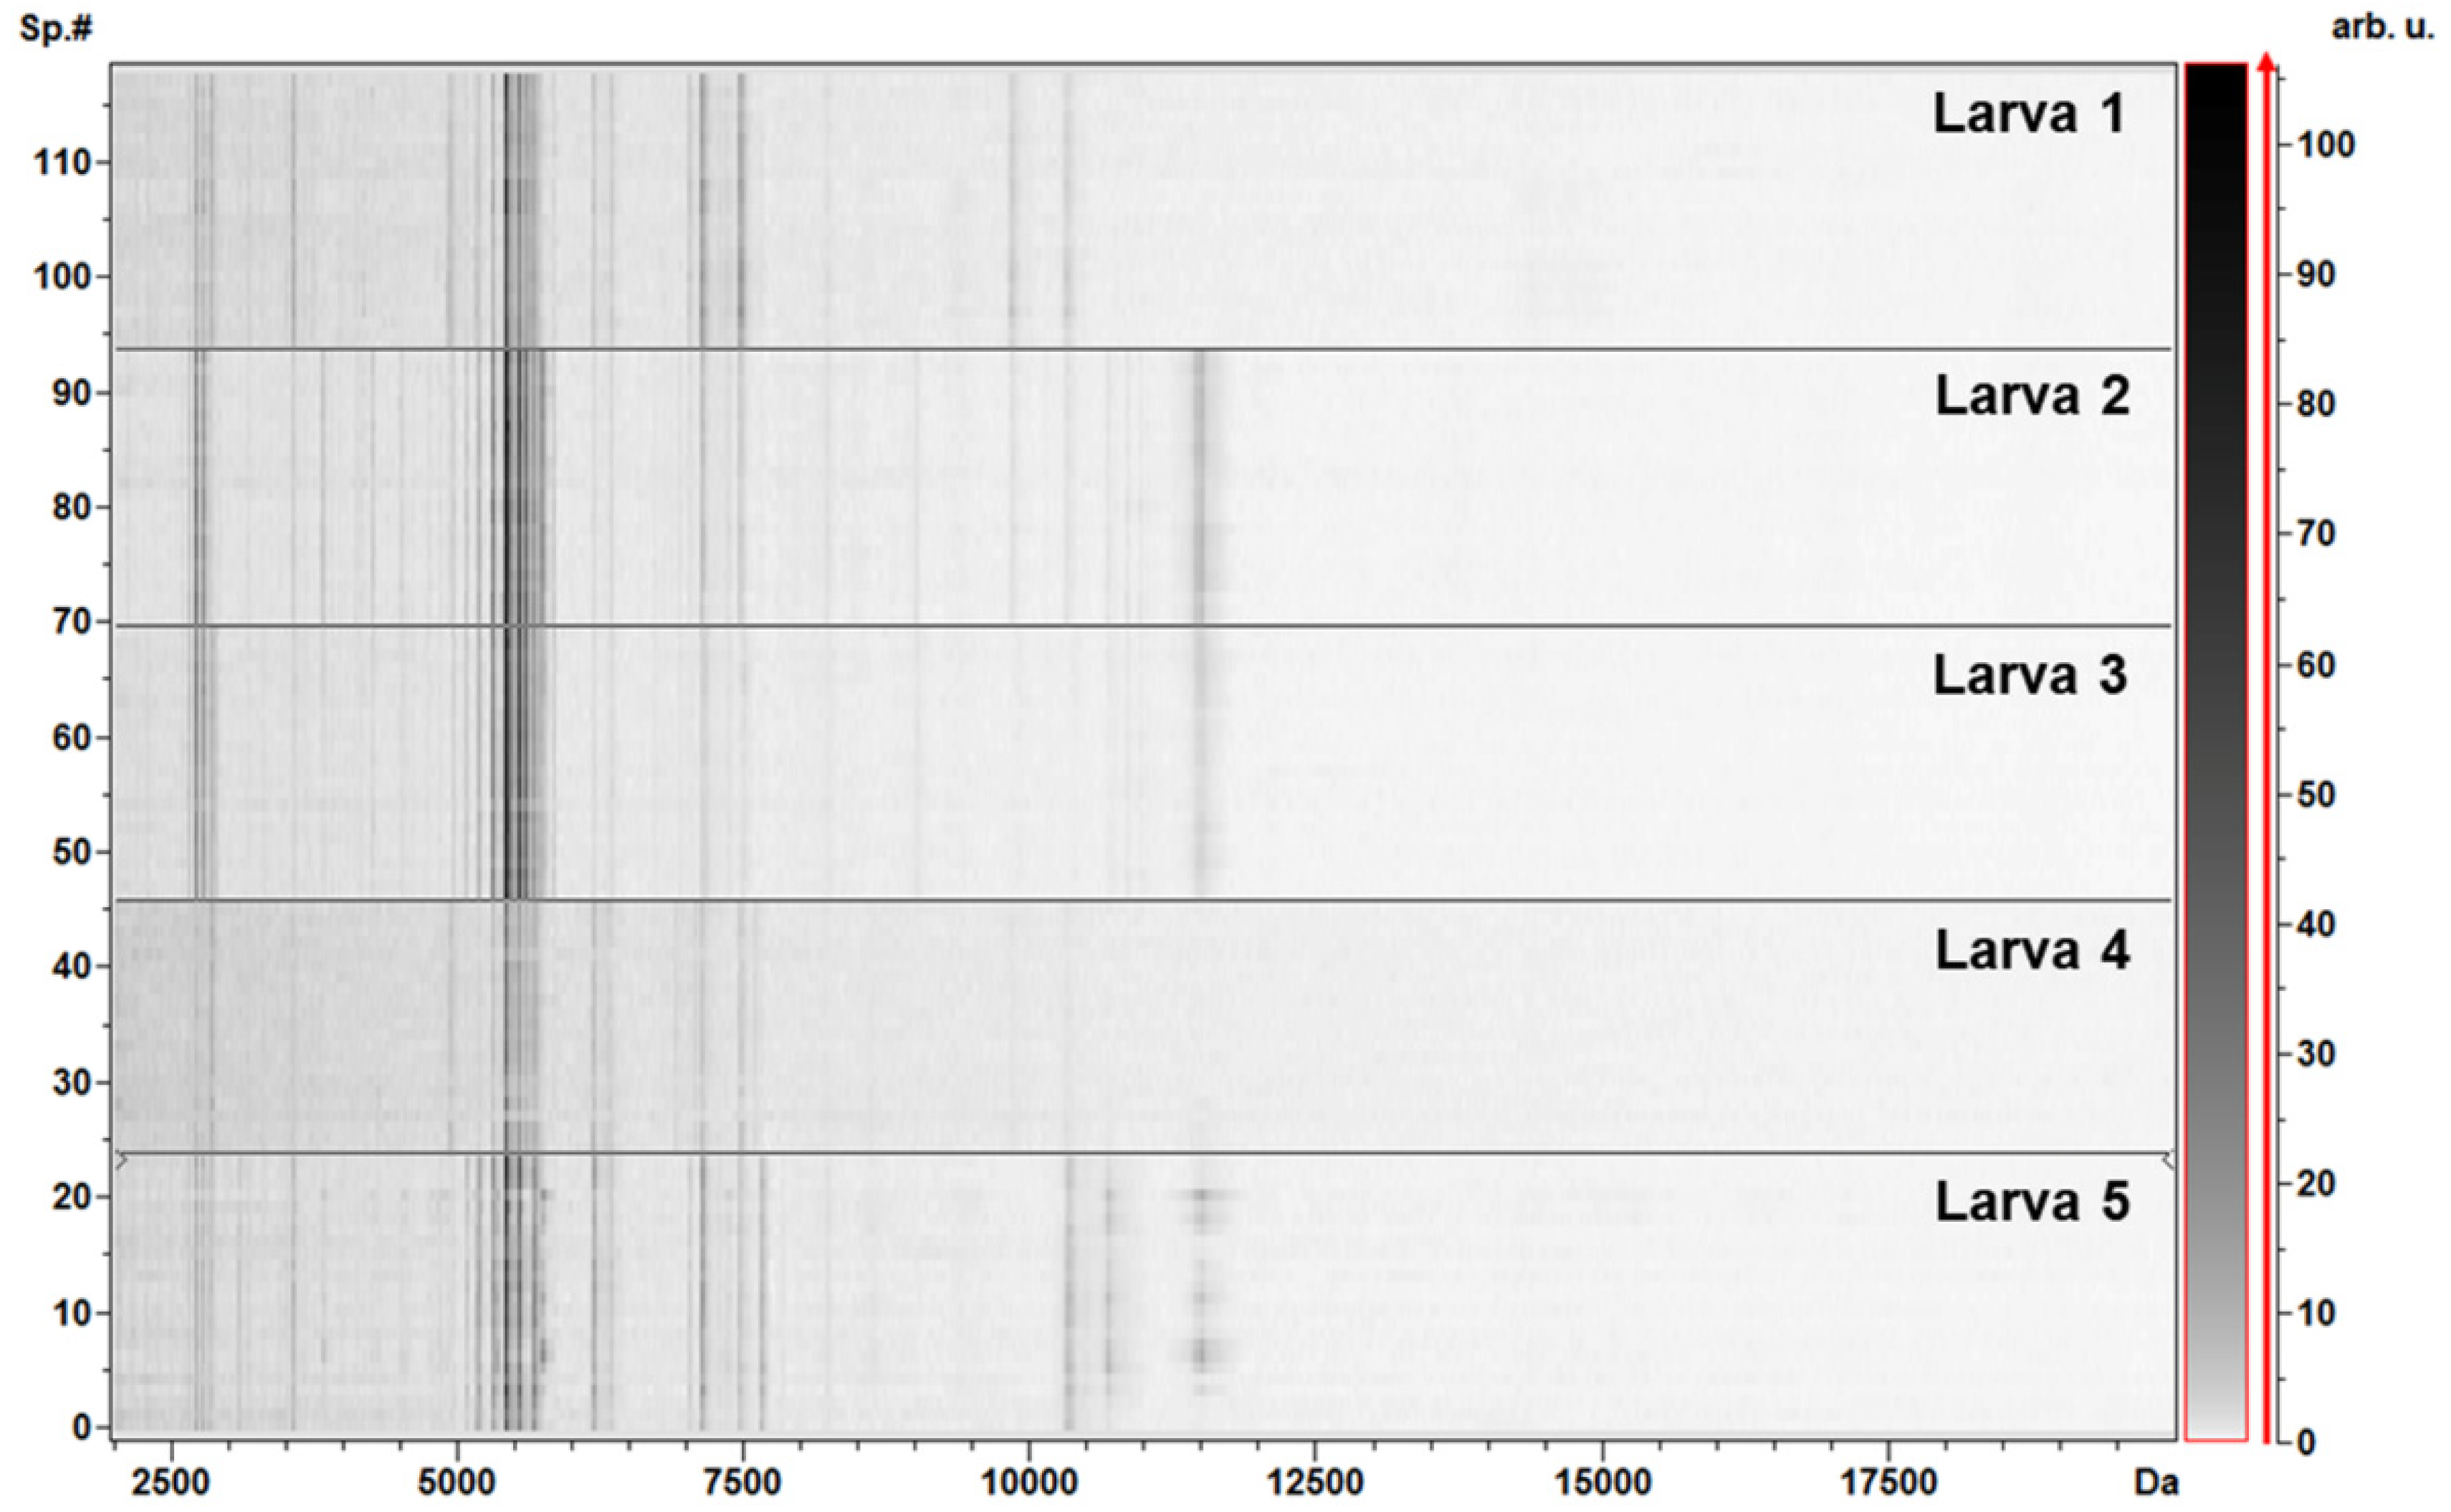
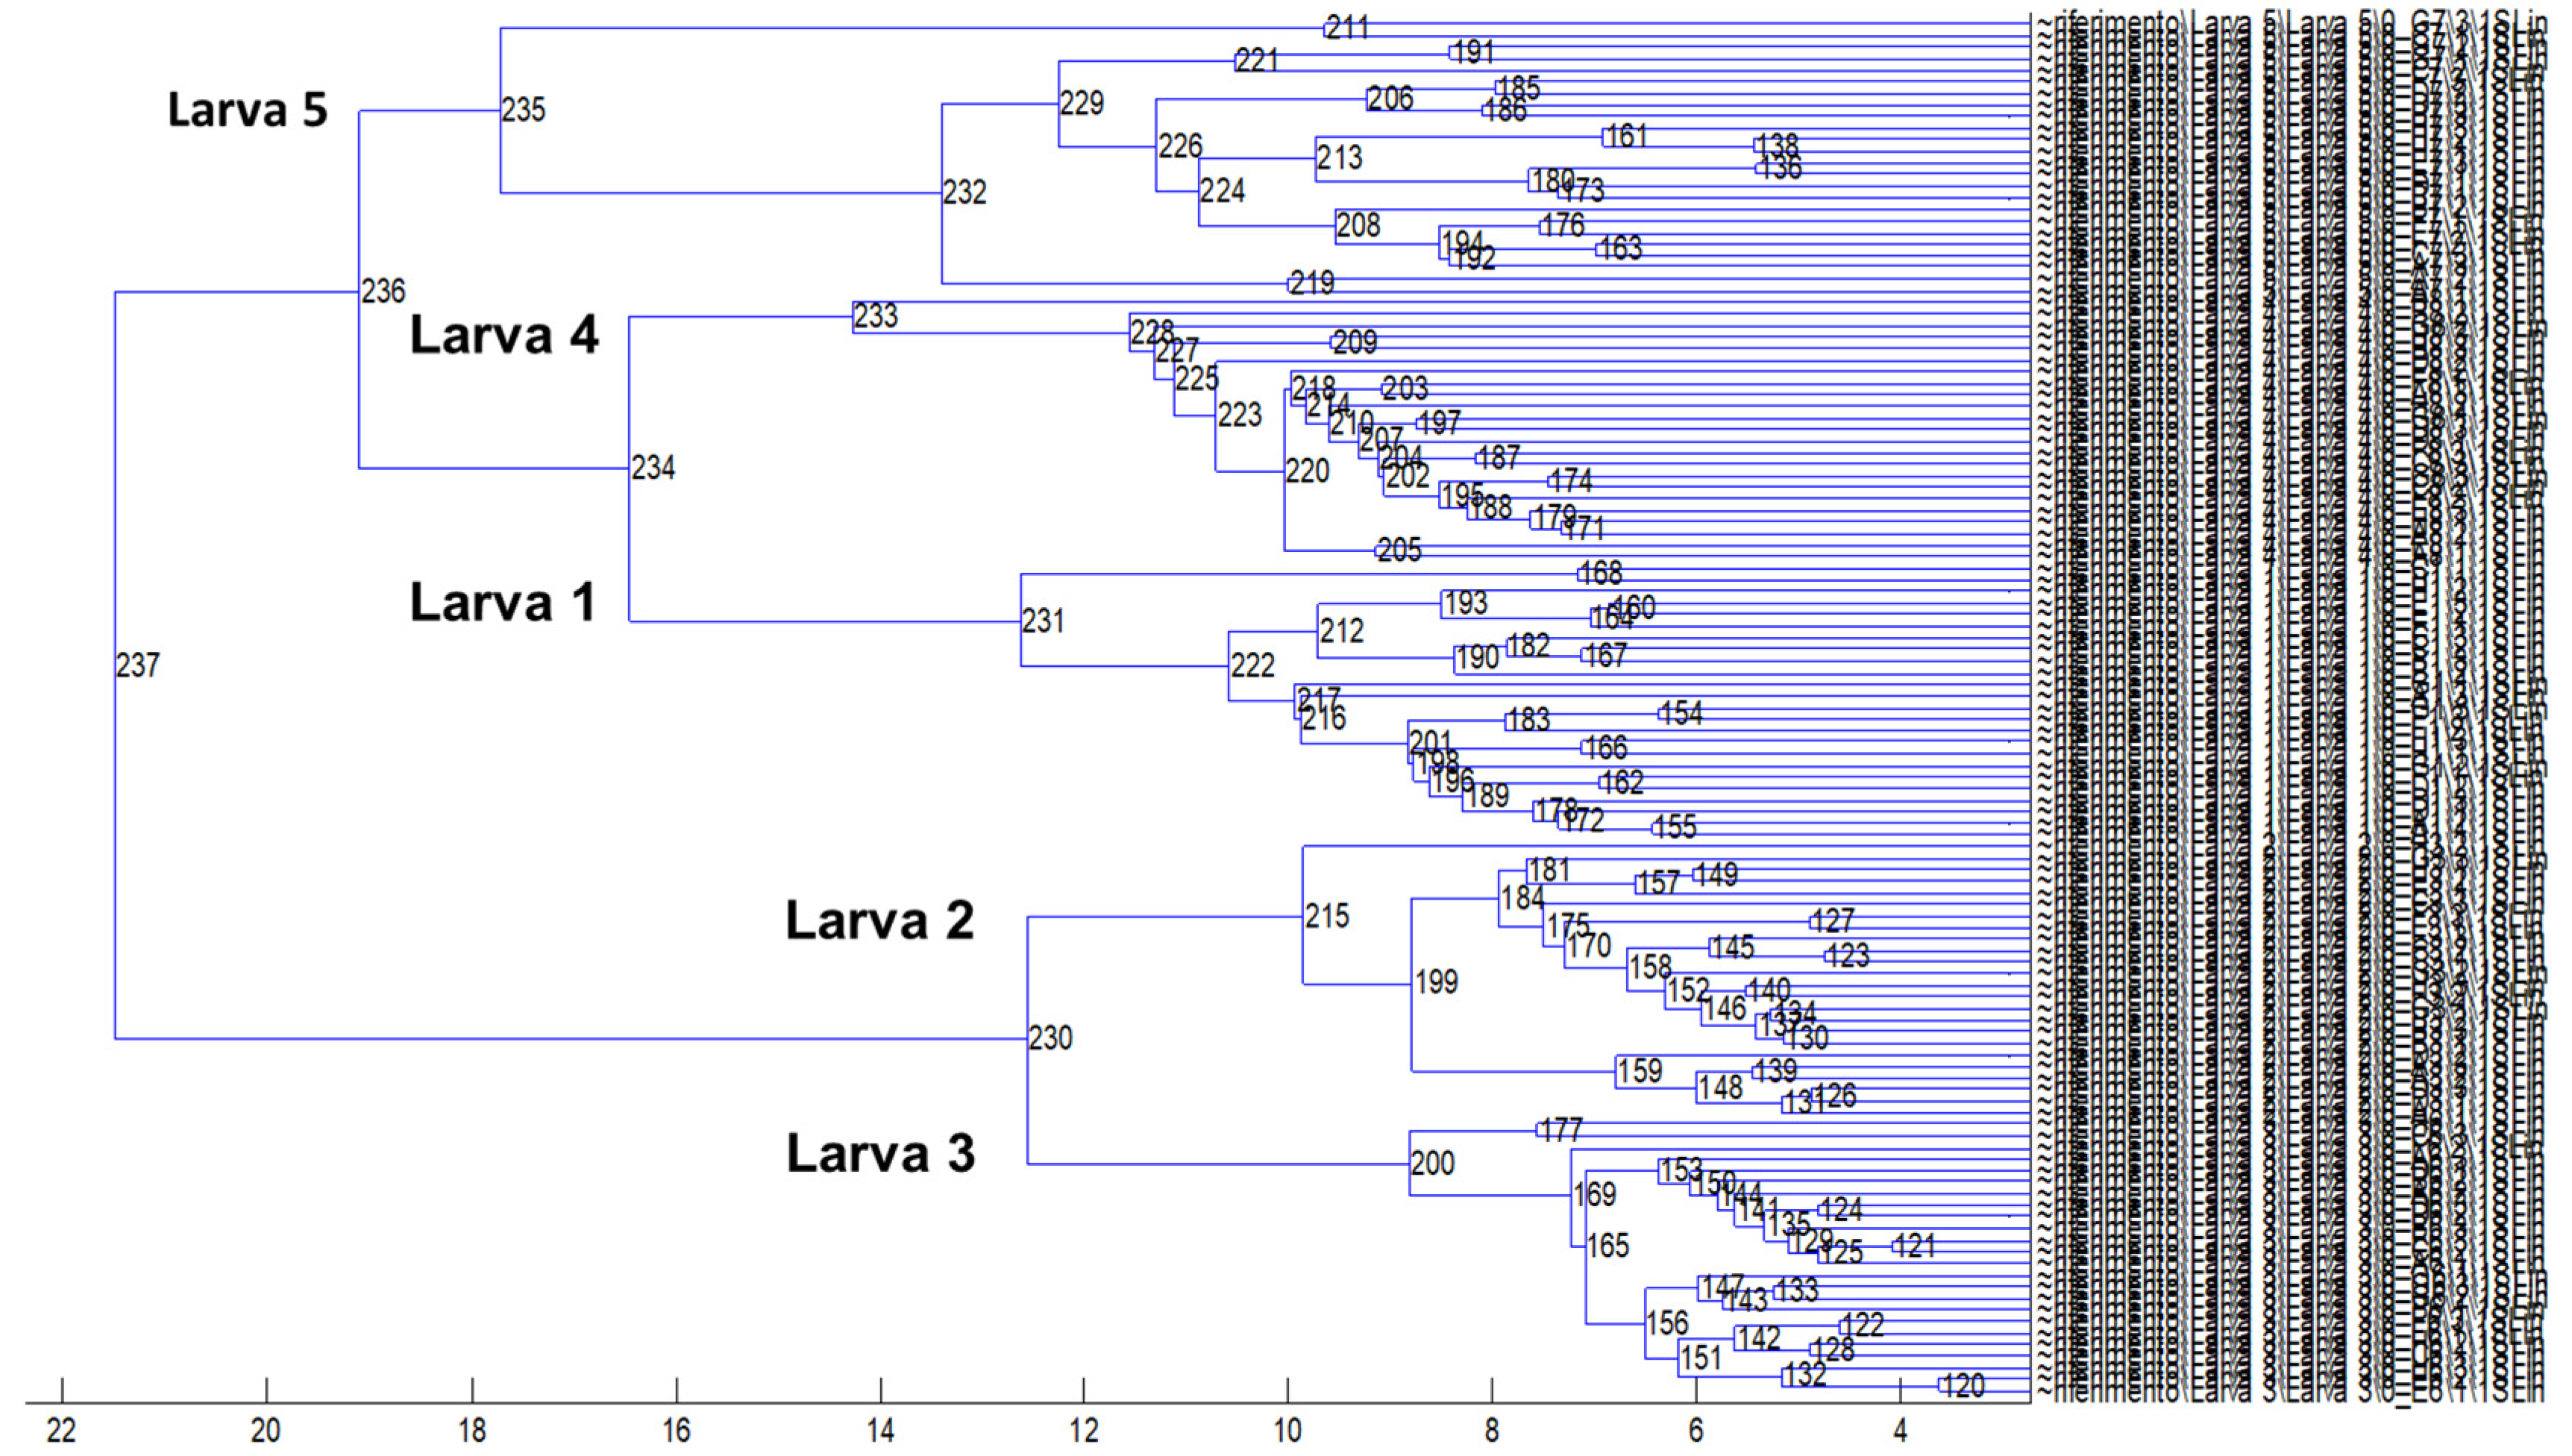
3.2. Protein Profiling by MALDI–TOF MS Analysis
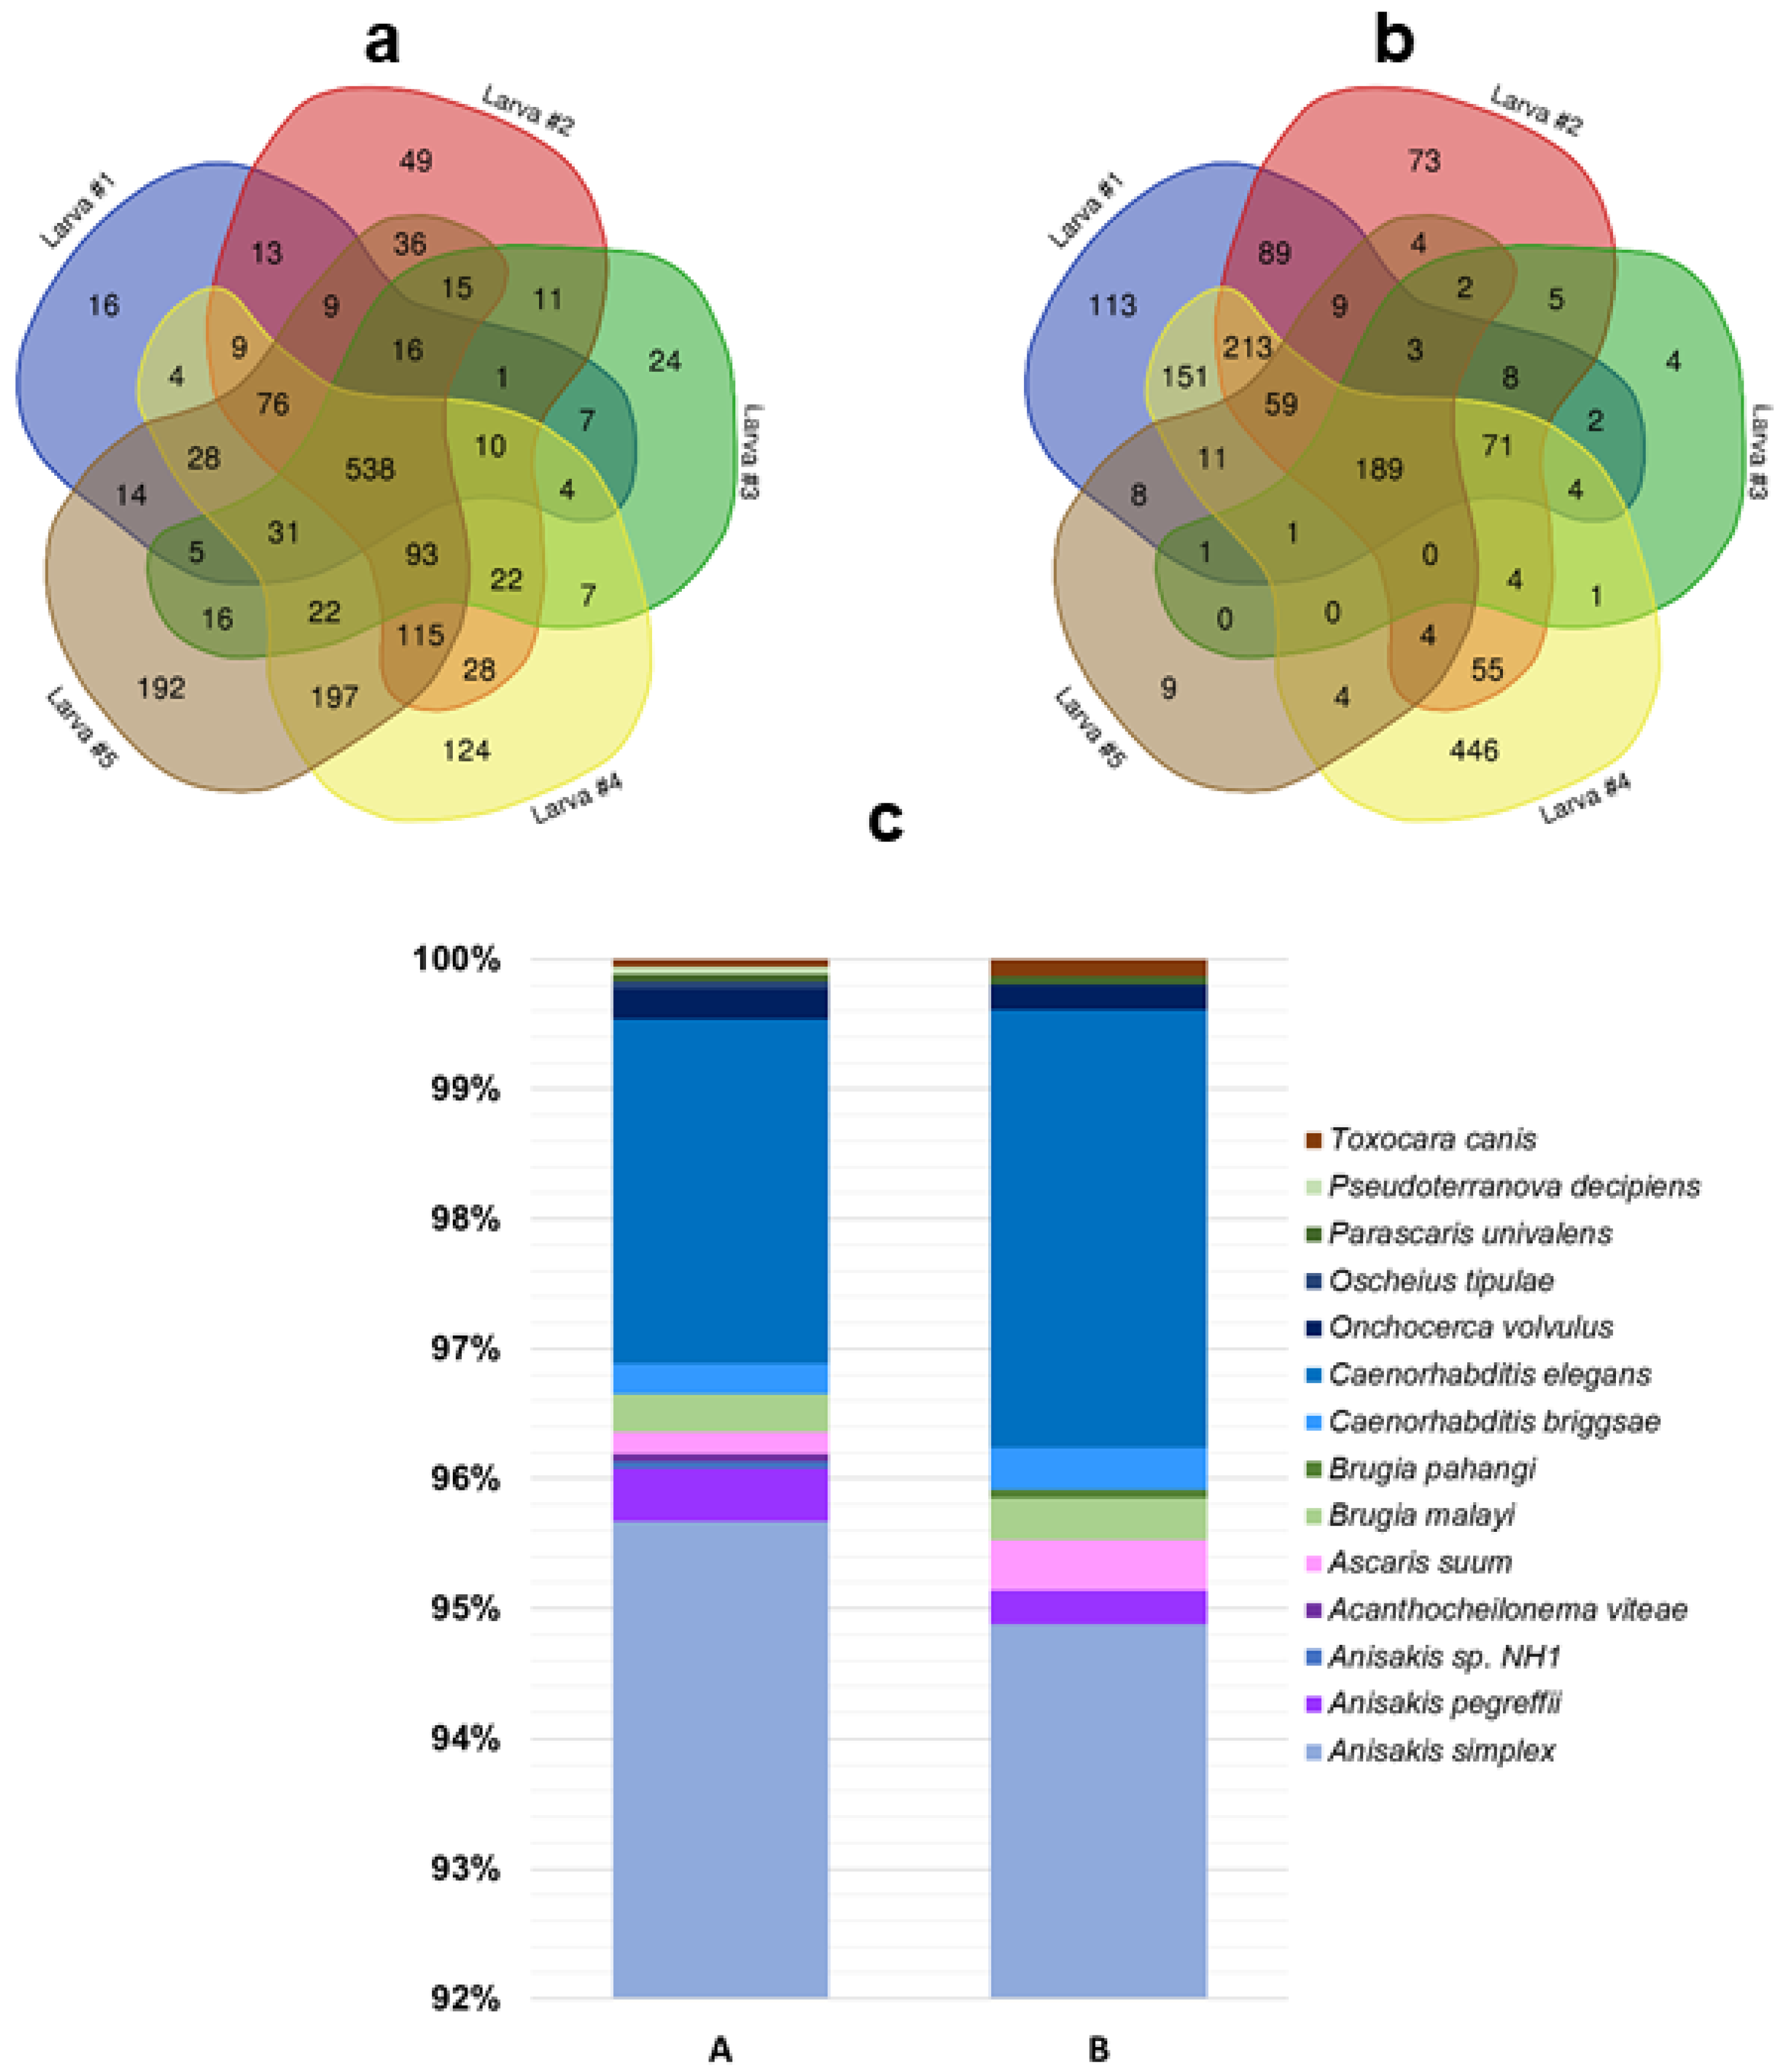
3.3. Protein Profiling by Tandem Mass Spectrometry
- only proteins identified in at least four out of five larvae (Supplementary material S3) were considered;
- proteins with different UniProtKB accession code but the same name were collapsed into one single hit;
- proteins defined as unknown were deleted (Supplementary material S4).
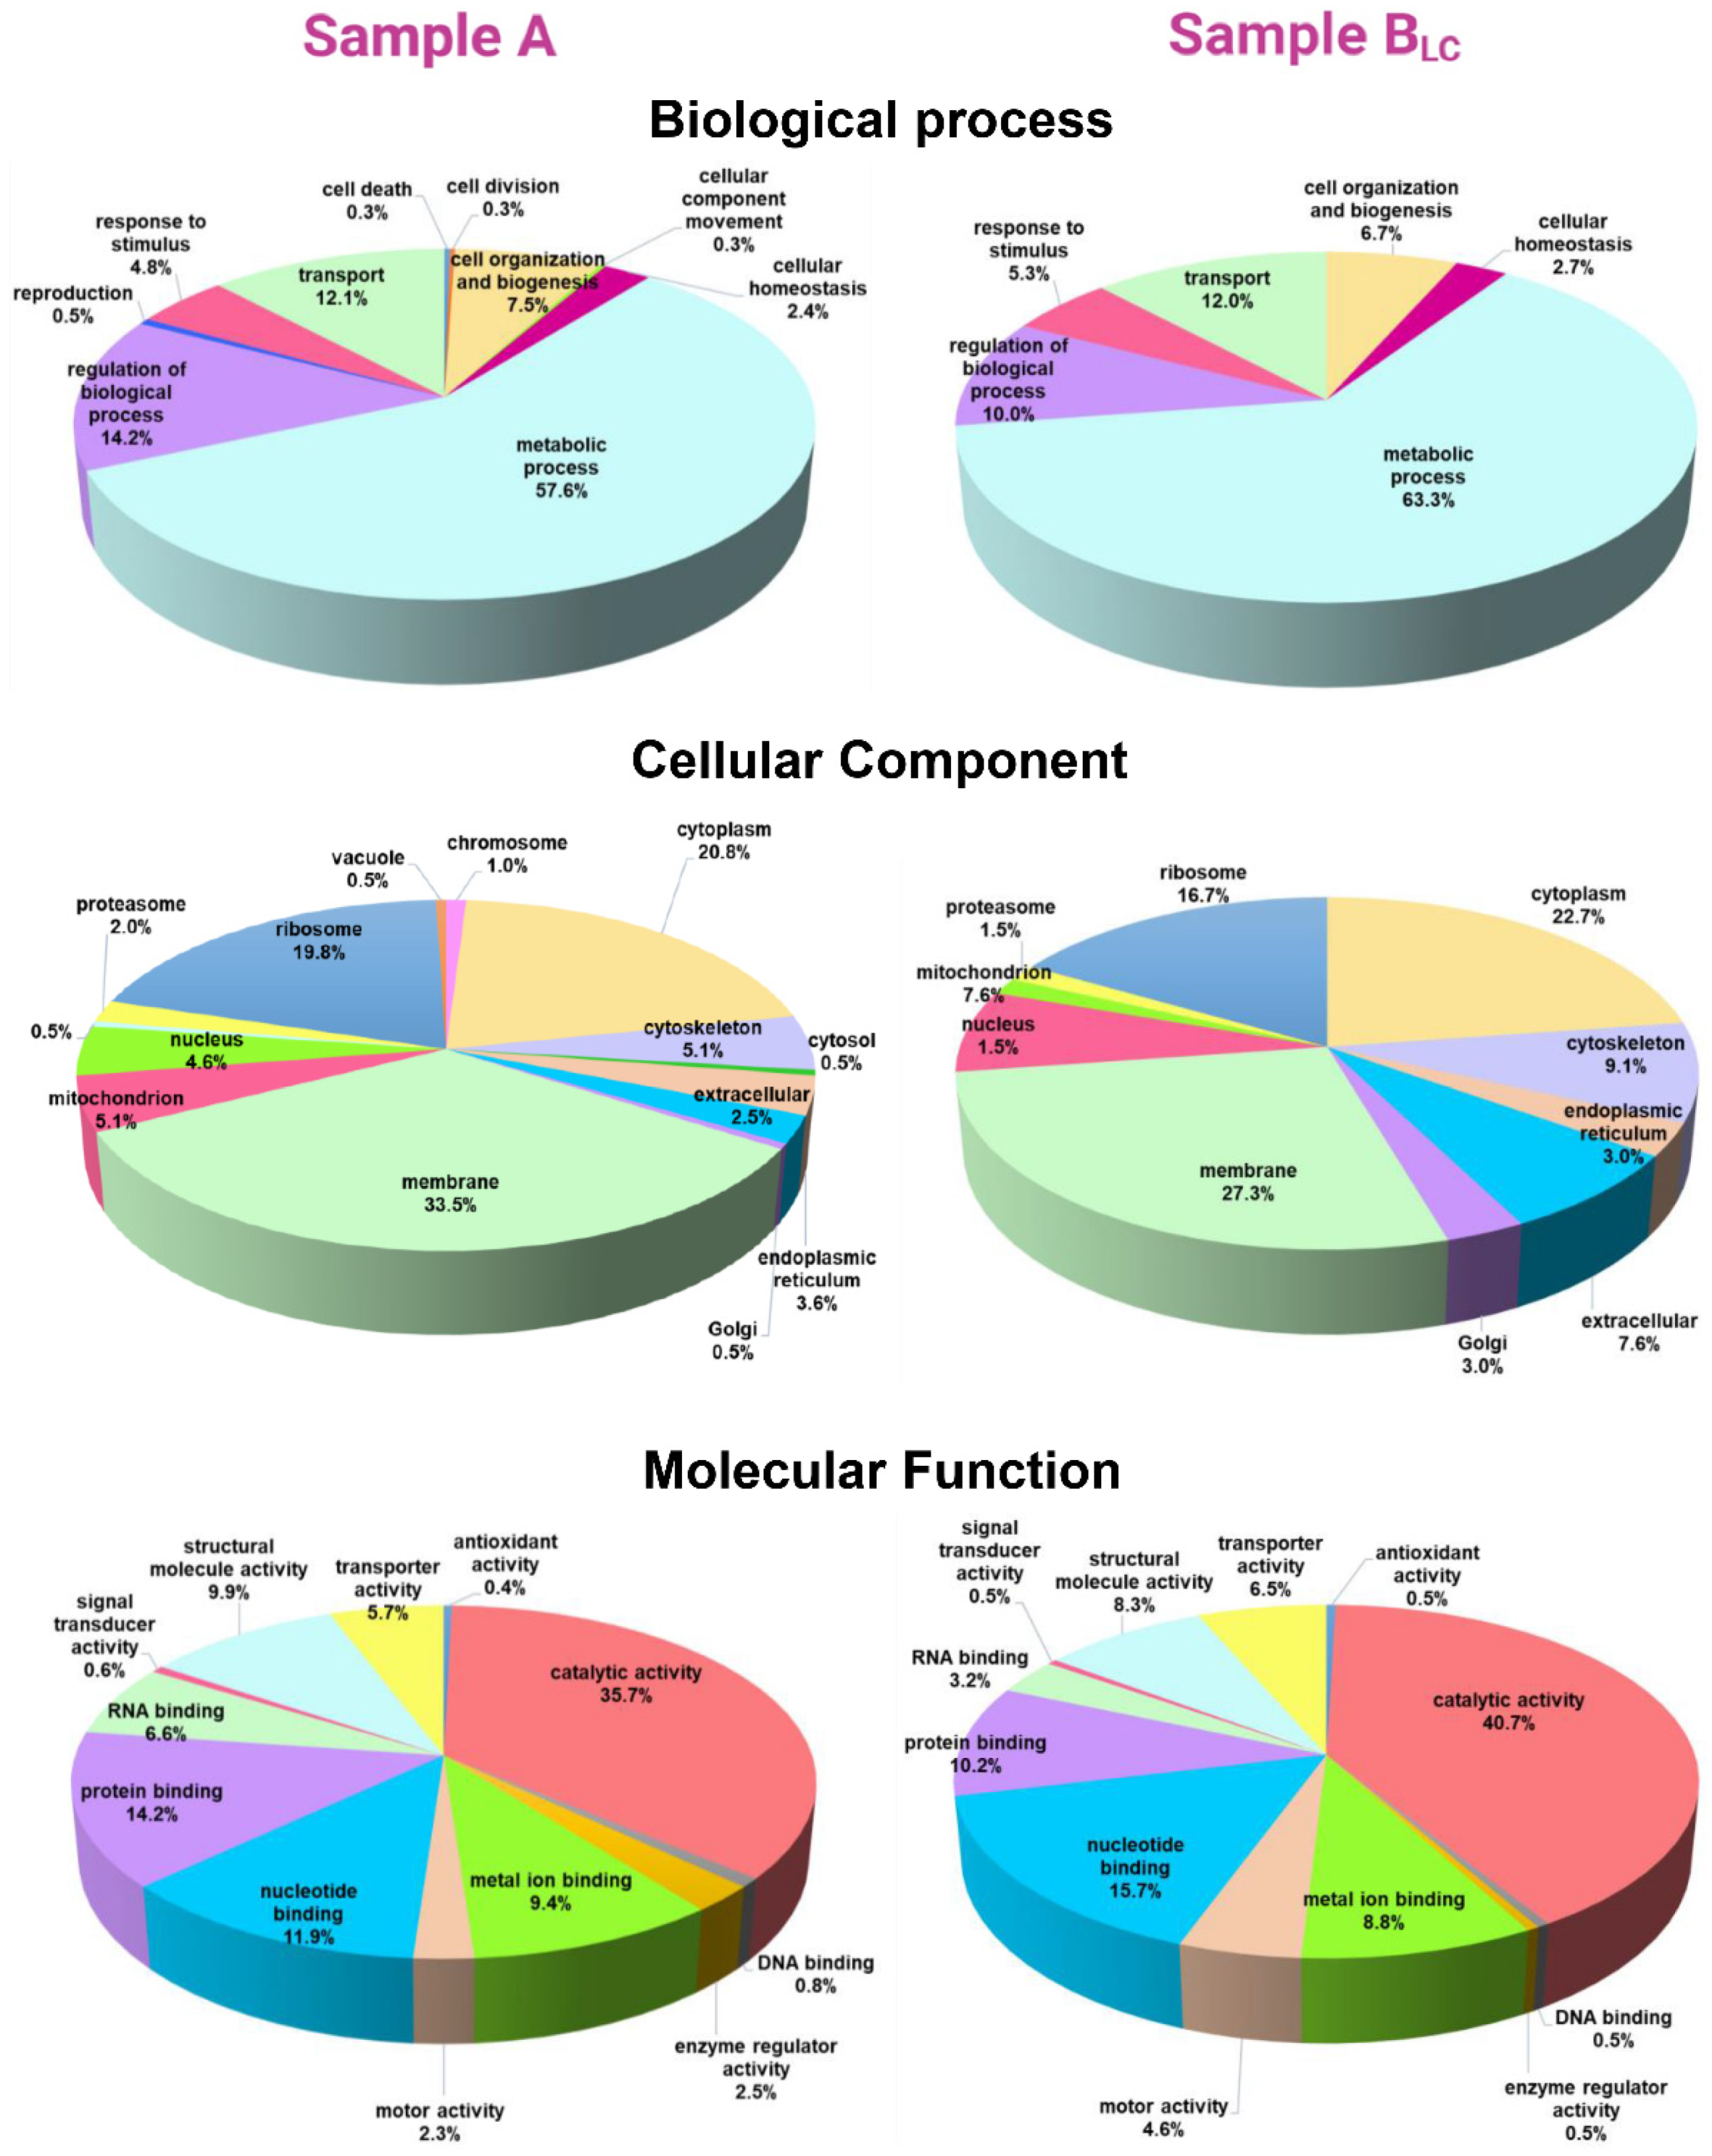
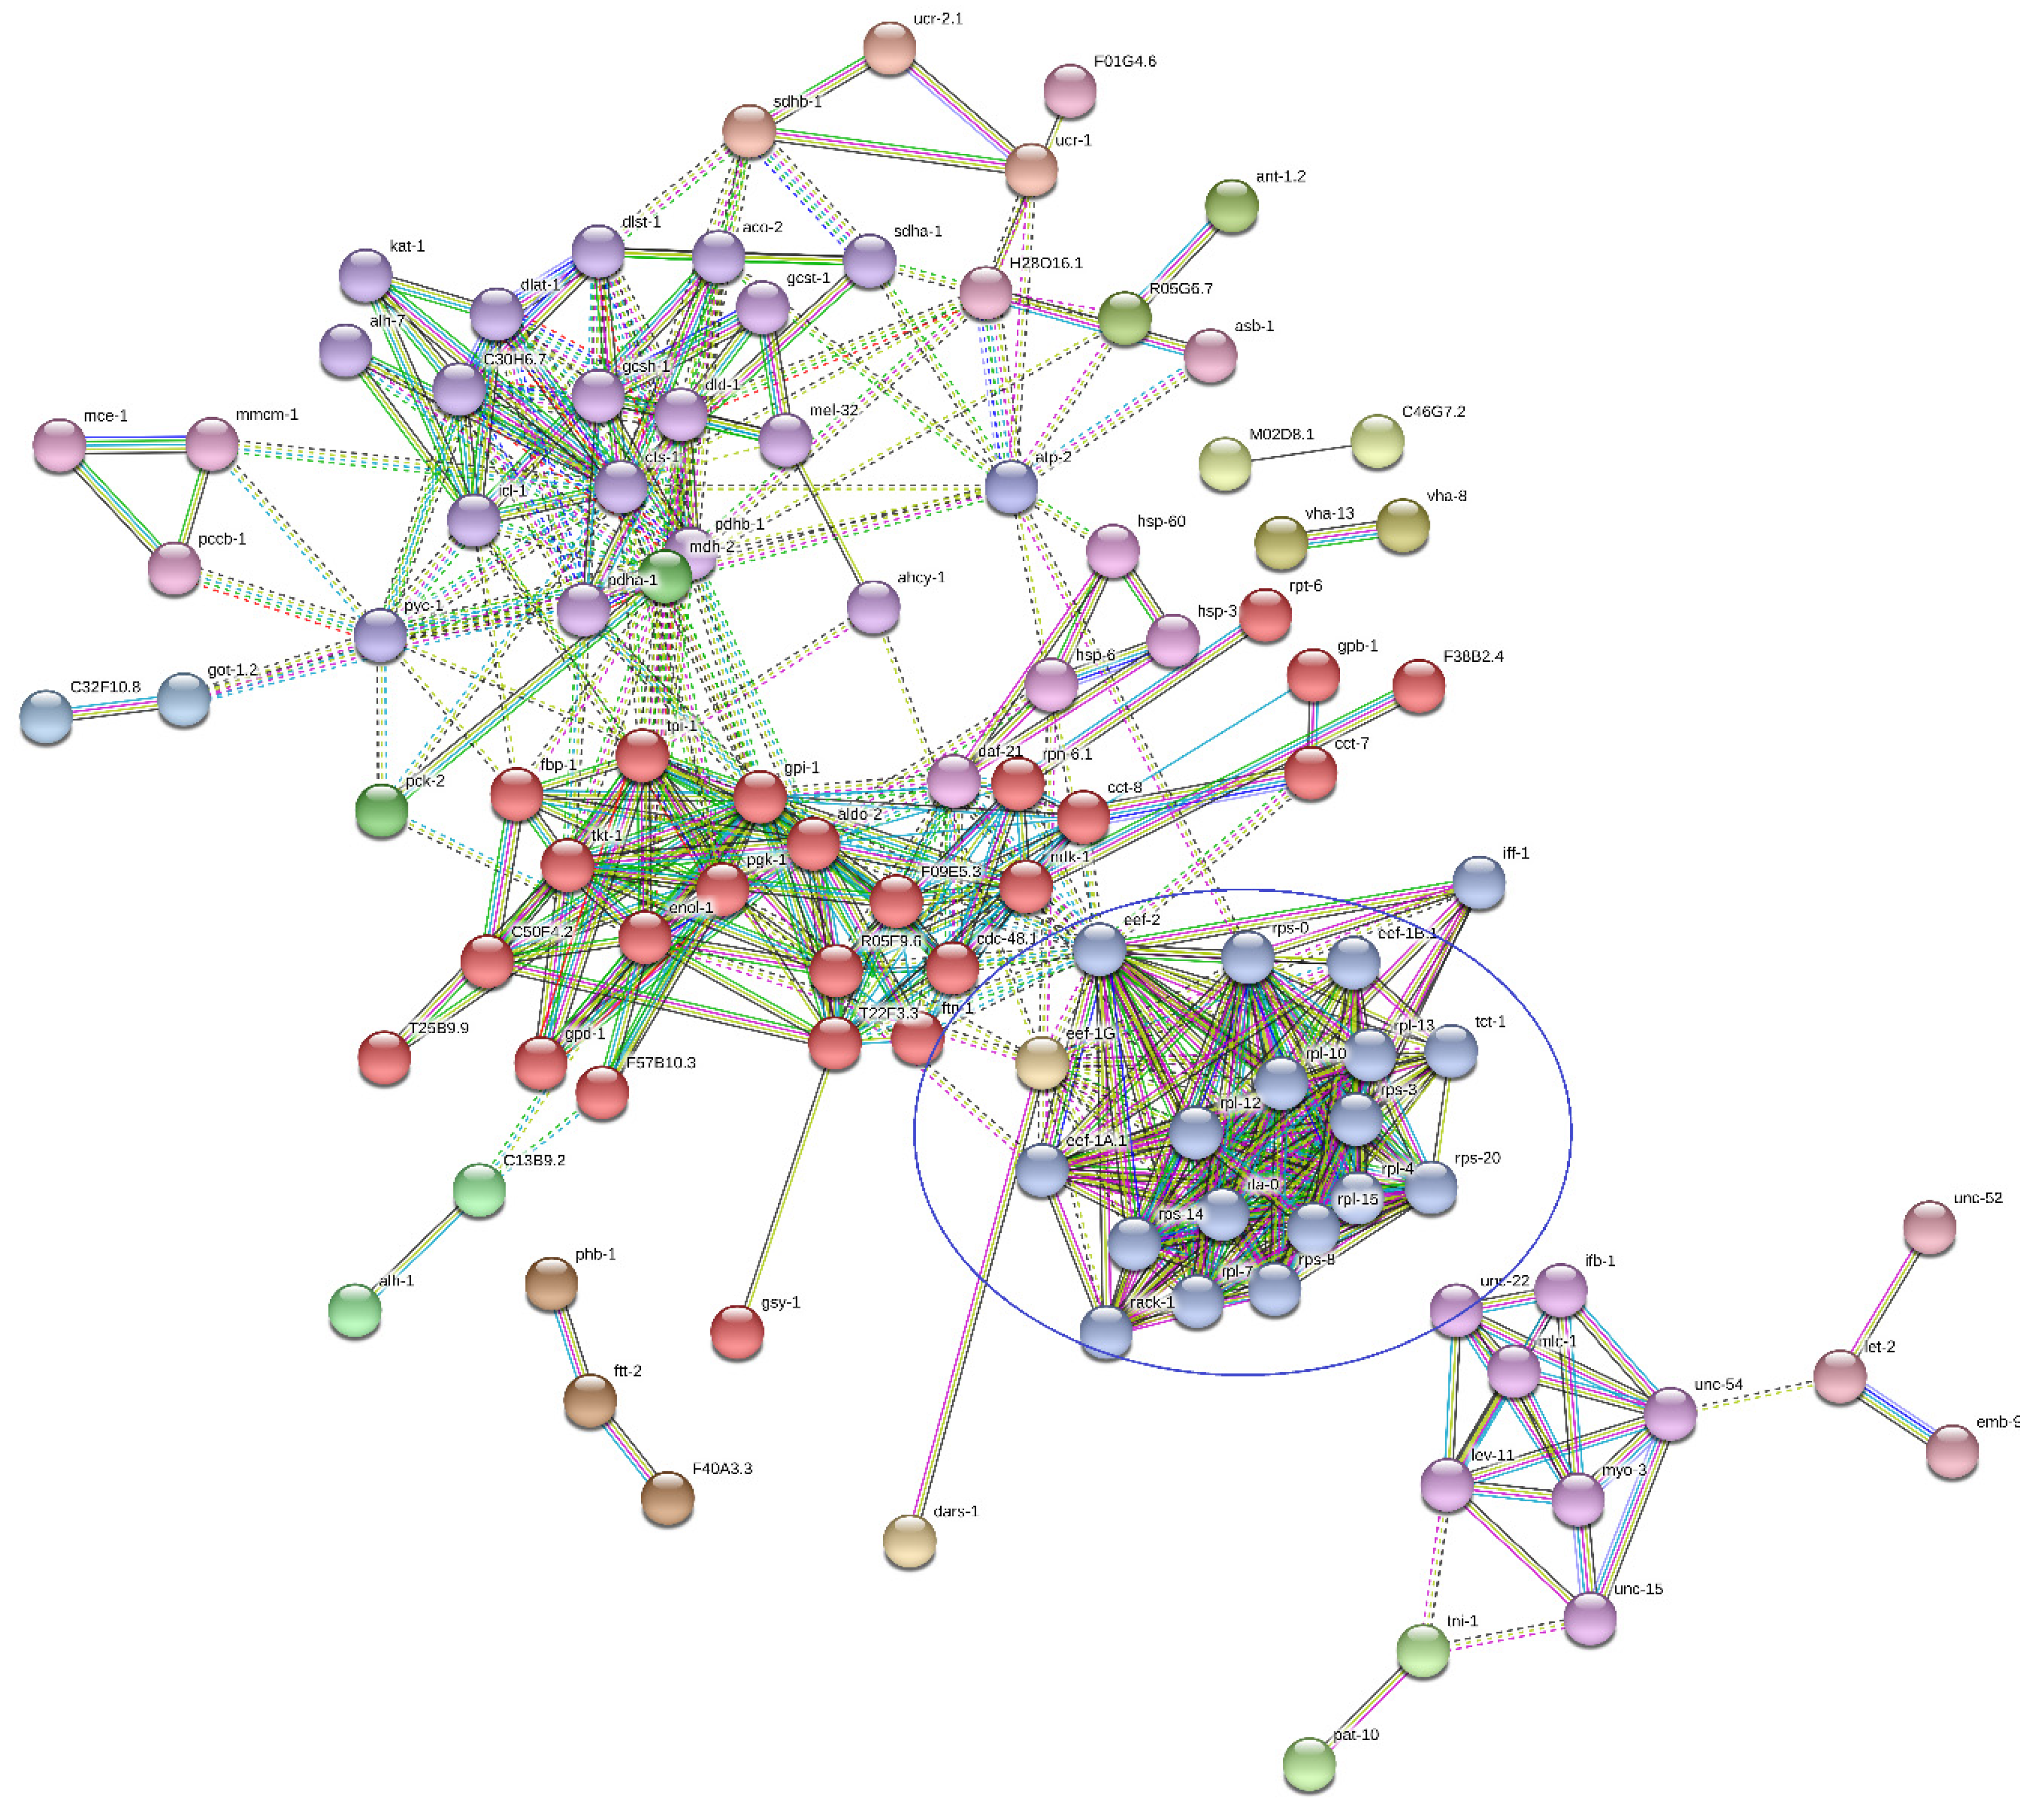
Functional Analysis
4. Discussion
5. Conclusions
Supplementary Materials
Author Contributions
Funding
Acknowledgments
Conflicts of Interest
References
- Nieuwenhuizen, N.E.; Lopata, A.L. Allergic Reactions to Anisakis Found in Fish. Curr. Allergy Asthma Rep. 2014, 14, 455. [Google Scholar] [CrossRef] [PubMed]
- Nieuwenhuizen, N.E. Anisakis—Immunology of a foodborne parasitosis. Parasite Immunol. 2016, 38, 548–557. [Google Scholar] [CrossRef]
- Hochberg, N.S.; Hamer, D.H. Anisakidosis: Perils of the Deep. Clin. Infect. Dis. 2010, 51, 806–812. [Google Scholar] [CrossRef] [PubMed]
- Putignani, L.; Del Chierico, F.; Onori, M.; Mancinelli, L.; Argentieri, M.; Bernaschi, P.; Coltella, L.; Lucignano, B.; Pansani, L.; Ranno, S.; et al. MALDI-TOF mass spectrometry proteomic phenotyping of clinically relevant fungi. Mol. Biosyst. 2011, 7, 620–629. [Google Scholar] [CrossRef] [PubMed]
- Del Chierico, F.; Masotti, A.; Onori, M.; Fiscarelli, E.; Mancinelli, L.; Ricciotti, G.; Alghisi, F.; Dimiziani, L.; Manetti, C.; Urbani, A.; et al. MALDI-TOF MS proteomic phenotyping of filamentous and other fungi from clinical origin. J. Proteom. 2012, 75, 3314–3330. [Google Scholar] [CrossRef] [PubMed]
- Del Chierico, F.; Petrucca, A.; Vernocchi, P.; Bracaglia, G.; Fiscarelli, E.; Bernaschi, P.; Muraca, M.; Urbani, A.; Putignani, L. Proteomics boosts translational and clinical microbiology. J. Proteom. 2014, 97, 69–87. [Google Scholar] [CrossRef] [PubMed]
- Greco, V.; Piras, C.; Pieroni, L.; Ronci, M.; Putignani, L.; Roncada, P.; Urbani, A. Applications of MALDI-TOF mass spectrometry in clinical proteomics. Expert Rev. Proteom. 2018, 15, 683–696. [Google Scholar] [CrossRef]
- Murugaiyan, J.; Roesler, U. MALDI-TOF MS Profiling-Advances in Species Identification of Pests, Parasites, and Vectors. Front. Cell. Infect. Microbiol. 2017, 7, 184. [Google Scholar] [CrossRef]
- Feucherolles, M.; Poppert, S.; Utzinger, J.; Becker, S.L. MALDI-TOF mass spectrometry as a diagnostic tool in human and veterinary helminthology: A systematic review. Parasites Vectors 2019, 12, 245. [Google Scholar] [CrossRef]
- Nagorny, S.A.; Aleshukina, A.V.; Aleshukina, I.S.; Ermakova, L.A.; Pshenichnaya, N.Y. The application of proteomic methods (MALDI-toff MS) for studying protein profiles of some nematodes (dirofilaria and ascaris) for differentiating species. Int. J. Infect. Dis. 2019, 82, 61–65. [Google Scholar] [CrossRef]
- Distler, U.; Kuharev, J.; Navarro, P.; Tenzer, S. Label-free quantification in ion mobility-enhanced data-independent acquisition proteomics. Nat. Protoc. 2016, 11, 795–812. [Google Scholar] [CrossRef] [PubMed]
- g:Profiler. Available online: https://biit.cs.ut.ee/gprofiler/orth (accessed on 21 May 2020).
- Reimand, J.; Arak, T.; Adler, P.; Kolberg, L.; Reisberg, S.; Peterson, H.; Vilo, J. g:Profiler—A web server for functional interpretation of gene lists (2016 update). Nucleic Acids Res. 2016, 44, W83–W89. [Google Scholar] [CrossRef]
- STRING. Available online: https://string-db.org/ (accessed on 20 May 2020).
- Szklarczyk, D.; Gable, A.L.; Lyon, D.; Junge, A.; Wyder, S.; Huerta-Cepas, J.; Simonovic, M.; Doncheva, N.T.; Morris, J.H.; Bork, P.; et al. STRING v11: Protein–protein association networks with increased coverage, supporting functional discovery in genome-wide experimental datasets. Nucleic Acids Res. 2019, 47, D607–D613. [Google Scholar] [CrossRef] [PubMed]
- Stryiński, R.; Mateos, J.; Pascual, S.; González, Á.F.; Gallardo, J.M.; Łopieńska-Biernat, E.; Medina, I.; Carrera, M. Proteome profiling of L3 and L4 Anisakis simplex development stages by TMT-based quantitative proteomics. J. Proteom. 2019, 201, 1–11. [Google Scholar] [CrossRef] [PubMed]
- Holmes, D.T.; Romney, M.G.; Angel, P.; DeMarco, M.L. Proteomic Applications in Pathology and Laboratory Medicine: Present State and Future Prospects. Clin. Biochem. 2020, S0009912020300813. [Google Scholar] [CrossRef] [PubMed]
- Jeddi, F.; Yapo-Kouadio, G.C.; Normand, A.-C.; Cassagne, C.; Marty, P.; Piarroux, R. Performance assessment of two lysis methods for direct identification of yeasts from clinical blood cultures using MALDI-TOF mass spectrometry. Med. Myco. 2017, 55, 185–192. [Google Scholar] [CrossRef][Green Version]
- Kayin, M.; Mert, B.; Aydemir, S.; Özenci, V. Comparison of rapid BACpro® II, Sepsityper® kit and in-house preparation methods for direct identification of bacteria from blood cultures by MALDI-TOF MS with and without Sepsityper® module analysis. Eur. J. Clin. Microbiol. Infect. Dis. 2019, 38, 2133–2143. [Google Scholar] [CrossRef] [PubMed]
- Luethy, P.M.; Johnson, J.K. The Use of Matrix-Assisted Laser Desorption/Ionization Time-of-Flight Mass Spectrometry (MALDI-TOF MS) for the Identification of Pathogens Causing Sepsis. J. Appl. Lab. Med. 2019, 3, 675–685. [Google Scholar] [CrossRef] [PubMed]
- Ryzhov, V.; Fenselau, C. Characterization of the protein subset desorbed by MALDI from whole bacterial cells. Anal. Chem. 2001, 73, 746–750. [Google Scholar] [CrossRef] [PubMed]
- Cavallero, S.; Lombardo, F.; Su, X.; Salvemini, M.; Cantacessi, C.; D’Amelio, S. Tissue-specific transcriptomes of Anisakis simplex (sensu stricto) and Anisakis pegreffii reveal potential molecular mechanisms involved in pathogenicity. Parasites Vectors 2018, 11, 31. [Google Scholar] [CrossRef]
- Mari, A.; Rasi, C.; Palazzo, P.; Scala, E. Allergen databases: Current status and perspectives. Curr. Allergy Asthma Rep. 2009, 9, 376–383. [Google Scholar] [CrossRef] [PubMed]
- Aibinu, I.E.; Smooker, P.M.; Lopata, A.L. Anisakis Nematodes in Fish and Shellfish- from infection to allergies. Int. J. Parasitol. Parasites Wildl. 2019, 9, 384–393. [Google Scholar] [CrossRef] [PubMed]
- Audicana, M.T.; Kennedy, M.W. Anisakis simplex: From Obscure Infectious Worm to Inducer of Immune Hypersensitivity. CMR 2008, 21, 360–379. [Google Scholar] [CrossRef] [PubMed]
- Kobayashi, Y.; Ishizaki, S.; Shimakura, K.; Nagashima, Y.; Shiomi, K. Molecular cloning and expression of two new allergens from Anisakis simplex. Parasitol. Res. 2007, 100, 1233–1241. [Google Scholar] [CrossRef] [PubMed]
- García-Mayoral, M.F.; Treviño, M.A.; Pérez-Piñar, T.; Caballero, M.L.; Knaute, T.; Umpierrez, A.; Bruix, M.; Rodríguez-Pérez, R. Relationships between IgE/IgG4 Epitopes, Structure and Function in Anisakis simplex Ani s 5, a Member of the SXP/RAL-2 Protein Family. PLoS Negl. Trop. Dis. 2014, 8, e2735. [Google Scholar] [CrossRef] [PubMed]
- Mehrdana, F.; Buchmann, K. Excretory/secretory products of anisakid nematodes: Biological and pathological roles. Acta Vet. Scand. 2017, 59, 42. [Google Scholar] [CrossRef]
- Łopieńska-Biernat, E.; Stryiński, R.; Dmitryjuk, M.; Wasilewska, B. Infective larvae of Anisakis simplex (Nematoda) accumulate trehalose and glycogen in response to starvation and temperature stress. Biol. Open 2019, 8. [Google Scholar] [CrossRef]
- Kim, J.-H.; Kim, J.-O.; Jeon, C.-H.; Nam, U.-H.; Subramaniyam, S.; Yoo, S.-I.; Park, J.-H. Comparative transcriptome analyses of the third and fourth stage larvae of Anisakis simplex (Nematoda: Anisakidae). Mol. Biochem. Parasitol. 2018, 226, 24–33. [Google Scholar] [CrossRef]


| # Peak | m/z | DAve | Ave | CV (%) | ||||||||
|---|---|---|---|---|---|---|---|---|---|---|---|---|
| 1 | 2 | 3 | 4 | 5 | 1 | 2 | 3 | 4 | 5 | |||
| 1 | 2597.26 | 0.97 | 2.63 | 2.57 | 2.55 | 3.52 | 3.12 | 19.32 | 16.09 | 15.34 | 15.86 | 18.74 |
| 2 | 2654.85 | 3.6 | 4.41 | 7.84 | 7.78 | 4.24 | 5.08 | 17.66 | 15.12 | 12.49 | 10.57 | 14.7 |
| 3 | 2704.25 | 1.26 | 2.91 | 3.7 | 3.51 | 4.15 | 2.89 | 10.86 | 11.12 | 15.85 | 16.27 | 14.07 |
| 4 | 2724.12 | 3.66 | 4.6 | 7.84 | 7.4 | 4.18 | 4.47 | 18.86 | 12.1 | 12.99 | 13.48 | 17.98 |
| 5 | 2733.01 | 0.98 | 3.52 | 4.5 | 4.26 | 3.68 | 3.56 | 16.22 | 14.21 | 9.88 | 17.98 | 13.54 |
| 6 | 2741.79 | 1.25 | 3.63 | 4.47 | 4.47 | 3.94 | 3.22 | 15.67 | 13.38 | 11.7 | 13.73 | 15.86 |
| 7 | 2758.46 | 1.13 | 4.21 | 3.22 | 3.98 | 4.35 | 3.35 | 14.8 | 12.06 | 8.77 | 11.37 | 18.26 |
| 8 | 2781.06 | 1.35 | 4.0 | 4.5 | 5.11 | 4.0 | 3.76 | 9.79 | 11.77 | 9.01 | 11.98 | 19.07 |
| 9 | 2807.87 | 0.82 | 3.39 | 3.71 | 3.61 | 3.75 | 2.92 | 16.69 | 12.95 | 11.4 | 17.88 | 16.87 |
| 10 | 2827.16 | 0.6 | 3.25 | 3.72 | 3.55 | 3.29 | 3.12 | 14.97 | 14.59 | 14.48 | 17.82 | 19.86 |
| 11 | 2834.32 | 0.71 | 3.85 | 4.56 | 3.99 | 4.15 | 4.13 | 10.02 | 14.2 | 14.82 | 12.6 | 16.51 |
| 12 | 2840.23 | 1.8 | 3.91 | 2.82 | 3.98 | 4.54 | 4.63 | 14.68 | 7.22 | 11.06 | 10.73 | 19.48 |
| 13 | 4969.15 | 1.4 | 4.23 | 4.33 | 4.24 | 3.73 | 2.92 | 12.47 | 14.59 | 12.16 | 10.67 | 12.37 |
| 14 | 5335.65 | 3.25 | 2.98 | 4.36 | 5.38 | 2.81 | 6.05 | 14.79 | 12.28 | 12 | 11.62 | 15.81 |
| 15 | 5370.57 | 1.75 | 2.73 | 3.57 | 4.47 | 3.14 | 3.91 | 16.47 | 16.83 | 16.68 | 14.81 | 12 |
| 16 | 5656.33 | 7.86 | 8.48 | 13.73 | 12.95 | 5.87 | 5.9 | 10.17 | 11.46 | 9.92 | 14.32 | 19.42 |
| 17 | 5694.2 | 1.87 | 5.67 | 5.31 | 5.46 | 7.19 | 7.08 | 7.24 | 7.8 | 10.33 | 18.31 | 12.79 |
| 18 | 5712.76 | 6.26 | 5.97 | 11.04 | 9.91 | 4.78 | 5.74 | 8.99 | 9.07 | 9.14 | 13.13 | 13.56 |
| 19 | 7166.45 | 5.19 | 7.98 | 2.79 | 3.43 | 2.98 | 5.14 | 14.63 | 14.19 | 14.1 | 14.43 | 15.45 |
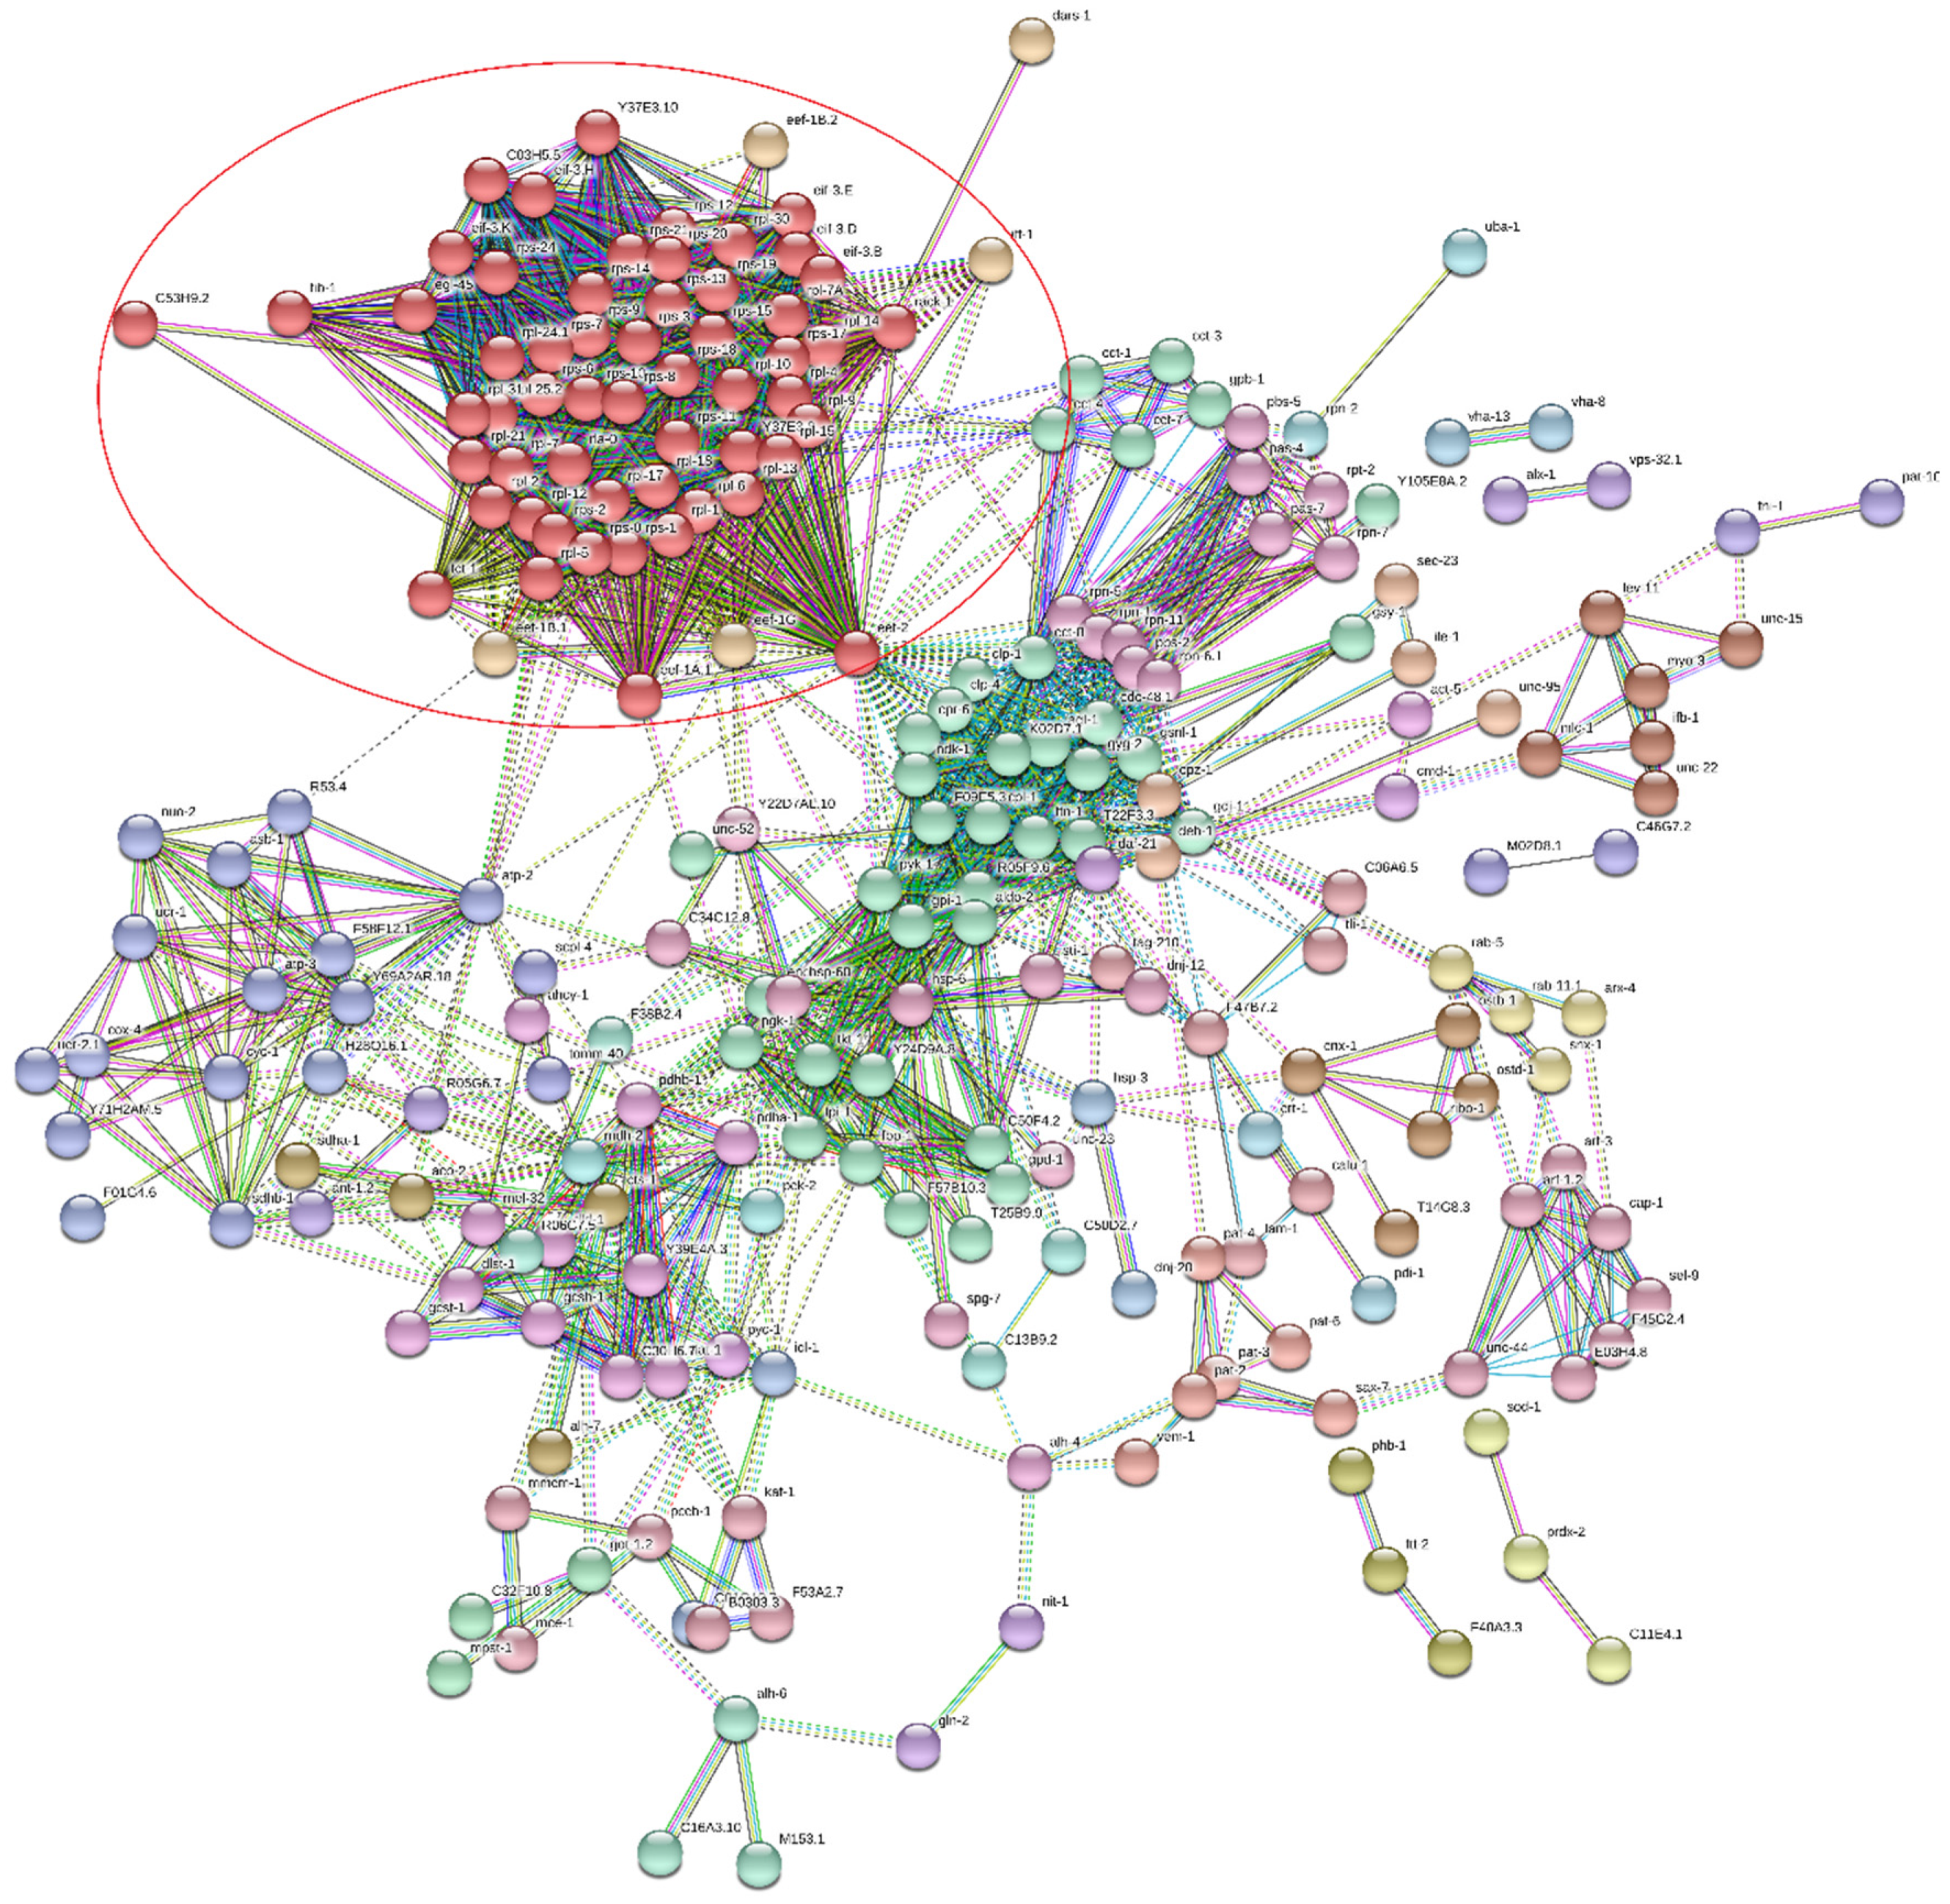
| Term Group | Circle Number (Figure 8) | Term Name | Term id | Adjusted p-Value | |
|---|---|---|---|---|---|
| Sample A | Sample BLC | ||||
| MF | 1 | structural constituent of ribosome | GO:0003735 | 4.07 × 10⁻²⁶ | 1.10 × 10−04 |
| 2 | structural molecule activity | GO:0005198 | 1.42 × 10⁻¹⁸ | 6.53 × 10−07 | |
| BP | 3 | translation | GO:0006412 | 5.30 × 10⁻²¹ | 1.10 × 10−04 |
| 4 | peptide biosynthetic process | GO:0043043 | 1.11 × 10⁻²⁰ | 1.38 × 10−04 | |
| 5 | amide biosynthetic process | GO:0043604 | 2.53 × 10⁻²⁰ | 2.32 × 10−05 | |
| 20 | generation of precursor metabolites and energy | GO:0006091 | 1.23 × 10⁻¹⁶ | 6.24 × 10⁻¹⁸ | |
| CC | 6 | cytoplasm | GO:0005737 | 2.19 × 10−82 | 6.58 × 10−40 |
| 7 | intracellular | GO:0005622 | 7.43 × 10−55 | 1.82 × 10⁻²² | |
| 8 | cytosolic ribosome | GO:0022626 | 7.86 × 10−38 | 4.04 × 10⁻¹⁰ | |
| 9 | cytosol | GO:0005829 | 3.35 × 10−36 | 1.37 × 10⁻²¹ | |
| 10 | ribosome | GO:0005840 | 4.02 × 10⁻²⁸ | 8.32 × 10−06 | |
| 11 | ribosomal subunit | GO:0044391 | 1.05 × 10⁻²⁷ | 5.91 × 10−07 | |
| 12 | intracellular organelle | GO:0043229 | 7.65 × 10⁻²³ | 1.76 × 10−05 | |
| 13 | organelle | GO:0043226 | 1.01 × 10⁻²¹ | 8.60 × 10−05 | |
| 14 | cytosolic large ribosomal subunit | GO:0022625 | 1.98 × 10⁻²⁰ | 9.33 × 10−05 | |
| 15 | protein-containing complex | GO:0032991 | 6.21 × 10⁻²⁰ | 5.83 × 10−08 | |
| 16 | mitochondrion | GO:0005739 | 3.42 × 10⁻¹⁹ | 6.19 × 10⁻¹³ | |
| 17 | ribonucleoprotein complex | GO:1990904 | 6.95 × 10⁻¹⁸ | 5.88 × 10−03 | |
| 18 | cytosolic small ribosomal subunit | GO:0022627 | 4.34 × 10⁻¹⁷ | 1.23 × 10−04 | |
| KEGG | 19 | carbon metabolism | KEGG:01200 | 9.55 × 10⁻²⁰ | 1.69 × 10⁻²⁷ |
© 2020 by the authors. Licensee MDPI, Basel, Switzerland. This article is an open access article distributed under the terms and conditions of the Creative Commons Attribution (CC BY) license (http://creativecommons.org/licenses/by/4.0/).
Share and Cite
Marzano, V.; Pane, S.; Foglietta, G.; Levi Mortera, S.; Vernocchi, P.; Onetti Muda, A.; Putignani, L. Mass Spectrometry Based-Proteomic Analysis of Anisakis spp.: A Preliminary Study towards a New Diagnostic Tool. Genes 2020, 11, 693. https://doi.org/10.3390/genes11060693
Marzano V, Pane S, Foglietta G, Levi Mortera S, Vernocchi P, Onetti Muda A, Putignani L. Mass Spectrometry Based-Proteomic Analysis of Anisakis spp.: A Preliminary Study towards a New Diagnostic Tool. Genes. 2020; 11(6):693. https://doi.org/10.3390/genes11060693
Chicago/Turabian StyleMarzano, Valeria, Stefania Pane, Gianluca Foglietta, Stefano Levi Mortera, Pamela Vernocchi, Andrea Onetti Muda, and Lorenza Putignani. 2020. "Mass Spectrometry Based-Proteomic Analysis of Anisakis spp.: A Preliminary Study towards a New Diagnostic Tool" Genes 11, no. 6: 693. https://doi.org/10.3390/genes11060693
APA StyleMarzano, V., Pane, S., Foglietta, G., Levi Mortera, S., Vernocchi, P., Onetti Muda, A., & Putignani, L. (2020). Mass Spectrometry Based-Proteomic Analysis of Anisakis spp.: A Preliminary Study towards a New Diagnostic Tool. Genes, 11(6), 693. https://doi.org/10.3390/genes11060693