The Metabolization Profile of the CYP2D6 Gene in Amerindian Populations: A Review


 ,
,
Abstract
:1. Introduction
1.1. Rationale
1.2. Objective
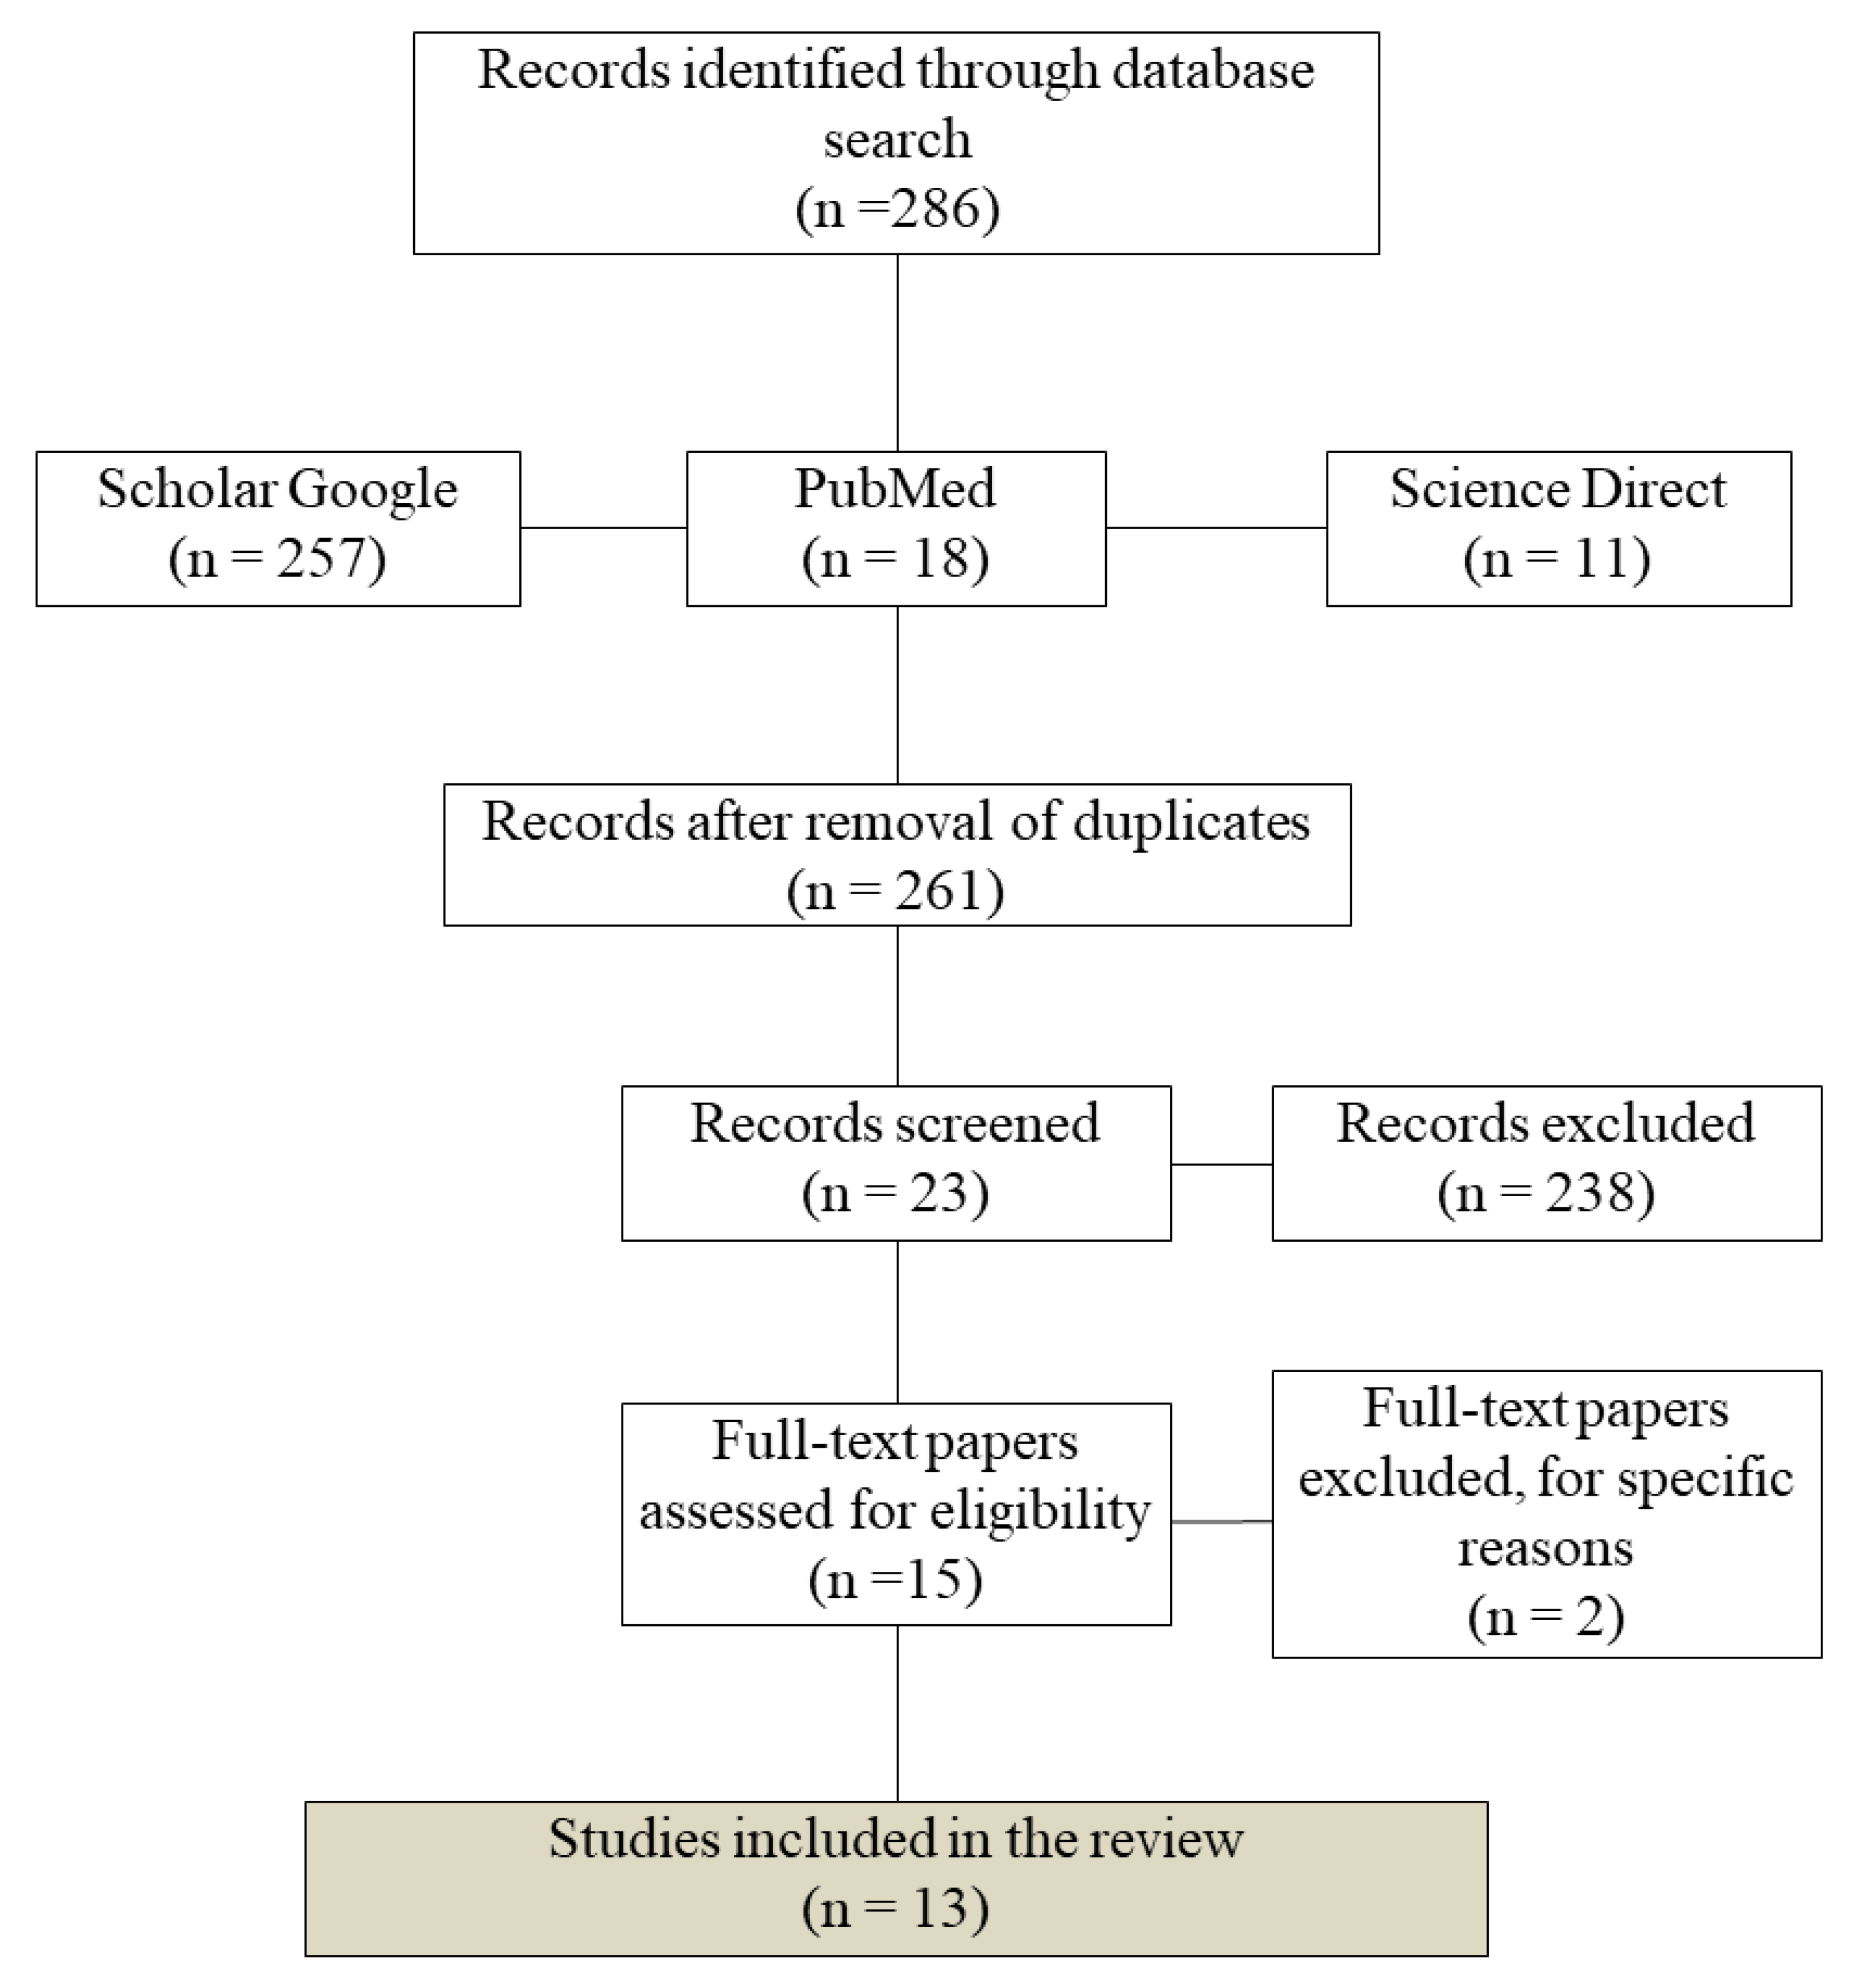
2. Methods
2.1. Study Design
2.2. Search Strategy
3. Results
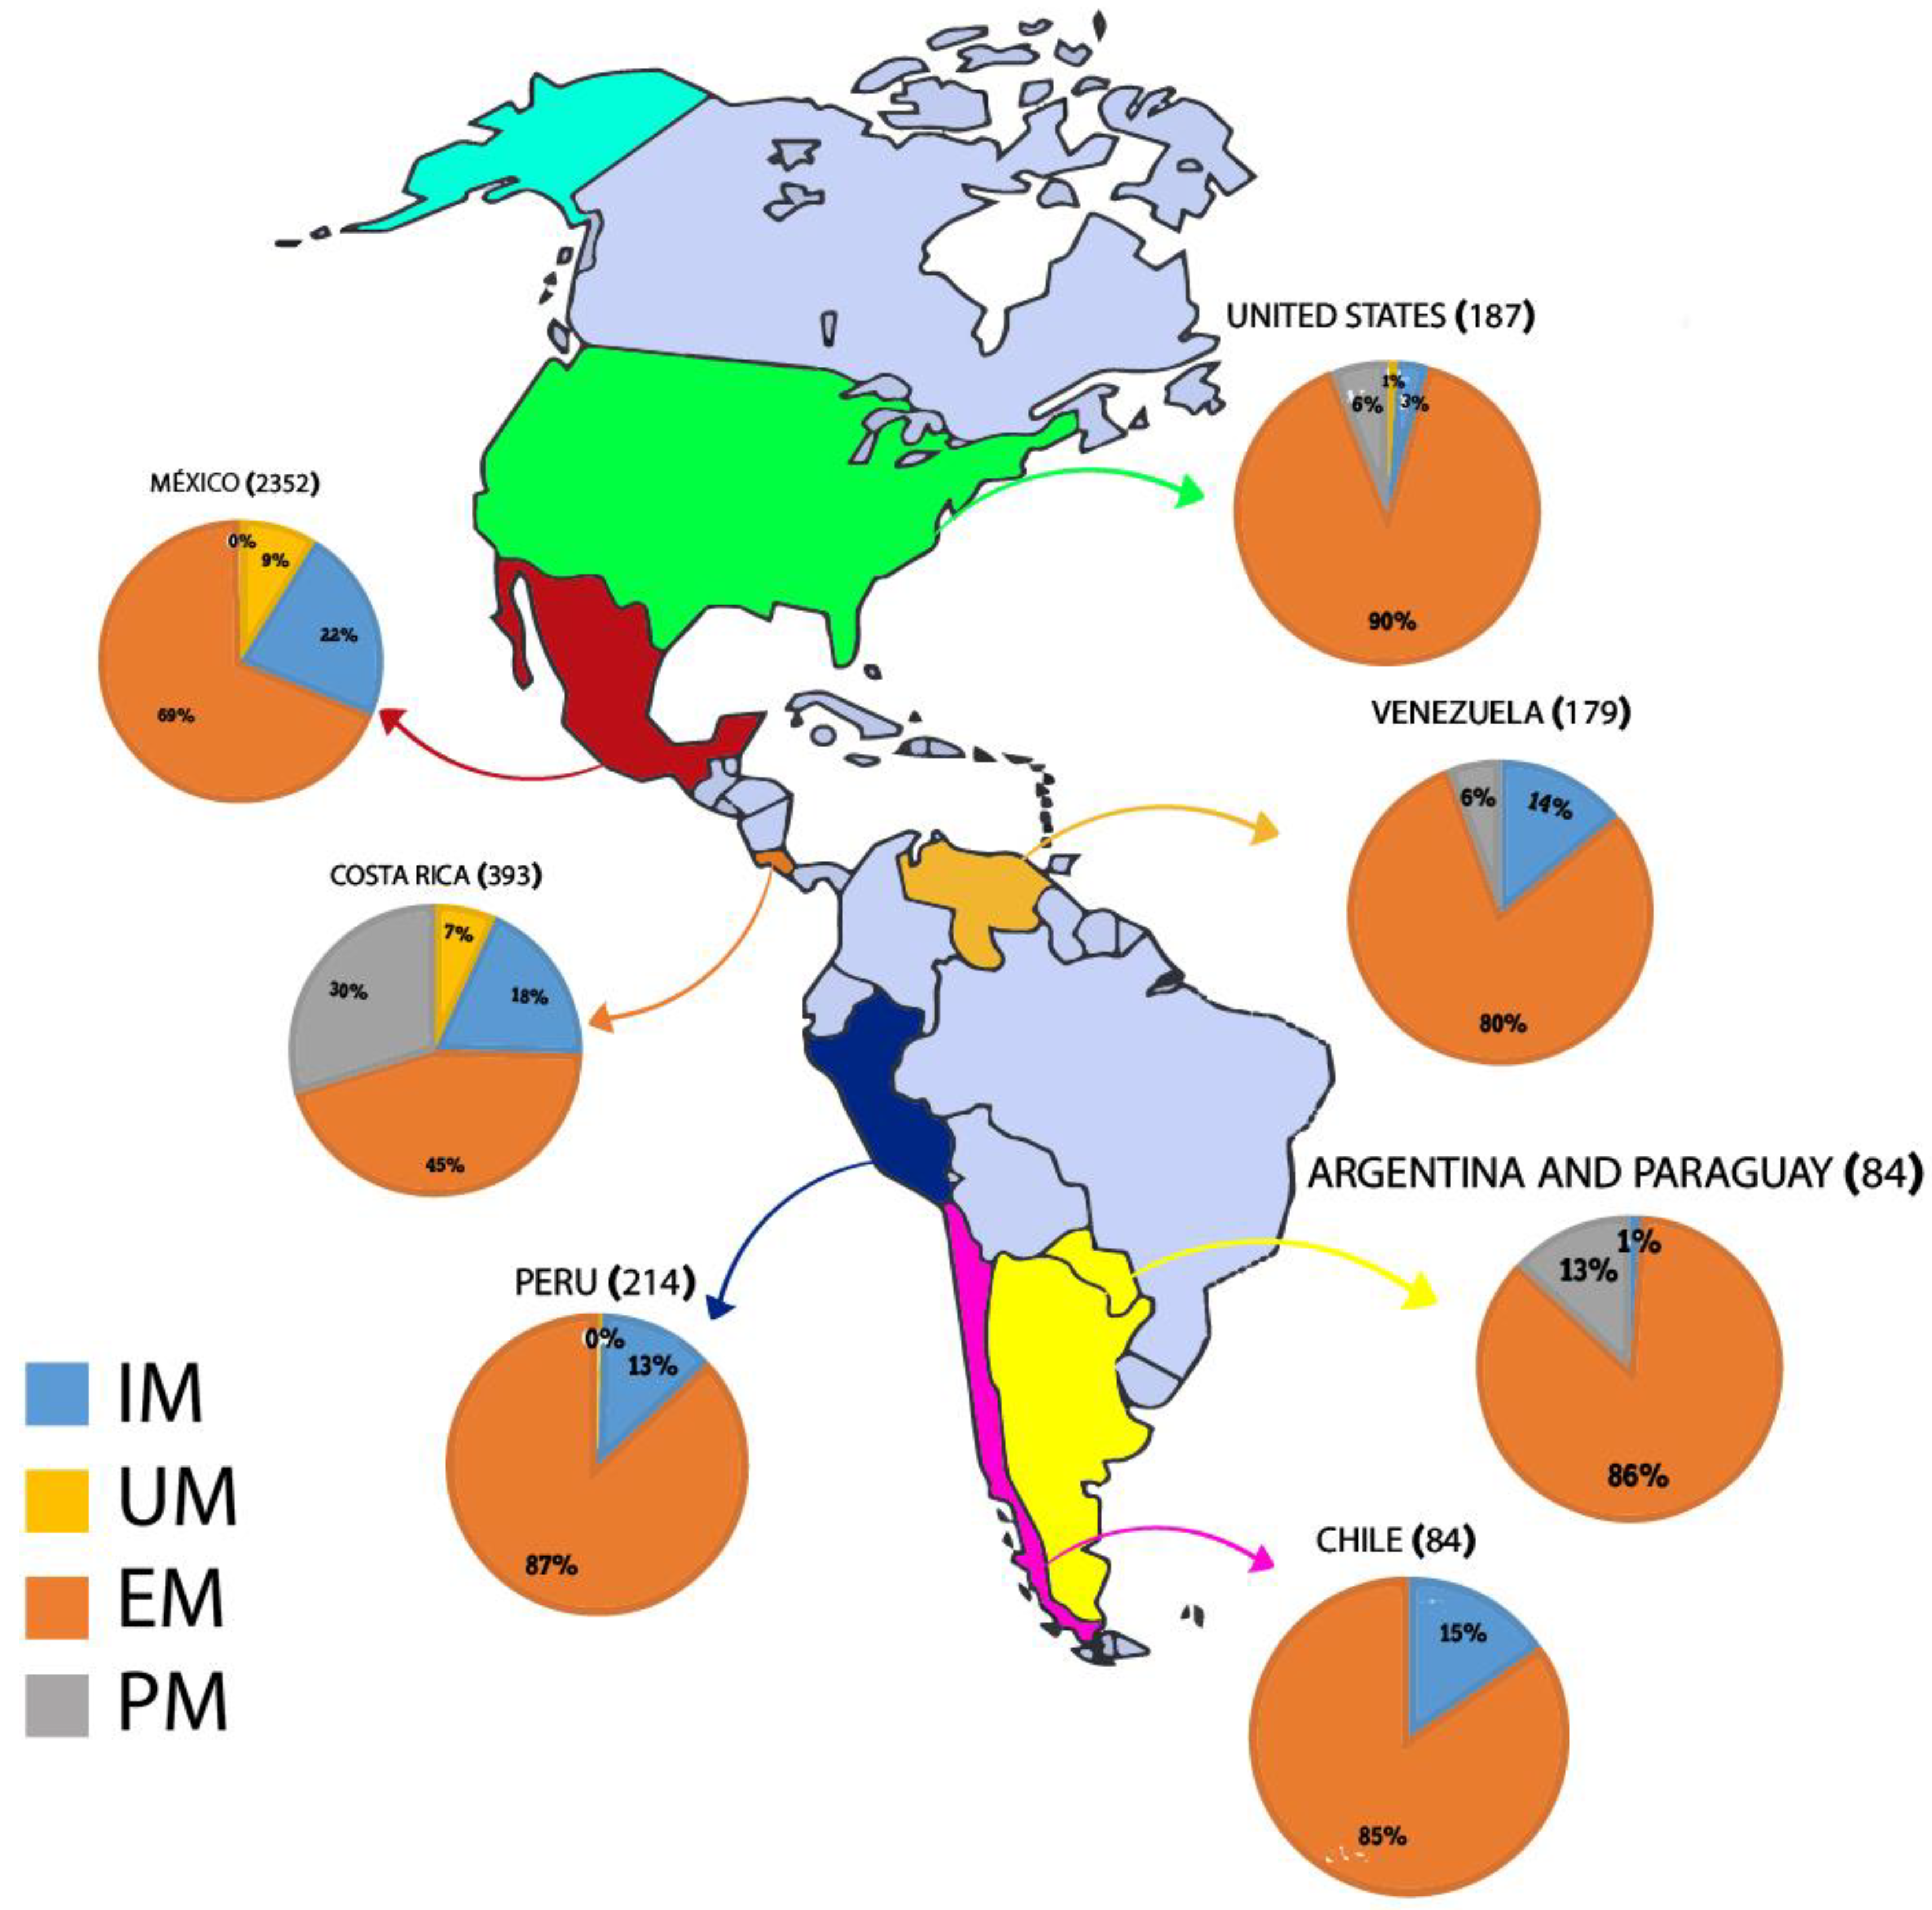
3.1. Synopsis of the Findings on the CYP2D6 Metabolization Profiles
3.1.1. Poor Metabolizers
3.1.2. Intermediate Metabolizers
3.1.3. Extensive Metabolizers
3.1.4. Ultrarapid Metabolizers
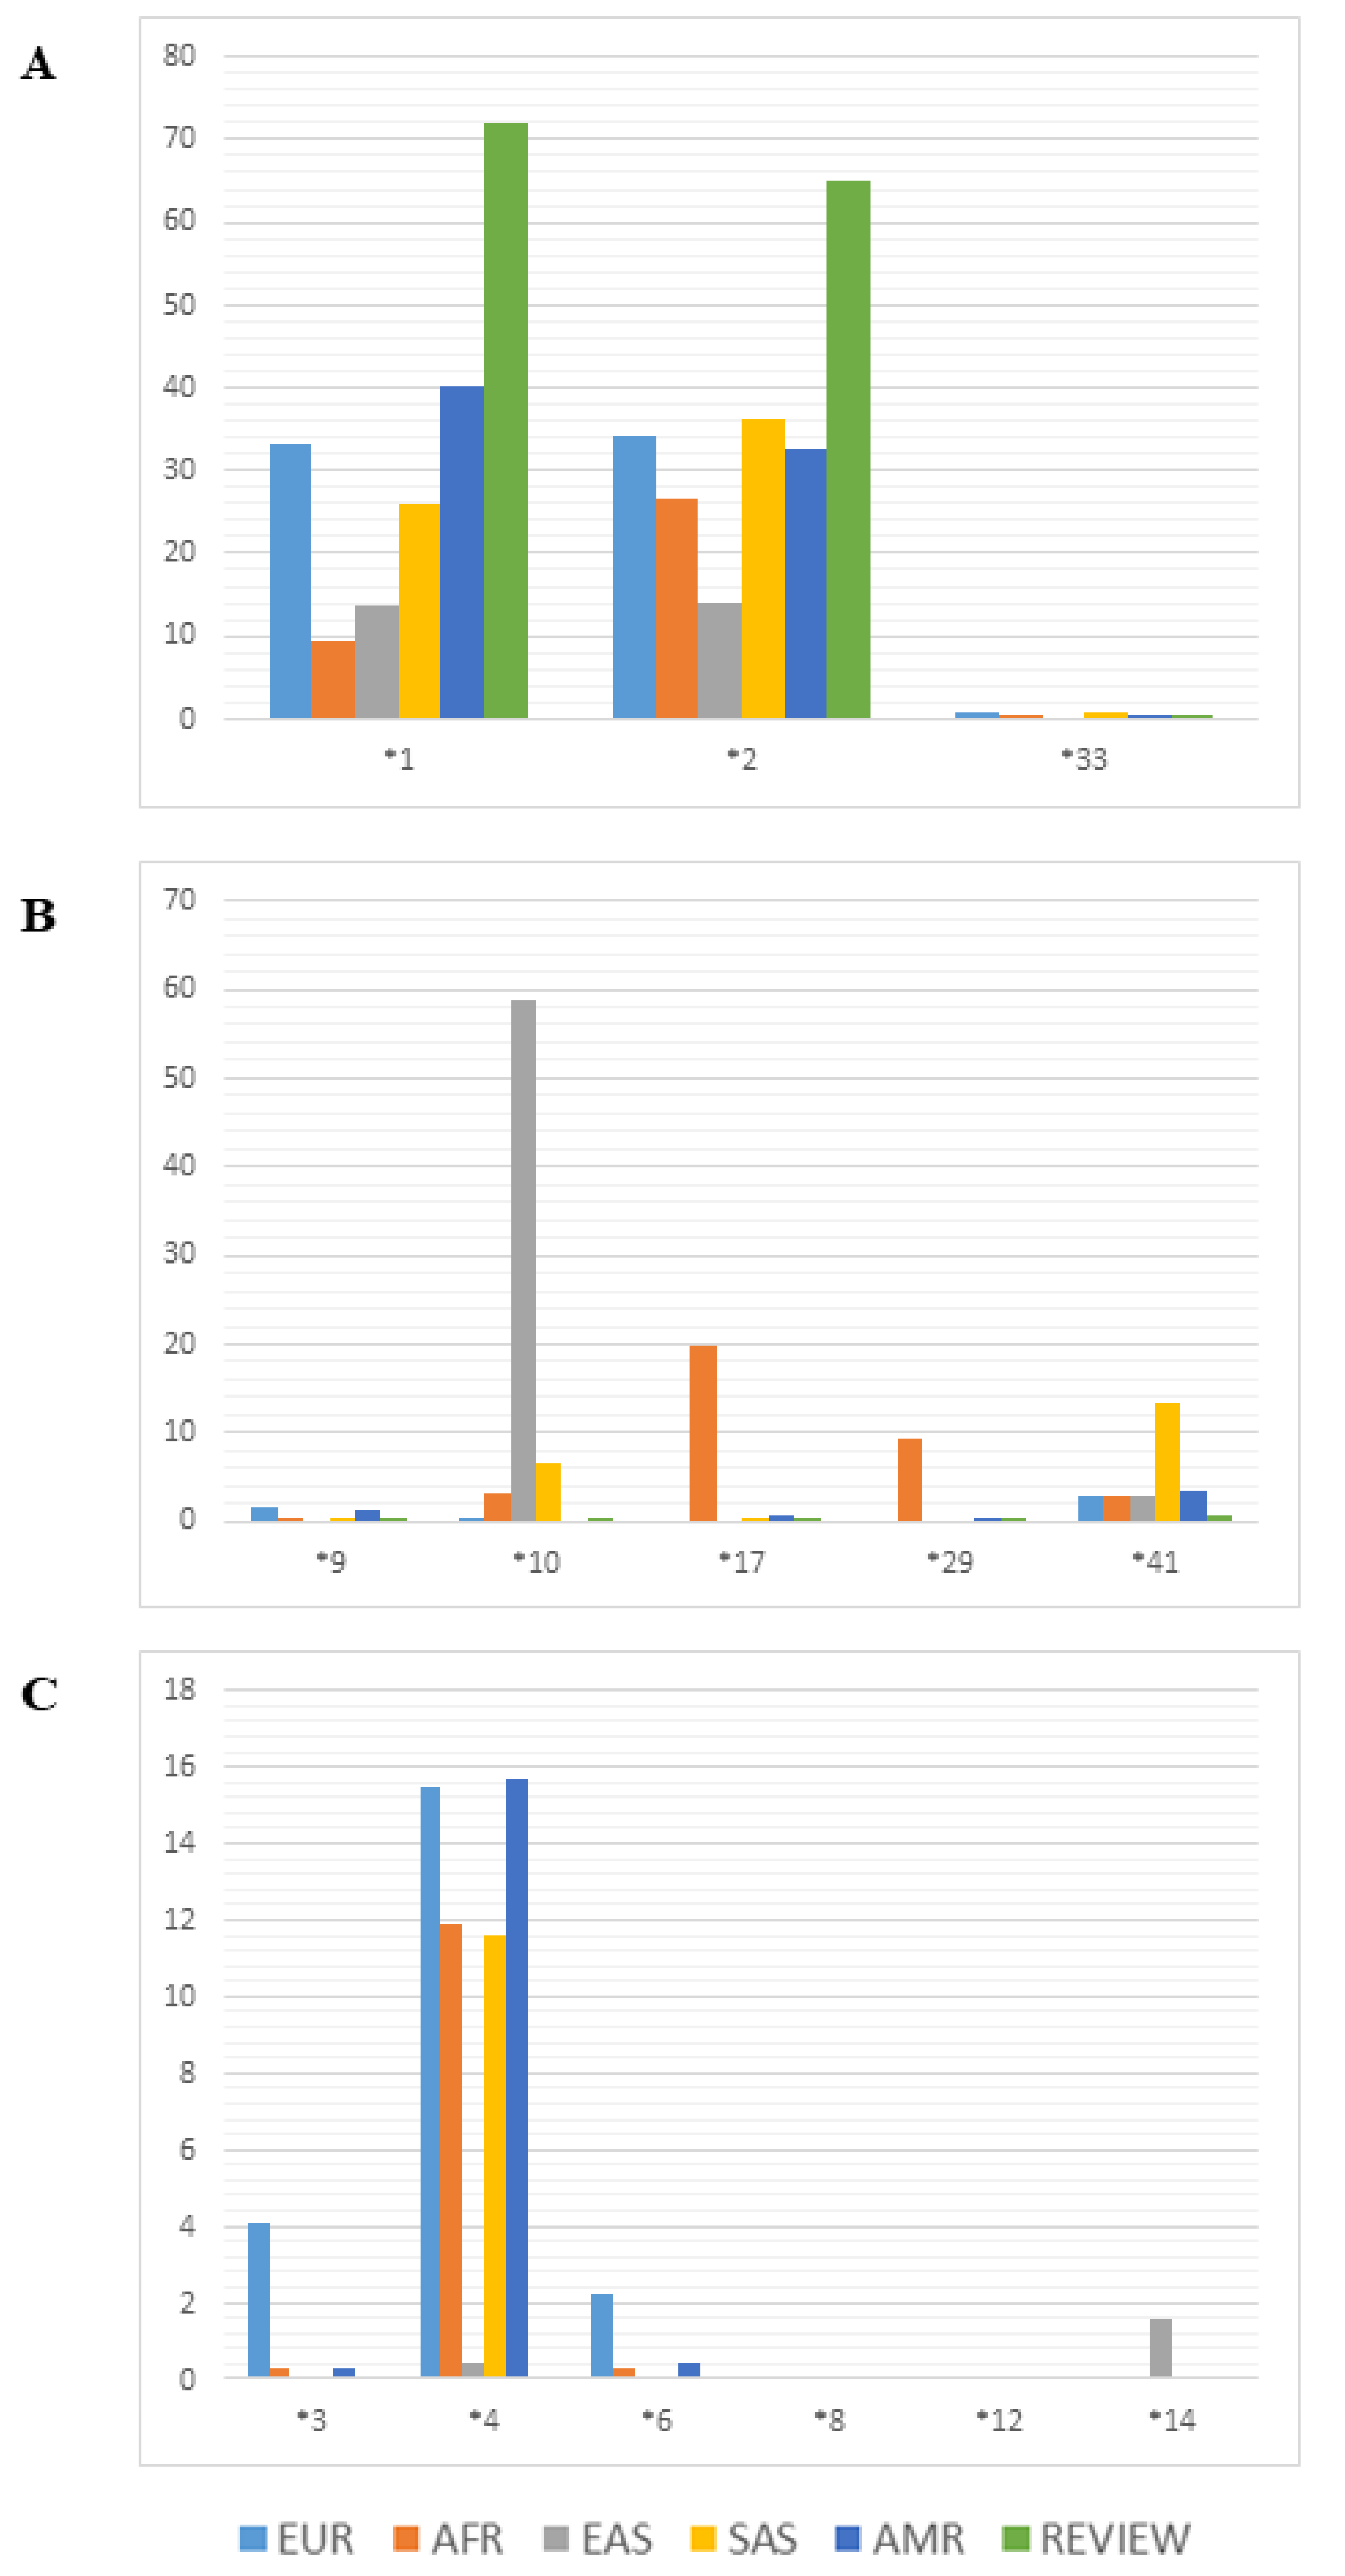
3.1.5. Allele Frequencies
4. Discussion
Supplementary Materials
Author Contributions
Funding
Acknowledgments
Conflicts of Interest
References
- Wendt, F.R.; Sajantila, A.; Moura-Neto, R.S.; Woerner, A.E.; Budowle, B. Full-gene haplotypes refine CYP2D6 metabolizer phenotype inferences. Int. J. Leg. Med. 2017, 132, 1007–1024. [Google Scholar] [CrossRef] [Green Version]
- Ingelman-Sundberg, M. Genetic polymorphisms of cytochrome P450 2D6 (CYP2D6): Clinical consequences, evolutionary aspects and functional diversity. Pharm. J. 2005, 5, 6–13. [Google Scholar] [CrossRef]
- Zanger, U.M.; Schwab, M. Cytochrome P450 enzymes in drug metabolism: Regulation of gene expression, enzyme activities, and impact of genetic variation. Pharmacol. Ther. 2013, 138, 103–141. [Google Scholar] [CrossRef]
- Kimura, S.; Umeno, M.; Skoda, R.C.; Meyer, U.A.; Gonzalez, F.J. The human debrisoquine 4-hydroxylase (CYP2D) locus: Sequence and identification of the polymorphic CYP2D6 gene, a related gene, and a pseudogene. Am. J. Hum. Genet. 1989, 45, 889–904. [Google Scholar]
- Henderson, L.; Claw, K.; Woodahl, E.L.; Robinson, R.F.; Boyer, B.; Burke, W.; Thummel, K. P450 Pharmacogenetics in Indigenous North American Populations. J. Pers. Med. 2018, 8, 9. [Google Scholar] [CrossRef] [Green Version]
- He, Z.-X.; Chen, X.-W.; Zhou, Z.-W.; Zhou, S.-F. Impact of physiological, pathological and environmental factors on the expression and activity of human cytochrome P450 2D6 and implications in precision medicine. Drug Metab. Rev. 2015, 47, 470–519. [Google Scholar] [CrossRef]
- Llerena, A.; Naranjo, M.E.G.; Rodrigues-Soares, F.; Peñas-Lledó, E.E.; Fariñas, H.; Tarazona-Santos, E. Interethnic variability of CYP2D6 alleles and of predicted and measured metabolic phenotypes across world populations. Expert Opin. Drug Metab. Toxicol. 2014, 10, 1569–1583. [Google Scholar] [CrossRef]
- Zhou, Y.; Ingelman-Sundberg, M.; Lauschke, V.M. Worldwide Distribution of Cytochrome P450 Alleles: A Meta-analysis of Population-scale Sequencing Projects. Clin. Pharmacol. Ther. 2017, 102, 688–700. [Google Scholar] [CrossRef] [PubMed] [Green Version]
- McGraw, J.E.; Waller, D. Cytochrome P450 variations in different ethnic populations. Expert Opin. Drug Metab. Toxicol. 2012, 8, 371–382. [Google Scholar] [CrossRef] [PubMed]
- Sistonen, J.; Fuselli, S.; Palo, J.U.; Chauhan, N.; Padh, H.; Sajantila, A. Pharmacogenetic variation at CYP2C9, CYP2C19, and CYP2D6 at global and microgeographic scales. Pharm. Genom. 2009, 19, 170–179. [Google Scholar] [CrossRef] [PubMed]
- U.S. Census Bureau. 2010 Census of Population and Housing, Population and Housing Unit Counts, CPH-2-1; United States Summary U.S. Government Printing Office: Washington, DC, USA, 2012.
- Salzano, F.M.; Sans, M. Interethnic admixture and the evolution of Latin American populations. Genet. Mol. Boil. 2014, 37, 151–170. [Google Scholar] [CrossRef] [PubMed] [Green Version]
- Salzano, F.M.; Bortolini, M.C. Evolution and Genetics of Latin American Populations; Cambridge University Press: Cambridge, UK, 2002. [Google Scholar]
- Boege, E. Regiones, Territorio, Lenguas y Cultura de los Pueblos Indígenas; El Patrimonio Biocultural de los Pueblos Indígenas de México. Hacia la Conservación in situ de la Biodiversidad y Agrodiversidad en los Territorios Indígenas, Eckart Boege; Instituto Nacional de Antropología e Historia-Comisión Nacional para el Desarrollo de los Pueblos Indígenas: Ciudad de México, México, 2008; pp. 49–63. [Google Scholar]
- Ministerio de Desarrollo Social. Ministerio de Desarrollo Social. Casen 2015. Pueblos Indígenas. Síntesis de Resultados. Available online: http://observatorio.ministeriodesarrollosocial.gob.cl/casen-multidimensional/casen/docs/CASEN_2015_Resultados_pueblos_indigenas.pdf (accessed on 10 April 2018).
- Arnaiz-Villena, A.; Juarez, I.; Lopez-Nares, A.; Palacio-Grüber, J.; Vaquero, C.; Callado, A.; H-Sevilla, A.; Rey, D.; Martin-Villa, J.M.; Juarez, I.; et al. Frequencies and significance of HLA genes in Amerindians from Chile Cañete Mapuche. Hum. Immunol. 2019, 80, 419–420. [Google Scholar] [CrossRef] [PubMed]
- Azofeifa, J.; Ruiz-Narváez, E.A.; Leal, A.; Gerlovin, H.; Rosero-Bixby, L. Amerindian ancestry and extended longevity in Nicoya, Costa Rica. Am. J. Hum. Biol. 2018, 30, e23055. [Google Scholar] [CrossRef] [PubMed]
- Instituto Nacional de Estadística y Censos-Costa Rica. X Censo Nacional de Población y VI de Vivienda 2011: Características Sociales y Demográficas Tomo II/Instituto Nacional de Estadística y Censos, 1st ed.; INEC: San José, CA, USA, 2012; 340p. [Google Scholar]
- Dirección General de Estadística, Encuestas y Censos (DGEEC)–III Censo Nacional de Población Y Viviendas para Pueblos Indígenas. 2012. Available online: https://www.dgeec.gov.py/Publicaciones/Biblioteca/censo%20indigena%202012/Presentacion%20resultados%2019%2007%2013.pdf (accessed on 27 January 2020).
- Instituto Nacional de Estadística. La Población Indígena de Venezuela. Censo 2011; Instituto Nacional de Estadística: Caracas, Venezuela, 2013; Volume 1, 15p. [Google Scholar]
- Instituto Nacional de Estadística e Informática. Censos Nacionales 2007: XI de Población y vi de Vivienda-Resumen Ejecutivo Resultados Definitivos de las Comunidades Indígenas; Dirección Nacional de Censos y Encuestas: Lima, Peru, 2009; 168p. [Google Scholar]
- Bigart, R.; Woodcock, C. (Eds.) the Name of the Salish and Kootenai Nation: The 1855 Hell Gate Treaty and the Origin of the Flathead Indian Reservation; Salish Kootenai College Press: Pablo, MT, USA, 1996. [Google Scholar]
- Salazar-Flores, J.; Torres-Reyes, L.A.; Martínez-Cortés, G.; Castellanos, R.R.; Sosa-Macías, M.; Muñoz-Valle, J.F.; González-González, C.; Ramirez, A.; Roman, R.; Mendez, J.L.; et al. Distribution of CYP2D6 and CYP2C19 Polymorphisms Associated with Poor Metabolizer Phenotype in Five Amerindian Groups and Western Mestizos from Mexico. Genet. Test. Mol. Biomarkers 2012, 16, 1098–1104. [Google Scholar] [CrossRef] [PubMed] [Green Version]
- Lazalde-Ramos, B.P.; Martinez-Fierro, M.L.; Galaviz-Hernandez, C.; Garza-Veloz, I.; Naranjo, M.E.G.; Sosa-Macías, M.; Llerena, A.; Llerena, A. CYP2D6 gene polymorphisms and predicted phenotypes in eight indigenous groups from northwestern Mexico. Pharmacogenomics 2014, 15, 339–348. [Google Scholar] [CrossRef]
- De Andrés, F.; Macías, M.S.; Ramos, B.P.L.; Naranjo, M.-E.G.; Llerena, A. CYP450 Genotype/Phenotype Concordance in Mexican Amerindian Indigenous Populations–Where to from Here for Global Precision Medicine? OMICS J. Integr. Boil. 2017, 21, 509–519. [Google Scholar] [CrossRef]
- Sosa-Macías, M.; Elizondo, G.; Flores-Pérez, C.; Flores-Pérez, J.; Bradley-Alvarez, F.; Alanis-Bañuelos, R.E.; Lares-Asseff, I. CYP2D6Genotype and Phenotype in Amerindians of Tepehuano Origin and Mestizos of Durango, Mexico. J. Clin. Pharmacol. 2006, 46, 527–536. [Google Scholar] [CrossRef]
- López-López, M.; Peñas-Lledó, E.; Dorado, P.; Ortega, A.; Corona, T.; Ochoa, A.; Yescas, P.; Alonso, E.; Llerena, A.; Llerena, A. CYP2D6 genetic polymorphisms in Southern Mexican Mayan Lacandones and Mestizos from Chiapas. Pharmacogenomics 2014, 15, 1859–1865. [Google Scholar] [CrossRef]
- Sosa-Macías, M.; Dorado, P.; Alanis-Bañuelos, R.E.; Llerena, A.; Lares-Asseff, I. Influence of CYP2D6 deletion, multiplication, –1584C→ G, 31G→ A and 2988G→ a gene polymorphisms on dextromethorphan metabolism among Mexican tepehuanos and mestizos. Pharmacology 2010, 86, 30–36. [Google Scholar] [CrossRef]
- Perez-Paramo, Y.X.; Hernandez-Cabrera, F.; Dorado, P.; Llerena, A.; Muñoz-Jimenez, S.; Ortiz-Lopez, R.; Rojas-Martinez, A.; Llerena, A. Interethnic relationships of CYP2D6 variants in native and Mestizo populations sharing the same ecosystem. Pharmacogenomics 2015, 16, 703–712. [Google Scholar] [CrossRef]
- Naranjo, M.-E.G.; Rodrigues-Soares, F.; Peñas-Lledó, E.E.; Tarazona-Santos, E.; Fariñas, H.; Rodeiro, I.; Teran, E.; Grazina, M.; Moya, G.E.; López-López, M.; et al. Interethnic Variability in CYP2D6, CYP2C9, and CYP2C19 Genes and Predicted Drug Metabolism Phenotypes among 6060 Ibero- and Native Americans: RIBEF-CEIBA Consortium Report on Population Pharmacogenomics. OMICS J. Integr. Boil. 2018, 22. [Google Scholar] [CrossRef] [PubMed]
- Céspedes-Garro, C.; Jiménez-Arce, G.; Naranjo, M.-E.G.; Barrantes, R.; Llerena, A. Ethnic background and CYP2D6 genetic polymorphisms in Costa Ricans. Rev. Biol. Trop. 2014, 62, 1659. [Google Scholar] [CrossRef] [PubMed] [Green Version]
- Fohner, A.; Muzquiz, L.I.; Austin, M.A.; Gaedigk, A.; Gordon, A.; Thornton, T.; Rieder, M.J.; Pershouse, M.A.; Putnam, E.A.; Howlett, K.; et al. Pharmacogenetics in American Indian populations: Analysis of CYP2D6, CYP3A4, CYP3A5, and CYP2C9 in the Confederated Salish and Kootenai Tribes. Pharm. Genom. 2013, 23, 403. [Google Scholar] [CrossRef] [PubMed] [Green Version]
- Grimán, P.; Moran, Y.; Valero, G.; Loreto, M.; Borjas, L.; Chiurillo, M.A. CYP2D6 gene variants in urban/admixed and Amerindian populations of Venezuela: Pharmacogenetics and anthropological implications. Ann. Hum. Boil. 2012, 39, 137–142. [Google Scholar] [CrossRef] [PubMed]
- Bailliet, G.; Santos, M.; Alfaro, E.; Dipierri, J.E.; Demarchi, D.; Carnese, F.; Bianchi, N. Allele and genotype frequencies of metabolic genes in Native Americans from Argentina and Paraguay. Mutat. Res. Toxicol. Environ. Mutagen. 2007, 627, 171–177. [Google Scholar] [CrossRef]
- Muñoz, S.; Vollrath, V.; Vallejos, M.P.; Miquel, J.F.; Covarrubias, C.; Raddatz, A.; Chianale, J. Genetic polymorphisms of CYP2D6, CYP1A1 and CYP2E1 in the South-Amerindian population of Chile. Pharmacogenetics 1998, 8, 343–351. [Google Scholar] [PubMed]
- Pena, S.D.J.; Di Pietro, G.; Fuchshuber-Moraes, M.; Genro, J.P.; Hutz, M.H.; Kehdy, F.D.S.G.; Kohlrausch, F.; Magno, L.A.V.; Montenegro, R.C.; Moraes, M.O.; et al. The Genomic Ancestry of Individuals from Different Geographical Regions of Brazil Is More Uniform Than Expected. PLoS ONE 2011, 6, e17063. [Google Scholar] [CrossRef] [Green Version]
- Wang, S.; Ray, N.; Rojas, W.; Parra, M.V.; Bedoya, G.; Gallo, C.; Poletti, G.; Mazzotti, G.; Hill, K.; Hurtado, A.M.; et al. Geographic Patterns of Genome Admixture in Latin American Mestizos. PLoS Genet. 2008, 4, e1000037. [Google Scholar] [CrossRef] [Green Version]
- Céspedes-Garro, C.; Fricke-Galindo, I.; Naranjo, M.E.G.; Rodrigues-Soares, F.; Fariñas, H.; De Andrés, F.; López-López, M.; Peñas-Lledó, E.M.; Llerena, A.; Llerena, A. Worldwide interethnic variability and geographical distribution of CYP2C9 genotypes and phenotypes. Expert Opin. Drug Metab. Toxicol. 2015, 11, 1893–1905. [Google Scholar] [CrossRef]
- Fricke-Galindo, I.; Céspedes-Garro, C.; Rodrigues-Soares, F.; Naranjo, M.E.G.; Delgado, Á.; de Andrés, F.; López-López, M.; Peñas-Lledó, E.; LLerena, A. Interethnic variation of CYP2C19 alleles, “predicted” phenotypes and “measured” metabolic phenotypes across world populations. Pharm. J. 2016, 16, 113–123. [Google Scholar] [CrossRef]
- Gaedigk, A.; Dinh, J.C.; Jeong, H.; Prasad, B.; Leeder, S. Ten Years’ Experience with the CYP2D6 Activity Score: A Perspective on Future Investigations to Improve Clinical Predictions for Precision Therapeutics. J. Pers. Med. 2018, 8, 15. [Google Scholar] [CrossRef] [Green Version]
- Gaedigk, A.; Sangkuhl, K.; Whirl-Carrillo, M.; Klein, T.; Leeder, J.S. Prediction of CYP2D6 phenotype from genotype across world populations. Genet. Med. 2017, 19, 69–76. [Google Scholar] [CrossRef] [PubMed] [Green Version]
- Eckhardt, K.; Li, S.; Ammon, S.; Schänzle, G.; Mikus, G.; Eichelbaum, M. Same incidence of adverse drug events after codeine administration irrespective of the genetically determined differences in morphine formation. Pain 1998, 76, 27–33. [Google Scholar] [CrossRef]
- Slanar, O.; Dupal, P.; Matouskova, O.; Vondrackova, H.; Pafko, P.; Perlík, F. Tramadol efficacy in patients with postoperative pain in relation to CYP2D6 and MDR1 polymorphisms. Bratisl. Lek. Listy 2012, 113, 152–155. [Google Scholar] [CrossRef] [Green Version]
- Swen, J.J.; Nijenhuis, M.; De Boer, A.; Grandia, L.; Der Zee, A.H.M.-V.; Mulder, H.; Rongen, G.A.P.J.M.; Van Schaik, R.H.N.; Schalekamp, T.; Touw, D.J.; et al. Pharmacogenetics: From Bench to Byte—An Update of Guidelines. Clin. Pharmacol. Ther. 2011, 89, 662–673. [Google Scholar] [CrossRef] [PubMed]
- Crews, K.R.; Gaedigk, A.; Dunnenberger, H.; Leeder, J.S.; Klein, T.E.; Caudle, K.E.; Haidar, C.E.; Shen, D.D.; Callaghan, J.T.; Sadhasivam, S.; et al. Clinical Pharmacogenetics Implementation Consortium Guidelines for Cytochrome P450 2D6 Genotype and Codeine Therapy: 2014 Update. Clin. Pharmacol. Ther. 2014, 95, 376–382. [Google Scholar] [CrossRef] [Green Version]
- Bertilsson, L.; Dahl, M.; Dalén, P.; Al-Shurbaji, A. Molecular genetics of CYP2D6: Clinical relevance with focus on psychotropic drugs. Br. J. Clin. Pharmacol. 2002, 53, 111–122. [Google Scholar] [CrossRef] [PubMed] [Green Version]
- Zhou, S.-F. Polymorphism of Human Cytochrome P450 2D6 and Its Clinical Significance. Clin. Pharm. 2009, 48, 761–804. [Google Scholar] [CrossRef]
- Yu, C.Y.; Ang, G.Y.; Subramaniam, V.; James, R.M.J.; Ahmad, A.; Rahman, T.A.; Nor, F.M.; Shaari, S.A.; Teh, L.K.; Salleh, H. Inference of the Genetic Polymorphisms of CYP2D6 in Six Subtribes of the Malaysian Orang Asli from Whole-Genome Sequencing Data. Genet. Test. Mol. Biomarkers 2017, 21, 409–415. [Google Scholar] [CrossRef]
- Aklillu, E.; Persson, I.; Bertilsson, L.; Johansson, I.; Rodrigues, F.; Ingelman-Sundberg, M. Frequent distribution of ultrarapid metabolizers of debrisoquine in an ethiopian population carrying duplicated and multiduplicated functional CYP2D6 alleles. J. Pharmacol. Exp. Ther. 1996, 278, 441–446. [Google Scholar]
- Gasche, Y.; Daali, Y.; Fathi, M.; Chiappe, A.; Cottini, S.; Dayer, P.; Desmeules, J. Codeine Intoxication Associated with Ultrarapid CYP2D6 Metabolism. N. Engl. J. Med. 2004, 351, 2827–2831. [Google Scholar] [CrossRef] [PubMed]
- Ciszkowski, C.; Madadi, P.; Phillips, M.S.; Lauwers, A.E.; Koren, G. Codeine, Ultrarapid-Metabolism Genotype, and Postoperative Death. N. Engl. J. Med. 2009, 361, 827–828. [Google Scholar] [CrossRef] [PubMed]
- Dean, L. Codeine therapy and CYP2D6 genotype. In Medical Genetics Summaries (Internet); National Center for Biotechnology Information (US). Available online: https://www.ncbi.nlm.nih.gov/books/NBK100662/ (accessed on 15 December 2019).
- Gardiner, S.J.; Begg, E.J. Pharmacogenetics, Drug-Metabolizing Enzymes, and Clinical Practice. Pharmacol. Rev. 2006, 58, 521–590. [Google Scholar] [CrossRef] [PubMed]
- Jittikoon, J.; Mahasirimongkol, S.; Charoenyingwattana, A.; Chaikledkaew, U.; Tragulpiankit, P.; Mangmool, S.; Inunchot, W.; Somboonyosdes, C.; Wichukchinda, N.; Sawanpanyalert, P.; et al. Comparison of genetic variation in drug ADME-related genes in Thais with Caucasian, African and Asian HapMap populations. J. Hum. Genet. 2016, 61, 119–127. [Google Scholar] [CrossRef] [PubMed]
- Peñas-Lledó, E.M.; Dorado, P.; Agüera, Z.; Gratacós, M.; Estivill, X.; Fernández-Aranda, F.; LLerena, A. CYP2D6 polymorphism in patients with eating disorders. Pharm. J. 2012, 12, 173–175. [Google Scholar] [CrossRef]
- Dalén, P.; Frengell, C.; Dahl, M.-L.; Sjöqvist, F. Quick onset of severe abdominal pain after codeine in an ultrarapid metabolizer of debrisoquine. Ther. Drug Monit. 1997, 19, 543–544. [Google Scholar] [CrossRef]
- Sistonen, J.; Sajantila, A.; Lao, O.; Corander, J.; Barbujani, G.; Fuselli, S. CYP2D6 worldwide genetic variation shows high frequency of altered activity variants and no continental structure. Pharm. Genom. 2007, 17, 93–101. [Google Scholar]
- Excoffier, L.; Ray, N. Surfing during population expansions promotes genetic revolutions and structuration. Trends Ecol. Evol. 2008, 23, 347–351. [Google Scholar] [CrossRef]
- Nebert, D.W. Polymorphisms in drug-metabolizing enzymes: What is their clinical relevance and why do they exist? Am. J. Hum. Genet. 1997, 60, 265–271. [Google Scholar]


| Variants | Population, Tribe, or Affiliation | Country | Reference |
|---|---|---|---|
| *1 *3 *4 *6, *7, *8 | Tarahumaras, Purépechas, Tojolabales, Tzotziles, and Tzeltales | Mexico | [23] |
| *1, *2, *4, *5, *6, *10, *3, *17, *29, *35, *41 | Mexicaneros, Seris, Guarijíos, Tepehuanos, Mayos, Huicholes, Tarahumaras, and Coras | Mexico | [24] |
| *2, *3, *4, *6, *10, *17, *29, *35, *41 | Tarahumara, Tepehuana, Mexicanera, Huichol, Cora, Seri, Mayo, and Guarijía | Mexico | [25] |
| *3, *4, *6, *10 | Tepehuano | Mexico | [26] |
| *2, *3, *4, *5, *6, *10, *17, *35, *41 | Lacandones | Mexico | [27] |
| *5, *2A, *35, *41 | Tapehuanos | Mexico | [28] |
| *2, *3, *4, *6, *10, *17, *35, *41 | Tzotzil and Tzeltal | Mexico | [29] |
| *2, *3, *4, *5, *6, *10, *17, *29, *35, *41 | Bri bri, Cabecar, Chorotega, Guatuso, Guaymi and Huetar; Chol, Huichol, Lacandon, Mayo, Mexicanero, Seri, Tarahumara, Tepehuano, Tzeltal, Tzoltil, Yaqui and Zoque; Ashaninka, Aymara, and Shima | Costa Rica, Mexico and Peru | [30] |
| *1, *2, *3, *4, *5, *6, *10, *17, *29, *35, *41 | Bribri, Guaymi, Cabecar, Guatuso, Chorotega, and Huetar | Costa Rica | [31] |
| *1, *2, *3, *4, *5, *9, *10, *28, *33, *35, *41 | Salish and Kootenai | United States of America | [32] |
| *2, *3, *4, *5, *6, *10 | Bari, Panare, Pemon, Warao, and Wayuu | Venezuela | [33] |
| *1, *2, *3, *4, *5, *6, *8, *10, *12, *14, *15 | Jujuy province, Wichi, Chorote, Toba, Mapuche, Tehuelche, Ayoreo, and Lengua | Argentina and Paraguay | [34] |
| *1, *2, *3, *4, *5, *9, *10 | Mapuches | Chile | [35] |
| Allele (Arranged by Functional Consequence) Normal Activity | Variants | Variation Type |
| *1 | None | - |
| *2 | rs16947, rs1135840 | Missense (R296C, S486T) |
| *33 | rs28371717 | Missense (A237S) |
| Increased Activity | ||
| *1xN | Amplification of *1 | - |
| *2xN | Amplification of *2 | - |
| *53 | rs1135822, rs1135823 | Missense (F120I, A122S) |
| Decreased Activity | ||
| *9 | rs5030656 | In-frame Deletion (K281del) |
| *10 | rs1065852, rs1135840 | Missense (P34S, S486T) |
| *17 | rs16947, rs28371706 | Missense (R296C, T107I) |
| *29 | rs16947, rs1135840, rs61736512 and rs59421388 | Missense (R296C, S486T, V136I and V338M) |
| *41 | rs28371725 | Splicing Defect |
| Inactivated | ||
| *3 | rs35742686 | Frameshift |
| *4 | rs3892097 | Splicing Defect |
| *5 | CYP2D6 deletion | - |
| *6 | rs5030655 | Frameshift |
| *7 | rs5030867 | Missense (H324P) |
| *8 | rs5030865 | Stop gain (G169X) |
| *11 | rs201377835 | Splicing defect |
| *12 | rs5030862 | Missense (G42R) |
| *14 | rs5030865 | Missense (G169R) |
| *42 | rs72549346 | Frameshift |
| *62 | rs730882171 | Missense (R441C) |
© 2020 by the authors. Licensee MDPI, Basel, Switzerland. This article is an open access article distributed under the terms and conditions of the Creative Commons Attribution (CC BY) license (http://creativecommons.org/licenses/by/4.0/).
Share and Cite
Leitão, L.P.C.; Souza, T.P.; Rodrigues, J.C.G.; Fernandes, M.R.; Santos, S.; Santos, N.P.C. The Metabolization Profile of the CYP2D6 Gene in Amerindian Populations: A Review. Genes 2020, 11, 262. https://doi.org/10.3390/genes11030262
Leitão LPC, Souza TP, Rodrigues JCG, Fernandes MR, Santos S, Santos NPC. The Metabolization Profile of the CYP2D6 Gene in Amerindian Populations: A Review. Genes. 2020; 11(3):262. https://doi.org/10.3390/genes11030262
Chicago/Turabian StyleLeitão, Luciana P. C., Tatiane P. Souza, Juliana C. G. Rodrigues, Marianne R. Fernandes, Sidney Santos, and Ney P. C. Santos. 2020. "The Metabolization Profile of the CYP2D6 Gene in Amerindian Populations: A Review" Genes 11, no. 3: 262. https://doi.org/10.3390/genes11030262
APA StyleLeitão, L. P. C., Souza, T. P., Rodrigues, J. C. G., Fernandes, M. R., Santos, S., & Santos, N. P. C. (2020). The Metabolization Profile of the CYP2D6 Gene in Amerindian Populations: A Review. Genes, 11(3), 262. https://doi.org/10.3390/genes11030262