Article

Identification and Selection of Reference Genes for Quantitative Transcript Analysis in Corydalis yanhusuo

1
School of pharmacy, Jiangsu Health Vocational College, Nanjing 211800, China
2
School of Life Science and Technology, China Pharmaceutical University, Nanjing 210009, China
3
School of Pharmacy, China Pharmaceutical University, Nanjing 210009, China
4
Institute of Modern Chinese Medicine, School of Pharmacy, Wannan Medical College, Wuhu 241002, China
*
Authors to whom correspondence should be addressed.
Both authors are first authors.
Genes 2020, 11(2), 130; https://doi.org/10.3390/genes11020130
Submission received: 11 December 2019 / Revised: 19 January 2020 / Accepted: 23 January 2020 / Published: 27 January 2020
(This article belongs to the Section Plant Genetics and Genomics)

Abstract

:
Corydalis yanhusuo is a medicinal plant frequently used in traditional Chinese medicine, which has effective medical effects in many aspects. Real-time polymerase chain reaction (RT-PCR) has been one of the most widely used methods in biosynthesis research due to its high sensitivity and quantitative properties in gene expression analysis. To obtain accurate normalization, reference genes are often selected in advance; however, no reference genes are available in C. yanhusuo. Herein, 12 reference gene candidates, named cyclophilin 2 (CYP2), elongation factor 1-α (EF1-α), protein phosphatase 2 (PP2A), SAND protein family (SAND), polypyrimidine tract-binding protein (PTBP), TIP41-like protein (TIP41), lyceraldehyde-3-phosphate hydrogenase (GAPDH), ubiquitin-conjugating enzyme 9 (UBC9), cyclophilin 1 (CYP1), tubulin beta (TUBA), thioredoxin (YLS8), and polyubiquitin 10 (UBQ10), were selected for stability analysis. After being treated with hormone, UV, salt, metal, oxidative, drought, cold (4 °C), and hot stresses (40 °C), the qRT-PCR data of the selected genes was analyzed with NormFinder, geNorm, and BestKeeper. The result indicated that GAPDH, SNAD, and PP2A were the top three most stable reference genes under most treatments. This study selected and validated reliable reference genes in C. yanhusuo under various environmental conditions, which can provide great help for future research on gene expression normalization in C. yanhusuo.

1. Introduction

Corydalis yanhusuo is a plant from the Papaveraceae family and is widely used to treat drug addiction and as analgesics in China [1]. Abundant pharmacological effects on humans have been identified in the extracts of C. yanhusuo (tuber), such as pain relief, anti-tumor effects, and promotion of blood circulation [2,3]. Benzylisoquinoline alkaloids are the main biological components produced by C. yanhusuo, and previous studies have found that dehydrocorybulbine, which is found in the extract of C. yanhusuo, is a kind of alkaloid that can exhibit antagonistic activity by acting on dopamine receptors [4,5]. Moreover, further research suggests that another active ingredient, tetrahydropalmatine, has a significant effect on protecting against acute global cerebral ischemia-reperfusion injury [6]. However, few studies have focused on the gene expression of C. yanhusuo. Some pivotal genes involved in the biosynthetic pathways of important components are not yet clear. For example, various medical functions have been proven by previous research for D-glaucine, but the genes involved in this biosynthesis pathway are still undefined [7]. Also, since some genes are still unknown, studies of gene expression patterns and transcription regulation under a variety of exogenous regulators will be stagnant and blocked [8]. For these reasons, detailed studies are needed to carry out on the genetic discovery and functional verification of C. yanhusuo.
High-throughput, or next-generation sequencing (NGS), is a kind of biological technology that has been used for genome sequencing, transcriptome analysis (RNA-seq), DNA–protein interactions (ChIP sequencing), epigenome characterization, and genome re-sequencing [9]. Due to its characteristics of being rapid and low cost in the analysis of the genome and transcriptome of biological organisms, it has become a frequently used biological technology [10]. Quantitative real-time polymerase chain reaction (qRT-PCR) technology is a derivative method, which can monitor the amplification process of target DNA during PCR and it can also be quantitative. It provides an effective and rapid way to quantify the expression level of target genes in various samples by detecting the expression levels of specific reference genes. Relative quantification is the most commonly used quantitative strategy, in which data is standardized by internal control genes. Otherwise, the results would be unavoidably influenced by both internal and external factors, like DNA contamination, RNA purity, complementary DNA (cDNA) quality, primer design, and PCR efficiency [11,12]. The reference gene or housekeeping gene (HKG) is a kind of constitutive internal control gene that can express steadily in different tissues, various samples, and under different environmental pressures, providing a constant reference during quantification of targeted genes [13]. Therefore, to obtain effective results and interpretation from data, selecting an ideal reference gene is vital [14]. The commonly used reference genes in plants are GAPDH, actin (ACT), 18S rRNA, CYP, and alpha-tubulin (α-TUB) [15,16,17,18,19]. Nevertheless, several studies demonstrated that the expression levels of traditional reference genes varied widely in different circumstances, which means that they may become unsuitable for data normalization [20,21]. To solve the problem of unsteadiness of internal reference genes in different organisms or under different treatments, some new reference genes, which are expressed at an unchanging level, have been selected for qRT-PCR normalization. There are also studies that have tried to determine which gene is the most stable in a specific organism, such as Arabidopsis pumila, Cichorium intybus, Caenorhabditis elegans, sugarcane, and Cyprinus carpio [22,23,24,25,26]. However, there are no systematic studies aimed at the selection of reference genes in C. yanhusuo under multifarious abiotic treatments. Therefore, our study reports the first guidance on choosing suitable reference genes in C. yanhusuo under a series of environmental stresses for further studies in quantifying genes of interest.
For the aim of obtaining a more circumstantial analysis of the expression stability of reference genes, C. yanhusuo plants were pretreated under several external abiotic treatments, including methyl jasmonate (MeJA), UV radiation, NaCl, CuSO4, H2O2, cold, PEG, and H2O. The cycle threshold (Ct) values were processed and analyzed by three statistic algorithms: geNorm, NormFinder, and BestKeeper [11,16,27]. These types of software have been widely used to select stable reference genes since 2002 [11,16,27]. geNorm is a software that can process and analyze data. It can evaluate the reliability of reference gene candidates using the expression stability value (M) as a parameter [26]. For each control gene, the pairwise variations of candidates were defined as the logarithmically transformed expression ratio of standard deviation and gene-stability measure. A gene with a lower M value means that it has a more stable expression level. NormFinder is an algorithm that has a similar data processing mode as geNorm. Similar to geNorm analysis, a lower expression stability value (M) refers to higher stability and a higher M value represents lower stability [16]. BestKeeper (https://www.heartcure.com.au/for-researchers/) can calculate the Ct values to analyze variabilities in each candidate reference gene [27]. RefFinder is a web-based comprehensive tool (https://www.heartcure.com.au/for-researchers/). It integrates the currently available major computational programs (geNorm, Normfinder, BestKeeper) to compare and rank the tested candidate reference genes. To confirm the stability of selected genes, RNA-seq data based on gene expression profiling was used to compare the sorting results. Meanwhile, the 1-aminocyclopropane-1-carboxylate oxidase (ACO) gene was used as a standard to validate the stability of selected genes since the expression level of ACO is generally considered to be steady. In general, the result of the study would play a significant role in the study of C. yanhusuo, especially for the studies of genes involved in biosynthesis.

2. Materials and Methods

2.1. Plants and Growth Environments

One-year-old C. yanhusuo were transplanted from the botanical garden (Medicinal Botanical Garden of China Pharmaceutical University) to pots (diameter 15 cm) containing a mixture of perlite, vermiculite, and peat moss at a ratio of 1:1:1 in the laboratory and cultured for seven days under the same conditions. The plants were kept at 20 °C, with a day length of 12 h (H), and were watered regularly. The relative humidity was maintained between 40% and 70%. For hormone treatment, MeJA (purchased from Aladdin, Shanghai, China), was dissolved in 95% ethanol to make a stock solution; then, it was diluted into 25 mM with ddH2O for use. Plants were subjected to 200 mL MeJA for 6 h before harvest. Salt stress treatment was applied by using 200 mL of 500 mM NaCl for seven days. Oxidative stress was carried out by exposing the leaves to 200 mL of 50 mM H2O2 for 24 h. To apply cold and hot stress treatments, plants were placed in an illuminating incubator at 40 and 4 °C for 48 h, respectively. Metal treatment was carried out by using 200 mL of 200 mM CuSO4 solution for 24 h. For drought treatment, 200 mL of 20% PEG 4000 were used per day to water the plant for seven days. For the ultraviolet rays (UV) treatment, a monochromatic lamp (312 nm) was used to irradiate plants with a set distance of 15 cm, and the plants were rotated every 2 h to minimize positional effects. Control groups were treated with distilled water. All solutions were poured into the soil directly, and all experimental groups under different treatments contained three biological replicates and three technical repeats for expression analysis. The harvested sample tender leaves were frozen in liquid nitrogen prior to the degradation of mRNA and then stored at −80 °C.

2.2. RNA Isolation and Complementary DNA Synthesis

An EASY spin Universal Plant RNA Kit (Aidlab, Beijing, China) was used to extract RNA by using about 100 mg of frozen sample. Then, the quality and purity of the total RNA samples were detected by the NanoDrop spectrophotometer 2000 (Thermo Fisher Scientific, Waltham, MA, USA)—only RNAs with optical density OD260/280 ratios ranging from 1.8–2.1 and an OD260/230 ratio between 1.6 and 2.2 were used for further analysis. To eliminate the influence of DNA contaminants, RNAase-free DNAase I (Takara Biotechnology, Dalian, China) was used to pretreat RNA samples before being used in reverse transcription. By following the guidance (HiScript Q RT SuperMix for qPCR, Vazyme, China), 1 μg of template RNA was used for cDNA synthesis in a 20-mL admixture and then diluted five times for qRT-PCR analyses.

2.3. Selection of Candidate Reference Genes and Primers Design

A total of 12 genes were chosen as candidate genes to determine the most suitable reference gene in C. yanhusuo under multiple environmental pressures. Half of the candidates were selected according to previous research (CYP2, PP2A, TIP41, UBQ10, CYP1, TUBA, GAPDH) [28,29,30] and another half (EF-1α, PTBP, SAND, UBC9, YLS8) were selected by comparison with the TAIR database (http://www.arabidopsis.org). To select and screen the potential unigenes, the internal program in Bioedit Sequence Alignment Editor was used in the local BLAST; https://blast.ncbi.nlm.nih.gov/). The information of the C. yanhusuo sequence has been uploaded to the BioProject database of National Center for Biotechnology Information (Access Number is PRJNA539894, all sequence information of C. yanhusuo is shown in Table S1). By using the TAIR database, potential homologs of 12 genes were selected, and a high bit score with a low E-value was the standard to choose genes. Primers had to come across the exon–intron boundaries, and the AlignX program in vector NTI advance 11.5 was used to perform the exon analysis to avoid the DNA pollutant. All primers were designed based on the following criteria: The length of amplification was between 100 and 150 bp, the GC content range was from 40–60%, the length of primer ranged from 17 to 25 bp, and the differences in the melting temperature (Tm) between the forward primer and reverse primer were less than 1 °C. The information of the primer pairs involved in this research is presented in Table 1.

2.4. Quantitative Real-Time Polymerase Chain Reaction (qRT-PCR) Analysis

The reaction system contained 10 μL of Vazyme qPCR SYBR Green Master Mix (No Rox, Vazyme, Nanjing, China), 2 μL of 5 times diluted cDNA, and sterile ultrapure water added to 20 μL. The reaction was carried out under the following cycle conditions: Five minutes in 95 °C for 1 cycle, and then 10 s in 95 °C, 20 s in 55–60 °C, and 20 s in 72 °C for 40 cycles. The qRT-PCR reactions were performed three times for analytical replicates. Each stress treatment had three biological replicates and Table S2 shows the raw Ct values of all candidates’ reference genes. Then, melting curve analysis was used to detect the specificity of each primer pair because only results with high reaction specificity can be used for quantitative results analysis. The LC480 Conversion and LinRegPCR programs [31,32,33,34] were used to obtain quantitative PCR amplification efficiencies. Fluorescence intensity and cycle values were compared and analyzed by the LC480 conversion and LinRegPCR programs to be able to quantify the relationship between them.

2.5. Statistical Analysis of Gene Expression Stability

In order to visually exhibit the stability of each candidate gene under different experimental conditions, geNorm, NormFinder, and BestKeeper were used to process the raw Ct values obtained by qRT-PCR. Data for the geNorm and NormFinder algorithms had to be processed by the formula: 2−ΔCt (ΔCt = each corresponding Ct value − the minimum Ct value). Then, by importing 2−ΔCt values into the programs, the stability parameters of each gene could be obtained. In geNorm analysis, the stability value (M) could be generated by comparing the pairwise variation (V) between different candidate genes. The threshold was often used as a parameter to evaluate the stability of expression of candidate genes and higher M values refer to worse stability. Pairwise variation (Vn/Vn+1) analysis was performed as a desired value that suggests the number of candidate genes needed for accurate normalization [11]. When this value was less than 0.15, it indicated that the number of internal reference gene combinations in this group can maintain the accurate normalization of the data to some extent. NormFinder is rooted in a mathematical model that assesses the reliability of candidate genes and estimates variations in both the intra-group and inter-group [30]. In geNorm, the gene with higher expression stability usually exhibits lower expression stability values (M), which is the same as NormFinder. BestKeeper uses a different mechanism to choose the most stable genes; CV ± SD (coefficient of variation ± standard deviation) is used as the parameter, and genes with low parameters are considered to have high stability. Through the comparative analysis of three kinds of analytical software, it is intuitive to select the internal reference genes more accurately under different external environments.

2.6. Comprehensive Analysis and Validation of Selected Reference Genes

To validate the outcomes of the NormFinder, geNorm, and BestKeeper, a comprehensive ranking platform RefFinder was used to identify the most reliable gene under various environmental conditions. For the aim of verifying the reference genes identified in this study, primers were designed according to the RNA-seq of ACO, and qRT-PCR technology was performed to quantify the relative abundance of ACO (it can be extracted from PRJNA539894) under MeJA treatments for confirmation of the reliability of this study. qRT-PCR data were obtained by performing three biological replicates. The obtained data were processed based on the 2−△△Ct method to transfer to the relative expression level [28].

3. Results

3.1. Evaluation of Amplification Specificity and PCR Efficiency in C. yanhusuo

In order to survey the reference gene of C. yanhusuo, 12 candidate genes (CYP2, EF1-α, PP2A, PTBP, SAND, TIP41, UBC9, UBQ10, CYP1, TUBA, YLS8, and GAPDH) were screened according to previous studies [29,30,35] and the TAIR database. Arabidopsis homolog locus, PCR efficiency, gene symbol, amplicon length, and correlation coefficients (R2) are shown in Table 1. In addition, the melting curve analysis confirmed the specificity of genes since only one single peak was formed (Figure S1). By following the LinRegPCR program [31,32,33,34], the average amplification efficiency (E) of primers was from 1.598 to 1.860. The regression coefficient used the same slope with the standard curve, and R2 (correlation coefficients) ranged from 0.676 to 1.000 (Table 1). Of them, TUBA has the lower primer efficiency. Considering TUBA belongs to the tubulin protein superfamily, which is different from other protein types, and TUBA shows high stability in some species, we also used it as the candidate reference gene in the subsequent experiments.

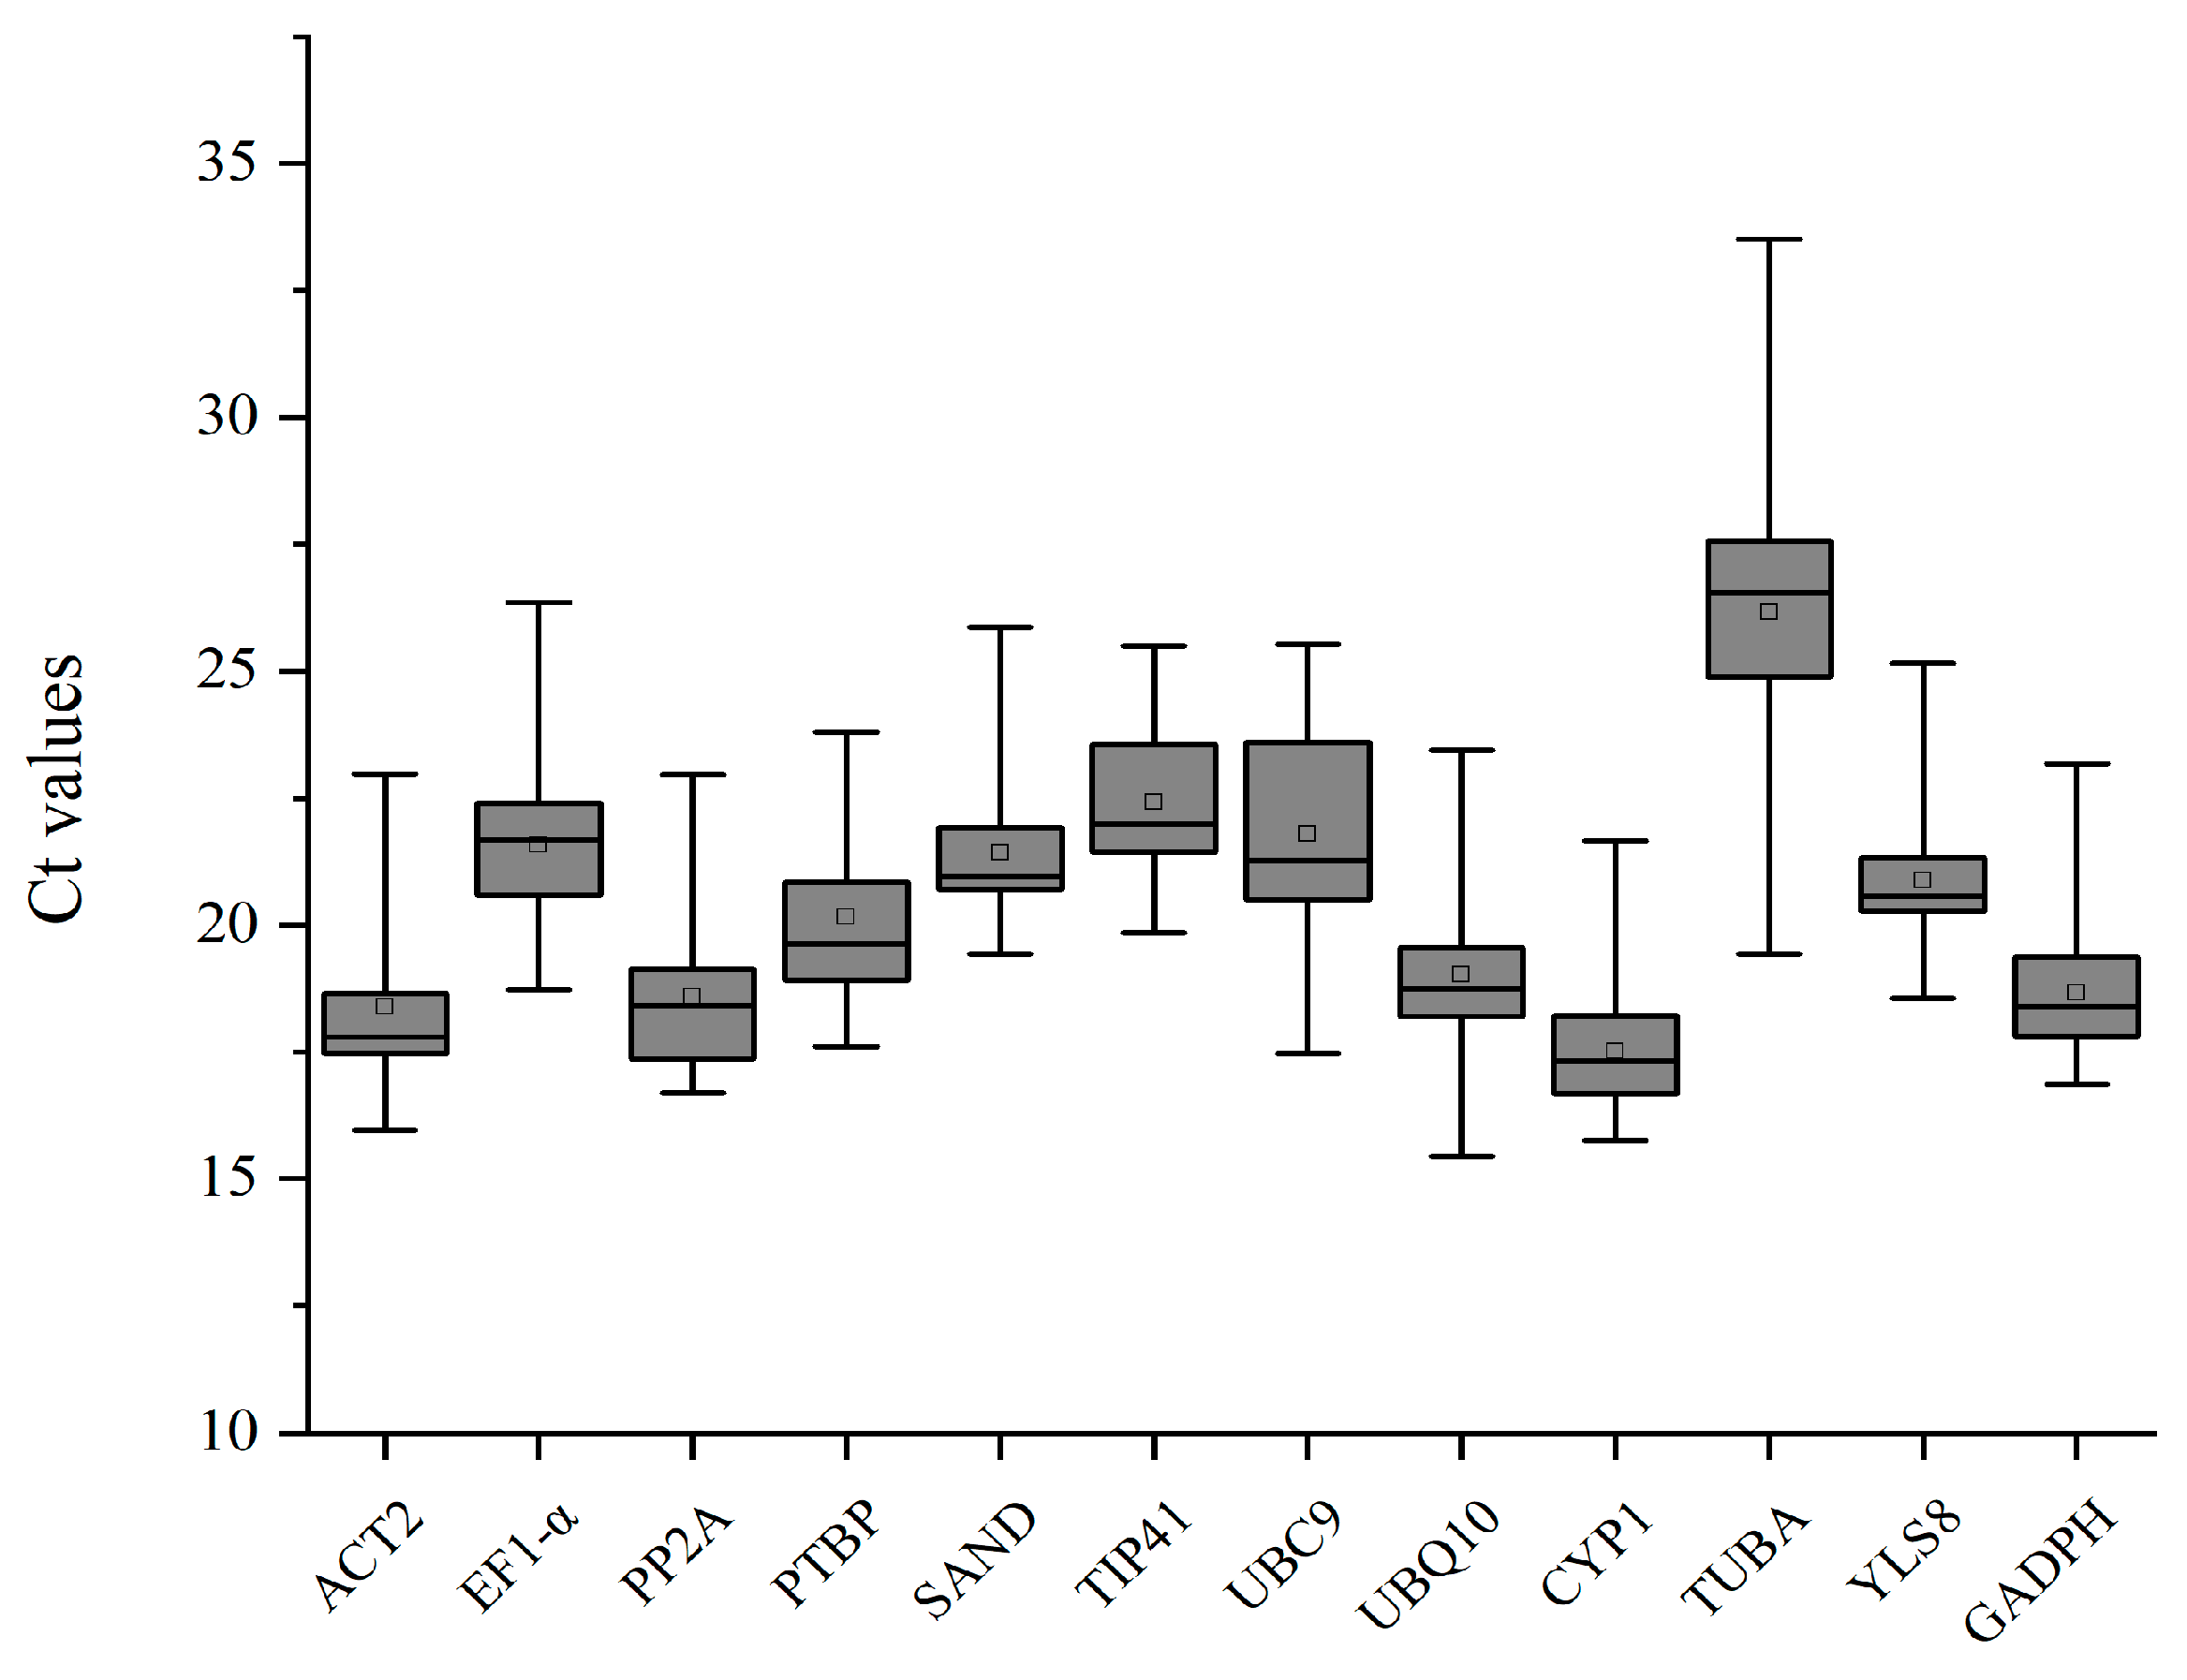
3.2. Expression Profiles of Reference Genes

The Ct values indicate the cycles required to reach the threshold; genes with lower Ct values represent higher expression levels. The mean Ct values of candidates ranged from 17.51 to 26.16 and most of them were distributed from 18 to 22. CYP2, PP2A, and GAPDH showed the greatest potential as they had the lowest Ct values (mean ± SD) of 18.38 ± 1.71, 18.58 ± 1.62, and 18.66 ± 1.23, respectively. TUBA was the least abundant candidate because it had the largest Ct value (26.16 ± 2.44) (Figure 1 and Table S2). In addition, TUBA exhibited a high variability since the SD can reflect the dispersion degree of a data set, and TUBA possessed the maximum SD value. Conversely, CYP2 was the last in the SD value ranking, which meant it was probably the most stable among all candidate reference genes (Figure 1 and Table S2). In general, though Ct values can be parameters to make evaluations of the expression level and the stability of candidate reference genes, more systematical data analyses are still in needed to assess the reliability of all candidate genes under different environmental treatments.

3.3. The Analysis of Expression Stability of Candidate Reference Genes

For a more in-depth analysis of the qRT-PCR results of all candidates under different stresses, three kinds of software (geNorm, NormFinder, and BestKeeper) were used and all raw Ct values were pretreated and classified into a compatible form before being used.

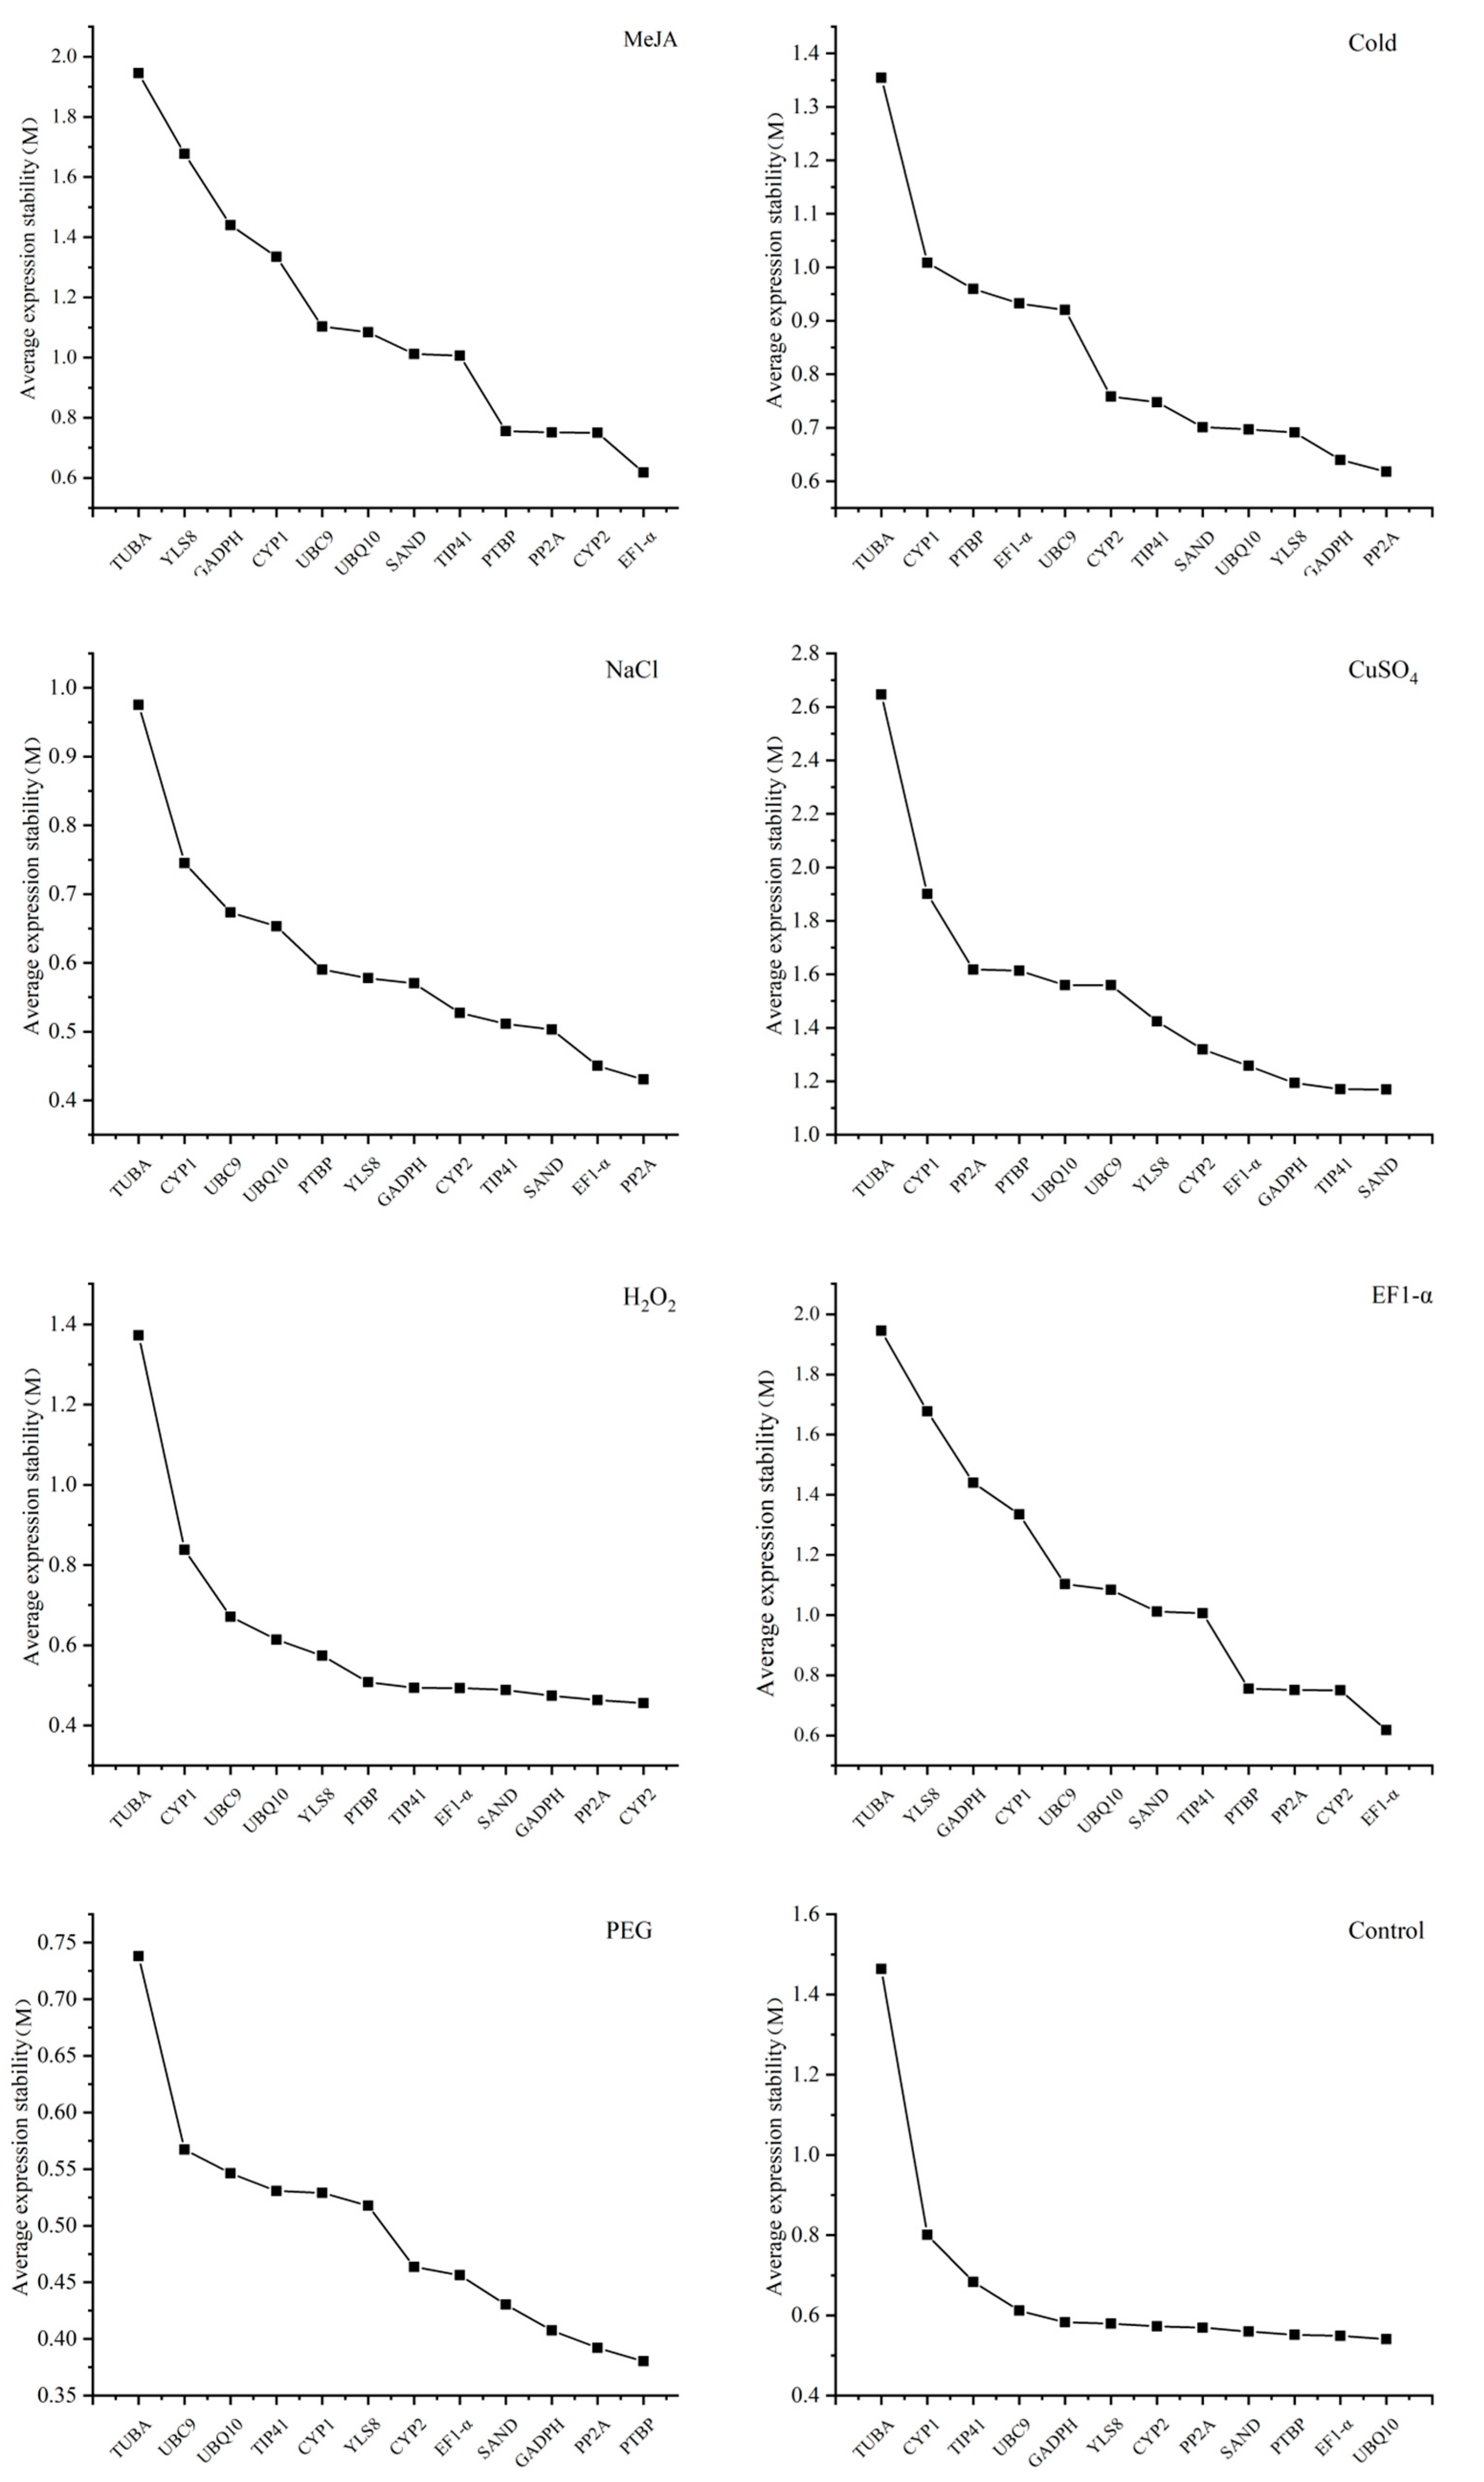
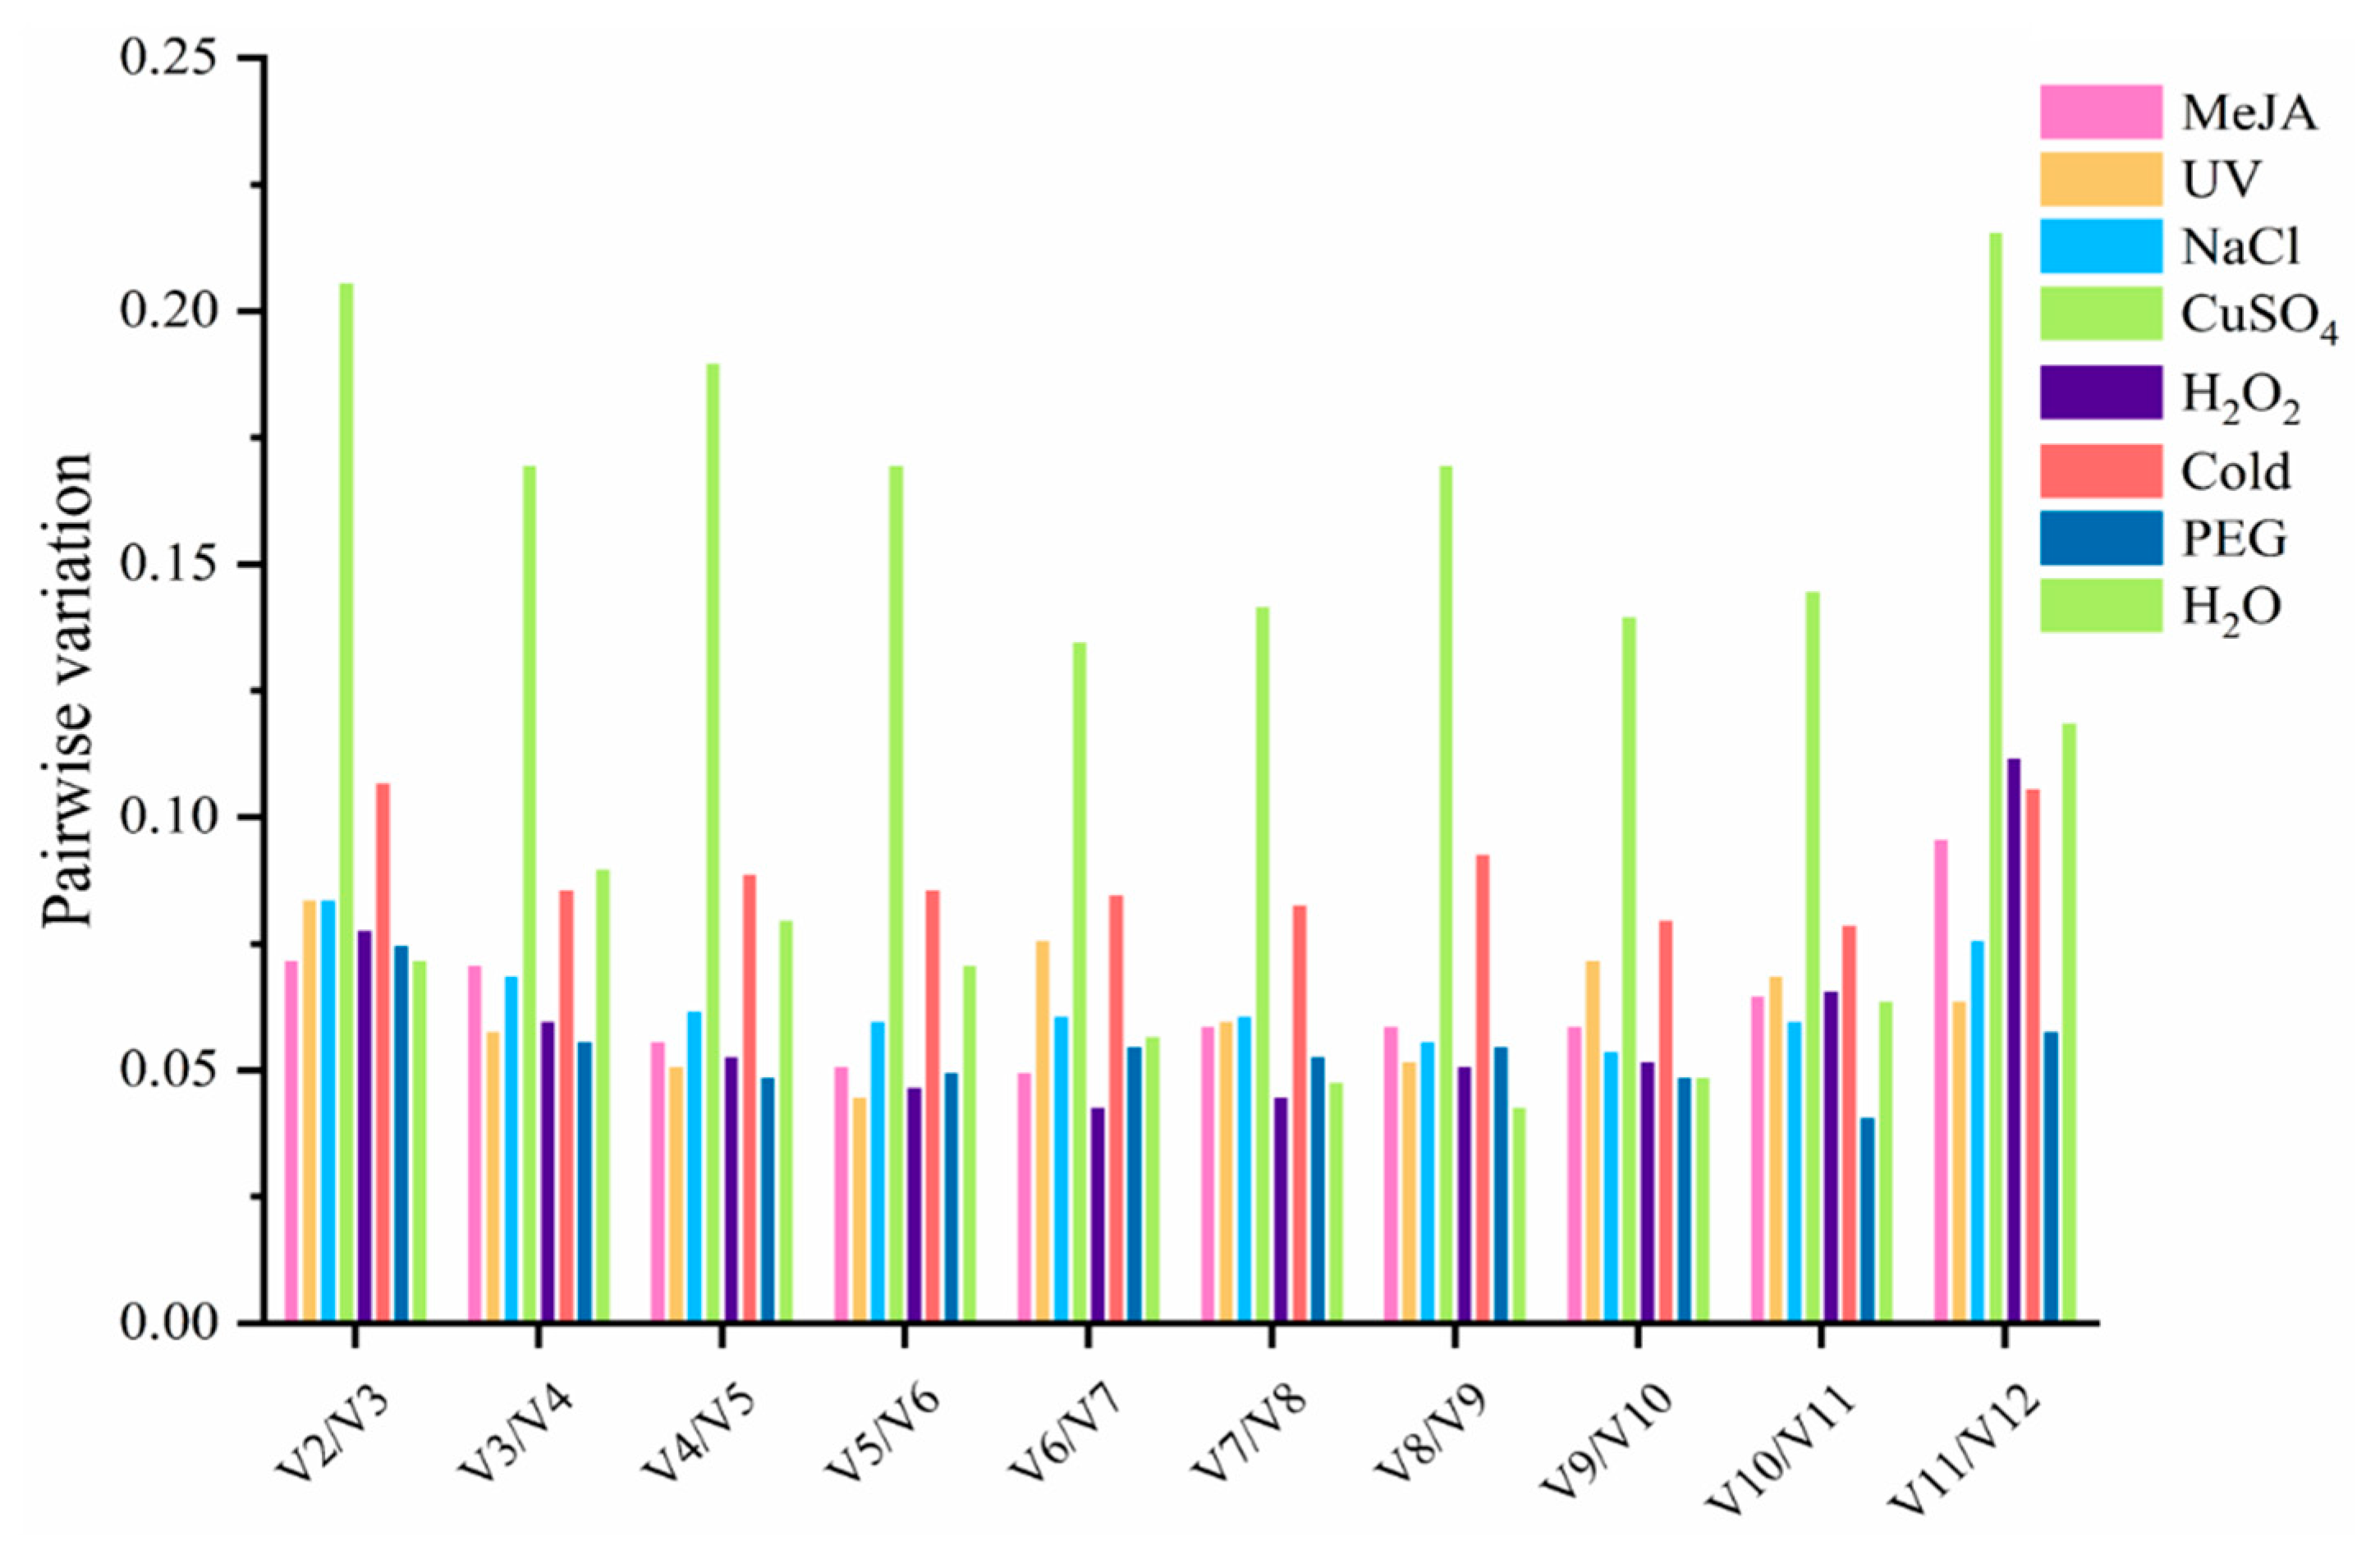
3.3.1. geNorm Analysis

According to geNorm analysis, TUBA showed the highest values under all pressure treatments, which demonstrated that TUBA had the worst stability. PP2A was the most stable candidate gene under salt and low-temperature treatment, as it showed the lowest M value. In addition, PP2A was the second most stable result under both drought and oxidative treatments, whereas it was unstable under MeJA, UV, and in the control group (Figure 2). According to Figure 2, there was no obvious M value change among the lowest three results in the CuSO4, H2O2, cold, and control groups. Moreover, the M values of SAND, TIP41, and GAPDH in CuSO4 were just the same, which meant that there were no big stability differences about the stability of SAND, TIP41, and GAPDH in the CuSO4 group. This phenomenon could also be found in GAPDH, PP2A, and CYP2 in the H2O2 group, and PTBP, EF1-α, and UBQ10 in the control group (Figure 2).
In addition to the function of assessing the stability of candidate gene expression, the other function of geNorm is to evaluate the optimal number of reference genes required for precise normalization. The geNorm algorithm uses pairwise variation (Vn/Vn+1) as a parameter, and 0.15 is usually regarded as the threshold value for normalization. A value lower than 0.15 represents that there will be no huge impact on normalization, even when one more reference gene is added, whereas a value more than 0.15 indicates that there will be a huge influence [16]. In this research, the Vn/Vn+1 could be obtained from geNorm (Figure 3 and Table S3) and the values of the four groups were all lower than 0.15. The V2/V3 values of all groups exposed to multifarious pressures fell below 0.15, except CuSO4, which indicated that one more reference gene added would not provide further improvement for the data normalization. For accurate normalization, metal treatment required at least six reference genes. Furthermore, the pairwise variation value of metal treatment is the only one that exceeded 0.15, and the pairwise variation values under other treatments were significantly less than 0.15 (Figure 3). However, pairwise variation is not a strict parameter and 0.15 is not a precise standard for apprising the number of reference genes needed for precise normalization [16]. One more reference gene is still recommended for precise data normalization in qRT-PCR analysis.

3.3.2. NormFinder Analysis

The data calculated by NormFinder is listed in Table 2. In all samples under different environmental conditions calculated by NormFinder, UBQ10 showed the most stability under MeJA analysis as it had the lowest value. There were four groups of M values (MeJA, NaCl, H2O2, cold) lower than 0.1 and they were UBQ10 (0.024), PP2A (0.042), CYP2 (0.039), and PP2A (0.097), respectively. In the other four groups (UV, CuSO4, PEG, and control), GAPDH (0.147), TIP41 (0.185), PTBP (0.100), and UBQ10 (0.168) were the most reliable reference gene candidates. TUBA had the lowest M value in all groups, which indicated that TUBA had the lowest stability among all candidate genes. In addition, UBC9 also showed a low M value in most of the treatments. These results also aligned with the results of the geNorm analysis. The NormFinder analysis had very similar results with the geNorm analysis, especially in the following genes: GAPDH, PP2A, TIP41, CYP2, and PTBP.

3.3.3. BestKeeper Analysis

Ct values can be directly processed by BestKeeper analysis instead of transferring to relative expression levels [34]. The SD and CV were the parameters that evaluated the stability and expression level of candidate genes, as shown in Table 3. The values of CV ± SD can assess the stability of candidate genes, and lower CV ± SD values represent more stable genes. For another measurement, genes would be considered unstable if the SD value was more than 1.00. YLS8 was the most stable candidate under the UV, CuSO4, and cold treatments with the lowest CV ± SD value at 1.50 ± 0.32, 2.25 ± 0.43, and 0.86 ± 0.19, respectively. In NaCl and H2O2 conditions, SAND was the most stable gene with CV ± SD values of 1.09 ± 0.23 and 0.85 ± 0.18. In the MeJA, PEG, and control groups, UBC9, PP2A, and TIP41 showed the most stability, with CV ± SD values of 1.77 ± 0.38, 1.26 ± 0.24, and 6.15 ± 1.40, respectively. However, UBC9 showed high instability, as it showed low stability in the NaCl, H2O2, and PEG groups. In addition, in most treatments, TUBA and CYP1 both exhibited lower stability than the other candidate genes, which is consistent with the geNorm and NormFinder analyses.

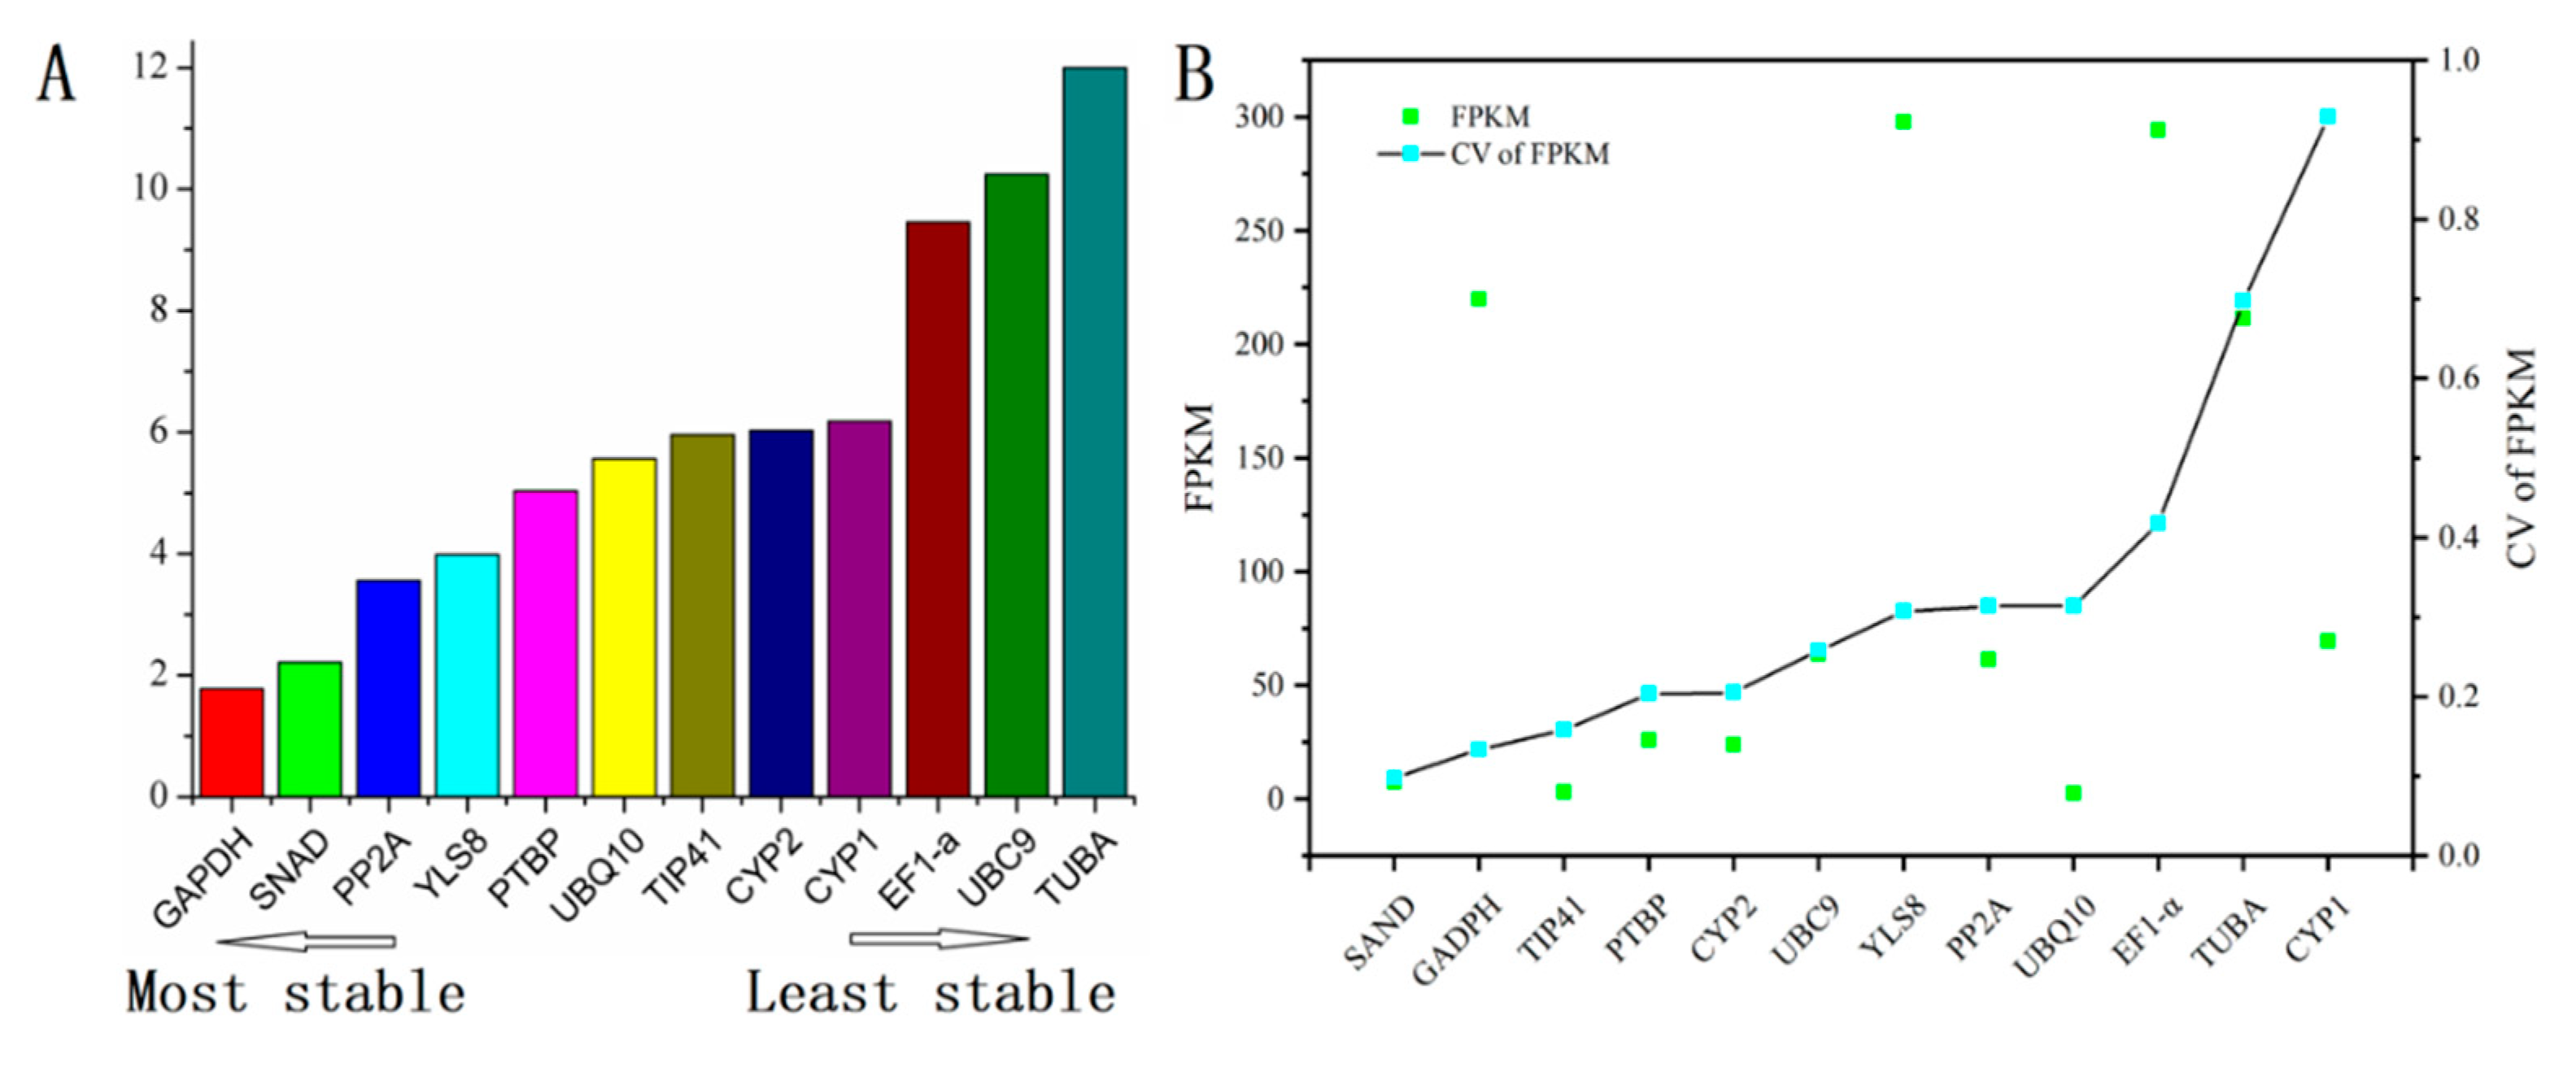
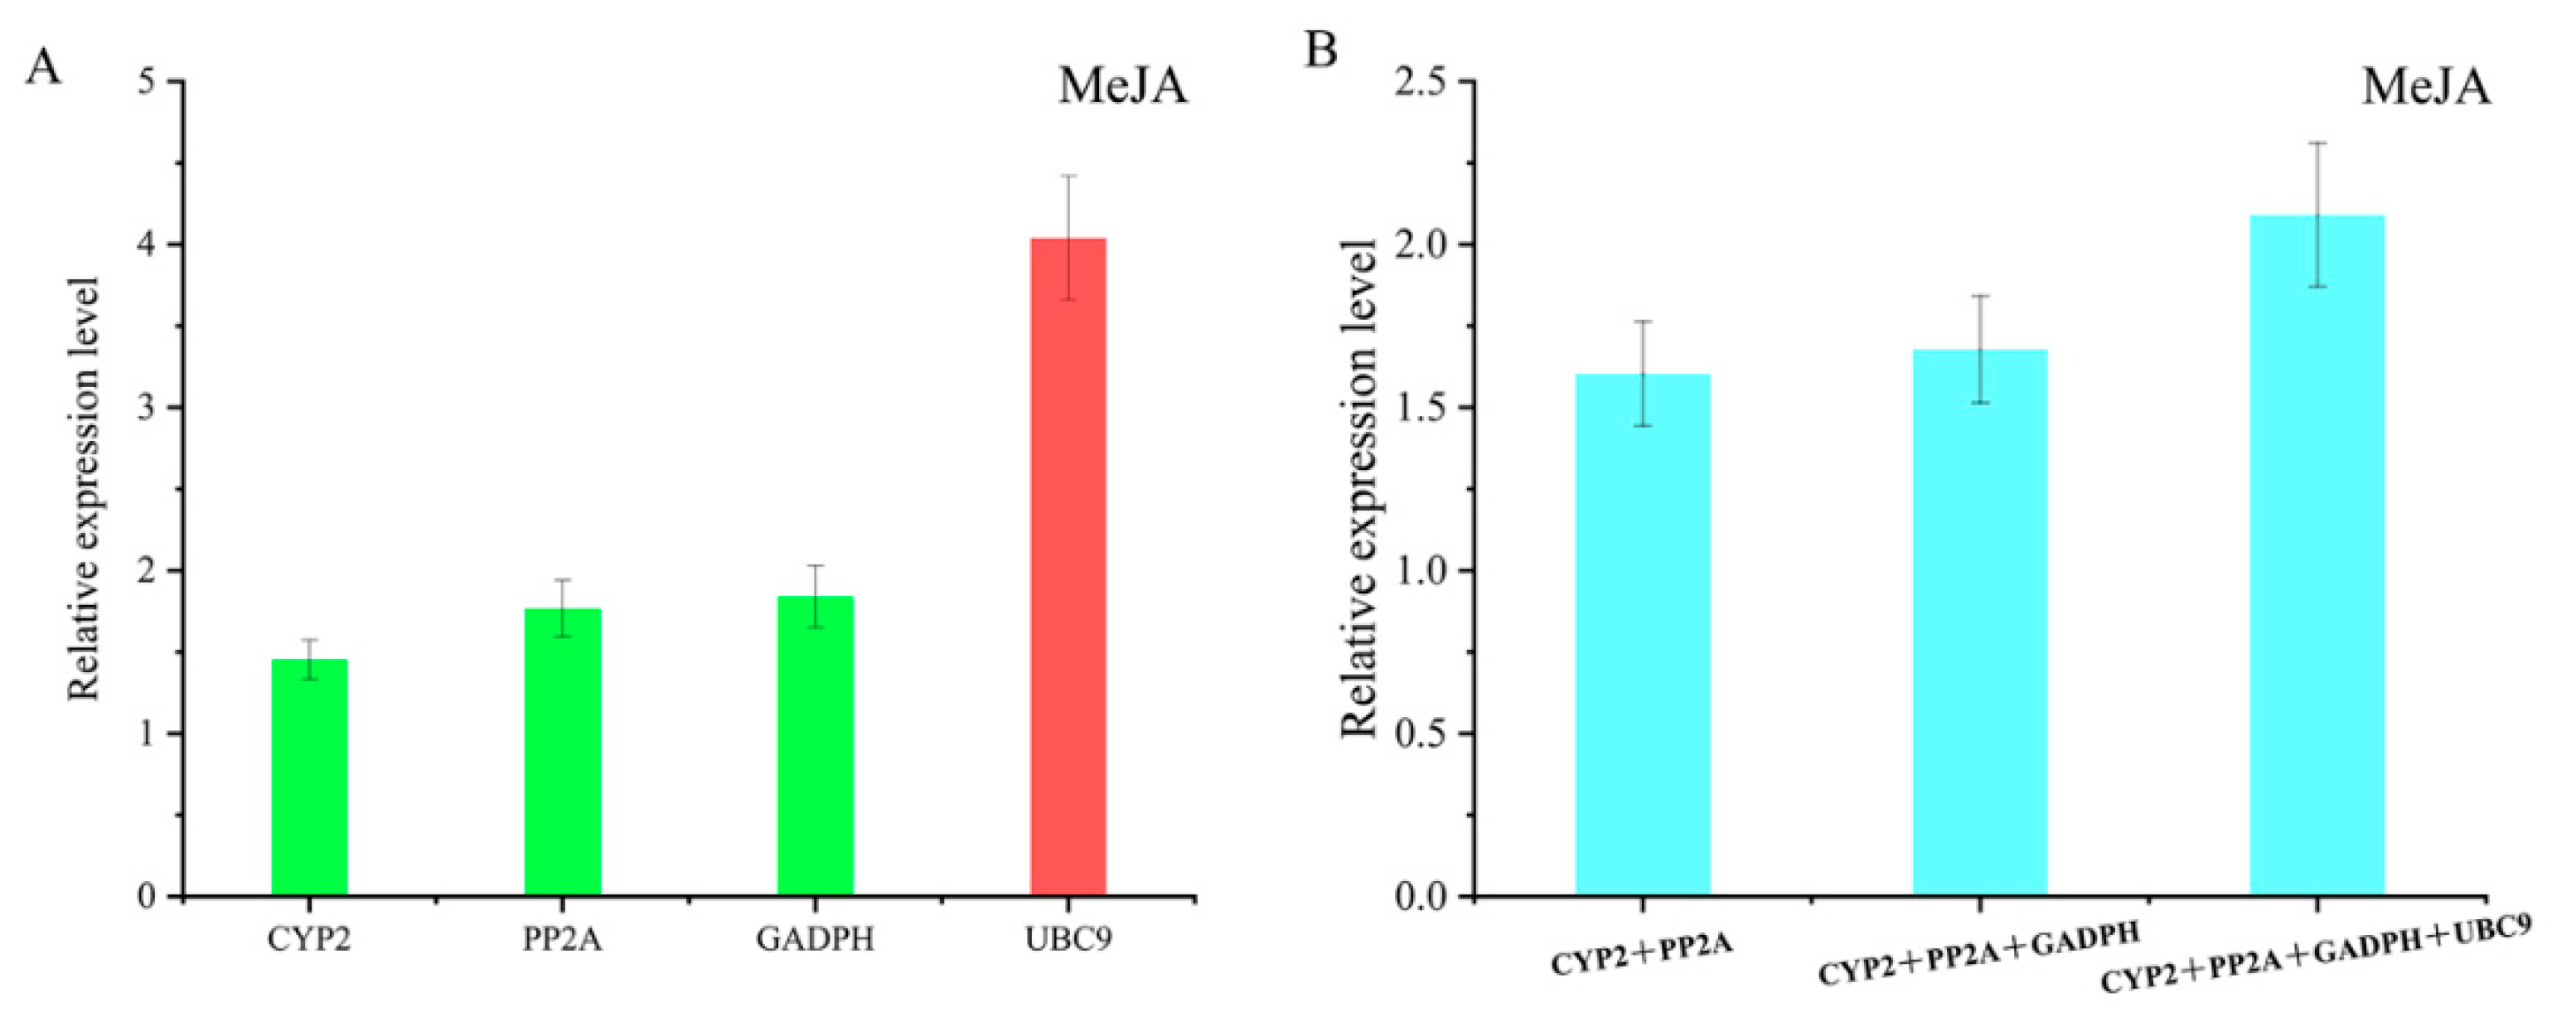
3.4. Comprehensive Analysis and Validation of Reference Genes

To identify the most reliable gene under various environmental conditions, a comprehensive ranking platform RefFinder was performed and the results are listed in Figure 4A. As it is indicated, GAPDH, SNAD, and PP2A were the most stable candidate genes in most situations. However, UBC9, TUBA and EF1-α are considered to be the least stable reference genes. To validate these results, the CV of FPKM (fragments per kilobase of exon model per million mapped fragments) of all selected genes were employed and the results are listed in Figure 4B. In addition, the CV value of FPKM can represent the variability of gene expression. According to Figure 4B, the CV values of SAND, GAPDH, and TIP41 were lower than that of other genes, indicating a more stable expression. In order to further verify the ranking results of the candidate genes under three algorithms, the ACO gene was used as a standard to verify the stability of candidate genes. ACO is a functional enzyme involved in the biosynthesis of ethylene in plants [36]. Ethylene is a kind of plant regulator that can contribute to tolerance under abiotic stresses, which include cold and drought treatments [37,38]. Therefore, ACO can be considered as a constantly expressed gene to validate the candidates we selected. According to Figure 5A, the expression level of ACO was slightly upregulated by using CYP2, PP2A, and GAPDH as reference genes under MeJA treatment. Nevertheless, a significant difference could be observed when UBC9 was used to normalize the expression level of ACO. UBC9 was selected as the unstable gene to perform the validation experiment, as it showed relative instability under all treatments and analysis methods while some other genes, like TUBA and CYP1, were stable under some treatments or analytic methods, even though they may be extremely unstable in most cases. To further validate the selected genes, combinations among the most stable candidate genes were imposed to analyze the expression of ACO, and similar results were exhibited. However, when unstable UBC9 was added to the combination, the results did not show an obvious difference (Figure 5B). According to the results of the geNorm, the optimal number of genes required to combine to achieve precise normalization was obtained. This suggested that UBC9 was not a stable reference gene when used alone, but it could be advised in combination with other reference genes to ensure normalization.

4. Discussion

Quantitative RT-PCR is a commonly and widely used technology with high specificity and sensitivity. It is used for high-throughput analysis of transcript levels and it has a repeated quantitative dynamic range. It plays a crucial part in quantifying the abundance of target genes and increasing the quantitative accuracy of target genes in different species [39,40]. However, erroneous conclusions of targeted gene normalization can be obtained if an inappropriate reference gene is selected [41,42]. Thus, selecting a suitable reference gene is very crucial for target genes’ normalization and data analysis [43]. Validating reference genes under certain environmental treatments and in different species is necessary [44,45]. Though the extract of C. yanhusuo has been used in promoting blood circulation, inhibiting cancer cell proliferation, and as an analgesic agent, no reliable reference genes have been selected in this species [2,16,46]. In order to determine the most reliable reference gene, 12 candidate genes were chosen based on the TAIR dataset and previous research. The Ct values of C. yanhusuo samples pretreated under different abiotic environments were obtained from qRT-PCR and processed by geNorm, NormFinder, and BestKeeper. According to the results of this study, the accuracy of the experimental results can only be guaranteed when reference genes are specifically selected according to different environments. Despite the same raw Ct data being applied to geNorm, NormFinder, and BestKeeper, the rankings of candidate genes were different. NormFinder and geNorm had similar analysis results, such as for PP2A, GAPDH, and YLS8 in the cold group, and PTBP, PP2A, and GAPDH in the PEG group. In addition, in the UV, NaCl, CuSO4, and control groups, both NormFinder and geNorm had similar analysis results in the first three rankings. Nevertheless, in both the hormone treatment and metal treatment groups, NormFinder and BestKeeper showed different results; UBQ10 and TIP41 in NormFinder while EF1-α and SAND in geNorm (Figure 2 and Table 2). The BestKeeper analysis, however, had a very different result from that of NormFinder and geNorm. For example, in the low-temperature treatment group, NormFinder selected PP2A as the best candidate while YLS8 was selected by the BestKeeper analysis. Interestingly, the reference genes selected by BestKeeper under different groups were different from those of NormFinder and geNorm (Figure 2, Table 2 and Table 3). A possible reason for this is that NormFinder and geNorm have similar processing methods and algorithms for raw data while BestKeeper uses CV ± SD to rank the stability.
The major and general functions of reference genes are to take part in the cell expression process and cellular structural components. Genes like 18S rRNA and EF1-α are usually identified as the constantly expressed gene under different pressure conditions [25,47]. However, it has been proven by previous research that reference genes will not always be stalely expressed under certain circumstances or in various species [48,49]. In this experiment, for example, PP2A has been proven as the most stable gene under NaCl and cold treatment while it was unstable under UV treatment, ranking in the middle among all candidate genes. When compared with previous research, similar results were obtained in this study, showing PP2A to be stable under salt treatment and unstable under drought treatment [8]. Beyond that, though GAPDH worked very well under the UV and low-temperature treatment, the same results could not be drawn from MeJA and the control group. Similar results can also be found from the drought group in Salicornia europaea [50]. UBQ10 was the most stable gene in the control group, but it is unstable in lettuce under abscisic acid treatment [51]. GAPDH was demonstrated as the most stable gene by the simulation of UV in C. yanhusuo, but it was reported to be unstable by geNorm analysis under salt treatment in maize [52]. The results of this study and previous research remind us that full consideration of environmental conditions and species should be taken into account when appropriate candidate reference genes are chosen [26]. To determine reliable reference genes under a set of experimental pressures, systematic data analysis is necessary. The most stable reference gene indicated by using each software under certain experimental conditions could be an appropriate choice. However, genes ranked in the second and third position may also have similar stability characteristics, which indicates that not only one internal reference gene could be used for accurate standardization of qRT-PCR in a particular state. For instance, the oxidative, metal, and control groups showed a flat and steady end curve, which means the oxidative, metal, and control groups each have three stable reference genes (Figure 2). In addition, studies have shown that the accurate normalization of target genes may not be guaranteed by only a single reference gene [53,54]. Therefore, in order to solve this problem, it is recommended to use 0.15 as an ideal threshold to determine the number of reference genes required for normalization under various environmental stress conditions [27]. The pairwise variation results are shown in Figure 3, where the V2/V3 values of all samples under various treatments, except metal, are below 0.15, which indicates that two reference genes were enough, and an additional candidate gene was not necessary for accurate quantification. Nevertheless, 0.15 is a reference parameter obtained from previous studies and is a theoretical threshold instead of an absolute value [39].
Considering the most stable genes were different in different situations, a comprehensive ranking platform, RefFinder, was employed to identify the most reliable gene under various environmental conditions. The results display a high consistency to that of the NormFinder, geNorm, BestKeeper, and Ct values (Figure 1, Figure 2, and Figure 4). In addition, the CV values of FPKM of all candidate genes were compared with different groups in RNA-seq data [12]. Interestingly, it also has consistent results with RefFinder, in that GAPDH and SAND are the two most stable reference genes in the two methods. Furthermore, to further validate the selected reference gene, the ACO gene was selected as a standard. According to similar results from previous studies, ACO is very stable and can be slightly regulated [37,38]. Our result is consistent with a previous report using the most stable gene as the reference gene. Using the least stable reference gene would lead to a significantly different result, in which the expression of ACO is very high. It shows that the stability and abundance of the reference gene not only affects the normalization results but also indicates that the stability of the reference gene needs to be evaluated before being used for a set of samples.

5. Conclusions

In conclusion, six candidate genes were obtained by comparing them with previous studies, and the remaining six candidate reference genes were selected according to the TAIR database. All candidate reference genes were pretreated under eight different treatments to select the most reliable one. The experimental results showed that the candidate reference genes had different stabilities under different treatments, and different algorithms also showed slightly different results. Generally speaking, in most situations, GAPDH, SNAD, and PP2A were the most stable candidate genes that could be used for normalization. In addition, UBC9, TUBA, and EF1-α can be considered as the least stable reference genes among the 12 candidates. The optimal number of reference genes needed for normalization was also evaluated by geNorm and the results indicated that, in most treatments, one reference gene is enough for normalization. Beyond that, the evaluation was performed by comparing the analyses with the RNA-seq-based expression profile to verify the experimental results, and ACO was also used to verify the reliability of the rankings of all candidate reference genes. In general, the result of this research can benefit studies that require accurate quantification of gene expression in C. yanhusuo, and it can also provide guidelines for researchers who aim to seek out the best reference genes in other plants.

Supplementary Materials

The following are available online at https://www.mdpi.com/2073-4425/11/2/130/s1, Figure S1: The melting cures of 12 candidate reference genes, Table S1: The details of 12 selected candidate reference genes, Table S2: The raw Ct values of 12 candidate reference genes with three biological and technical replicates, Table S3: The Vn/Vn+1 information obtained from geNorm.

Author Contributions

Conceptualization Z.B. and S.N.; methodology, Z.B. and S.N.; formal analysis, K.Z.; investigation, C.L., X.Z. and J.W.; writing—original draft preparation, K.Z. and Z.B.; writing—review and editing, K.Z. and H.L.; funding acquisition, Z.B. and S.N. All authors have read and agreed to the published version of the manuscript.

Funding

This project is funded by Qingnian project of excellent teaching team in Jiangsu and teaching and research project of Jiangsu Health Vocational College (JKKYTD201701, JKA201812). This work is also funded by Practical Training Program for Young Teachers in Higher Vocational Colleges in Jiangsu Province (2019QYSJPX171) and Natural Science Foundation of the Jiangsu Higher Education Institutions of China (19KJD430005).

Conflicts of Interest

The authors declare no conflict of interest. The funders had no role in the design of the study; in the collection, analyses, or interpretation of data; in the writing of the manuscript, or in the decision to publish the results.

References

  1. Wang, J.B.; Mantsch, J.R. l-tetrahydropalamatine: A potential new medication for the treatment of cocaine addiction. Future Med. Chem. 2012, 4, 177–186. [Google Scholar] [CrossRef] [Green Version]
  2. Kim, Y.J.; Lim, H.S.; Kim, Y.; Lee, J.; Kim, B.Y.; Jeong, S.J. Neuroprotective effect of Corydalis ternata extract and its phytochemical quantitative analysis. Chem. Pharm. Bull. (Tokyo) 2017, 65, 826–832. [Google Scholar] [CrossRef] [PubMed] [Green Version]
  3. Gao, J.L.; Shi, J.M.; Lee, S.M.; Zhang, Q.W.; Wang, Y.T. Angiogenic pathway inhibition of Corydalis yanhusuo and berberine in human umbilical vein endothelial cells. Oncol. Res. 2009, 17, 519–526. [Google Scholar] [CrossRef] [PubMed]
  4. Wang, L.; Zhang, Y.; Wang, Z.; Gong, N.; Kweon, T.D.; Vo, B.; Wang, C.; Zhang, X.; Chung, J.Y.; Alachkar, A.; et al. The antinociceptive properties of the Corydalis yanhusuo extract. PLoS ONE 2016, 11, e0162875. [Google Scholar] [CrossRef] [PubMed]
  5. Zhang, Y.; Wang, C.; Wang, L.; Parks, G.S.; Zhang, X.; Guo, Z.; Ke, Y.; Li, K.W.; Kim, M.K.; Vo, B.; et al. A novel analgesic isolated from a traditional Chinese medicine. Curr. Biol. 2014, 24, 117–123. [Google Scholar] [CrossRef] [PubMed] [Green Version]
  6. Han, Y.; Zhang, W.; Tang, Y.; Bai, W.; Yang, F.; Xie, L.; Li, X.; Zhou, S.; Pan, S.; Chen, Q.; et al. l-Tetrahydropalmatine, an active component of Corydalis yanhusuo W.T. Wang, protects against myocardial ischaemia-reperfusion injury in rats. PLoS ONE 2012, 7, e38627. [Google Scholar] [CrossRef] [PubMed] [Green Version]
  7. Yang, W.; Zhang, Y.; Wu, W.; Huang, L.; Guo, D.; Liu, C. Approaches to establish Q-markers for the quality standards of traditional Chinese medicines. Acta Pharm. Sin. B 2017, 7, 439–446. [Google Scholar] [CrossRef] [PubMed]
  8. Wang, Z.; Xu, J.; Liu, Y.; Chen, J.; Lin, H.; Huang, Y.; Bian, X.; Zhao, Y. Selection and validation of appropriate reference genes for real-time quantitative PCR analysis in Momordica charantia. Phytochemistry 2019, 164, 1–11. [Google Scholar] [CrossRef]
  9. De Magalhães, J.P.; Finch, C.E.; Janssens, G. Next-generation sequencing in aging research: Emerging applications, problems, pitfalls and possible solutions. Ageing Res. Rev. 2010, 9, 315–323. [Google Scholar]
  10. Stone, J.D.; Storchova, H. The application of RNA-seq to the comprehensive analysis of plant mitochondrial transcriptomes. Mol. Genet. Genom. 2015, 290, 1–9. [Google Scholar] [CrossRef]
  11. Bustin, S. Quantification of mRNA using real-time reverse transcription PCR (RT-PCR): Trends and problems. J. Mol. Endocrinol. 2002, 29, 23–39. [Google Scholar] [CrossRef] [PubMed]
  12. Ferdous, J.; Li, Y.; Reid, N.; Langridge, P.; Shi, B.-J.; Tricker, P.J. Identification of reference genes for quantitative expression analysis of microRNAs and mRNAs in barley under various stress conditions. PLoS ONE 2015, 10, e0118503. [Google Scholar] [CrossRef] [Green Version]
  13. Thellin, O.; Zorzi, W.; Lakaye, B.; De Borman, B.; Coumans, B.; Hennen, G.; Grisar, T.; Igout, A.; Heinen, E. Housekeeping genes as internal standards: Use and limits. J. Biotechnol. 1999, 75, 291–295. [Google Scholar] [CrossRef] [Green Version]
  14. Goidin, D.; Mamessier, A.; Staquet, M.-J.; Schmitt, D.; Berthier-Vergnes, O. Ribosomal 18S RNA prevails over glyceraldehyde-3-phosphate dehydrogenase and β-actin genes as internal standard for quantitative comparison of mRNA levels in invasive and noninvasive human melanoma cell subpopulations. Anal. Biochem. 2001, 295, 17–21. [Google Scholar] [CrossRef] [PubMed] [Green Version]
  15. Zhu, L.-j.; Altmann, S.W. mRNA and 18S–RNA coapplication–reverse transcription for quantitative gene expression analysis. Anal. Biochem. 2005, 345, 102–109. [Google Scholar] [CrossRef]
  16. Vandesompele, J.; De Preter, K.; Pattyn, F.; Poppe, B.; Van Roy, N.; De Paepe, A.; Speleman, F. Accurate normalization of real-time quantitative RT-PCR data by geometric averaging of multiple internal control genes. Genome Biol. 2002, 3. research0034.1-0034.11. [Google Scholar] [CrossRef] [Green Version]
  17. Czechowski, T.; Stitt, M.; Altmann, T.; Udvardi, M.K.; Scheible, W.-R. Genome-wide identification and testing of superior reference genes for transcript normalization in Arabidopsis. Plant Physiol. 2005, 139, 5–17. [Google Scholar] [CrossRef] [Green Version]
  18. Meng, Y.; Moscou, M.J.; Wise, R.P. Blufensin1 negatively impacts basal defense in response to barley powdery mildew. Plant Physiol. 2009, 149, 271–285. [Google Scholar] [CrossRef] [Green Version]
  19. Expósito-Rodríguez, M.; Borges, A.A.; Borges-Pérez, A.; Pérez, J.A. Selection of internal control genes for quantitative real-time RT-PCR studies during tomato development process. BMC Plant Biol. 2008, 8, 131. [Google Scholar]
  20. Jian, B.; Liu, B.; Bi, Y.; Hou, W.; Wu, C.; Han, T. Validation of internal control for gene expression study in soybean by quantitative real-time PCR. BMC Mol. Biol. 2008, 9, 59. [Google Scholar] [CrossRef] [Green Version]
  21. Li, Q.Q.; Skinner, J.; Bennett, J.E. Evaluation of reference genes for real-time quantitative PCR studies in Candida glabrata following azole treatment. BMC Mol. Biol. 2012, 13, 22. [Google Scholar] [CrossRef] [PubMed] [Green Version]
  22. Jin, Y.; Liu, F.; Huang, W.; Sun, Q.; Huang, X. Identification of reliable reference genes for qRT-PCR in the ephemeral plant Arabidopsis pumila based on full-length transcriptome data. Sci. Rep. 2019, 9, 8408. [Google Scholar] [CrossRef] [PubMed]
  23. Maroufi, A.; Van Bockstaele, E.; De Loose, M. Validation of reference genes for gene expression analysis in chicory (Cichorium intybus) using quantitative real-time PCR. BMC Mol. Biol. 2010, 11, 15. [Google Scholar] [CrossRef] [Green Version]
  24. Hoogewijs, D.; Houthoofd, K.; Matthijssens, F.; Vandesompele, J.; Vanfleteren, J.R. Selection and validation of a set of reliable reference genes for quantitative sod gene expression analysis in C. elegans. BMC Mol. Biol. 2008, 9, 9. [Google Scholar] [CrossRef] [PubMed] [Green Version]
  25. Iskandar, H.M.; Simpson, R.S.; Casu, R.E.; Bonnett, G.D.; Maclean, D.J.; Manners, J.M. Comparison of reference genes for quantitative real-time polymerase chain reaction analysis of gene expression in sugarcane. Plant Mol. Biol. Rep. 2004, 22, 325–337. [Google Scholar] [CrossRef]
  26. Wang, F.; Yang, Q.-w.; Zhao, W.-J.; Du, Q.-Y.; Chang, Z.-J. Selection of suitable candidate genes for miRNA expression normalization in Yellow River Carp (Cyprinus carpio. var). Sci. Rep. 2019, 9, 8691. [Google Scholar] [CrossRef] [PubMed]
  27. Robledo, D.; Hernández-Urcera, J.; Cal, R.M.; Pardo, B.G.; Sánchez, L.; Martínez, P.; Viñas, A. Analysis of qPCR reference gene stability determination methods and a practical approach for efficiency calculation on a turbot (Scophthalmus maximus) gonad dataset. BMC Gen. 2014, 15, 648. [Google Scholar] [CrossRef] [Green Version]
  28. Livak, K.J.; Schmittgen, T.D. Analysis of relative gene expression data using real-time quantitative PCR and the 2−ΔΔCT method. Methods 2001, 25, 402–408. [Google Scholar] [CrossRef]
  29. Nguyen, D.Q.; Eamens, A.L.; Grof, C.P. Reference gene identification for reliable normalisation of quantitative RT-PCR data in Setaria viridis. Plant Methods 2018, 14, 24. [Google Scholar] [CrossRef]
  30. Sun, H.; Jiang, X.; Sun, M.; Cong, H.; Qiao, F. Evaluation of reference genes for normalizing RT-qPCR in leaves and suspension cells of Cephalotaxus hainanensis under various stimuli. Plant Methods 2019, 15, 31. [Google Scholar] [CrossRef] [Green Version]
  31. Ramakers, C.; Ruijter, J.M.; Deprez, R.H.L.; Moorman, A.F. Assumption-free analysis of quantitative real-time polymerase chain reaction (PCR) data. Neurosci. Lett. 2003, 339, 62–66. [Google Scholar] [CrossRef]
  32. Ruijter, J.; Ramakers, C.; Hoogaars, W.; Karlen, Y.; Bakker, O.; Van den Hoff, M.; Moorman, A. Amplification efficiency: Linking baseline and bias in the analysis of quantitative PCR data. Nucl. Acids Res. 2009, 37, e45. [Google Scholar] [CrossRef] [PubMed] [Green Version]
  33. Pfaffl, M.W.; Tichopad, A.; Prgomet, C.; Neuvians, T.P. Determination of stable housekeeping genes, differentially regulated target genes and sample integrity: BestKeeper–Excel-based tool using pair-wise correlations. Biotechnol. Lett. 2004, 26, 509–515. [Google Scholar] [CrossRef] [PubMed]
  34. Ramadoss, N.; Gupta, D.; Vaidya, B.N.; Joshee, N.; Basu, C. Functional characterization of 1-aminocyclopropane-1-carboxylic acid oxidase gene in Arabidopsis thaliana and its potential in providing flood tolerance. Biochem. Biophys. Res. Commun. 2018, 503, 365–370. [Google Scholar] [CrossRef] [PubMed]
  35. Andersen, C.L.; Jensen, J.L.; Ørntoft, T.F. Normalization of real-time quantitative reverse transcription-PCR data: A model-based variance estimation approach to identify genes suited for normalization, applied to bladder and colon cancer data sets. Cancer Res. 2004, 64, 5245–5250. [Google Scholar] [CrossRef] [Green Version]
  36. Ma, R.; Xu, S.; Zhao, Y.; Xia, B.; Wang, R. Selection and validation of appropriate reference genes for quantitative real-time PCR analysis of gene expression in Lycoris aurea. Front. Plant Sci. 2016, 7, 536. [Google Scholar] [CrossRef] [Green Version]
  37. Iqbal, N.; Khan, N.A.; Ferrante, A.; Trivellini, A.; Francini, A.; Khan, M. Ethylene role in plant growth, development and senescence: interaction with other phytohormones. Front. Plant Sci. 2017, 8, 475. [Google Scholar] [CrossRef] [Green Version]
  38. Sun, X.; Zhao, T.; Gan, S.; Ren, X.; Fang, L.; Karungo, S.K.; Wang, Y.; Chen, L.; Li, S.; Xin, H. Ethylene positively regulates cold tolerance in grapevine by modulating the expression of ETHYLENE RESPONSE FACTOR 057. Sci. Rep. 2016, 6, 24066. [Google Scholar] [CrossRef]
  39. Tian, C.; Jiang, Q.; Wang, F.; Wang, G.-L.; Xu, Z.-S.; Xiong, A.-S. Selection of suitable reference genes for qPCR normalization under abiotic stresses and hormone stimuli in carrot leaves. PLoS ONE 2015, 10, e0117569. [Google Scholar] [CrossRef] [Green Version]
  40. Gu, C.; Chen, S.; Liu, Z.; Shan, H.; Luo, H.; Guan, Z.; Chen, F. Reference gene selection for quantitative real-time PCR in Chrysanthemum subjected to biotic and abiotic stress. Mol. Biotechnol. 2011, 49, 192. [Google Scholar] [CrossRef]
  41. Li, J.; Jia, H.; Han, X.; Zhang, J.; Sun, P.; Lu, M.; Hu, J. Selection of reliable reference genes for gene expression analysis under abiotic stresses in the desert biomass willow, Salix psammophila. Front. Plant Sci. 2016, 7, 1505. [Google Scholar] [CrossRef] [PubMed] [Green Version]
  42. Gutierrez, L.; Mauriat, M.; Guénin, S.; Pelloux, J.; Lefebvre, J.F.; Louvet, R.; Rusterucci, C.; Moritz, T.; Guerineau, F.; Bellini, C. The lack of a systematic validation of reference genes: a serious pitfall undervalued in reverse transcription-polymerase chain reaction (RT-PCR) analysis in plants. Plant Biotechnol. J. 2008, 6, 609–618. [Google Scholar] [CrossRef] [PubMed] [Green Version]
  43. Zhu, J.; Zhang, L.; Li, W.; Han, S.; Yang, W.; Qi, L. Reference gene selection for quantitative real-time PCR normalization in Caragana intermedia under different abiotic stress conditions. PLoS ONE 2013, 8, e53196. [Google Scholar] [CrossRef] [PubMed] [Green Version]
  44. Li, M.-Y.; Wang, F.; Jiang, Q.; Ma, J.; Xiong, A.-S. Identification of SSRs and differentially expressed genes in two cultivars of celery (Apium graveolens L.) by deep transcriptome sequencing. Horticult. Res. 2014, 1, 10. [Google Scholar] [CrossRef] [PubMed] [Green Version]
  45. Liao, D.; Wang, P.; Jia, C.; Sun, P.; Qi, J.; Zhou, L.; Li, X.E. Identification and developmental expression profiling of putative alkaloid biosynthetic genes in Corydalis yanhusuo bulbs. Sci. Rep. 2016, 6, 19460. [Google Scholar] [CrossRef] [PubMed] [Green Version]
  46. Chandna, R.; Augustine, R.; Bisht, N.C. Evaluation of candidate reference genes for gene expression normalization in Brassica juncea using real time quantitative RT-PCR. PLoS ONE 2012, 7, e36918. [Google Scholar] [CrossRef]
  47. Mizoi, J.; Shinozaki, K.; Yamaguchi-Shinozaki, K. AP2/ERF family transcription factors in plant abiotic stress responses. Biochim. Biophys. Acta 2012, 1819, 86–96. [Google Scholar] [CrossRef]
  48. Silver, N.; Best, S.; Jiang, J.; Thein, S.L. Selection of housekeeping genes for gene expression studies in human reticulocytes using real-time PCR. BMC Mol. Biol. 2006, 7, 33. [Google Scholar] [CrossRef] [Green Version]
  49. Ohl, F.; Jung, M.; Xu, C.; Stephan, C.; Rabien, A.; Burkhardt, M.; Nitsche, A.; Kristiansen, G.; Loening, S.A.; Radonić, A. Gene expression studies in prostate cancer tissue: Which reference gene should be selected for normalization? J. Mol. Med. 2005, 83, 1014–1024. [Google Scholar] [CrossRef]
  50. Xiao, X.; Ma, J.; Wang, J.; Wu, X.; Li, P.; Yao, Y. Validation of suitable reference genes for gene expression analysis in the halophyte Salicornia europaea by real-time quantitative PCR. Front. Plant Sci. 2015, 5, 788. [Google Scholar] [CrossRef] [Green Version]
  51. Borowski, J.M.; Galli, V.; da Silva Messias, R.; Perin, E.C.; Buss, J.H.; e Silva, S.D.d.A.; Rombaldi, C.V. Selection of candidate reference genes for real-time PCR studies in lettuce under abiotic stresses. Planta 2014, 239, 1187–1200. [Google Scholar] [CrossRef] [PubMed]
  52. Galli, V.; da Silva Messias, R.; e Silva, S.D.d.A.; Rombaldi, C.V. Selection of reliable reference genes for quantitative real-time polymerase chain reaction studies in maize grains. Plant Cell Rep. 2013, 32, 1869–1877. [Google Scholar] [CrossRef] [PubMed] [Green Version]
  53. Veazey, K.J.; Golding, M.C. Selection of stable reference genes for quantitative RT-PCR comparisons of mouse embryonic and extra-embryonic stem cells. PLoS ONE 2011, 6, e27592. [Google Scholar] [CrossRef] [PubMed] [Green Version]
  54. Wang, Z.; Gerstein, M.; Snyder, M. RNA-Seq: A revolutionary tool for transcriptomics. Nat. Rev. Gen. 2009, 10, 57. [Google Scholar] [CrossRef]
Figure 1. The raw cycle threshold (Ct) values of all candidate reference genes. The boxes show two interquartile values. Whisker caps denote the maximum and minimum Ct values. Medians and means are indicated by the lines and squares, respectively.
Genes 11 00130 g001
Figure 2. The rankings of the average expression stability (M) of 12 candidate reference genes in C. yanhusuo under 8 different treatments calculated by geNorm. The expression stability is assessed by the expression stability value (M).
Genes 11 00130 g002
Figure 3. The pairwise variation values of all candidates calculated by geNorm. Different colors represent different ways of treatments. The lower the value, the better the stability of the combination. The cut-off value for assessing the number of candidate reference genes needed for qRT-PCR normalization is 0.15.
Genes 11 00130 g003
Figure 4. The order of stability of candidate genes by RefFinder and CV of FPKM (fragments per kilobase of exon model per million mapped fragments) in RNA-seq. (A) The order of stability of candidate genes by RefFinder (B) The order of stability of candidate genes by CV of FPKM. Lower CV values indicate more stable gene expression.
Genes 11 00130 g004
Figure 5. Relative expression level of ACO normalized by identified reference genes under methyl jasmonate (MeJA) treatment. (A) Expression level was normalized by the most stable reference genes and least stable gene (B) Expression level normalized by combinations. Data were exhibited as means ± SEM (n = 3).
Genes 11 00130 g005
Table 1. Candidate genes and primer pairs used for qRT-PCR in Corydalis yanhusuo.
Gene symbolDescription Gene IDArabidopsis
Homolog Locus
Primer Sequence Forward/Reverse
(5′–3′)
Length (bp)PCR EfficiencyR2
CYP2Cyclophilin 2XP_008340167.1AT4G33060F: TGGTGCATCACTTGCTATGG
R: GTTGTTTGGCTCCACCACTA
1641.848 0.960
EF1-αElongation factor 1-αXP_018856763.1AT1G07920F: CTGCCCCTTCAGGATGTTTA
R: GCCTCGTGATGCATTTCAAC
1521.803 0.881
PP2ASerine/threonine-protein phosphatase PP2AOVA18136.1ATG59830F: TCCCCATCTATCGAGACCCT
R: GTCCTGGCCAAATGTGTATC
1241.8280.960
PTBPPolypyrimidine tract-binding proteinOVA06588.1AT3G01150F: AGCCAGGGCAGTTGCTTATC
R: CCAGGACAGTGCATCTTTCG
1341.7990.841
SANDSAND family proteinXP_010260994.1AT2G28390F: AGATGGTGGCCTACGTGTTG
R: GCCAATGTCAGCTTCCTTGA
1301.8581.000
TIP41TIP41-like proteinXP_010260049.1AT4G34270F: GTCATGCCGAGTTGTTGGTT
R: AAATGTGGCTTCTCTCCAGC
1531.7960.841
UBC9Ubiquitin-conjugating enzyme 9OVA15929.1AT4G27960F: TGGCAAGCAACAATTATGGG
R: GCAGATGCTTCCATTGCTGT
1591.7880.841
UBQ10Ubiquitin-conjugating enzyme 10XP_010261482.1AT4G05320F: CATCCAGAAGGAGTCTACCC
R: AGCTTTCACGTTATCAATCG
1401.8150.960
CYP1Cyclophilin 1AAN31845.1AT2G16600F: TTCCAAAGTTTCAGAGTCCC
R: CATGTGCTTGGGATTCAATC
1361.7470.907
TUBATubulin betaOVA16215.1AT5G12250F: TTGACCTCTGCTTAGACCGC
R: GTGAACCCAATCCAGAACCA
1111.598 0.676
YLS8Mitosis proteinKJB77370.1AT5G08290F: ACTTGTCGTAATTCGGTTCG
R: CAACAAGGTAGATCACCGCA
1241.7650.815
GAPDHGlyceraldehyde-3-phosphate dehydrogenaseXP_010941981.2AT1G42970F: CAAGGTCATCAACGACAGGT
R: TGCTGCTGGGAATGATGTTG
1491.8601.000
Table 2. The stability of the candidate genes expression calculated by NormFinder software.
RankMeJAUVNaClCuSO4H2O2ColdPEGControl
1UBQ10
0.024
GAPDH
0.147
PP2A
0.042
TIP41
0.185
CYP2
0.039
PP2A
0.097
PTBP
0.100
UBQ10
0.168
2PTBP
0.054
EF1-α
0.173
EF1-α
0.063
SAND
0.187
GAPDH
0.055
GAPDH
0.134
PP2A
0.114
SAND
0.183
3GAPDH
0.101
UBC9
0.199
CYP2
0.200
GAPDH
0.207
PP2A
0.076
YLS8
0.182
GAPDH
0.130
PP2A
0.190
4EF1-α
0.156
TIP41
0.207
SAND
0.210
EF1-α
0.382
EF1-α
0.140
SAND
0.267
SAND
0.166
PTBP
0.205
5PP2A
0.230
UBQ10
0.220
TIP41
0.217
CYP2
0.531
SAND
0.183
UBQ10
0.277
CYP2
0.196
YLS8
0.216
6UBC9
0.240
CYP2
0.278
GAPDH
0.246
YLS8
0.555
TIP41
0.193
TIP41
0.293
EF1-α
0.229
CYP2
0.230
7TIP41
0.251
SAND
0.280
YLS8
0.267
UBC9
0.781
PTBP
0.218
CYP2
0.346
YLS8
0.264
EF1-α
0.236
8CYP1
0.306
PP2A
0.317
PTBP
0.308
UBQ10
0.798
YLS8
0.276
UBC9
0.515
CYP1
0.274
GAPDH
0.270
9SAND
0.339
PTBP
0.351
UBC9
0.371
PTBP
0.961
UBQ10
0.285
PTBP
0.557
UBQ10
0.287
UBC9
0.313
10CYP2
0.403
YLS8
0.406
UBQ10
0.372
PP2A
0.969
UBC9
0.339
EF1-α
0.559
TIP41
0.307
TIP41
0.373
11YLS8
0.502
CYP1
0.503
CYP1
0.430
CYP1
1.213
CYP1
0.526
CYP1
0.605
UBC9
0.330
CYP1
0.420
12TUBA
0.797
TUBA
0.527
TUBA
0.626
TUBA
1.782
TUBA
0.925
TUBA
0.871
TUBA
0.476
TUBA
0.985
Table 3. The stability of the candidate genes expression calculated by BestKeeper software.
RankMeJAUVNaClCuSO4H2O2ColdPEGControl (H2O)
1UBC9YLS8SANDYLS8SANDYLS8PP2ATIP41
CV ± SD1.77 ± 0.381.50 ± 0.321.09 ± 0.232.25 ± 0.430.85 ± 0.180.86 ± 0.191.26 ± 0.246.15 ± 1.40
2CYP1UBC9YLS8GAPDHYLS8TIP41TIP41TUBA
CV ± SD1.95 ± 0.351.50 ± 0.361.10 ± 0.222.28 ± 0.400.94 ± 0.191.29 ± 0.311.40 ± 0.336.64 ± 1.88
3PTBPCYP1PP2ASANDEF1-αUBC9PTBPEF1-α
CV ± SD2.08 ± 0.411.55 ± 0.281.47 ± 0.262.82 ± 0.581.32 ± 0.301.96 ± 0.481.44 ± 0.307.06 ± 1.67
4YLS8UBQ10EF1-αTIP41TIP41GAPDHSANDUBC9
CV ± SD2.12 ± 0.432.22 ± 0.421.48 ± 0.322.82 ± 0.591.50 ± 0.322.14 ± 0.431.50 ± 0.327.56 ± 1.68
5TIP41TIP41TIP41UBC9PTBPPP2ACYP1GAPDH
CV ± SD2.21 ± 0.482.31 ± 0.51.61 ± 0.353.80 ± 0.751.61 ± 0.312.17 ± 0.461.65 ± 0.287.97 ± 1.63
6GAPDHCYP2UBQ10EF1-αCYP2PTBPYLS8PTBP
CV ± SD2.24 ± 0.412.32 ± 0.411.74 ± 0.333.94 ± 0.831.76 ± 0.322.28 ± 0.521.84 ± 0.388.20 ± 1.70
7EF1-αTUBAPTBPUBQ10PP2ATUBAEF1-αSAND
CV ± SD2.24 ± 0.502.42 ± 0.542.38 ± 0.445.10 ± 0.922.05 ± 0.362.74 ± 0.742.11 ± 0.448.27 ± 1.86
8UBQ10EF1-αCYP1PTBPCYP1SANDUBQ10UBQ10
CV ± SD2.43 ± 0.472.73 ± 0.542.43 ± 0.405.72 ± 1.102.09 ± 0.362.75 ± 0.632.13 ± 0.388.29 ± 1.68
9SANDGAPDHGAPDHTUBAGAPDHCYP2TUBACYP1
CV ± SD3.18 ± 0.662.82 ± 0.522.60 ± 0.475.89 ± 1.492.37 ± 0.422.91 ± 0.622.24 ± 0.628.67 ± 1.63
10PP2ASANDCYP2CYP1UBQ10UBQ10GAPDHYLS8
CV ± SD3.40 ± 0.603.13 ± 0.692.66 ± 0.466.00 ± 1.023.35 ± 0.613.16 ± 0.652.28 ± 0.429.21 ± 2.01
11CYP2PTBPTUBACYP2UBC9EF1-αUBC9PP2A
CV ± SD3.50 ± 0.613.42 ± 0.702.68 ± 0.736.00 ± 1.063.36 ± 0.704.15 ± 0.852.32 ± 0.479.90 ± 1.96
12TUBAPP2AUBC9PP2ATUBACYP1CYP2CYP2
CV ± SD4.23 ± 1.023.59 ± 0.663.18 ± 0.666.93 ± 1.244.51 ± 1.234.49 ± 0.802.66 ± 0.4910.26 ± 2.0
CV: the coefficient of variance expressed as a percentage on the CP level; SD: the standard deviation of the CP.

