Article

Selection and Validation of Reference Genes for qRT-PCR in Lentinula edodes under Different Experimental Conditions

1
Institute of Applied Mycology, College of Plant Science and Technology, Huazhong Agricultural University, Wuhan, Hubei 430070, China
2
State Key Laboratory of Applied Microbiology Southern China, Guangdong Provincial Key Laboratory of Microbial Culture Collection and Application, Guangdong Open Laboratory of Applied Microbiology, Guangdong Institute of Microbiology, Guangzhou 510070, China
*
Author to whom correspondence should be addressed.
Genes 2019, 10(9), 647; https://doi.org/10.3390/genes10090647
Submission received: 17 July 2019 / Revised: 17 August 2019 / Accepted: 22 August 2019 / Published: 27 August 2019
(This article belongs to the Section Plant Genetics and Genomics)

Abstract

:
Lentinula edodes is the most consumed mushroom in Asia due to its nutritional and medicinal values, and the optimal reference gene is crucial for normalization of its gene expression analysis. Here, the expression stability of 18 candidate reference genes (CRGs) in L. edodes was analyzed by three statistical algorithms (geNorm, NormFinder and BestKeeper) under different stresses (heat, cadmium excess and Trichoderma atroviride infection), different substrates (straw, sawdust and corn stalk) and different development stages (mycelia, primordia and fruit bodies). Among the 18 CRGs, 28S, Actin and α-tub exhibited the highest expression stability in L. edodes under all conditions, while GPD, SPRYP and MSF showed the least stable expression. The best reference gene in different conditions was different. The pairwise variation values showed that two genes would be sufficient for accurate normalization under different conditions of L. edodes. This study will contribute to more accurate estimation of the gene relative expression levels under different conditions using the optimal reference gene in qRT-PCR (quantitative reverse transcription polymerase chain reaction) analysis.

1. Introduction

With the advantages of high sensitivity and repeatability as well as dynamic quantification range, quantitative reverse transcription polymerase chain reaction (qRT-PCR) is widely used to analyze and validate the expression of target genes [1,2,3]. Nevertheless, the results of qRT-PCR were usually not accurate because of errors caused by many factors such as the efficiency of complementary DNA (cDNA) synthesis and amplification, gene expression normalization, and so on [4,5]. In order to minimize those errors, one or more genes which are usually stably expressed in any experimental conditions are applied in qRT-PCR analysis [5,6]. However, the increasing evidence demonstrated that the expression levels of many tested internal genes in plants and animals as well as fungi were relatively constant only in specific cells or experimental conditions [7,8,9]. The application of unstable internal reference genes will result in significant variations or differences in the qRT-PCR results [10]. Hence, it is necessary to identify and analyze the stability of the reference genes under different conditions to guarantee the accuracy and reliability of qRT-PCR results.
For hundreds of years, Lentinula edodes has been used as decoctions and essences or as alternative medicine in many Asian countries such as China, Korea, Japan, etc. [11]. In addition, L. edode is the most widely cultivated edible fungi in the world because of its nutritional properties and effective bioconversion of agricultural wastes [12,13]. As a white-rot fungus, the genes in L. edodes were identified to encode high-efficiency extracellular enzymes, including laccases and peroxidases as well as lignocellulose enzymes [14,15,16], suggesting the potential application of L. edodes in many bioremediation processes in the future. Omics analysis and genetic transformation have obtained some significant achievements in L. edodes [17,18,19,20,21]. These results can be used to select and validate the suitable reference genes for further analysis of qRT-PCR results in metabolite biosynthesis and signal transduction pathways. As a matter of fact, qRT-PCR has been widely used to dissect the expression levels of mushroom genes under different conditions [22,23,24,25]. In terms of L. edodes, β-tub was the most stable reference gene for the mycelia under 37 °C high-temperature stress [26], and 18S and Rpl4 were the most stable reference genes for different development stages and under various nutrient conditions, respectively [27]. Nevertheless, the candidate reference genes with relatively constant expression levels under biotic and abiotic stresses and different substrates have not been reported systematically in L. edodes.
Heat stress dramatically affects the protein stability, cytoskeleton structure, metabolite biosynthesis, cell membrane and cell integrity in organisms [28,29]. At an ambient temperature higher than 23 °C, pileus size and production of Agaricus bisporus fruiting bodies were dramatically decreased [30]. In the presence of high temperatures, the mycelial viability of L. edodes becomes weak, leading to areas of rotted logs or bags induced by pathogens like Trichoderma sp. and a big loss in production and quality [31,32]. L. edodes has higher capacity than plants and animal-derived food in absorbing Cd ion, and the mechanisms for how to remove Cd ion have been reported in several studies [33,34]. However, the molecular mechanism for the response of L. edodes to abiotic and biotic stresses as well as different substrates remains unclear. In order to understand this mechanism, it is necessary to select and validate the most suitable reference genes for gene expression analysis under different biotic and abiotic stresses as well as substrates.
In this study, eighteen candidate reference genes (CRGs) were systematically selected from previous studies and L. edodes transcriptome data (unpublished data). The expression stabilities of candidate reference genes were analyzed by geNorm, NormFinder and BestKeeper under 40 °C heat stress, 5 mg/mL Cd(NO3)2, T. atroviride infection, different development stages and substrates [35]. This work aims to identify the most suitable reference genes for future gene expression analysis under different biotic/abiotic stresses, substrates and development stages.

2. Materials and Methods

2.1. Strain, Culture Conditions and Sample Collection

In treatment with different carbon sources, L. edodes strain W1 (ACCC50926) was cultured separately at 25 °C on sawdust medium [21], straw medium (33.3 g straw, 20 g wheat bran, 2 g gypsum and 20 g agar in 1 L sterilized water) and corn stalk medium (33.3 g corn stalk, 20 g wheat bran, 2 g gypsum and 20 g agar in 1 L sterilized water). For abiotic and biotic stress treatment group, mycelia of L. edodes strain W1 cultured on sawdust medium were treated under 40 °C heat stress for 24 h, and mycelia growing on the PDA (potato dextrose agar) medium were subjected to Trichoderma atroviride infection for 24h. Meanwhile, mycelia cultured on PDA medium 5 mg/mL Cd(NO3)2 were also collected. Meanwhile, primordia and fruiting bodies of L. edodes strain W1 were also collected according to Xiang’s report [27]. After collection, all samples were immediately frozen in liquid nitrogen and stored at −80 °C for RNA extraction.

2.2. RNA Isolation and cDNA Synthesis

Total RNA was extracted from all samples using the RNAiso Plus Kit (TaKaRa, Dalian, China) according to the manufacturer’s instruction. The RNA integrity and quantity were checked by 1% agarose gel electrophoresis and the NanoDrop DS-11 Spectrophotometer (Applied Denovix, Madison, WI, USA). The RNA samples with the OD260/OD280 value between 1.8 and 2.2 were reverse transcribed into cDNA using HiScript® II Q RT SuperMix for qPCR (+gDNA wiper) (Vazyme Biotech, Nanjing, China) according to the instructions of the manufacturer.

2.3. Selection of Candidate Reference Genes and Primer Design

Based on previous studies [26,27], sequences of eighteen genes, including seven house-keeping genes and eleven novel candidate genes, were downloaded from the genome database of L. edodes [16] and used for primer design. The detailed information of these genes was displayed in Table 1. Primers were designed using Primer Premier 5.0, and the length of PCR amplification products varied from 100 to 253 base pairs (Table 1).

2.4. qRT-PCR, Amplification Efficiency and Data Analysis

The qRT-PCR reaction was performed using CFX Connect Real-Time system (Bio-Rad, Hercules, California, USA). The PCR amplification mixture contained 1 μL of cDNA, 5 μL of AceQ® qPCR SYBR® Green Master Mix (Vazyme Biotech, Nanjing, China), 2.5 μL of 10 nM primer mixture and 1.5 μL ddH2O. The PCR reaction was performed with an initial denaturation for 5 min at 95 °C; 40 cycles of 30 s at 95 °C, annealing at 60 °C for 30 s; an extension at 72 °C for 20 s. The melting curve (60–95 °C) was used to determine the specificity of every qRT-PCR reaction. All qRT-PCR reactions were performed in biological and technical triplicates. The standard curves were generated by qRT-PCR detection using a 10-fold dilution gradient of the first cDNA (1, 10-1, 10-2, 10-3, 10-4) as templates with each repeated three times. Amplification efficiencies (E) and correlation coefficients (R2 values) were checked from standard curves. The qRT-PCR Ct values of eighteen genes were converted to relative copy numbers using the standard curves, and used to carry out geNorm and NormFinder and Bestkeeper analysis.

2.5. Validation of Reference Genes

To validate the reliability and accuracy of the selected reference genes for data normalization, the expression levels of seven genes were analyzed in different experimental conditions (Table S1). The expression data of the target genes were normalized with the two most stable genes and the least stable reference genes. The qRT-PCR amplification conditions were the same as those described above. The relative expression levels of all target genes were calculated by the 2−∆∆Ct method.

2.6. Analysis of Candidate Reference Genes under Different Conditions Based on RNA-Seq Data

To analyze the expression stability of the eighteen CRGs, the RPKM (reads per kilobase per million mapped reads) values were gained from RNA-seq data in each experiment involved in different L. edodes strains, biotic/abiotic stresses and substrates. The RNA-seq data of 24 h Trichoderma atroviride stress in L. edodes strains YS3334 and YS55 and different carbon substrates for W1 were obtained from our lab studies (unpublished data). The expression data from heat (S606 and YS3357) and light (L135, ACCC 50903) treatments were obtained from previous studies [18,20]. The expression variation of the eighteen CRGs was determined using a threshold of an absolute log2 (fold change between treatment and control RPKM values) ≤ 1.

3. Results

3.1. Selection of Candidate Reference Genes and Primer Design

Eighteen candidate genes, including seven house-keeping genes and eleven candidate genes, were selected according to previous reports in Ganoderma lucidum, Volvaria volvacea, Pleurotus ostreatus, Morchella sp. and Lentinula edodes [22,23,24,25,26,27]. The house-keeping genes were composed of actin (Actin), glyceraldehyde-3-phosphate dehydrogenase (gpd), 18S ribosomal RNA (18S), 28S ribosomal RNA (28S), β-tublin (β-tub), α-tublin (α-tub), and Elongation factor (EF). The eleven novel genes were implicated in DNA-directed RNA polymerase I subunit RPA12 (RPA12), Ubiquitin-protein ligase E3 (UBI), Ubiquitin-conjugating (UBC), MSF1-domain-containing protein (MSF1), Ras protein (Ras), SPRY-domain-containing protein (SPRY), Cyclophilin-like protein (CYPL), Peptidyl-prolyl cis-trans isomerase (PPCI), Translation initiation factor (TIF), Protein phosphatase 2A regulatory subunit B (PP2A) and Vacuolar protein sorting-associated protein 28 (VPS28). The information of the specific primers designed by Primer Premier 5.0 was displayed in Table 1. In addition, BLAST analysis revealed that the primers of every candidate reference gene were only matched to the target gene sequence in the L. edodes genome database. The 1% agarose gel electrophoresis result exhibited a specific single band for the PCR amplified products of the eighteen CRGs at an expected length (Figure S1), and the melting curve analysis also revealed a single peak for each PCR product (Figure 1). These results demonstrated a high specificity for all the primers used in this study.

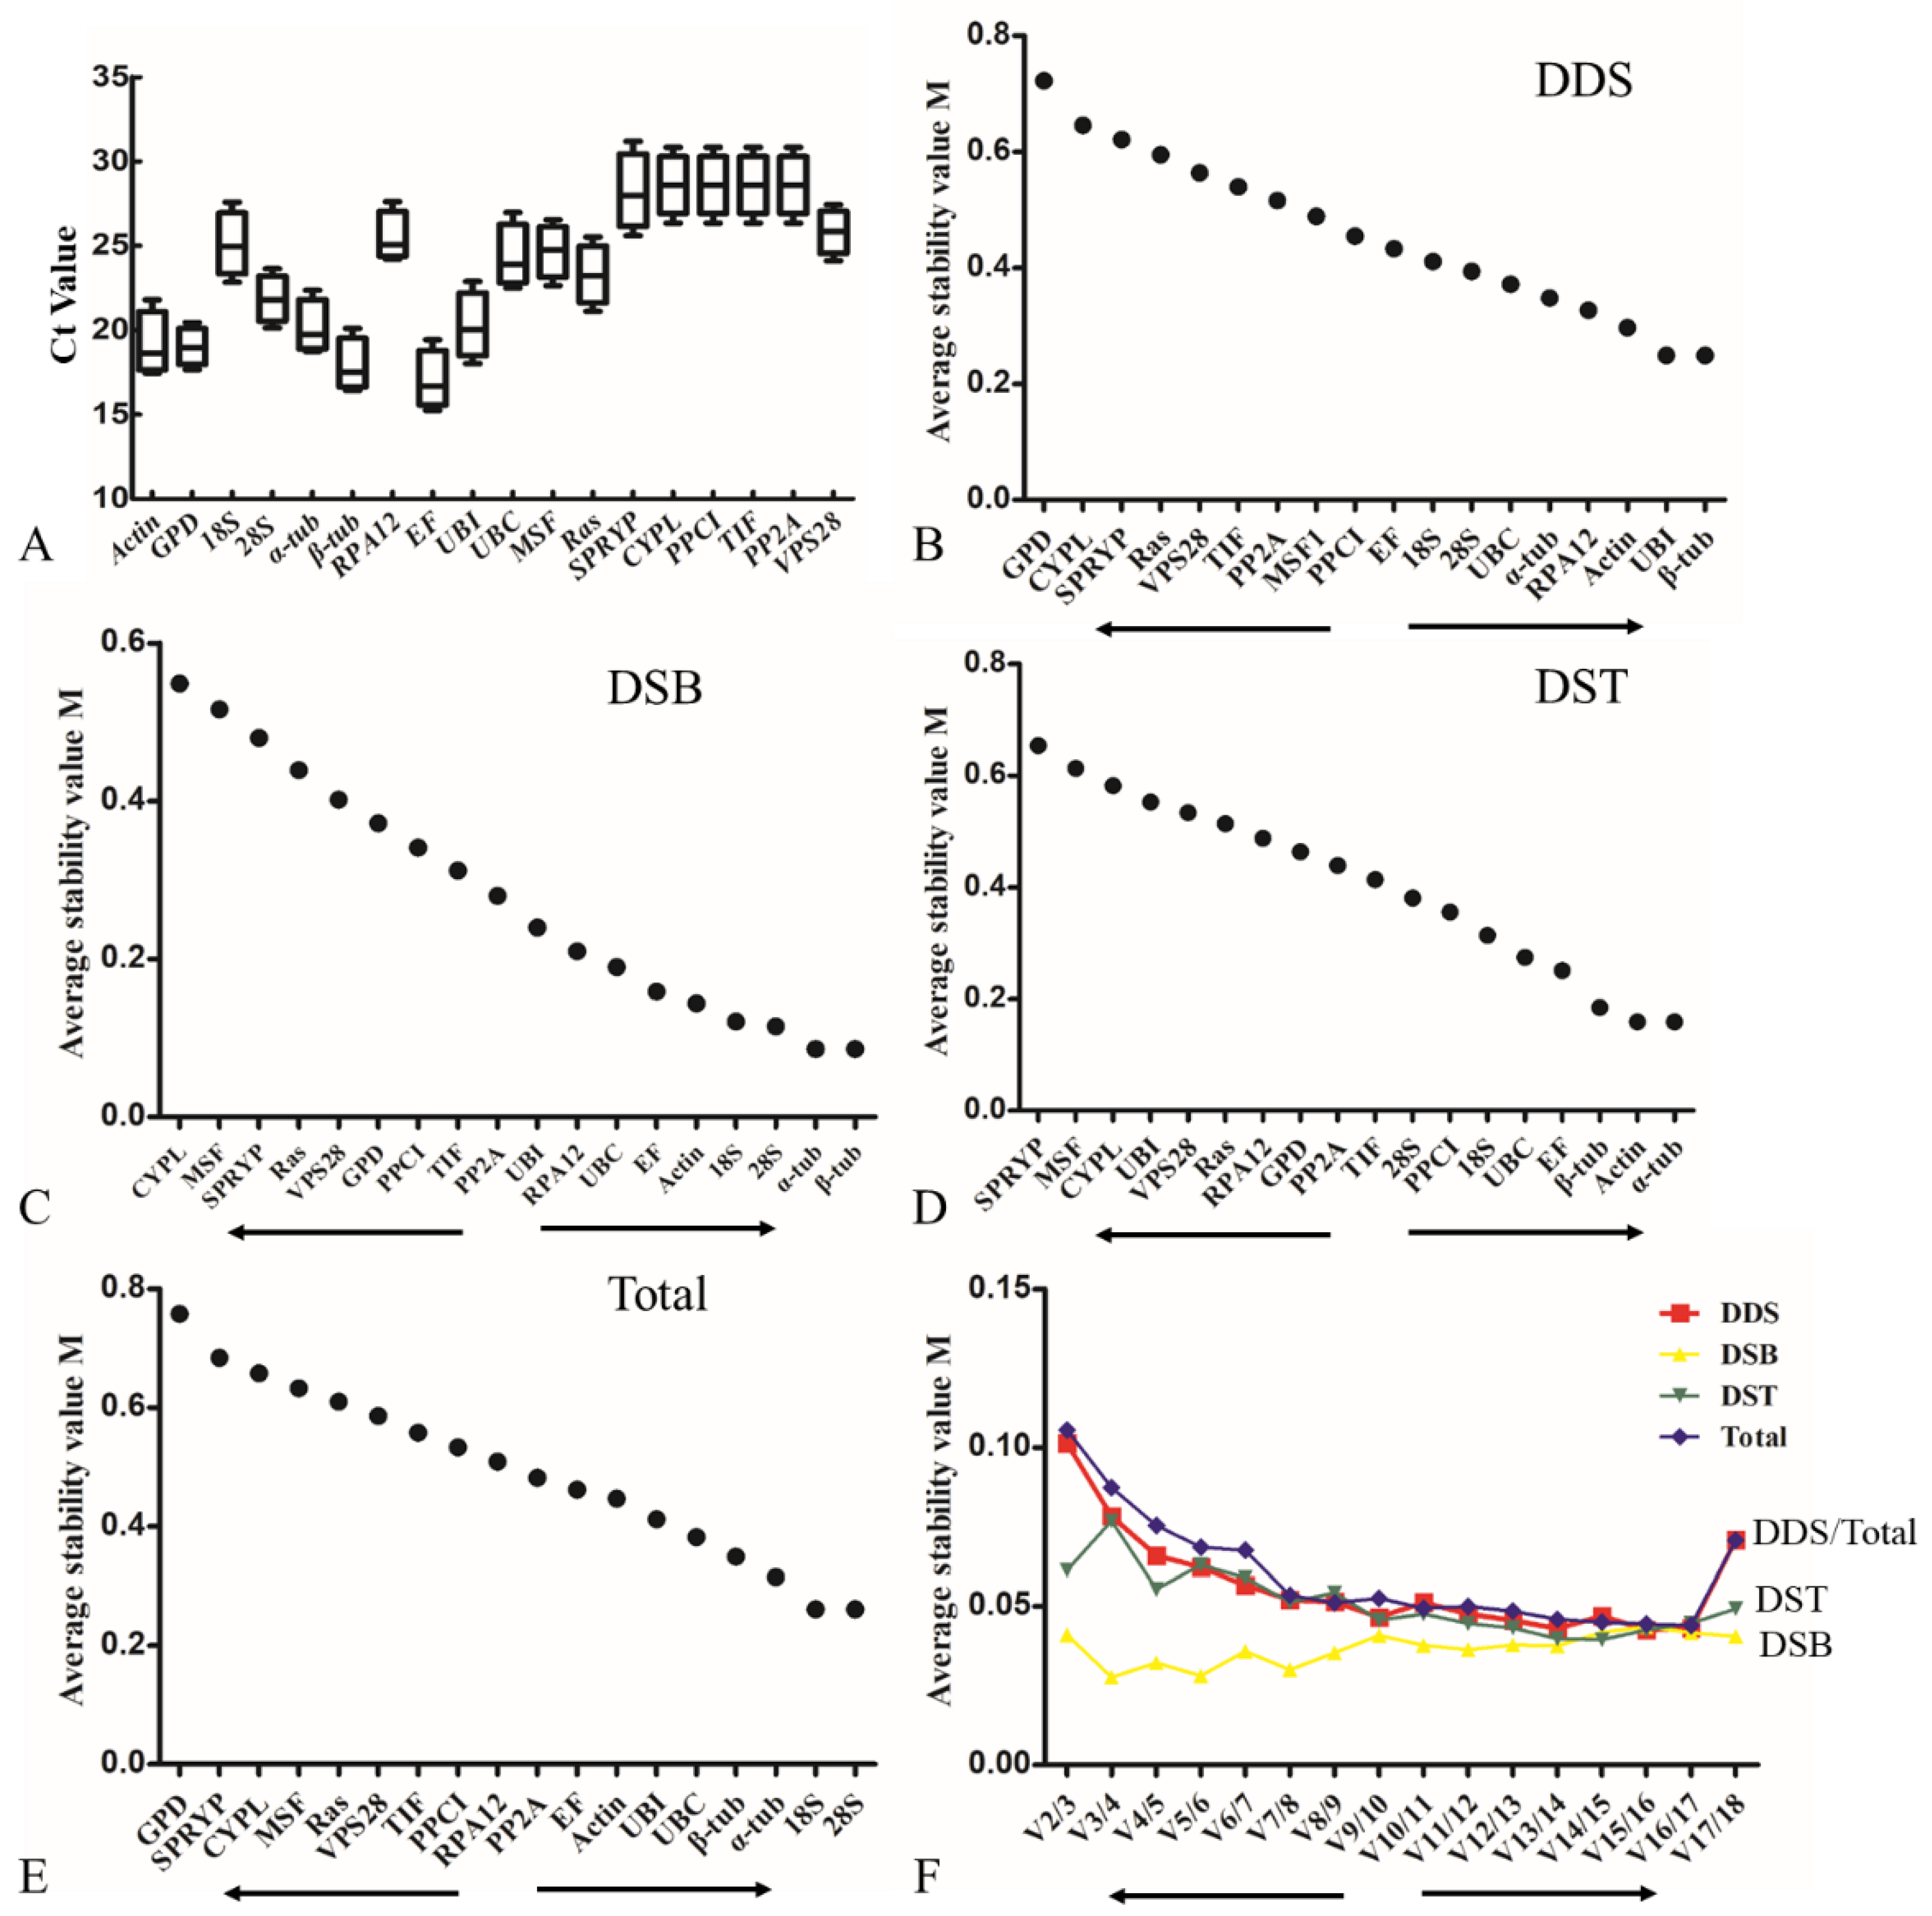
3.2. Expression Profile of Candidate Reference Genes in L. edodes

The cycle threshold (Ct) values were used to normalize for the standard curves generated with ten 10-fold serial cDNA dilutions by qRT-PCR. The formula E = 10 -1/slope -1 was used to calculate the amplification efficiency (E) varied from 90.6% for 28S to 102.3% for MSF1 (Table 1). All correlation coefficients (R2) of eighteen genes were greater than 0.99, indicating a reliable linear relationship of the respective Ct values with the log values of the initial gene copy numbers. The mean Ct values of the eighteen candidate genes in all samples under different conditions varied from 15.25 to 30.84 (Figure 2A), and ten of the candidate genes had a Ct mean values lower than 25, including Actin, GPD, α-tub, β-tub, EF, 28S and UBI, demonstrating that the expression levels of they were very high in all samples. EF showed considerably higher expression than the other candidate reference genes (low Ct values), while SPRYP exhibited the lowest expression (highest Ct values) in all samples. Relative variation analysis of the Ct values (the maximum Ct value minus the minimum Ct value) in all candidate reference genes documented the greatest variation in SPRYP while the smallest variation in GPD of L. edodes.

3.3. Evaluation of Expression Stability of the Eighteen Candidate Reference Genes in L. edodes

According to qRT-PCR Ct values, three statistical algorithms geNorm and NormFinder and BestKeeper were used to evaluate the stability of the eighteen selected CRGs. All selected genes were used for geNorm and NormFinder analyses, while, for BestKeeper analysis, only the top ten stable genes obtained with the two previous algorithms were used.
GeNorm analysis of candidate reference genes. The expression stability measure (M) of a CRG was calculated as previously reported [36]. The smaller the M values are, the higher the expression stability will be. The values of the eighteen CRGs varied from 0.758 to 0.086 (Figure 2 and Table S2). From the perspective of different development stages, β-tub and UBI were the most stable genes with the smallest value of 0.249, followed by Actin and RPA12, in contrast to the least stable genes of GPD and CYPL with M values of 0.723 and 0.646, respectively (Figure 2B). Under the conditions of different substrates, α-tub and β-tub were most stable with the smallest value of 0.086, while CYPL and MSF were less stably expressed (Figure 2C). In terms of different stresses, α-tub and Actin were the most stably expressed with an M value of 0.159, whereas SPRYP and MSF were less stably expressed (Figure 2D). All the integrated data suggested that 28S and 18S were the most stably expressed genes, while GPD and SPRYP were the least stably expressed genes (Figure 2E). In addition, the pairwise variation values (Vn/Vn+1) calculated by geNorm were used to determine the optional number of reference genes for accurate normalization. As reported previously, an additional reference gene would be unnecessary with the pairwise variation value less than 0.15 [37]. As shown in Figure 2F, all pairwise variation values were smaller than 0.15, demonstrating that two genes are sufficient for accurate normalization under different conditions of L. edodes. The optimal combination of reference genes was UBI with β-tub for different development stages, β-tub with α-tub for different substrates and α-tub with Actin for different stresses, respectively. Nevertheless, 28S with 18S was the optimal combination of reference genes under all conditions (Table S2).
NormFinder analysis of candidate reference genes. The CRGs were ranked by NormFinder based on the intra and inter group expression variations [36]. A notable difference was observed between the results of NormFinder and geNorm analyses about the most and least stably expressed genes. In NormFinder analysis, UBI and RPA12 were predicated as the most stable genes for different substrates and different development stages, respectively, while α-tub was defined as the most stable gene under different stress and total conditions (Table 2). Meanwhile, ranked in the second and third positions were RPA12 and 18S for different substrates, α-tub and Actin for different development stage, 18S and PPCI for different stresses, and 28S with β-tub for total conditions. The least stable genes were CYPL for different substrates, SPRYP for different stresses and GPD for different development stages and total conditions.
BestKeeper analysis of candidate reference genes. The top ten CRGs ranked by the sum of stability values in geNorm and NormFinder analyses were selected for BestKeeper analysis. The expression variability of the top ten CRGs was measured by the standard deviation (SD) and correlation coefficient (R). The lower the values of SD and CV were, the higher the stability of CRGs would be. The CRGs with a SD value larger than 1 were considered as unstably expressed genes [38]. As shown in Table 3, RPA12 and 28S were defined as the most stable genes for different substrates, while 18S, PPCI and UBC with a low R value were identified as unstably expressed genes. In terms of different development stages, the most stable gene was Actin, followed by RPA12 and UBC ranked in the second and third positions, respectively. Meanwhile, 28S was identified as the most stably expressed gene under different stresses, followed by PPCI and RPA12 in the second and third positions, respectively. Nevertheless, 18S was eliminated due to its high p-value (0.08866) and low R value (0.6380). The CRGs with the low p-values (0.001) and a high correlation coefficient (>0.93) were defined as the most stably expressed genes, including four genes (RPA12, PPCI, 28S and Actin).
Based on the results of the three statistical analyses, Actin and RPA12 were defined as the two most stable genes in different stages, while 28S with RPA12 and α-tub with Actin were defined as the most stably expressed for different substrates and different stresses, respectively. In summary, 28S could be treated as the reference gene under all different conditions.

3.4. Validation of Selected Reference Genes in L. edodes

To validate the reliability of the optimal and least reference genes for qRT-PCR analysis under different conditions, the relative expression levels of seven genes were calculated.
From the perspectives of growth and development stages, it was documented that the relative expression levels of three tested genes exhibited a significantly difference using different reference genes (Figure 3A). In comparison to the mycelia stage, LeDnaJ11 normalized by GPD was obviously upregulated under primordium and fruiting body stage, whereas there was no difference found in the analysis with Actin and 28S as the reference genes. Meanwhile, we found that Lelcc1 and Lelcc11 in primordium stage were significantly downregulated when normalized by Actin and 28S, but no obvious difference was detected with the reference gene GPD.
In terms of different substrates, an obvious difference was found in qRT-PCR analysis normalized by different reference genes (Figure 3B). The relative expression level of Lelcc9 in straw medium exhibited a similar upregulation trend using different reference genes, but the upregulation range with GPD was significantly higher than those of Actin and 28S. In addition, it was observed that the relative expression levels of LeDnaJ11 and LePOD-Mn normalized by GPD showed an obvious upregulation in straw medium, whereas no difference was found in the analysis with Actin and 28S as the reference genes.
Under different stress conditions, a prominent difference was detected in qRT-PCR analysis normalized by different reference genes (Figure 3C). It was found that the relative expression levels of LeDna98 normalized by GPD showed an obvious upregulation when subjected to T. atroviride infection, yet no difference was observed in the analysis with Actin and 28S as the reference genes. In addition, the relative expression levels of LeDnaJ07 and LeHsp98 in heat stress showed a similar change trend using different reference genes, where the upregulation range with GPD was higher than those of Actin and 28S.

3.5. Evaluation of the Expression Stability of Candidate Reference Genes in Different L. edodes Strains

To estimate the stability of the selected CRGs in different L. edodes strains, the RPKM values were gained from RNA-seq databases [20,37]. Genes with the RPKM ratio between any two treatments displaying a less than 2-fold change between treatment and control (non-treated) samples were considered as stably expressed. Under heat stress, for L. edodes strain YS3357, VPS28 and PPCI displayed an obvious upregulation, in contrast to the downregulation of CYPL and PP2A; for L. edodes strain S606, four genes (UBI, PPCI, VPS28 and CYPL) were upregulated, in contrast to the downregulation of SPRYP (Figure 4 and Table S3). From the perspective of T. atroviride infection, sixteen of eighteen CRGs were stably expressed except for UBI (downregulated in YS55) and MSF (upregulated in YS3334). During the coloring process in the presence or absence of light, only one gene RPA12 showed upregulation in L. edodes strain L135. When the mycelia of L. edodes strain W-1 mycelia were cultured in the CYM liquid medium containing different carbon sources (glucose, cellulose or cellulose and sodium lignosulphonate), all of the CRGs were stably expressed (Figure 4 and Table S3).

4. Discussion

Abiotic and biotic stresses and cultivation materials are the major limiting factors for the yield and quality traits of L. edodes. To solve these problems, we need to understand the molecular mechanism of L. edodes in response to stresses and the breeding of stress-resistant varieties. qRT-PCR can help us to understand this mechanism by quantifying the gene expression, and a stable internal gene reference gene is a prerequisite to ensure the reality of qRT-PCR results. Recently, an increasing number of studies have been performed on reference genes in organisms. For instance, several house-keeping genes were found to be unstably expressed under abiotic and biotic stresses [39,40], suggesting the necessity to identify reliable reference genes for qRT-PCR analysis. From the perspective of macro basidiomycetes, the stabilities of novel and traditional candidate genes have been estimated undertaken in G. lucidum, V. volvacea, P. ostreatus and L. edodes under different development stages, strains, nutrient conditions and abiotic stresses [22,23,24,25,26,27,40]. These reports suggested that the use of reference genes should be based on specific stress conditions and sample tissues as well as strains.
In the present study, a comprehensive analysis of eighteen CRGs, including traditional and novel reference genes from previous studies, was performed under different stresses (40 °C heat, Cd2+ excess and T. atroviride infection), different substrates (straw, sawdust and corn stalk) and different development stages (mycelia, primordia and fruit bodies). The melting curves as well as R2 and E values exhibited high specificity and amplification efficiency for all eighteen CRGs (Figure 1 and Table 1).
Under heat and Cd2+ as well as T. atroviride stress conditions, α-tub was demonstrated as the best reference gene by the results from the three statistical analyses, which was consistent with previous studies reporting that α-tub was stably expressed under many kinds of abiotic stresses in fungi (V. volvacea and L. edodes), animals and plants [23,26,41,42,43]. PPCI and Actin were identified as the second most stable genes by the three statistical methods. Previous reports documented Actin as a stably expressed gene in the response of L. edodes to 37 °C stress and in tobacco and Jute subjected to abiotic stresses [26,44,45] and CYC3 (PPCI) as a reliable reference gene for Morchella sp. in temperature stress [24]. The pairwise variation V2/3 value was below 0.15, demonstrating that the two genes were suitable for normalization in gene expression analysis. Therefore, α-tub with Actin or PPCI was suggested as the pair of reference genes for L. edodes in response to different kinds of stresses.
In different substrates, 28S and RPA12 were determined by the three analysis methods as the most suitable primer pair of reference genes. The analysis of geNorm, NormFinder and BestKeeper ranked 28S in the fourth, third and second position, respectively. RPA12 was estimated as the most stable gene by BestKeeper analysis and ranked in the second position by geNorm analysis. For the entomopathogenic fungus Beauveria bassiana, 28S was confirmed as the most stably expressed gene under a number of nutritional and stress conditions [46]. However, RPA12 encoding DNA-directed RNA polymerase I subunit has rarely been reported as an optimal reference gene in previous studies. Therefore, 28S was recommended as the best internal control gene for the response of L. edodes to different substrates.
For different development stages, the selection of reference genes has been reported in different varieties of edible fungi. In V. volvacea, Ras and SPRYP were reported as the most stable genes in heterokaryon H1521 [40], while L-asp and MSF were considered as stably expressed genes in homokaryon PYd15 [23], which were different from the present study in that Ras and SPRYP as well as MSF were found to be unstably expressed in all samples. Additionally, CYC3 encoding peptidyl-prolyl cis-trans isomerase exhibited a stable expression in ten Morchella species [24]. In L. edodes strain Xin 808, 18S and Rpl4 (ribosomal protein L4) were confirmed as the stably expressed genes [27], while in, L. edodes strain, W-1 Actin and RPA12 were defined as the stably expressed genes in different development stages. Furthermore, Actin was suggested as the most relevant reference genes during berry development [47], and ACT1 was reported as the most suitable reference gene during rice seed development [48]. All these results indicate that Actin can be used as a reliable reference gene during L. edodes development.

5. Conclusions

Overall, the three different statistical algorithms identified α-tub as the optimal internal control gene for many kinds of stresses and different L. edodes strains, while Actin and 28S as the suitable reference genes for gene expression normalization in different development stages and substrates. This study contributes to accurate analysis of differential expression changes in L. edodes under different conditions.

Supplementary Materials

The following are available online at https://www.mdpi.com/2073-4425/10/9/647/s1, Figure S1: Amplification fragments of eighteen candidate reference genes by agarose gel electrophoresis, Table S1: Delineations of genes used for validation analysis of selected reference genes, TableS2: Stability analysis of eighteen CRGs was calculated by geNorm, TableS3: Transcriptomic analysis of eighteen CRGs in L. edodes strains under different conditions.

Author Contributions

Conceptualization, G.W., Y.G., Y.B. and Y.Z.; Data curation, Y.L.; Funding acquisition, Y.B. and Y.Z.; Methodology, Y.G.; Resources, G.W.; Software, Y.L. and C.W.; Validation, G.W., Y.L. and C.W.; Visualization, G.W. and Y.L.; Writing—original draft, G.W., Y.B. and Y.Z.

Funding

This research was funded by the National Natural Science Foundation of China, grant number 31672211.

Acknowledgments

We gratefully acknowledge the financial support of the National Natural Science Foundation of China (Grant No. 31672211). We are so grateful for language modification of Hanchang Zhu.

Conflicts of Interest

The authors have no conflicts of interest.

References

  1. Bustin, S.A.; Benes, V.; Nolan, T.; Pfaffl, M.W. Quantitative real-time RT-PCR—A perspective. J. Mol. Endocrinol. 2005, 34, 597–601. [Google Scholar] [CrossRef] [PubMed]
  2. Engel, H.; Kueppers, C.; Koenig, M.; Loeffert, D. Successful gene expression analysis by multiplex, real-time, one-step RT-PCR, irrespective of the targets amplified. BioTechniques 2007, 43, 230–231. [Google Scholar] [CrossRef] [PubMed] [Green Version]
  3. Martins, P.K.; Mafra, V.; De Souza, W.R.; Ribeiro, A.P.; Vinecky, F.; Basso, M.F.; Andrade, B.; Andrade Dias Brito da Cunha, B.; Kobayashi, A.; Correa Molinari, H.B. Selection of reliable reference genes for qRT-PCR analysis during developmental stages and abiotic stress in Setaria viridis. Sci. Rep. UK 2016, 6, 28348. [Google Scholar] [CrossRef] [PubMed]
  4. Angela Pérez-Novo, C.; Claeys, C.; Speleman, F.; Van Cauwenberge, P.; Bachert, C.; Vandesompele, J. Impact of RNA quality on reference gene expression stability. Biotechniques 2005, 39, 52–56. [Google Scholar] [CrossRef] [PubMed]
  5. Huggett, J.; Dheda, K.; Bustin, S.; Zumla, A. Real-time RT-PCR normalisation; strategies and considerations. Genes Immun. 2005, 6, 279. [Google Scholar] [CrossRef] [PubMed]
  6. VanGuilder, H.D.; Vrana, K.E.; Freeman, W.M. Twenty-five years of quantitative PCR for gene expression analysis. Biotechniques 2008, 44, 619–626. [Google Scholar] [CrossRef]
  7. Zampieri, D.; Nora, L.C.; Basso, V.; Camassola, M.; Dillon, A.J. Validation of reference genes in Penicillium echinulatum to enable gene expression study using real-time quantitative RT-PCR. Curr. Genet. 2014, 60, 231–236. [Google Scholar] [CrossRef]
  8. Hao, X.; Horvath, D.P.; Chao, W.S.; Yang, Y.; Wang, X.; Xiao, B. Identification and evaluation of reliable reference genes for quantitative real-time PCR analysis in tea plant (Camellia sinensis (L.) O. Kuntze). Int. J. Mol. Sci. 2014, 15, 22155–22172. [Google Scholar] [CrossRef]
  9. Park, S.J.; Kwon, S.G.; Hwang, J.H.; Park, D.H.; Kim, T.W.; Kim, C.W. Selection of appropriate reference genes for QRT-PCR analysis in Berkshire, Duroc, Landrace, and Yorkshire pigs. Gene 2015, 558, 152–158. [Google Scholar] [CrossRef]
  10. Dheda, K.; Huggett, J.F.; Chang, J.S.; Kim, L.U.; Bustin, S.A.; Johnson, M.A.; Rook, G.A.; Zumla, A. The implications of using an inappropriate reference gene for real-time reverse transcription PCR data normalization. Anal. Biochem. 2005, 344, 141–143. [Google Scholar] [CrossRef]
  11. Lull, C.; Wichers, H.J.; Savelkoul, H.F. Antiinflammatory and immunomodulating properties of fungal metabolites. Mediat. Inflamm. 2005, 2005, 63–80. [Google Scholar] [CrossRef]
  12. Philippoussis, A.; Diamantopoulou, P.; Israilides, C. Productivity of agricultural residues used for the cultivation of the medicinal fungus Lentinula edodes. Int. Biodeter. Biodegr. 2007, 59, 216–219. [Google Scholar] [CrossRef]
  13. Finimundy, T.C.; Dillon, A.J.P.; Henriques, J.A.P.; Ely, M.R. A review on general nutritional compounds and pharmacological properties of the Lentinula edodes mushroom. Food Sci. Nutr. 2014, 5, 1095. [Google Scholar]
  14. Cai, Y.; Gong, Y.; Liu, W.; Hu, Y.; Chen, L.; Yan, L.; Zhou, Y.; Bian, Y. Comparative secretomic analysis of lignocellulose degradation by Lentinula edodes grown on microcrystalline cellulose, lignosulfonate and glucose. J. Proteom. 2017, 163, 92–101. [Google Scholar] [CrossRef]
  15. Sakamoto, Y.; Nakade, K.; Yoshida, K.; Natsume, S.; Miyazaki, K.; Sato, S.; van Peer, A.F.; Konno, N. Grouping of multicopper oxidases in Lentinula edodes by sequence similarities and expression patterns. AMB Express 2015, 5, 63. [Google Scholar] [CrossRef] [PubMed]
  16. Chen, L.; Gong, Y.; Cai, Y.; Liu, W.; Zhou, Y.; Xiao, Y.; Xu, Z.; Liu, Y.; Lei, X.; Wang, G. Genome sequence of the edible cultivated mushroom Lentinula edodes (Shiitake) reveals insights into lignocellulose degradation. PLoS ONE 2016, 11, e0160336. [Google Scholar] [CrossRef]
  17. Wang, Y.; Zeng, X.; Liu, W. De novo transcriptomic analysis during Lentinula edodes fruiting body growth. Gene 2018, 641, 326–334. [Google Scholar] [CrossRef] [PubMed]
  18. Tang, L.H.; Jian, H.H.; Song, C.Y.; Bao, D.P.; Shang, X.D.; Wu, D.Q.; Tan, Q.; Zhang, X.H. Transcriptome analysis of candidate genes and signaling pathways associated with light-induced brown film formation in Lentinula edodes. Appl. Microbiol. Biot. 2013, 97, 4977–4989. [Google Scholar] [CrossRef] [PubMed]
  19. Sakamoto, Y.; Nakade, K.; Sato, S.; Yoshida, K.; Miyazaki, K.; Natsume, S.; Konno, N. Lentinula edodes genome survey and postharvest transcriptome analysis. Appl. Environ. Microb. 2017, 83, e02990–e03016. [Google Scholar] [CrossRef]
  20. Wang, G.Z.; Ma, C.J.; Luo, Y.; Zhou, S.S.; Zhou, Y.; Ma, X.L.; Cai, Y.L.; Yu, J.J.; Bian, Y.B.; Gong, Y.H. Proteome and transcriptome reveal involvement of heat shock proteins and indoleacetic acid metabolism process in Lentinula edodes Thermotolerance. Cell Physiol. Biochem. 2018, 50, 1617–1637. [Google Scholar] [CrossRef]
  21. Wang, G.; Zhou, S.; Luo, Y.; Ma, C.; Gong, Y.; Zhou, Y.; Gao, S.; Huang, Z.; Yan, L.; Hu, Y.; et al. The heat shock protein 40 LeDnaJ regulates stress resistance and indole-3-acetic acid biosynthesis in Lentinula edodes. Fungal. Genet. Biol. 2018, 118, 37–44. [Google Scholar] [CrossRef]
  22. Lu, X.; Liu, Y.; Zhao, L.; Liu, Y.; Zhao, M. Selection of reliable reference genes for qRT-PCR during methyl jasmonate, salicylic acid and hydrogen peroxide treatments in Ganoderma lucidum. World J. Microb. Biot. 2018, 34, 92. [Google Scholar] [CrossRef]
  23. Qian, J.; Gao, Y.; Wáng, Y.; Wu, Y.; Wāng, Y.; Zhao, Y.; Chen, H.; Bao, D.; Xu, J.; Bian, X. Selection and evaluation of appropriate reference genes for qRT-PCR normalization of Volvariella volvacea gene expression under different conditions. Biomed. Res. Int. 2018, 2018, 6125706. [Google Scholar] [CrossRef]
  24. Zhang, Q.; Liu, W.; Cai, Y.; Lan, A.; Bian, Y. Validation of internal control genes for quantitative real-time PCR gene expression analysis in Morchella. Molecules 2018, 23, 2331. [Google Scholar] [CrossRef]
  25. Castanera, R.; López-Varas, L.; Pisabarro, A.G.; Ramírez, L. Validation of reference genes for transcriptional analyses in Pleurotus ostreatus using qRT-PCR. Appl. Environ. Microb. 2015, 81, 4120–4129. [Google Scholar] [CrossRef]
  26. Zhao, X.; Yang, H.; Chen, M.; Song, X.; Yu, C.; Zhao, Y.; Wu, Y. Reference gene selection for quantitative real-time PCR of mycelia from Lentinula edodes under high-temperature stress. Biomed. Res. Int. 2018, 2018, 1670328. [Google Scholar] [CrossRef]
  27. Xiang, Q.; Li, J.; Qin, P.; He, M.; Yu, X.; Zhao, K.; Zhang, X.; Ma, M.; Chen, Q.; Chen, X. Identification and evaluation of reference genes for qRT-PCR studies in Lentinula edodes. PLoS ONE 2018, 13, e0190226. [Google Scholar] [CrossRef]
  28. Fahad, S.; Bajwa, A.A.; Nazir, U.; Anjum, S.A.; Farooq, A.; Zohaib, A.; Sadia, S.; Jatoi, W.N.; Adkins, S.; Saud, S. Crop production under drought and heat stress: Plant responses and management options. Front. Plant Sci. 2017, 8, 1147. [Google Scholar] [CrossRef]
  29. Haldar, S.; Ghosh, T.K.; Bedford, M.R. Effects of yeast (Saccharomyces cerevisiae) and yeast protein concentrate on production performance of broiler chickens exposed to heat stress and challenged with Salmonella enteritidis. Anim. Feed Sci. Technol. 2011, 168, 61–71. [Google Scholar] [CrossRef]
  30. Lu, Z.; Kong, X.; Lu, Z.; Xiao, M.; Chen, M.; Zhu, L.; Shen, Y.; Hu, X.; Song, S. Para-aminobenzoic acid (PABA) synthase enhances thermotolerance of mushroom Agaricus bisporus. PLoS ONE 2014, 9, e91298. [Google Scholar] [CrossRef]
  31. Cao, X.T.; Bian, Y.B.; Xiao, X.J.; Wang, G.Z. Effect of heat stress on Lentinula edodes mycelial growth recovery and resistance to Trichoderma harzianum. Acta Edulis Fungi 2015, 22, 81–85. [Google Scholar]
  32. Wang, G.; Cao, X.; Ma, X.; Guo, M.; Liu, C.; Yan, L.; Bian, Y. Diversity and effect of Trichoderma spp. associated with green mold disease on Lentinula edodes in China. Microbiologyopen 2016, 5, 709–718. [Google Scholar] [CrossRef]
  33. Chen, G.; Zeng, G.; Tang, L.; Du, C.; Jiang, X.; Huang, G.; Liu, H.; Shen, G. Cadmium removal from simulated wastewater to biomass byproduct of Lentinus edodes. Bioresource Technol. 2008, 99, 7034–7040. [Google Scholar] [CrossRef]
  34. Qiao, X.; Huang, W.; Bian, Y. Effective removal of cadmium ions from a simulated gastrointestinal fluid by Lentinus edodes. Int. J. Environ. Res. Pub. Health 2014, 11, 12486–12498. [Google Scholar] [CrossRef]
  35. Willems, E.; Mateizel, I.; Kemp, C.; Cauffman, G.; Sermon, K.; Leyns, L. Selection of reference genes in mouse embryos and in differentiating human and mouse ES cells. Int. J. Dev. Biol. 2004, 50, 627–635. [Google Scholar] [CrossRef]
  36. Radonić, A.; Thulke, S.; Mackay, I.M.; Landt, O.; Siegert, W.; Nitsche, A. Guideline to reference gene selection for quantitative real-time PCR. Biochem. Bioph. Res. Co. 2004, 313, 856–862. [Google Scholar] [CrossRef]
  37. Vandesompele, J.; De Preter, K.; Pattyn, F.; Poppe, B.; Van Roy, N.; De Paepe, A.; Speleman, F. Accurate normalization of real-time quantitative RT-PCR data by geometric averaging of multiple internal control genes. Genome Biol. 2002, 3, research0034-1. [Google Scholar] [CrossRef]
  38. Pfaffl, M.W.; Tichopad, A.; Prgomet, C.; Neuvians, T.P. Determination of stable housekeeping genes, differentially regulated target genes and sample integrity: BestKeeper–Excel-based tool using pair-wise correlations. Biotechnol. Lett. 2004, 26, 509–515. [Google Scholar] [CrossRef]
  39. Die, J.V.; Román, B.; Nadal, S.; González-Verdejo, C.I. Evaluation of candidate reference genes for expression studies in Pisum sativum under different experimental conditions. Planta 2010, 232, 145–153. [Google Scholar] [CrossRef]
  40. Tao, Y.; Van Peer, A.F.; Huang, Q.; Shao, Y.; Zhang, L.; Xie, B.; Jiang, Y.; Zhu, J.; Xie, B. Identification of novel and robust internal control genes from Volvariella volvacea that are suitable for QRT-PCR in filamentous fungi. Sci. Rep. UK 2016, 6, 29236. [Google Scholar] [CrossRef]
  41. Newton, J.R.; De Santis, C.; Jerry, D.R. The gene expression response of the catadromous perciform barramundi Lates calcarifer to an acute heat stress. J. Fish. Biol. 2012, 81, 81–93. [Google Scholar] [CrossRef]
  42. Wang, P.; Xiong, A.; Gao, Z.; Yu, X.; Li, M.; Hou, Y.; Sun, C.; Qu, S. Selection of suitable reference genes for qRT-PCR normalization under abiotic stresses and hormone stimulation in persimmon (Diospyros kaki thunb). PLoS ONE 2016, 11, e0160885. [Google Scholar]
  43. Wan, H.; Zhao, Z.; Qian, C.; Sui, Y.; Malik, A.A.; Chen, J. Selection of appropriate reference genes for gene expression studies by quantitative real-time polymerase chain reaction in cucumber. Anal Biochem. 2010, 399, 257–261. [Google Scholar] [CrossRef]
  44. Schmidt, G.W.; Delaney, S.K. Stable internal reference genes for normalization of real-time RT-PCR in tobacco (Nicotiana tabacum) during development and abiotic stress. Mol. Genet. Genom. 2010, 283, 233–241. [Google Scholar] [CrossRef]
  45. Niu, X.; Qi, J.; Zhang, G.; Xu, J.; Tao, A.; Fang, P.; Su, J. Selection of reliable reference genes for quantitative real-time PCR gene expression analysis in Jute (Corchorus capsularis) under stress treatments. Front. Plant Sci. 2015, 6, 848. [Google Scholar] [CrossRef]
  46. Zhou, Y.H.; Zhang, Y.J.; Luo, Z.B.; Fan, Y.H.; Tang, G.R.; Liu, L.J.; Pei, Y. Selection of optimal reference genes for expression analysis in the entomopathogenic fungus Beauveria bassiana during development, under changing nutrient conditions, and after exposure to abiotic stresses. Appl. Microbiol. Biot. 2012, 93, 679–685. [Google Scholar] [CrossRef]
  47. Reid, K.E.; Olsson, N.; Schlosser, J.; Peng, F.; Lund, S.T. An optimized grapevine RNA isolation procedure and statistical determination of reference genes for real-time RT-PCR during berry development. BMC Plant Biol. 2006, 6, 27. [Google Scholar] [CrossRef]
  48. Li, Q.F.; Sun, S.S.M.; Yuan, D.Y.; Yu, H.X.; Gu, M.H.; Liu, Q.Q. Validation of candidate reference genes for the accurate normalization of real-time quantitative RT-PCR data in rice during seed development. Plant Mol. Biol. Rep. 2010, 28, 49–57. [Google Scholar] [CrossRef]
Figure 1. Amplification and dissolution curves of eighteen candidate reference genes.
Genes 10 00647 g001
Figure 2. Expression stability analysis of eighteen candidate reference genes in Lentinula edodes. (A) variation in qRT-PCR values of eighteen candidate reference genes (CRGs) in all samples; (BE) expression stability ranking of eighteen CRGs using geNorm under different development stages (DDS), different substrates (DSB), different stresses (DST) and all samples, respectively. (F) pairwise variation (Vn/Vn+1) showing the optional number reference genes required in an accurate normalization.
Genes 10 00647 g002
Figure 3. The relative expression levels of seven genes normalizing by the selected reference genes under different experimental conditions. (A) qRT-PCR analysis of three genes normalizing by the selected reference genes during different development stages; (B) qRT-PCR analysis of three genes normalizing by the selected reference genes in different substrates; (C) qRT-PCR analysis of three genes normalizing by the selected reference genes under different stress conditions.
Genes 10 00647 g003
Figure 4. Heat map (log2fold change) showing expression stability of eighteen candidate reference genes in different L. edodes strains under different conditions. (1 and 2) heat stress/control in YS3357 and S606; (3 and 4) Trichoderma atroviride stress/control in YS3334 and YS55; (5 and 6) cellulose/glucose and cellulose+ sodium lignosulphonate/glucose in WX-1. 7, Light treatment/control in L135. Red, Upregulation. Blue, Downregulation. Scale bar is given at the top of the heat map.
Genes 10 00647 g004
Table 1. Delineations of eighteen candidate candidate reference genes in L. edodes and parameters gained by qRT-PCR analysis.
SymbolGene IDGene NameForward Primer SequenceReverse Primer SequenceSize (bp)Efficiency (%)R2
ActinLE01Gene01050ActinGCATCCTGTCCTTCTTACCGAGAAGAGCGAAACCCTCGTAGATG21496.10.998
GPDLE01Gene07114Glyceraldehyde-3-phosphate dehydrogenaseCCTTCCGCTGATGCACCTATGTTGACAGAACGACCGCCAC24094.10.998
18SLE01Gene0088118S ribosomal RNAATGCTGGCTCCGTTCGCAGGTGCTCCCCGCTTCTTA16897.50.988
28SLE01Gene0229628S ribosomal RNAGCCTGCCACAAAGGATGAAAGCTCCAAGCCTAAGAACAGTCCA15790.60.992
β-tubLE01Gene08622β-tubulinCAGACCCAAGACACGGACGTGGCAGTAGAGTTACCCAGGAA21393.20.998
α-tubLE01Gene01435α-tubulinTCCAACTTGAACAGGCTTATCGAACGGAAAGTGAATACGAGGGA13494.90.994
RPA12LE01Gene06896DNA-directed RNA polymerase I subunit RPA12TCCGAAAGATAGCGAACCGAAGGAGACCAAATCGCCCAAGT18497.20.998
EFLE01Gene03252Elongation factorACTTCCCAGGCTGATTGTGCTTCGCTCCATTTGGTGGTGTC17096.61
UBILE01Gene06776UBI Ubiquitin-protein ligase E3ATCACGGTCACGAAAGAACAACTCTTACATTCCAAAACTCGCACAGA171960.998
UbCLE01Gene00040Ubiquitin-conjugatingGGCGGTCCAGTTTGTTGTCACGGTCGGTGTTTCTCCTTGC17895.60.993
MSF1LE01Gene08077MSF1-domain-containing proteinTATTCGCCTTCGTCAACACCTACCGCTGAGCCATCCACCT118102.30.997
RasLE01Gene13143Ras proteinAGGTCGGGATGAATGAGGGCTTCGTCGTTTGGATCTTTGC22299.50.999
SPRYPLE01Gene00010SPRY-domain-containing proteinATGTCAAACTGTCCCGTCTTCCCCATAAGGTGTTCCGTTTCGTT10391.20.998
CYPLLE01Gene07769Cyclophilin-like proteinAGTGGTGTACTCCCTGATTTTGTCGGTCTGCGTCGCCCTTTT10092.90.997
PPCILE01Gene06576Peptidyl-prolyl cis-trans isomeraseAGGACGAATTGCATCCAGAACGGGTAGGACCAAGAGTCAAGAAG11197.60.997
TIFLE01Gene09672Translation initiation factorACCGCCGTAAAACGAGTAGCCCTGGTTGCGAGGTGAATG203101.50.998
PP2ALE01Gene09754Protein phosphatase 2A regulatory subunit BTCGGCTGACGATTTGCGGAGTAGTGGGGTCTTCCTCTTCTT253100.90.998
VPS28LE01Gene10038Vacuolar protein sorting-associated protein 28CTTCAAGGGCAGCAAGGATTTGGCGTGACTGTTCTTCGGTA108100.90.999
Table 2. Stability analysis of eighteen candidate reference genes by NormFinder.
RankDifferent SubstratesDifferent Development StagesDifferent StressesTotal
NormFinderStability ValueNormFinderStability ValueNormFinderStability ValueNormFinderStability Value
1UBI0.077RPA120.042α-tub0.124α-tub0.161
2RPA120.09α-tub0.1518S0.17228S0.204
318S0.152Actin0.186PPCI0.184β-tub0.231
428S0.165β-tub0.18828S0.2118S0.242
5EF0.172UBI0.198TIF0.23PP2A0.292
6UBC0.19PPCI0.254Actin0.234RPA120.303
7TIF0.20928S0.314β-tub0.246PPCI0.306
8Actin0.228MSF0.314PP2A0.284Actin0.309
9PPCI0.235UBC0.318GPD0.317UBI0.314
10α-tub0.238EF0.319UBC0.321UBC0.316
11β-tub0.248PP2A0.339Ras0.332EF0.352
12PP2A0.2618S0.351EF0.353TIF0.357
13VPS280.329VPS280.395VPS280.368VPS280.38
14GPD0.355TIF0.424RPA120.38Ras0.431
15Ras0.401SPRYP0.46UBI0.399MSF0.445
16SPRYP0.443CYPL0.501CYPL0.452CYPL0.488
17MSF0.478Ras0.504MSF0.521SPRYP0.536
18CYPL0.502GPD0.88SPRYP0.61GPD0.879
Table 3. Stability analysis of eighteen candidate reference genes by BestKeeper.
Actin18S28SRPA12UBCUBIEFα-tubβ-tubPPCI
Different substrates
std dev [± Ct]0.540.350.420.390.310.480.520.520.570.39
coeff. of corr. [R]0.9980.4850.9650.9950.89710.9770.9640.9970.757
Ranking61021834579
Different development stages
std dev [± Ct]0.340.920.870.420.440.720.440.680.640.57
coeff. of corr. [R]0.9940.9790.9950.9240.9470.9710.8060.960.9940.889
Ranking18723610549
Difference stresses
std dev [± Ct]1.270.860.840.951.341.331.391.171.280.93
coeff. of corr. [R]0.9990.2830.9980.9280.9640.9690.98610.9920.993
Ranking51013879462
Total samples
std dev [± Ct]1.000.940.980.781.031.191.021.111.140.85
coeff. of corr. [R]0.9570.6380.9670.9430.9730.9770.9540.9910.9910.937
p-value0.0010.0890.0010.0010.0010.0010.0010.0010.0010.001
Ranking41031695782

