Abstract
Eimeria tenella (E. tenella) is one of the most frequent and pathogenic species of protozoan parasites of the genus Eimeria that exclusively occupies the cecum, exerting a high economic impact on the poultry industry. To investigate differentially expressed genes (DEGs) in the cecal tissue of Jinghai yellow chickens infected with E. tenella, the molecular response process, and the immune response mechanism during coccidial infection, RNA-seq was used to analyze the cecal tissues of an E. tenella infection group (JS) and an uninfected group (JC) on the seventh day post-infection. The DEGs were screened by functional and pathway enrichment analyses. The results indicated that there were 5477 DEGs (p-value < 0.05) between the JS and the JC groups, of which 2942 were upregulated, and 2535 were downregulated. GO analysis indicated that the top 30 significantly enriched GO terms mainly involved signal transduction, angiogenesis, inflammatory response, and blood vessel development. KEGG analysis revealed that the top significantly enriched signaling pathways included focal adhesion, extracellular matrix–receptor interaction, and peroxisome proliferator-activated receptor. The key DEGs in these pathways included ANGPTL4, ACSL5, VEGFC, MAPK10, and CD44. These genes play an important role in the infection of E. tenella. This study further enhances our understanding of the molecular mechanism of E. tenella infection in chickens.
1. Introduction
Avian coccidiosis, caused by seven species of protozoan parasites of the genus Eimeria, is one of the most important livestock diseases in the world [1], resulting in high economic impacts by reducing animal performance and lowering productivity [2]. So far, coccidiostats and live vaccines are the two major coccidiosis control strategies [3]. However, extensive use of coccidiostats has resulted in drug resistance and raised public concern for food safety because of its chemical residues in food-producing animals [4]. The use of live vaccines has the risk of causing reversion to a pathogenic strain [5]. Although DNA vaccines that comprise genes encoding immunogenic proteins of pathogens have been investigated as vaccine candidates, the price of any new vaccine and the genetic background of the recipient will continue to receive major consideration in the global poultry industry [6]. Genetic selection of coccidiosis-resistant lines by novel molecular genetics and functional genomics tools provides the potential to radically address this problem [7]. However, our understanding of how chickens respond to coccidian infection at the molecular level is limited [8].
RNA-seq is an approach to transcriptome profiling that provides a far more precise measurement of the levels of transcripts and their isoforms than other methods [9]. Several studies used transcriptome gene chip hybridization of intraepithelial lymphocytes or ceca from infected and noninfected chickens to study gene expression profile changes in response to Eimeria tenella at 0–6 days post-infection (PI) [8,10]. Scanning electron microscopy showed that coccidioides invaded mainly the cecum of chickens, damaged the intestinal mucosa, and caused cecal swelling, bleeding, and excretion of large amounts of bloody stool on the fourth day after infection; from 8 to 10 days PI, the damaged mucosal surface became normal [11,12]. Guo et al. [8] performed significance analysis of microarray (SAM) of chicken cecum mucosa after 4.5 days of E. tenella infection using a gene chip to explore the molecular mechanisms of coccidiosis infection. In this study, we applied the RNA-seq technique to screen the differentially expressed genes (DEGs) between E. tenella-infected and uninfected cecal tissues of Jinghai yellow chickens on the seventh day PI and analyze the GO terms and pathways of these DEGs, so to find the main DEGs associated with E. tenella infection and to provide a reference for breeding new varieties or new strains with coccidiosis resistance.
2. Materials and Methods
2.1. E. tenella Infection in Chickens and Tissue Collection
E. tenella was originally isolated in the field in Yangzhou, China, and maintained in the Department of Parasitology, College of Veterinary Medicine, Yangzhou University, Jiangsu Province, China. Parasite oocysts were harvested, sporulated, and stored as previously described [13]. The experimental animal was the Jinghai yellow chicken, characterized by small size, good meat quality, disease and stress tolerance compared to other chickens of the same type. A total of 12 female, half siblings chicks with similar body weights were randomly selected (purchased from Jinghai Yellow Chicken Resource Farm, Haimen, Jiangsu Province, China), housed in oocyst-free cages, and fed antibiotic-free feed for up to 30 days. All chickens were determined to be free from parasitic infection after fecal detection, were randomly divided into an infected group (JS) and an uninfected group (JC), and were kept in single cages, maintained free of coccidioides by flame disinfection with a gasoline torch. Each chicken in the infected group was subjected to oral infection with 2.5 × 10⁴ E. tenella sporulated oocysts. The uninfected group received the same amount of normal saline. On the seventh day PI, the cecum tissues of the three chickens with the highest cecal lesion scores [14] in the infected group (denoted JS1-JS3) and the cecum tissues of three chickens randomly selected from the uninfected group (denoted JC1-JC3) were collected for total RNA extraction. All animal protocols were approved by the Animal Welfare Committee of Yangzhou University, and all efforts were made to minimize the suffering of the chickens.
2.2. RNA Isolation and Quality Assessment
Total RNA from six cecum samples was extracted using TRIzol reagent (Invitrogen, Carlsbad, CA, USA) according to the manufacturer’s instructions. RNA degradation was monitored in 1% agarose gels. RNA purity was checked using a NanoPhotometer® spectrophotometer (IMPLEN, MD, CA, USA). RNA concentration was measured using a Qubit® RNA Assay Kit with a Qubit® 2.0 Fluorometer (Life Technologies, South San Francisco, CA, USA). RNA integrity was assessed using an RNA Nano 6000 Assay Kit with a Bioanalyzer 2100 system (Agilent Technologies, Santa Clara, CA, USA).
2.3. Library Preparation and Transcriptome Sequencing
Qualified total RNA for each of the six cecum tissues was sent to Novogene Biological Information Science and Technology Company (dry ice preservation) for library construction and transcriptome sequencing. Sequencing libraries were generated using an NEBNext® Ultra™ RNA Library Prep Kit for Illumina® (NEB, Ispawich, CA, USA) according to the manufacturer’s recommendations, and index codes were added to attribute sequences to each sample. PCR products were purified (AMPure XP system) (Beckmankurt life sciences division, Indianapolis, Indiana, USA), and library quality was assessed on an Agilent Bioanalyzer 2100 system.
Clustering of the index-coded samples was performed on a cBot Cluster Generation System using a TruSeq PE Cluster Kit v3-cBot-HS (Illumina) according to the manufacturer’s instructions. After cluster generation, the library preparations were sequenced on an Illumina HiSeq 2000 platform, and 100 bp paired-end reads were generated. The raw data were uploaded to the NCBI Sequence Read Archive (SRA); the accessions in the SRA for the submission is SRP198721.
2.4. Sequence Read Mapping to the Gallus Gallus Reference Genome
Raw data (raw reads) in fastq format were first processed through in-house Perl scripts. In this step, clean data (clean reads) were obtained by removing reads containing adapter sequences, reads containing poly-N, and low-quality reads from the raw data. Furthermore, quality parameters of Q20, GC content, and sequence duplication level were used for data filtering. All the subsequent analyses were based on the high-quality clean data.
Reference genome and gene model annotation files were downloaded from the genome website (ftp://ftp.ensembl.org/pub/release-75/fasta/gallus_gallus/dna/). The index of the reference genome was built using Bowtie v2.0.6 (Johns Hopkins University, Baltimore, MD, USA) [15], and paired-end clean reads were aligned to the reference genome using TopHat v2.0.9 (Johns Hopkins University, Baltimore, MD, USA) [16]. TopHat was selected as the mapping tool because it can obtain a better mapping result than other nonsplice mapping tools. The Cufflinks v2.1.1 reference annotation-based transcript (RABT) (Johns Hopkins University, Baltimore, MD, USA) assembly method was used to construct and identify both known and novel transcripts from TopHat alignment results [17].
2.5. Quantification and Differential Expression Analysis of Transcripts
HTSeq v0.5.4p3 (Stanford University, CA, USA; Heidelberg University, Baden-Württemberg, Germany) was used to count the read numbers mapped to each gene [18]. In addition, the RPKM (reads per kilobase of exon model per million mapped reads) of each gene was calculated based on the length of the gene, and read counts were mapped to it. RPKM considers the effect of sequencing depth and gene length for the read counts at the same time and is currently the most commonly used method for estimating gene expression levels [19]. Differential expression analysis of the two groups (three biological replicates per condition) was performed using the DESeq package [20]. The resulting p-values were adjusted using Benjamini and Hochberg’s [21] approach for controlling the false discovery rate. Genes with an adjusted p-value < 0.05 found by DESeq were identified as differentially expressed.
2.6. GO and KEGG Enrichment Analysis of Differentially Expressed Genes
Gene ontology (GO) enrichment analysis of DEGs was implemented by the GOseq R package (the University of Auckland, Auckland, New Zealand) [22], in which gene length bias was corrected. GO terms with corrected p-values less than 0.05 were considered significantly enriched for DEGs.
KEGG is a database resource for understanding high-level functions and utilities of the biological system, such as the cell, the organism, and the ecosystem, from molecular-level information, especially large-scale molecular datasets generated by genome sequencing and other high-throughput experimental technologies (http://www.genome.jp/kegg/). We used KOBAS software [23,24] to test the statistical enrichment of DEGs in KEGG pathways.
2.7. Validation of Differentially Expressed Genes by qRT-PCR
Ten DEGs were randomly selected. The primers used for quantification in the study were designed using Primer-BLAST on the NCBI website. In all cases, primers designed for qRT-PCR spanned exon–exon boundaries. Primer sequences can be seen in Table 1. YWHAZ and TBP were used as reference genes [25]. qRT-PCR was performed using an ABI Prism 7500 sequence-detection system (Applied Biosystems, Foster City, CA, USA) with SYBR Green PCR Master Mix (TaKaRa, Dalian, China), according to the manufacturer’s instructions. Relative expression was calculated using the delta-delta-Ct method. The qPCR reaction system was: 2×ChamQ SYBR qPCR Master Mix 10 μL; forward and reverse primers, 0.4 μL each; 50× ROX Reference Dye 0.4 μL; 2 μL template; addition of 6.8 μL ddH2O to 20 μL. qPCR response procedures: 40 cycles at 95 °C for 30 s, 95 °C for 10 s, 60 °C for 30 s.

Table 1.
Primers used for the qRT-PCR assays.
3. Results
3.1. Clinical Observation
On days 1–3 post-infection, the chickens in each group had no special symptoms. On the fourth day post-infection, the infected group began to excrete bloody diarrheas, and especially on the fifth day after infection, bloody diarrheas excretion was the highest. On the sixth day post-infection, bloody diarrheas excretion began to decrease. The infected chickens appeared listlessness, wasted food, and presented anal filth and paralytic and spasm symptoms. No chicken deaths occurred in the infected group during the trial period. On the eighth day, the infected chickens were found to have some cecum swelling and blackening. The chickens in the control group showed normal behavior, and their growth state was not different from that of normally fed chickens.
3.2. RNA-Seq Data Analysis
Transcriptome sequencing results and quality parameters are shown in Table 2. The number of raw reads per sample that were 100 bp in length ranged from 52,432,520 to 64,910,184, indicating high abundance. The GC content reached between 49.18% and 50.62%. This result indicated that the GC content of each sample was relatively consistent. The percentage of Q20 bases in each sample was greater than 96%. To remove the interference of the adapters and low-quality reads during transcriptional information analysis, the six samples were filtered for reads with adapters, low quality, and a ratio of N (N indicates that the bases could not be determined) greater than 10%. The total clean read length was 34.8 gigabases (Gb). Approximately 80% of the total reads mapped to the chicken chromosomes, and over 78% of the reads mapped uniquely. These results further confirmed the reliability of the RNA-seq analysis and the sampling accuracy of the cecum tissue used in this study.
Table 2.
Summary of sequencing reads mapping to the reference genome and quality parameters.
3.3. Identification of Differentially Expressed Genes in Chicken Ceca upon E. tenella Infection
In this study, fold change and p-value were evaluated and screened for DEGs. A fold change of more than 2 and a significance level of padj < 0.05 were considered to be significant. Using a volcano plot (Figure 1), we could see that 5477 DEGs were significantly changed, including 2942 upregulated genes and 2535 downregulated genes.
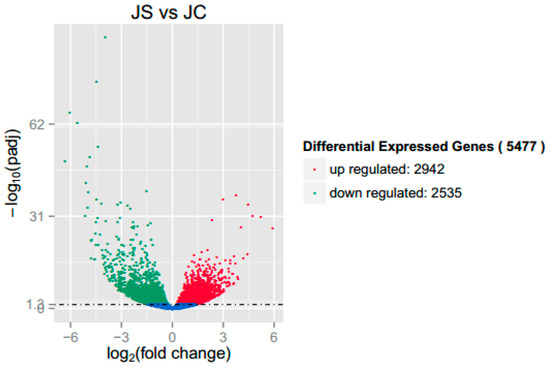
Figure 1.
Volcano plot of differentially expressed genes (DEGs) between the infected group (JS) and the uninfected group (JC). Note: The red dots and green dots indicate significantly upregulated and downregulated genes, respectively (padj < 0.05). The blue dots represent the genes whose difference in expression level between the JS and the JC groups did not reach significance (padj > 0.05).
3.4. GO Enrichment and KEGG Pathway Analysis for DEGs
GO analysis showed that there were 11236 GO terms enriched with DEGs, of which 545 were significantly enriched, including terms related to biological process, cellular component, and molecular function. The top 30 significantly enriched GO terms are shown in Figure 2. Biological process analysis showed that the largest groupings of DEGs were related to cell communication (GO:0007154), signaling (GO:0023052), single-organism signaling (GO:0044700), signal transduction (GO:0007165), and single-multicellular organism process (GO:0044707). Similarly, molecular function analysis of these genes revealed that the most prominent function was related to oxidoreductase activity (GO:0016491).
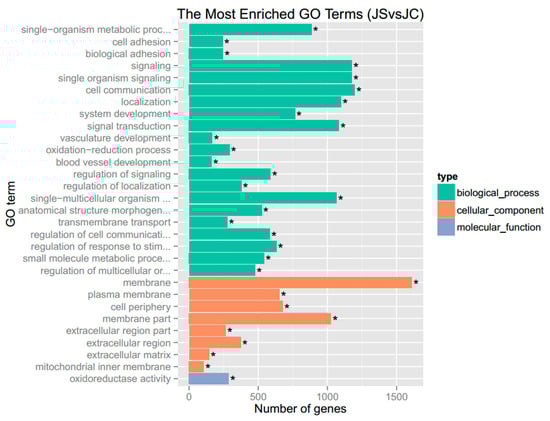
Figure 2.
The top 30 significantly enriched gene ontology (GO) terms. Note: “*” indicates the significance (padj < 0.05) of enriched GO terms.
The KEGG pathways of the DEGs are shown in Figure 3. The figure shows the top 20 pathways with the smallest q-value. Among them, the three most significantly enriched pathways were peroxisome proliferator-activated receptor (PPAR) signaling, focal adhesion, and extracellular matrix (ECM)–receptor interaction, for which there were 24, 55, and 24 enriched DEGs, respectively. The genes in these three pathways that are involved in the immune response were ANGPTL4, ACSL5, VEGFC, MAPK10¡, and CD44. Relevant information is shown in Table 3.
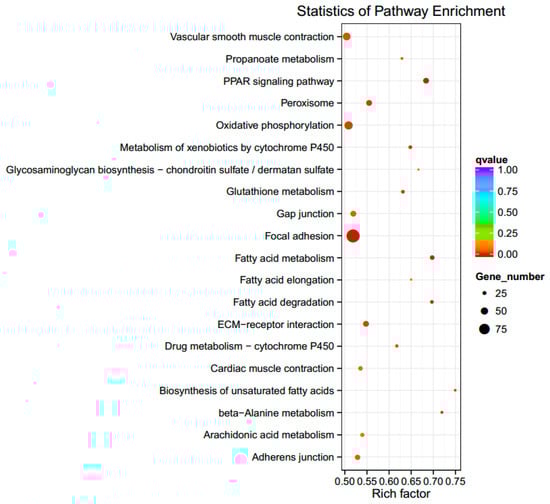
Figure 3.
The top 20 significantly enriched functional KEGG pathways. Note: The size of the dot represents the number of differentially expressed genes in the pathway. The color of the dot corresponds to different ranges of q-value (corrected p-value < 0.05). The vertical axis represents the enriched pathways. Rich factor refers to the ratio of the number of differential genes enriched to the number of annotated genes enriched in the pathway. The higher the rich factor value, the greater the enrichment degree will be. PPAR: peroxisome proliferator-activated receptor, ECM: extracellular matrix.
Table 3.
KEGG pathway analysis of DEGs.
3.5. Real-Time PCR Validation of Differential Gene Expression in Chicken Ceca
Among the DEGs, five upregulated and five downregulated DEGs were randomly selected to verify the reliability of the RNA-seq results by quantitative real-time PCR (qRT-PCR). The results demonstrated that the fold change of the upregulation and downregulation of the 10 selected DEGs was basically the same using two different detection methods, and the correlation coefficient of the two reached 0.988 (R2 = 0.975), which was highly significant (p < 0.000). The results from qRT-PCR analysis confirmed the high reproducibility of the RNA-seq data in this study (Table 4).
Table 4.
Validation of RNA-seq data by qRT-PCR.
4. Discussion
Coccidiosis of chickens is an acute parasitic disease that seriously damages the breeding industry and causes great economic loss to the commercial poultry industry [10]. Traditional methods for the prevention of coccidiosis have many disadvantages. Therefore, functional genomics and bioinformatics have become powerful techniques for studying host–pathogen interactions in coccidiosis. Studies have identified new candidate genes that influence the host immune responses to Eimeria spp. using chicken macrophage and lymphocyte cDNA microarrays [26]. Kim et al. [10] used a cDNA microarray to study gene expression in isolated intestinal lymphocytes and found a large number of genes significantly regulated by coccidial infection. Guo et al. [8] performed SAM of chicken cecum mucosa after 4.5 days of E. tenella infection using gene chip to explore the molecular mechanisms of coccidiosis infection and identified 7099 DEGs (4033 upregulated and 3066 downregulated). GO and KEGG analysis showed that the upregulated genes were mainly involved in immunity and defense, apoptosis and cell death, differentiation, signal transduction, and extracellular matrix (ECM) composition, while the downregulated genes mainly related to the membrane components and some transporters. In our study, the transcriptome library of the cecum tissues of chickens in the E. tenella JS and JC group was analyzed. A total of 5477 DEGs were detected. Among them, 2942 genes were upregulated, and 2535 genes were downregulated. The key DEGs linked to coccidial infection included ANGPTL4, ACSL5, VEGFC, MAPK10, CD44. KEGG pathway enrichment results showed that the main pathways related to these DEGs were PPAR signaling, focal adhesion, and ECM–receptor interaction. The comparison between this study and Guo et al. study showed that the sampling time was different, the number of DEGs was not the same, and the GO terms and majority of KEGG pathways related the identified DEGs were also different. Only the EMC–receptor interaction pathway was significantly enriched in both this study and the study by Guo et al.
PPARs are cell surface receptors that act as transcription factors and belong to the ligand-activated nuclear receptor superfamily [27]. In addition to mediating anti-inflammatory effects, PPARs participate in cell proliferation and differentiation, angiogenesis, apoptosis, and immune and inflammatory responses. Studies have shown that PPARs have a variety of inhibitory effects on inflammation, including reducing the transcriptional activity of NF-kB and the production of proinflammatory molecules in T lymphocytes, promoting the expression of anti-inflammatory mediators in the innate immune system, and inhibiting the genes encoding proinflammatory molecules in macrophages [28]. Focal adhesions are important cytoskeletal structures that not only maintain the normal structure of a cell but also participate in the normal functions of cell migration, movement, gene expression, survival, and apoptosis [29]. Because of the widespread tissue destruction caused by Eimeria protozoan invasion, it is tempting to hypothesize that part of the host’s physiological response in the gut to infection involves tightening of the cecal epithelial barrier, which may be accomplished in part by strengthening the interaction between epithelial cells and the extracellular matrix through focal adhesions [30]. As cell surface receptors, ECM receptors can specifically bind to other cell surface receptors, activate signal cascades, regulate neuron functions, and play an important role in controlling key events such as cell adhesion, migration, proliferation, differentiation, and survival [31]. Zhang et al. [31] performed RNA sequencing and KEGG pathway analysis of patients with hepatocellular carcinoma and found nine enriched pathways, among which were ECM–receptor interaction, focal adhesion, and TGF-β signaling. Guo et al. [8] found through transcriptome analysis, that the upregulated genes were mainly associated with immunity and defense (e.g., natural killer cell-mediated cytotoxicity) and ECM (e.g., ECM–receptor interaction) after infection of chicken cecum epithelial cells with E. tenella. This finding is consistent with the results of this experiment. Therefore, these significantly enriched pathways play a regulatory role in the process of host infection by coccidioides.
Angiopoietin-like 4 (ANGPTL4) is an important regulatory factor that can modulate vascular permeability and reactive oxygen species levels and promote angiogenesis and wound healing [32]. Studies have shown that ANGPTL4 stimulates endothelial cell growth and differentiation. More importantly, the combination of VEGF and ANGPTL4 protects endothelial cells from inhibition by rosiglitazone [33]. ACSL5 has been associated with cell development and maturation, physiopathological processes, apoptosis, and tumorigenesis [34]. Several in vivo and in vitro studies have indicated that ACSL5 may play an important role in the immune dysfunction of lupus-like mouse models [35]. In this study, E. tenella infection led to intestinal mucosal damage and caecal bleeding; the ANGPTL4 gene and the ACSL5 gene can promote cell development and angiogenesis, and they were both significantly upregulated in the PPAR pathway on the seventh day after chicken infection with coccidioides. Therefore, these two genes may be involved in the process of host response to coccidial infection.
CD44 is a cell surface adhesion receptor that regulates metastasis via recruitment of CD44 to the cell surface. Its interaction with appropriate ECM ligands can promote migration and invasion processes in the process of cell metastasis [36]. DeGrendele et al. [37] showed that a combination of T cells and antibodies can induce the generation of CD44-HA and promote the infiltration of lymphocytes in inflammatory sites. Our study found that CD44 was significantly expressed in the the ECM–receptor interaction pathway.
We also observed that multiple DEGs associated with the significantly enriched focal adhesion pathway were either up- or downregulated during E. tenella infection. Vascular endothelial growth factor C (VEGFC) is a vascular epithelial growth factor. Its main function is to affect lymphatic epithelial cells together with its receptor VEGFR-3 (FLT4), thereby promoting cell growth and proliferation and regulating the growth of lymphatic vessels [38]. It has been reported that the interaction between VEGFC and VEGFR-3 mediates lymphatic endothelial cell (LEC) proliferation, survival, migration, and tube formation during the lymphangiogenesis process [39]. MAPK10, a member of the Jun N-terminal kinase subgroup of mitogen-activated protein kinases, has proapoptotic functions and can function as a tumor-suppressor protein to suppress tumorigenesis [40]. In this study, DEGs were significantly enriched in the focal adhesion pathway, and their expression levels were significantly higher than in the control group. The results showed that these DEGs were involved in the immune response, apoptosis, and angiogenesis processes with E. tenella infection.
In conclusion, this study systematically reveals the DEGs and significantly enriched GO terms and KEGG pathways between an E. tenella-infected group and an uninfected group using RNA-seq technology. We found that the signaling pathways with the most significant enrichment of differentially expressed genes between infected group and uninfected group included focal adhesion, extracellular matrix–receptor interaction, and peroxisome proliferator-activated receptor, which may play a role in the chicken’s response to E. tenella infection. The results further enhance our understanding of the molecular response process and immune response mechanism during E. tenella infection.
Author Contributions
Conceptualization, G.D.; Data curation, X.W., W.Z., and H.Y.; Formal analysis, G.Z., T.Z., K.X., and H.S.; Funding acquisition, J.W. and G.D.; Investigation, W.Z. and H.Y.; Methodology, Y.L. and G.D.; Resources, G.Z., T.Z., K.X., and H.S.; Software, X.W. and G.D.; Validation, Y.L., T.Z. and J.W.; Writing – original draft, X.W. and W.Z.; Writing – review & editing, X.W.
Funding
This work was supported by the earmarked fund for Jiangsu Agriculture (Broilers) Industrial Technology System (SXGC[2017]298), the Jiangsu Agricultural Industry Technology System (JATS[2018]303), the National Sci-Tech Support Plan (2014BAD13B02), the Priority Academic Program Development of Jiangsu Higher Education Institutions (PAPD), and the China Agriculture Research System (CARS-41-G23).
Acknowledgments
The authors would like to thank all members of the lab for their advice and technical assistance.
Conflicts of Interest
The authors declare no conflict of interest.
References
- Blake, D.P.; Tomley, F.M. Securing poultry production from the ever-present Eimeria challenge. Trends Parasitol. 2014, 30, 12–19. [Google Scholar] [CrossRef]
- Chapman, H.D.; Jeffers, T.K.; Williams, R.B. Forty years of monensin for the control of coccidiosis in poultry. Poult. Sci. 2010, 89, 1788–1801. [Google Scholar] [CrossRef] [PubMed]
- Jang, S.I.; Lillehoj, H.S.; Lee, S.H.; Lee, K.W.; Park, M.S.; Bauchan, G.R.; Lillehoj, E.P.; Bertrand, F.; Dupuis, L.; Deville, S. Immunoenhancing effects of montanide ISA oil-based adjuvants on recombinant Coccidia antigen vaccination against Eimeria acervulina infection. Vet. Parasitol. 2010, 172, 221–228. [Google Scholar] [CrossRef] [PubMed]
- Qi, N.S.; Wang, Y.Y.; Liao, S.Q.; Wu, C.Y.; Lv, M.N.; Li, J.; Tong, Z.X.; Sun, M.F. Partial protective of chickens against Eimeria tenella challenge with recombinant EtMIC-1 antigen. Parasitol. Res. 2013, 112, 2281–2287. [Google Scholar] [CrossRef]
- Liu, Y.; Zheng, J.; Li, J.; Gong, P.; Zhang, X. Protective immunity induced by a DNA vaccine encoding Eimeria tenellar homboid against homologous challenge. Parasitol. Res. 2013, 112, 251–257. [Google Scholar] [CrossRef]
- Mathis, G.; Waldrip, D.; Dickson, J.; Cookson, K.; LaVorgna, M.; Schaeffer, J. Effect of lasalocid or salinomycin administration on performance and immunity following Coccidia vaccination of commercial broilers. J. Appl. Poult. Res. 2014, 23, 577–585. [Google Scholar] [CrossRef]
- Lillehoj, H.S.; Hong, Y.; Kim, C. Quantitative genetic and functional genomics approaches to investigating parasite disease resistance and protective immune mechanisms in avian coccidiosis. Dev. Biol. (Basel) 2008, 132, 67–75. [Google Scholar] [CrossRef] [PubMed]
- Guo, A.; Cai, J.; Gong, W.; Yan, H.; Luo, X.; Tian, G.; Zhang, S.; Zhang, H.; Zhu, G.; Cai, X. Transcriptome analysis in chicken cecal epithelia upon infection by Eimeria tenella in vivo. PLoS ONE 2013, 8, e64236. [Google Scholar] [CrossRef]
- Wang, Z.; Gerstein, M.; Snyder, M. RNA-Seq: A revolutionary tool for transcriptomics. Nat. Rev. Genet. 2009, 10, 57–63. [Google Scholar] [CrossRef] [PubMed]
- Kim, D.K.; Lillehoj, H.; Min, W.; Kim, C.H.; Park, M.S.; Hong, Y.H.; Lillehoj, E.P. Comparative microarray analysis of intestinal lymphocytes following Eimeria acervulina, E. maxima, or E. tenella infection in the chicken. PLoS ONE 2011, 6, e27712. [Google Scholar] [CrossRef] [PubMed]
- Morris, G.M.; Woods, W.G.; Richards, D.G.; Gasser, R.B. Investigating a persistent coccidiosis problem on a commercial broiler-breeder farm utilising PCR-coupled capillary electrophoresis. Parasitol. Res. 2007, 101, 583–589. [Google Scholar] [CrossRef] [PubMed]
- Long, P.L.; Johnson, J.; Wyatt, R.D. Pathological and clinical effects of Eimeria tenella in partially immune chickens. J. Comp. Pathol. 1981, 91, 581–587. [Google Scholar] [CrossRef]
- Jiao, J.; Yang, Y.; Liu, M.; Li, J.; Cui, Y.; Yin, S.; Tao, J. Artemisinin and Artemisia annua leaves alleviate Eimeria tenella infection by facilitating apoptosis of host cells and suppressing inflammatory response. Vet. Parasitol. 2018, 254, 172–177. [Google Scholar] [CrossRef] [PubMed]
- She, R.; Fei, C.; Chen, H.; Wang, X.; Wang, M.; Zhang, K.; Zhang, L.; Wang, C.; Liu, Y.; Zheng, W.; et al. Action of nitromezuril against Eimeria tenella with clinically anticoccidial indices and histopathology. Parasitol. Res. 2017, 116, 2167–2174. [Google Scholar] [CrossRef] [PubMed]
- Langmead, B.; Salzberg, S.L. Fast gapped-read alignment with Bowtie 2. Nat. Methods 2012, 9, 357–359. [Google Scholar] [CrossRef]
- Trapnell, C.; Pachter, L.; Salzberg, S.L. TopHat: Discovering splice junctions with RNA-Seq. Bioinformatics 2009, 25, 1105–1111. [Google Scholar] [CrossRef] [PubMed]
- Trapnell, C.; Roberts, A.; Goff, L.; Pertea, G.; Kim, D.; Kelley, D.R.; Pimentel, H.; Salzberg, S.L.; Rinn, J.L.; Pachter, L. Differential gene and transcript expression analysis of RNA-seq experiments with TopHat and Cufflinks. Nat. Protoc. 2012, 7, 562–578. [Google Scholar] [CrossRef] [PubMed]
- Anders, S.; Pyl, P.T.; Huber, W. HTSeq: A python framework to work with high-throughput sequencing data. Bioinformatics 2010, 31, 166–169. [Google Scholar] [CrossRef] [PubMed]
- Mortazavi, A.; Williams, B.A.; McCue, K.; Schaeffer, L.; Wold, B. Mapping and quantifying mammalian transcriptomes by RNA-Seq. Nat. Methods 2008, 5, 621–628. [Google Scholar] [CrossRef]
- Anders, S.; Huber, W. Differential expression analysis for sequence count data. Genome Biol. 2010, 11, R106. [Google Scholar] [CrossRef]
- Benjamini, Y.; Hochberg, Y. Controlling the false discovery rate: A practical and powerful approach to multiple testing. J. R. Stat. Soc. Ser. B (Methodol.) 1995, 57, 289–300. [Google Scholar] [CrossRef]
- Young, M.D.; Wakefield, M.J.; Smyth, G.K.; Oshlack, A. Gene ontology analysis for RNA-seq: Accounting for selection bias. Genome Biol. 2010, 11, R14. [Google Scholar] [CrossRef] [PubMed]
- Mao, X.; Cai, T.; Olyarchuk, J.G.; Wei, L. Automated genome annotation and pathway identification using the KEGG Orthology (KO) as a controlled vocabulary. Bioinformatics 2005, 21, 3787–3793. [Google Scholar] [CrossRef] [PubMed]
- Zhu, J.J.; Lillehoj, H.S.; Allen, P.C.; Van Tassell, C.P.; Sonstegard, T.S.; Cheng, H.H.; Pollock, D.; Sadjadi, M.; Min, W.; Emara, M.G. Mapping quantitative trait loci associated with resistance to coccidiosis and growth. Poult. Sci. 2003, 82, 9–16. [Google Scholar] [CrossRef] [PubMed]
- Yue, H.; Lei, X.W.; Yang, F.L.; Li, M.Y.; Tang, C. Reference gene selection for normalization of PCR analysis in chicken embryo fibroblast infected with H5N1 AIV. Virol. Sin. 2010, 25, 425–431. [Google Scholar] [CrossRef]
- Kim, C.H.; Lillehoj, H.S.; Hong, Y.H.; Keeler, C.L., Jr.; Lillehoj, E.P. Comparison of global transcriptional responses to primary and secondary Eimeria acervulina infections in chickens. Dev. Comp. Immunol. 2010, 34, 344–351. [Google Scholar] [CrossRef] [PubMed]
- Rizzo, G.; Fiorucci, S. PPARs and other nuclear receptors in inflammation. Curr. Opin. Pharmacol. 2006, 6, 421–427. [Google Scholar] [CrossRef]
- Huang, W.; Glass, C.K. Nuclear receptors and inflammation control: molecular mechanisms and pathophysiological relevance. Arterioscler. Thromb. Vasc. Biol. 2010, 30, 1542–1549. [Google Scholar] [CrossRef]
- Zhao, X.; Guan, J.L. Focal adhesion kinase and its signaling pathways in cell migration and angiogenesis. Adv. Drug Deliv. Rev. 2011, 63, 610–615. [Google Scholar] [CrossRef]
- Pinard, M.H.; Gay, C.; Pastoret, P.P.; Dodet, B. Animal genomics for animal health. Dev. Biol. (Basel) 2008, 132, 73. [Google Scholar] [CrossRef]
- Zhang, H.; Ye, J.; Weng, X.; Liu, F.; He, L.; Zhou, D.; Liu, Y. Comparative transcriptome analysis reveals that the extracellular matrix receptor interaction contributes to the venous metastases of hepatocellular carcinoma. Cancer Genet. 2015, 208, 482–491. [Google Scholar] [CrossRef]
- Lan, G.; Xie, W.; Li, L.; Zhang, M.; Liu, D.; Tan, Y.L.; Cheng, H.P.; Gong, D.; Huang, C.; Zheng, X.L.; et al. MicroRNA-134 actives lipoprotein lipase-mediated lipid accumulation and inflammatory response by targeting angiopoietin-like 4 in THP-1 macrophages. Biochem. Biophys. Res. Commun. 2016, 472, 410–417. [Google Scholar] [CrossRef] [PubMed]
- Gealekman, O.; Burkart, A.; Chouinard, M.; Nicoloro, S.M.; Straubhaar, J.; Corvera, S. Enhanced angiogenesis in obesity and in response to PPARgamma activators through adipocyte VEGF and ANGPTL4 production. Am. J. Physiol. Endocrinol. Metab. 2008, 295, E1056–E1064. [Google Scholar] [CrossRef]
- Reinartz, A.; Ehling, J.; Leue, A.; Liedtke, C.; Schneider, U.; Kopitz, J.; Weiss, T.; Hellerbrand, C.; Weiskirchen, R.; Knuchel, R.; et al. Lipid-induced up-regulation of human acyl-CoA synthetase 5 promotes hepatocellular apoptosis. Biochim. Biophys. Acta 2010, 1801, 1025–1035. [Google Scholar] [CrossRef]
- Catala-Rabasa, A.; Ndagire, D.; Sabio, J.M.; Fedetz, M.; Matesanz, F.; Alcina, A. High ACSL5 transcript levels associate with systemic lupus erythematosus and apoptosis in Jurkat T lymphocytes and peripheral blood cells. PLoS ONE 2011, 6, e28591. [Google Scholar] [CrossRef]
- Senbanjo, L.T.; Chellaiah, M.A. CD44: A multifunctional cell surface adhesion receptor is a regulator of progression and metastasis of cancer cells. Front. Cell Dev. Biol. 2017, 5, 18. [Google Scholar] [CrossRef] [PubMed]
- DeGrendele, H.C.; Estess, P.; Siegelman, M.H. Requirement for CD44 in activated T cell extravasation into an inflammatory site. Science 1997, 278, 672–675. [Google Scholar] [CrossRef] [PubMed]
- Sakima, M.; Hayashi, H.; Mamun, A.A.; Sato, M. VEGFR-3 signaling is regulated by a G-protein activator, activator of G-protein signaling 8, in lymphatic endothelial cells. Exp. Cell Res. 2018, 368, 13–23. [Google Scholar] [CrossRef] [PubMed]
- Wissmann, C.; Detmar, M. Pathways targeting tumor lymphangiogenesis. Clin. Cancer Res. 2006, 12, 6865–6868. [Google Scholar] [CrossRef]
- Ying, J.; Li, H.; Cui, Y.; Wong, A.H.; Langford, C.; Tao, Q. Epigenetic disruption of two proapoptotic genes MAPK10/JNK3 and PTPN13/FAP-1 in multiple lymphomas and carcinomas through hypermethylation of a common bidirectional promoter. Leukemia 2006, 20, 1173–1175. [Google Scholar] [CrossRef]
© 2019 by the authors. Licensee MDPI, Basel, Switzerland. This article is an open access article distributed under the terms and conditions of the Creative Commons Attribution (CC BY) license (http://creativecommons.org/licenses/by/4.0/).