1. Introduction
The Golgi complex is an essential organelle in the secretory pathway, in which newly synthesized proteins and lipids undergo posttranslational modifications, and are subsequently sorted to their target locations. The Golgi complex consists of a stack of densely packed and flattened cisternal membranes. Stacks are commonly interconnected and form a ribbon-like structure that resides close to the nucleus. A large body of evidence has shown that the Golgi apparatus is dynamic and is able to disassemble and reassemble under a variety of stress conditions or during cell division cycles through mechanisms that are not well understood [
1,
2,
3].
As the cell progresses through the interphase of the cell cycle, the Golgi apparatus, like other organelles, must duplicate in content and in size before its correct partitioning into daughter cells [
1,
4]. This process appears to be tightly coupled to cell growth, and probably involves a complex interplay between extracellular signals and intracellular transcriptional and posttranscriptional networks that induce expression of genes encoding organellar proteins. However, how this process occurs and is regulated remains largely unknown.
A detailed cell synchronization analysis at various cell cycle phases has shown that continuous Golgi growth and cell size growth are initiated at late G1 to reach a near doubling at the end of G2 phase [
4], coinciding with increasing protein translation of some Golgi components, such as the Golgi structural protein
GOLGA2 (GM130) and the Golgi enzyme MAN2A2 (MannII). The kinase S6K1, whose levels are increased at late G1 phase, is thought to mediate a rise in Golgi protein content [
4]. In addition to translational control of Golgi-specific protein production, there is some evidence for transcriptional regulation [
5,
6].
Major regulation of timely gene expression during G1-to-S progression is carried out by the E2F family of transcription factors (E2F1-8). According to the currently accepted model of cell cycle regulation, in quiescent cells, the transcription of genes required for cell cycle entry and progression is repressed by complexes formed by hypophosphorylated Retinoblastoma-family (Rb) of proteins bound to E2F factors [
7], together with a large number of chromatin modifying components. The repressor complexes, which can be formed by different members of the E2F family [
8,
9], are disrupted upon phosphorylation of Rb pocket proteins by Cyclin/CDK complexes upon entry into the G1 phase. Consequently, free E2F is able to induce the expression of genes necessary for DNA replication and cell cycle progression [
10]. Whether E2Fs are involved in regulating the expression of components of cellular organelles such as those residing in the Golgi complex remains to be determined. Given the timely regulation of Golgi growth during the cell cycle, we analyzed the impact of cell cycle regulatory mechanisms on the expression of genes encoding Golgi-specific proteins. We find that
GOLPH3 expression is regulated by E2F factors through E2F motifs present in its promoter. Moreover, we identify a critical CREB/ATF element in the
GOLPH3 promoter that is required for its steady state as well as ATF-induced expression. Our findings uncover a transcriptional regulation of genes encoding Golgi-specific proteins, and present evidence suggesting that the coordinated action of nuclear and Golgi components is necessary for the timely progression of the cell cycle.
2. Materials and Methods
2.1. Cell Culture and Flow Cytometry
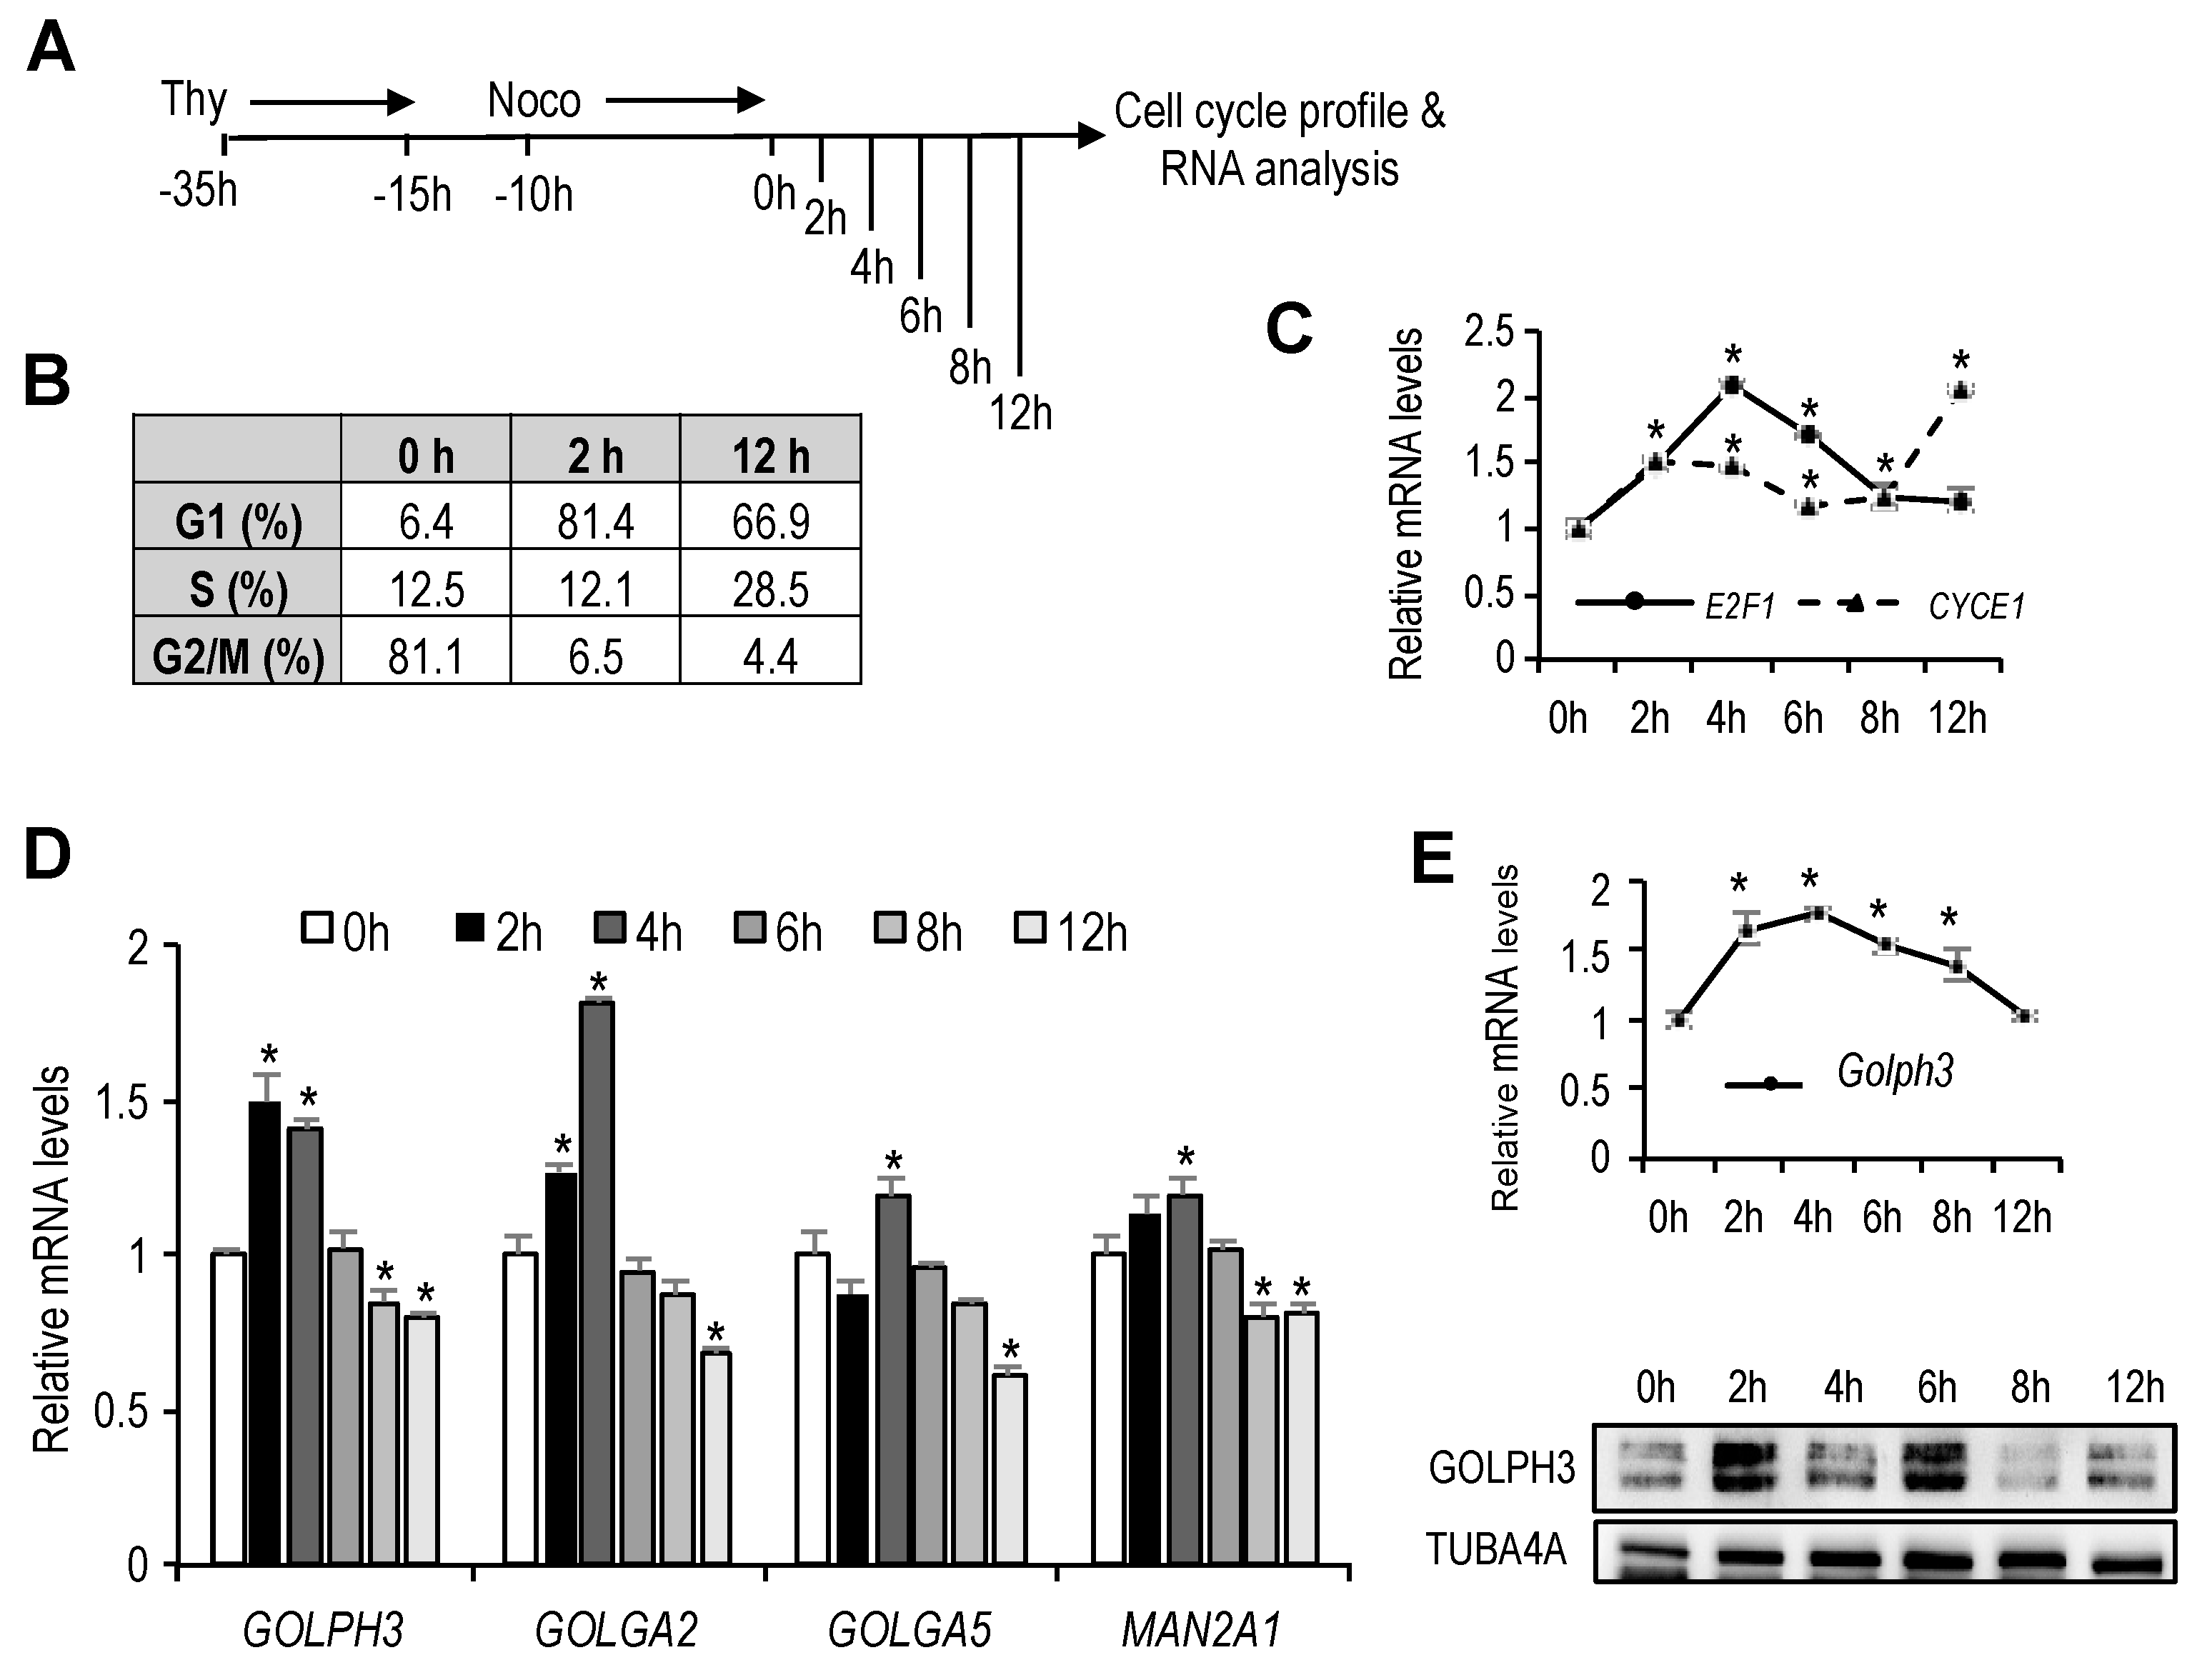
Human U2OS osteosarcoma and mouse NIH 3T3 fibroblast cell lines were maintained in Dulbecco’s modified Eagle’s medium supplemented with fetal bovine serum (10%). For cell synchronization at mitosis, U2OS cell cultures were incubated with thymidine (2 nM) for 20 h. Subsequently, cells were washed and cultured for an additional 15 h in fresh medium. Nocodazole (50 ng/mL) was added to the cultures for the last 10 h. Mitotic cells were collected by shaking off the plates and seeded in complete medium for subsequent analyses. For cell synchronization at G0, NIH3T3 cells were incubated for 48 h with Dubelcco’s modified Eagle’s medium supplemented with 0.1% fetal bovine serum. After G0 synchronization, cells were collected at different times for subsequent analysis.
To assess cell-cycle distribution, cells were fixed with chilled 70% ethanol, stained with 50 µg/mL propidium iodide (PI) and analyzed by flow cytometry (FACSCalibur, BD). The analyses of generated data were performed with Summit 4.3 software.
2.2. Plasmid Description
Mammalian expression plasmids pRc-CMV-HA-E2F1, pRc-CMV-HA-E2F2, pRc-CMV-HA-E2F3 have been previously described [
11]. Plasmid pCMV6-XL5-E2F7 was purchased from Origene. Plasmids pATF2-HA and pΔ-ATF2-HA were kindly provided by Dr. Lazo-Zbikowski. To construct the wild-type pGL2-
GOLPH3Promoter-luc (pGP3-WT-luc) reporter plasmid, 488 bp (−254 to +234) of the human
GOLPH3 promoter region was amplified by PCR using human genomic DNA as template (See
Supplementary Table S1 for primer sequence information). PCR product was digested with MluI and HindIII and cloned into the pGL2-basic luciferase reporter vector (Promega).
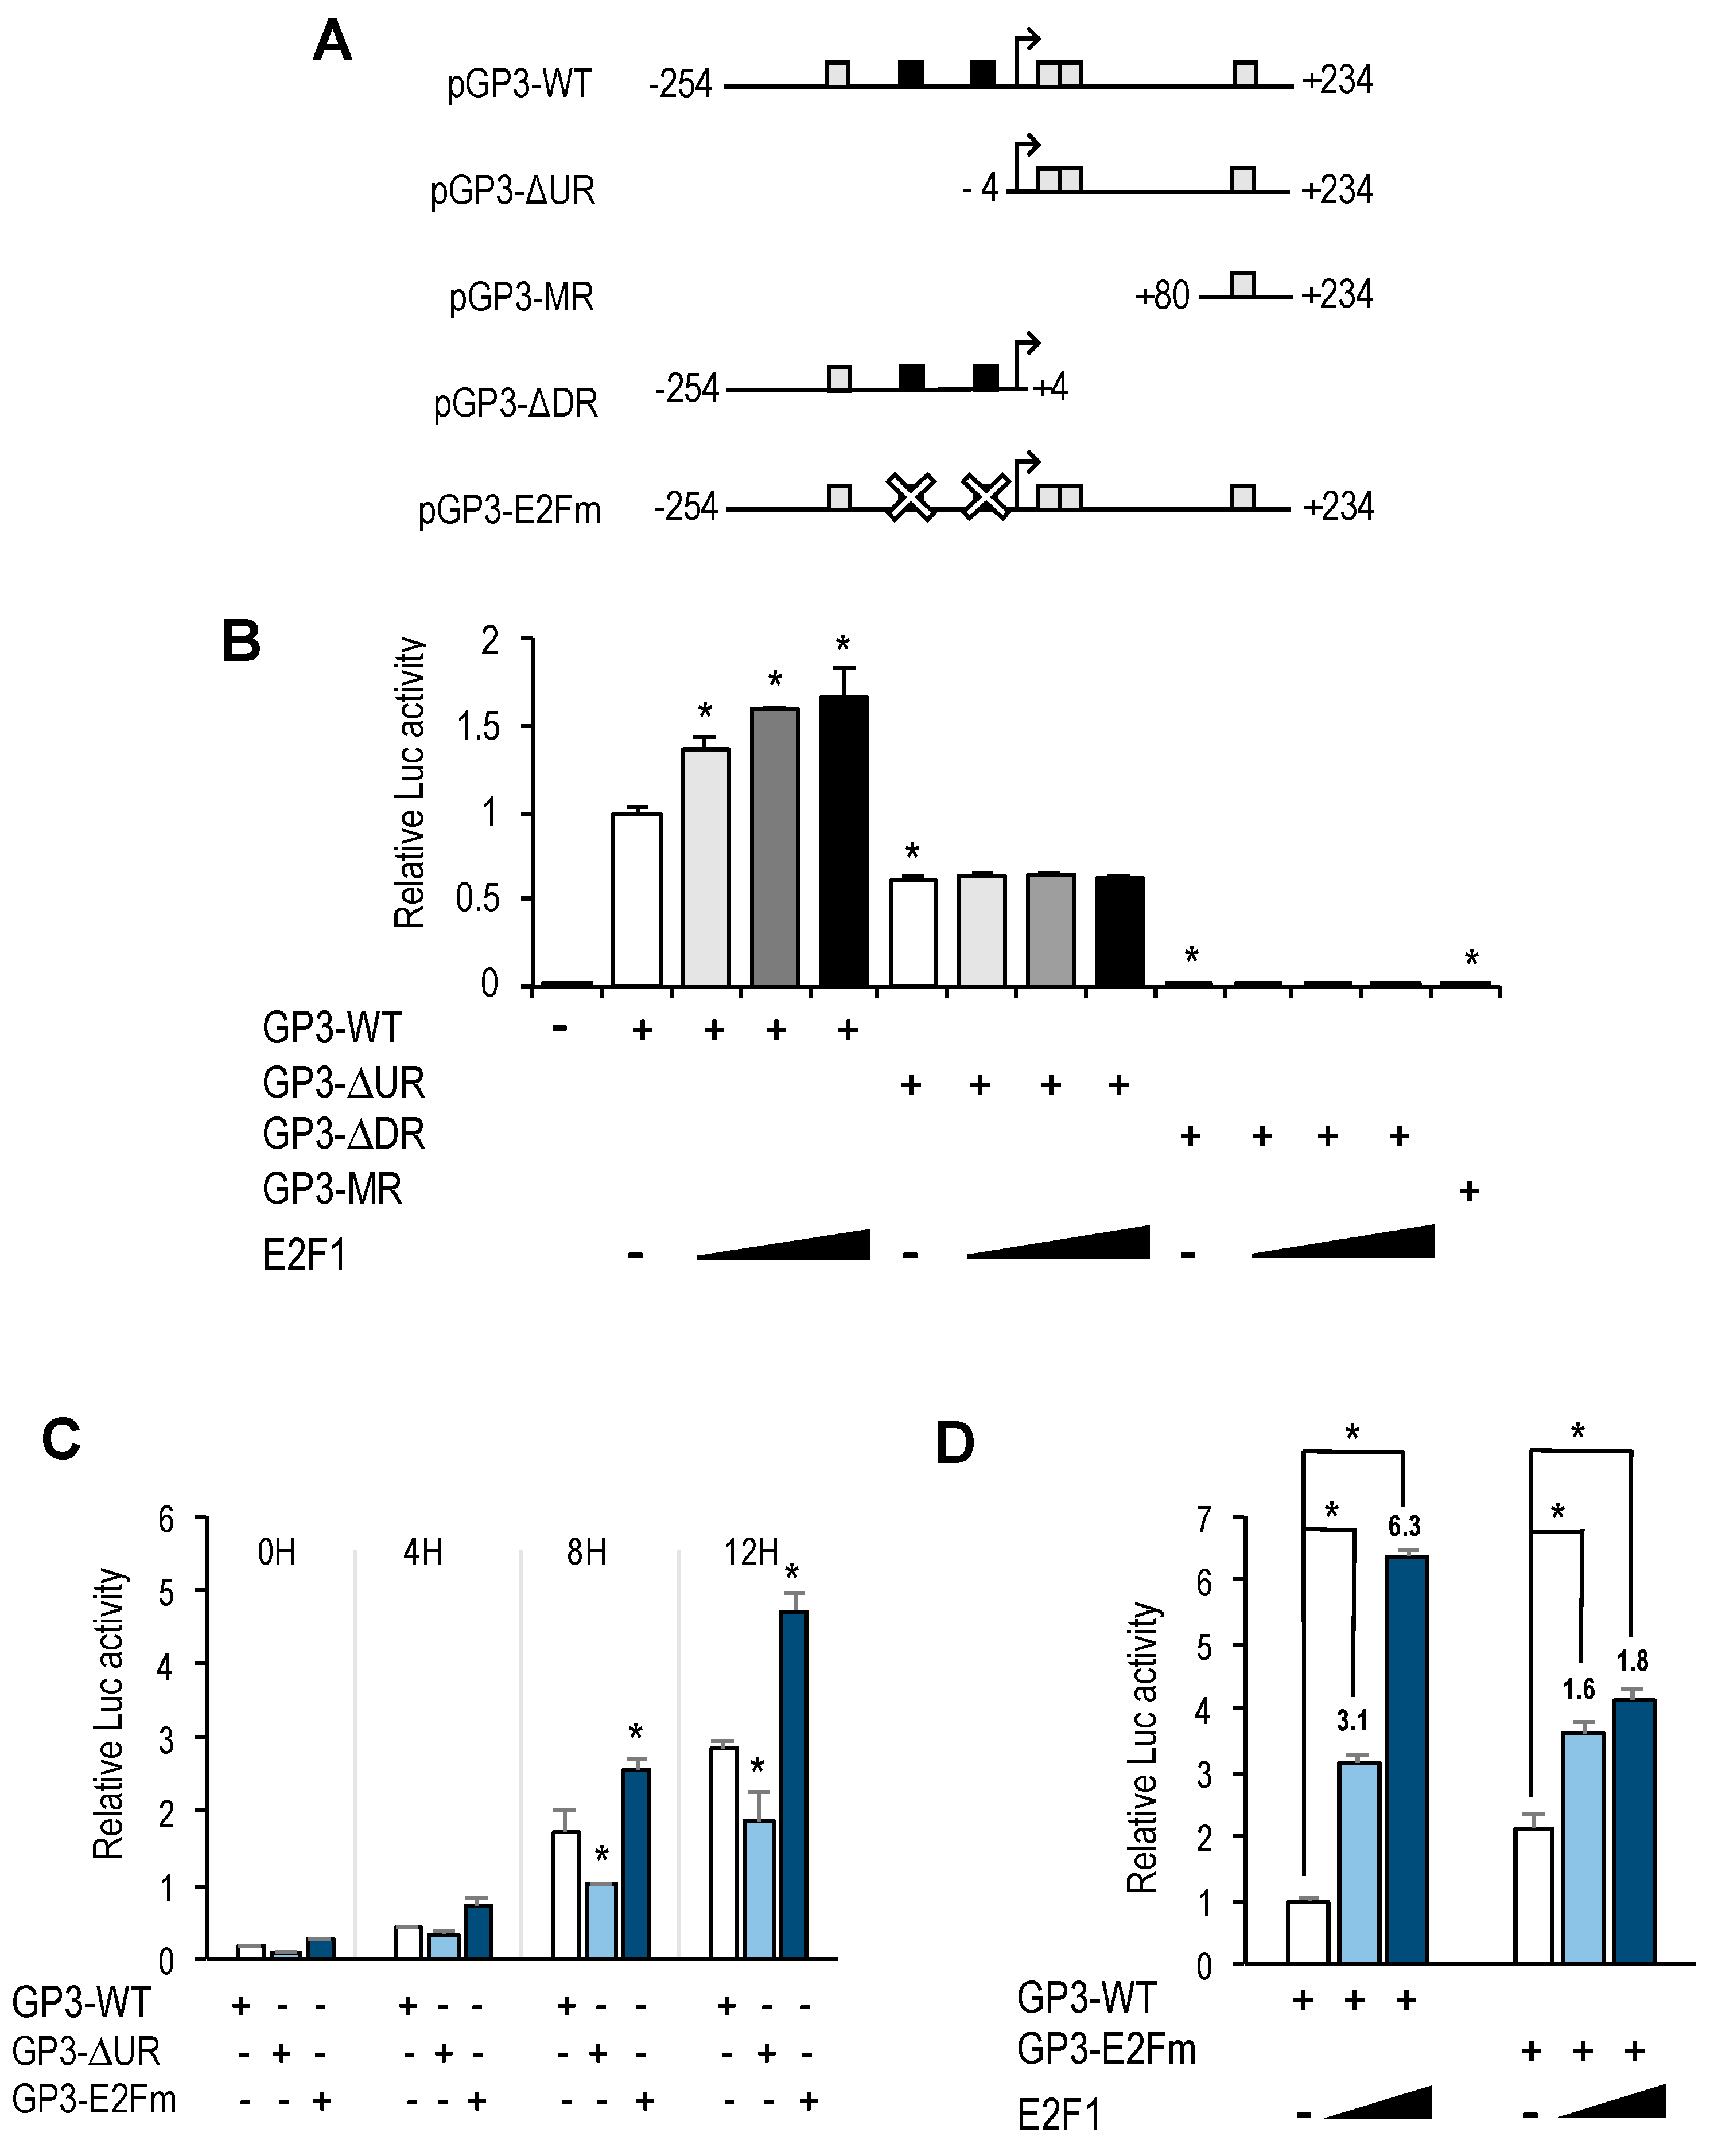
DNA fragments encoding GOLPH3 promoter deletion mutants lacking the upstream region (pGP3-ΔUR-luc), the downstream region (pGL2-GP3-ΔDR-luc) or containing only a minimal region (pGP3-MR-luc) were amplified by PCR using the pGP3-WT-luc vector as template. PCR products were digested with MluI and HindIII and ligated into pGL2-basic vector to generate the corresponding pGP3-WT deletion mutant.
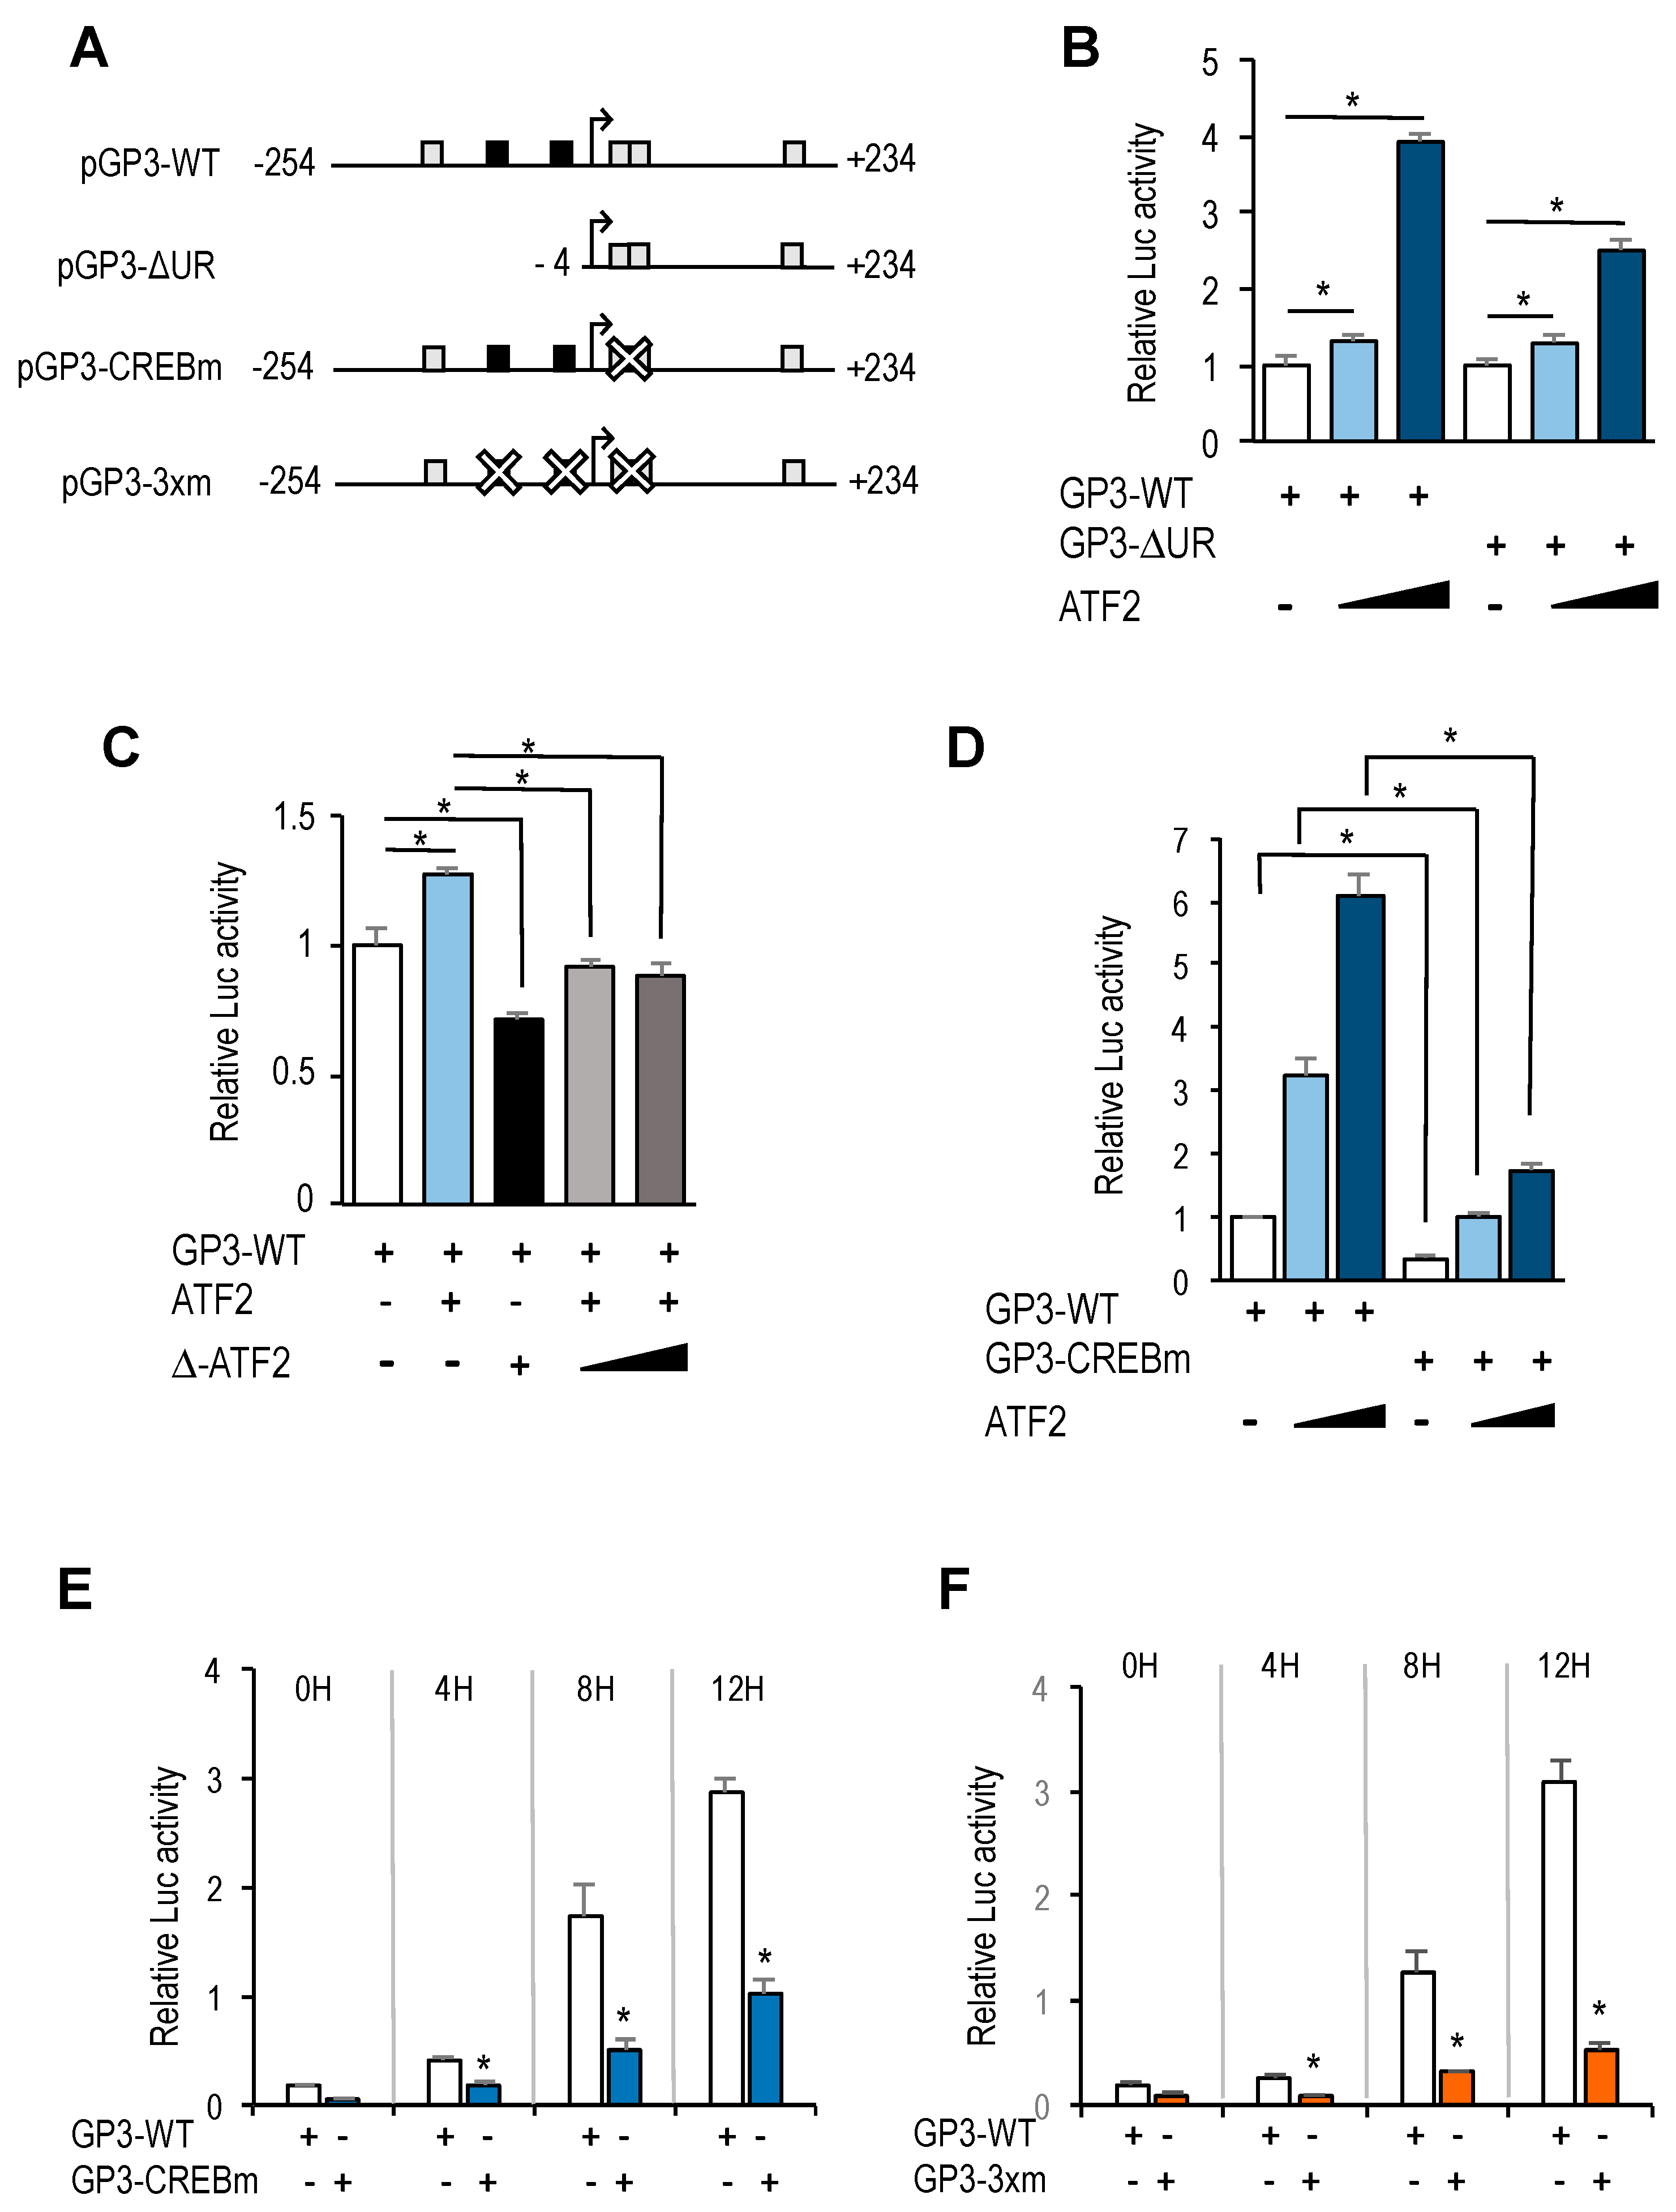
Site-directed mutagenesis of the CREB/ATF motifs in pGP3-WT-luc reporter plasmid was carried out using the QuickChange Lightning Site-Directed Mutagenesis Kit (Agilent Technologies), following the manufacturer’s directions. Briefly, forward and reverse mutagenic primers containing mutated nucleotides (See
Supplementary Table S2 for nucleotide sequences of the primer sets used for mutagenesis) were used to PCR amplify pGP3-WT-luc plasmid. Subsequently, parental DNA digested with
DpnI and remaining plasmid was transformed into competent cells for nick repair. The resulting plasmid was named pGP3-CREBm-luc.
Site-directed mutagenesis of the two E2F motifs in pGP3-WT-luc reporter plasmid was carried out using the QuickChange Multi Site-Directed Mutagenesis Kit (Agilent Technologies), following the manufacturer’s directions. Briefly, two mutagenic forward primers were used to synthesize the mutant strand using pGP3-WT-luc as template. After DpnI digestion of template strand, mutant ssDNA strand was transformed into XL10 Gold competent cells. The resulting plasmid was named pGP3-E2Fm-luc.
Site-directed mutagenesis of the triple mutant for E2F and CREB/ATF motifs was carried out using pGP3-E2Fm-luc as template and CREB forward and reverse mutagenic primers, as indicated above. The resulting plasmid was named pGP3-3xm-luc.
The orientation and integrity of all constructions were confirmed by DNA sequencing.
2.3. Transfections and siRNA-Mediated Knockdown
Plasmid transfection was performed with various amounts of DNA in 6-well or 12-well culture dishes using XtremeGENE HD (Roche Pharma, Basel, Switzerland) transfection reagent following manufacturer’s recommendations. The mixture was incubated for 25 min at room temperature and added dropwise to cell cultures.
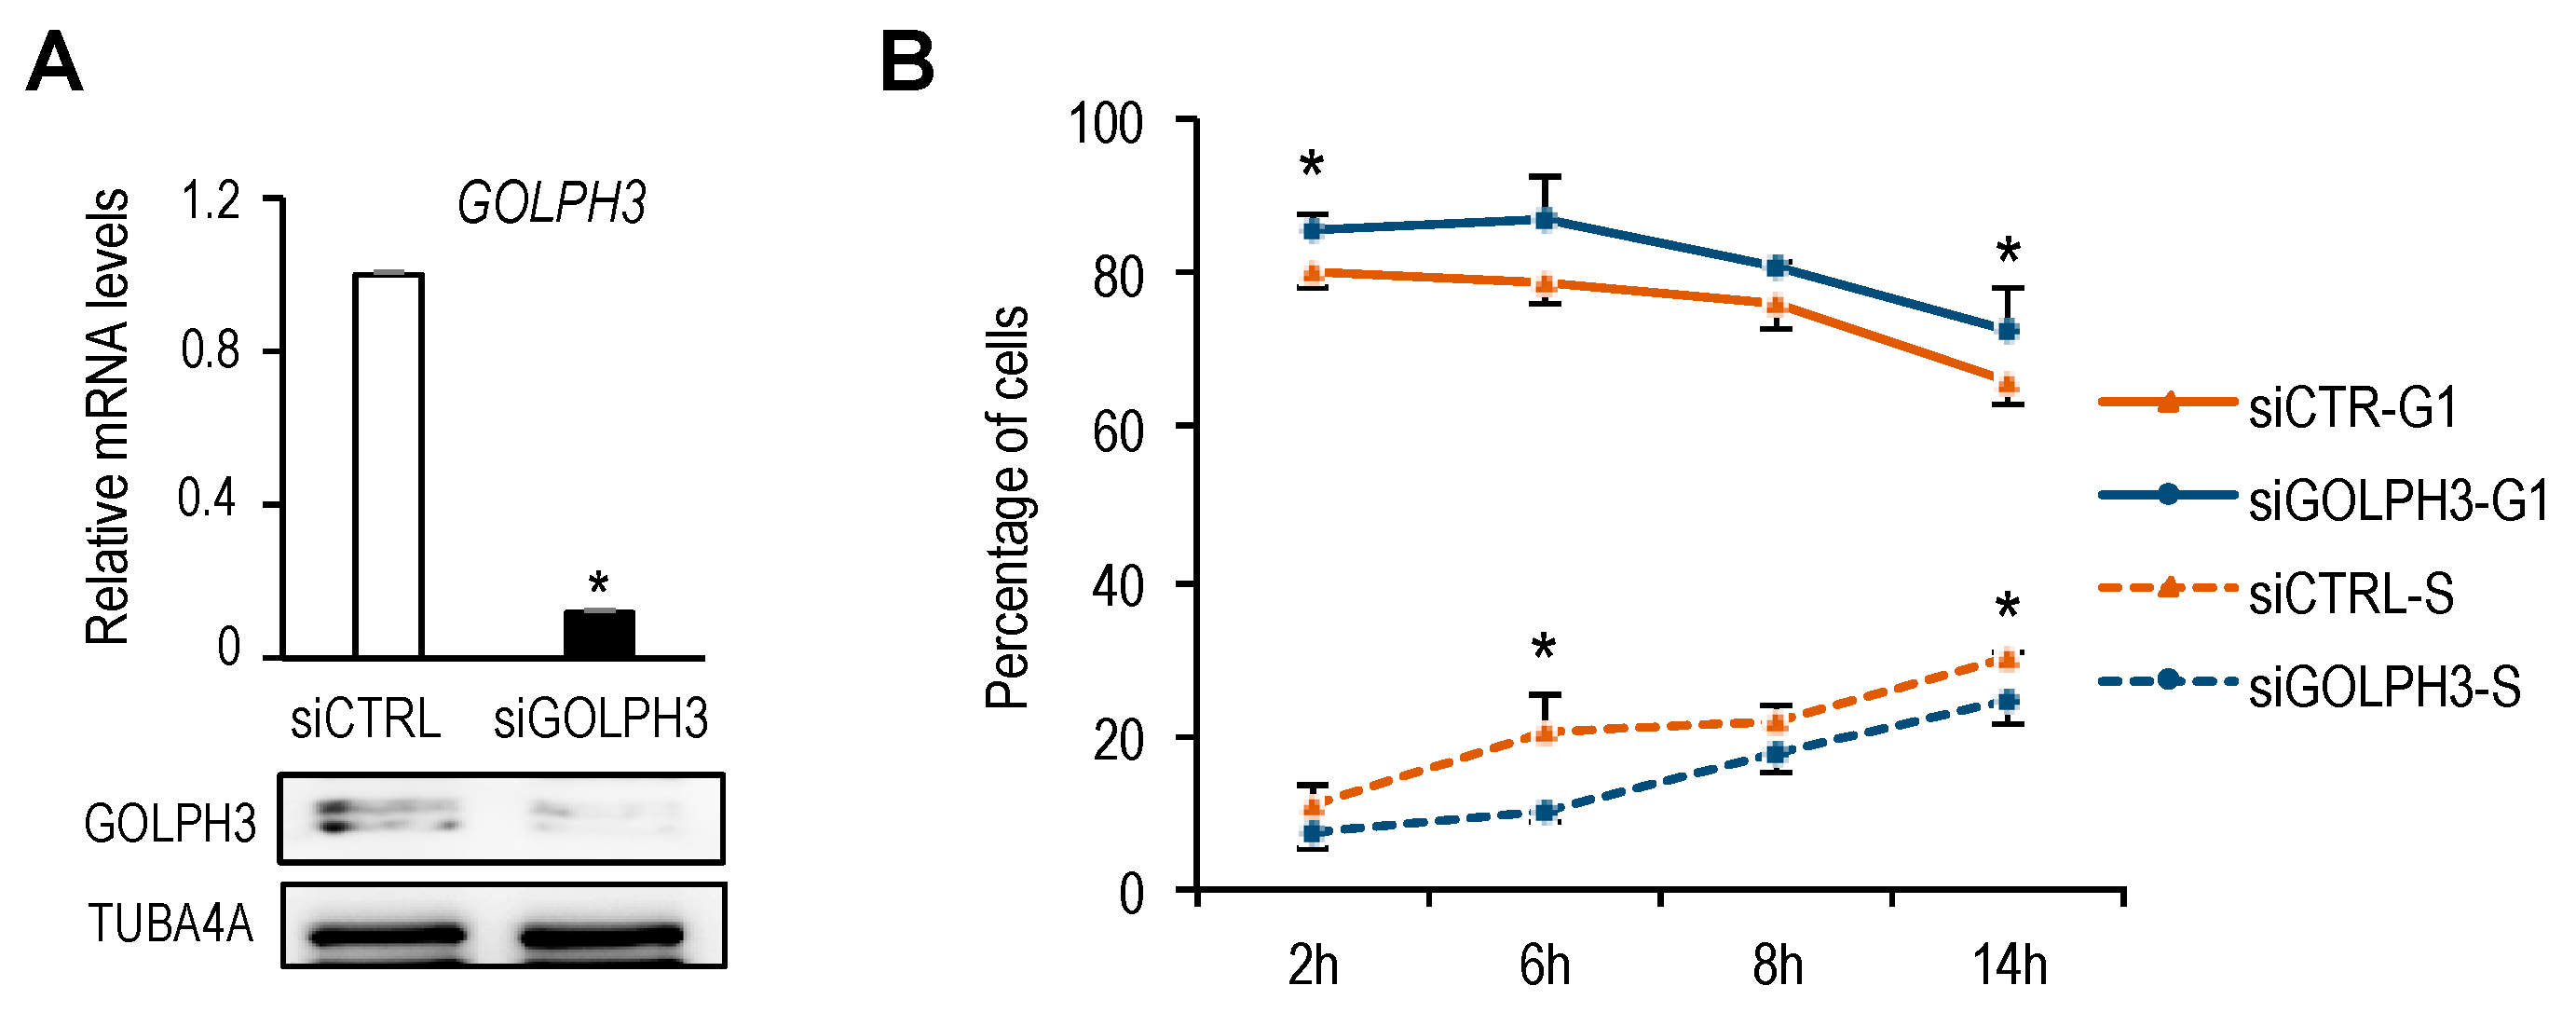
For knockdown of endogenous
GOLPH3 [
12], commercial small interfering RNA (siRNA) oligonucleotides (Life Technologies, Carlsbad, CA, USA) were transfected at a final concentration of 7.5 nM using Lipofectamine RNAiMAX (Life Technologies) following the manufacturer’s recommendation.
2.4. Luciferase Activity Assay
For luciferase activity assays in asynchronous cells, U2OS cells were plated at a density of 2 × 10⁵ cells/well on a six-well plate, and 24 h later, cotransfected with 500 ng of the firefly luciferase reporter vector, 20 ng of the Renilla luciferase reporter vector (pRL-TK) and varying amounts of expression plasmids. The total amount of DNA in the reaction mixtures was brought to 1 µg using pCMV vector. Using the Dual-Luciferase Reporter Assay System (Promega, Madison, WI, USA), the reporter firefly luciferase activity was measured 24 h or 48 h after transfection, following the manufacturer’s recommendations. Data were normalized to the transfection efficiency estimated by the activity of Renilla luciferase in each sample, obtaining Relative Luciferase Units (RLU). The luciferase activity measured in cells transfected only with reporter vector was used as a reference to calculate fold induction.
For luciferase activity assays with synchronized U2OS cells, the transfections were carried out after washing cells following incubation with thymidine (2 nM) for 20 h. Subsequently, cells were cultured for an additional 15 h in fresh medium. Nocodazole (50 ng/mL) was added to the cultures for the last 10 h. Mitotic cells were collected by shaking off the plates and cultured in complete medium for subsequent luciferase assays.
2.5. RNA and Protein Expression Analyses
Total RNA extraction was performed with TRIzol Reagent (Life Technologies) and purified using the RNeasy Mini kit (Qiagen, Hilden, Germany) following the manufacturer’s recommendations. RNA was reverse-transcribed into cDNA with the High-Capacity cDNA RT Kit (Life Technologies) and qPCR was performed as described previously [
13], following Minimal Information for Publication of Quantitative Real-Time PCR Experiments (MIQE) guidelines. Briefly, qPCR was performed on several cDNA dilutions plus 1 × SYBR green PCR Master Mix (Applied Biosystems, Foster City, CA, USA) and 300–900 nM of primers for the analyzed genes (sequences are listed in
Supplementary Table S3). Reactions were carried out in triplicate using QuantStudio 3 (Applied Biosystems) thermocycler for 40 cycles (95 °C for 15 s and 60 °C for 1 min) after an initial 10-min incubation at 95 °C. Relative amounts of cDNA were normalized to the internal control
EIF2C2, whose levels were invariant in all the analyzed conditions.
For western blot analyses, cells were lysed in buffer containing 10 mM NaPO4 H, pH 7.2; 1 mM EDTA; 1 mM EGTA; 150 mM NaCl; 1% NP-40 and a cocktail of protease and phosphatase inhibitors (Roche). Protein concentrations in supernatants were determined using a commercially available kit (DC Protein Assay from Bio-Rad, Hercules, CA, USA). Twenty to thirty micrograms of protein were loaded per lane, fractionated in 10–12% SDS-PAGE gels and transferred onto nitrocellulose membranes (Bio-Rad), as described previously [
13]. Antibodies against the following proteins were used: E2F1 (sc-193, Santa Cruz), E2F2 (sc-633, Santa Cruz, Dallas, TX, USA), E2F3 (sc-878, Santa Cruz),
GOLPH3 (ab91492, Abcam, Cambridge, UK), α-Tubulin TUBA4A (T-9026, Sigma, Saint Louis, MO, USA). Immunocomplexes were visualized with horseradish peroxidase-conjugated anti-rabbit IgG antibodies (Santa Cruz), followed by chemiluminiscence detection (ECL, Amersham) with a ChemiDoc camera (Bio-Rad).
2.6. Bioinformatic Tools
Search for transcription factors motifs in
GOLPH3 gene promoter was carried out with the
ConSite web-based tool for finding
cis-regulatory elements in genomic sequences (
http://consite.genereg.net/). The search was restricted to the proximal promoter region (−500 and +250 relative to the transcriptional star site). A cutoff of 0.80 was applied.
2.7. Statistical Analysis
Data are presented as mean ± standard deviation (SD). The significance of the difference between two groups was assessed using the Student two-tailed t-test. p < 0.05 was considered statistically significant.
4. Discussion
During cell division, the Golgi organelle must be accurately segregated into the two daughter cells. This segregation is achieved through disassembly of the Golgi cisternae when cells enter mitosis followed by a reassembly of the fragments within each daughter cell after the end of mitosis, through a process involving a wide array of mediators, including Golgi and cytoskeletal proteins, membrane tethers, as well as kinases and phosphatases to transmit signals into the Golgi membranes [
21]. Biogenesis of the Golgi apparatus during interphase is less well-studied. There is evidence that the mammalian Golgi apparatus grows in its protein content and volume throughout the G1 phase in a manner that correlates well with cell size growth [
4]. However, it is unknown whether signals emanating from the cell cycle regulatory network are conveyed to the Golgi organelle for its regulated growth during G1. Here we show that the expression of
GOLPH3 and
GOLGA2, two genes encoding Golgi proteins, is induced specifically in the G1 phase, suggesting a link between cell cycle regulation and Golgi growth. Furthermore, we present evidence that E2F transcription factors, critical regulators of the G1 to S transition of the cell cycle regulate expression of
GOLPH3. Thus, E2F factors may coordinate not only DNA replication, but also Golgi-specific gene expression to contribute to the timely cell cycle progression.
The genes selected for our initial gene expression analysis (
GOLPH3,
GOLGA2,
GOLGA5 and
MAN2A1) are well-known for their Golgi-specific functions [
22]. These genes bear putative E2F sites in their promoter regions and show detectable E2F binding activity on their promoters. The presence of E2F sites raised the possibility that these genes that encode Golgi proteins may be regulated in the cell cycle. However, we found differences in their expression pattern during the G1 to S phase.
GOLPH3 and
GOLGA2 clearly exhibit cell cycle regulated expression at the mRNA level. By contrast,
GOLGA5 and
MAN2A1 did not show such regulation, suggesting that the E2F elements present in their promoters are not functional in our experimental system. A more systematic analysis involving several cell lines and various cell cycle synchronization conditions is needed to determine to what extent Golgi-specific genes are transcriptionally regulated in the cell cycle. Alternatively, Golgi components may be regulated at the protein level. There is evidence of posttranscriptional mechanisms regulating the expression of some Golgi proteins. For example,
GOLGA2 and
MAN2A1 levels have been shown to be induced at the translational level during interphase in an S6K1-dependent manner [
4]. Thus, Golgi protein levels appear to be regulated by a combination of cell cycle-regulated transcriptional and posttranscriptional mechanisms that would ensure the necessary increase of Golgi size before cell division.
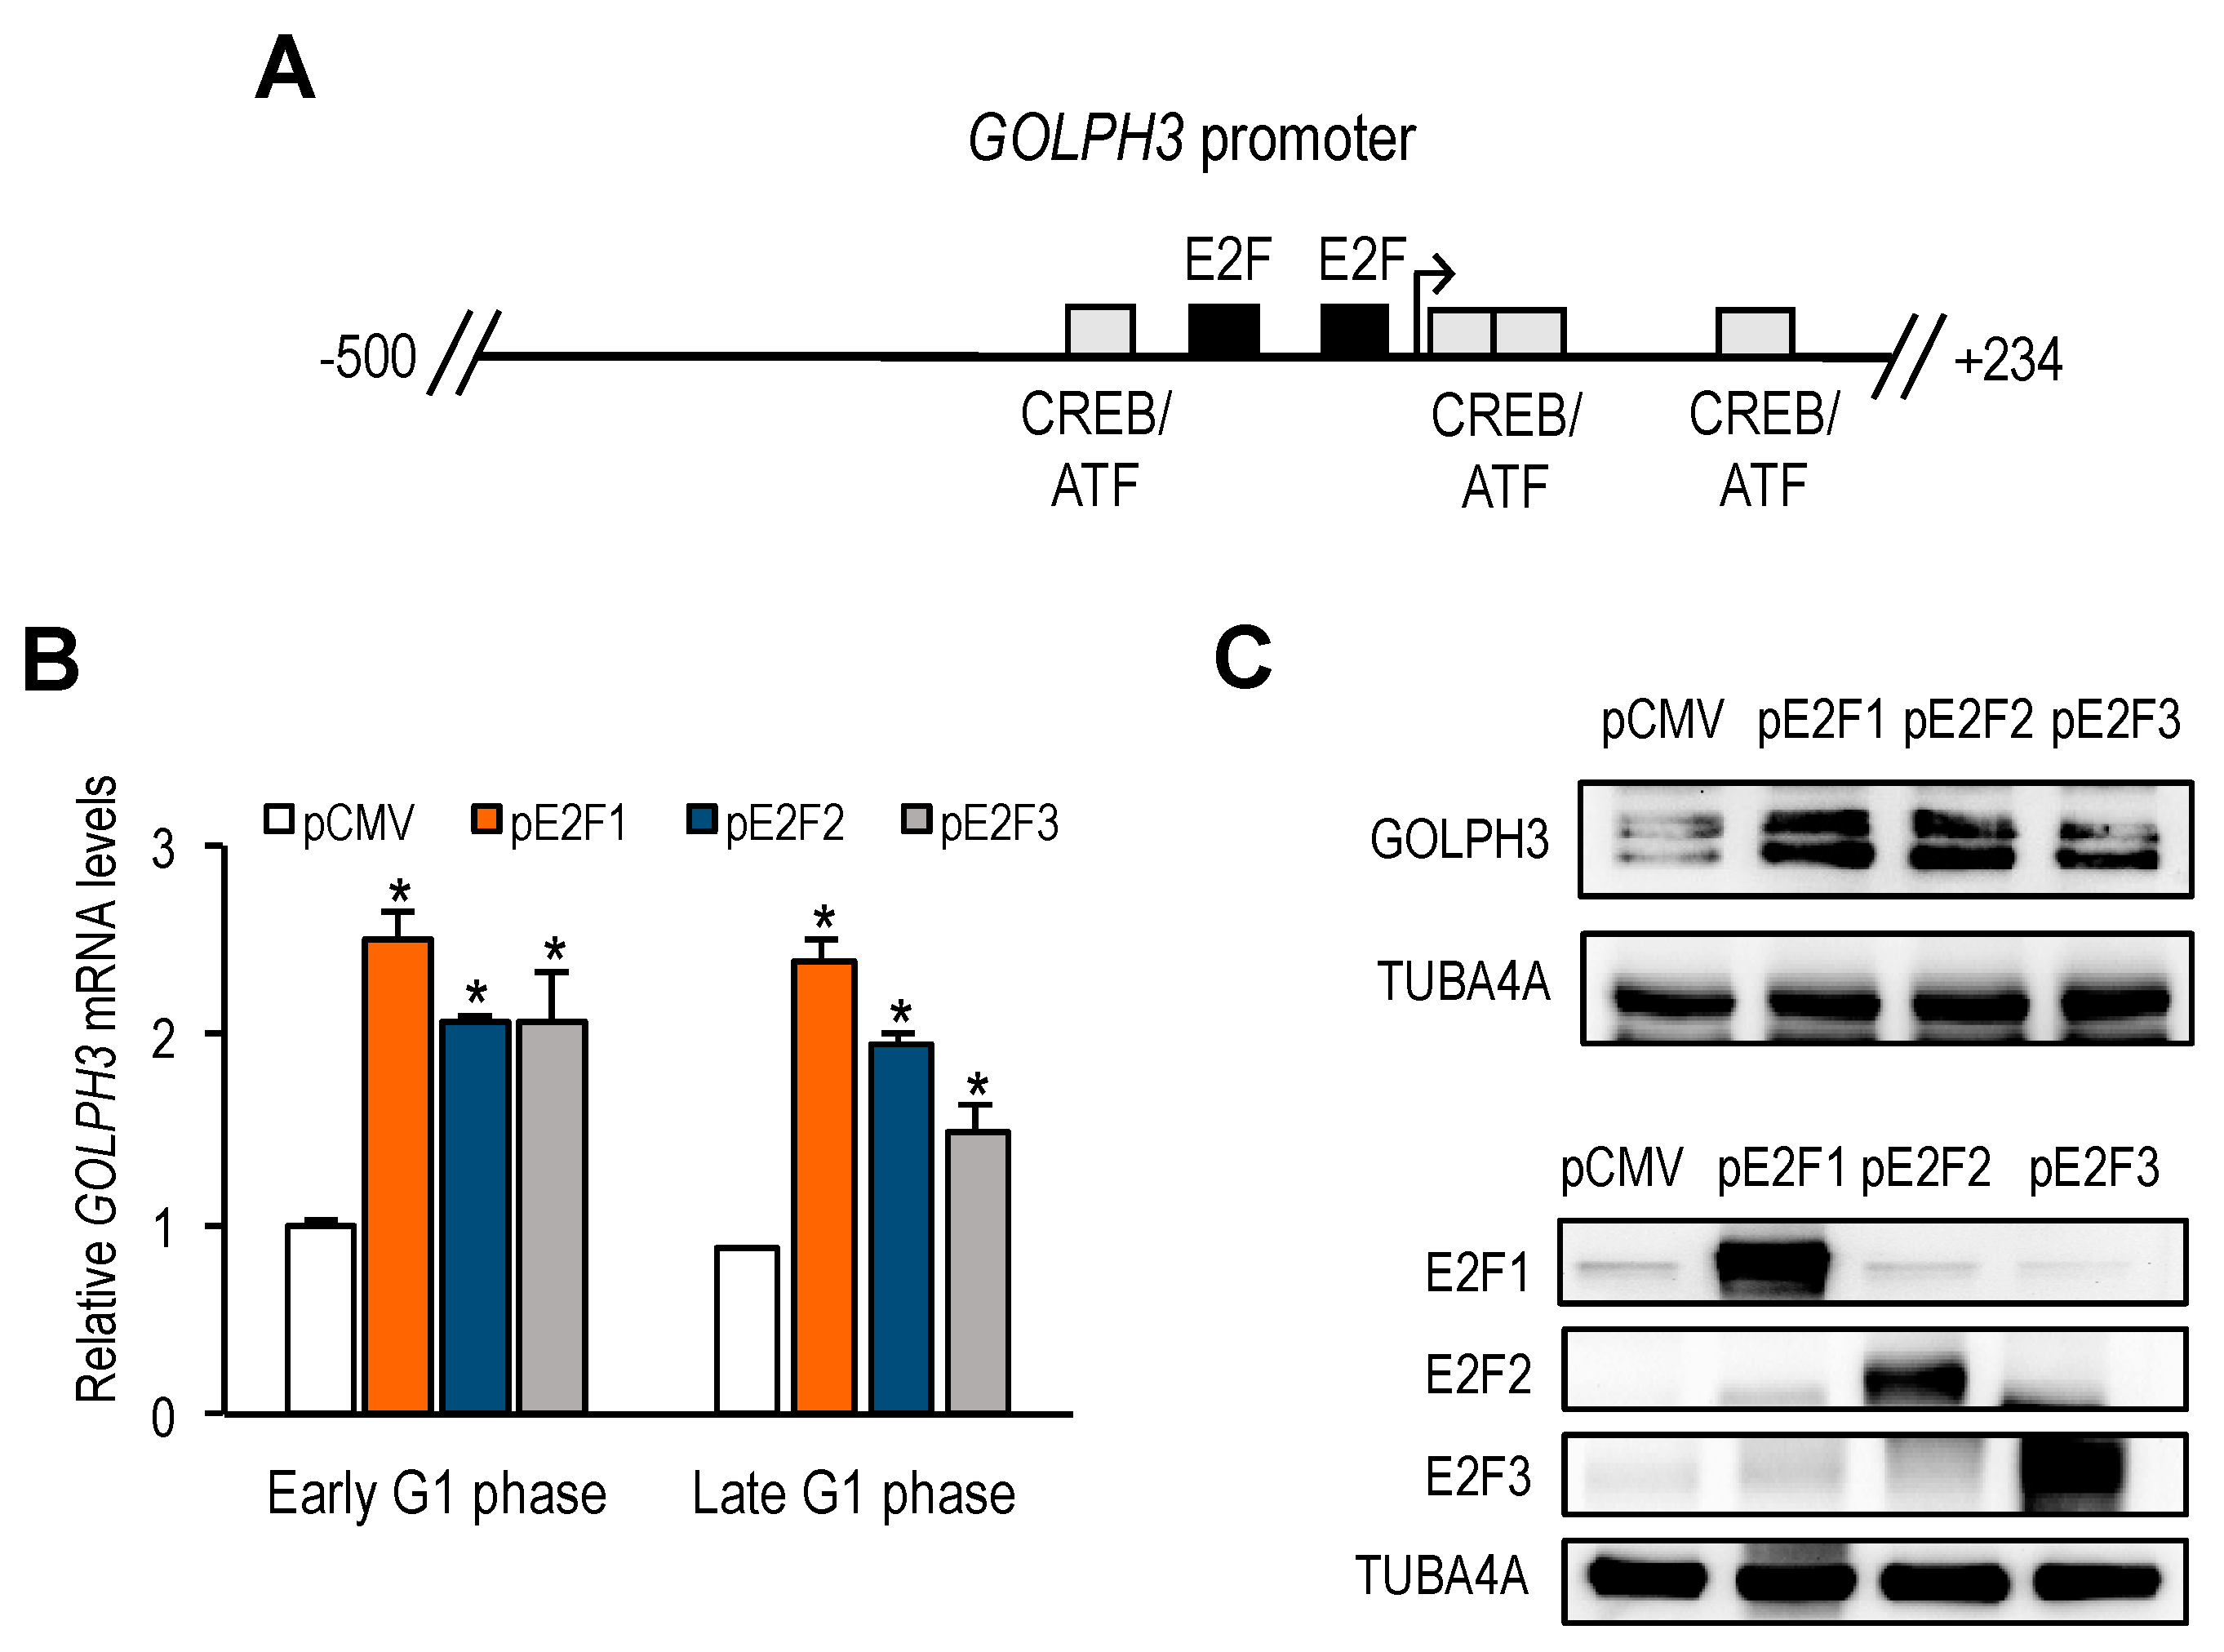
GOLPH3 promoter harbors two putative E2F motifs, and our promoter deletion and mutation analyses indicate that regulation of
GOLPH3 expression by E2Fs is mediated through these E2F sites. A comparison of
GOLPH3 E2F motifs between several mammalian species shows that the proximal E2F site is more conserved than the distal E2F site (
Supplementary Figure S2), suggesting that both E2F sites may not be functionally equivalent. Mouse and rat
GOLPH3 genes only harbor the E2F site that corresponds to the proximal site in humans, and our data show that mouse
GOLPH3 expression is induced well in G1 phase, similarly to human
GOLPH3 gene, which suggests that the proximal E2F motif may be more functionally active than the distal E2F motif in the human promoter. A mutational analysis of individual E2F sites may help define more precisely the contribution of each motif to the regulation of
GOLPH3 gene expression.
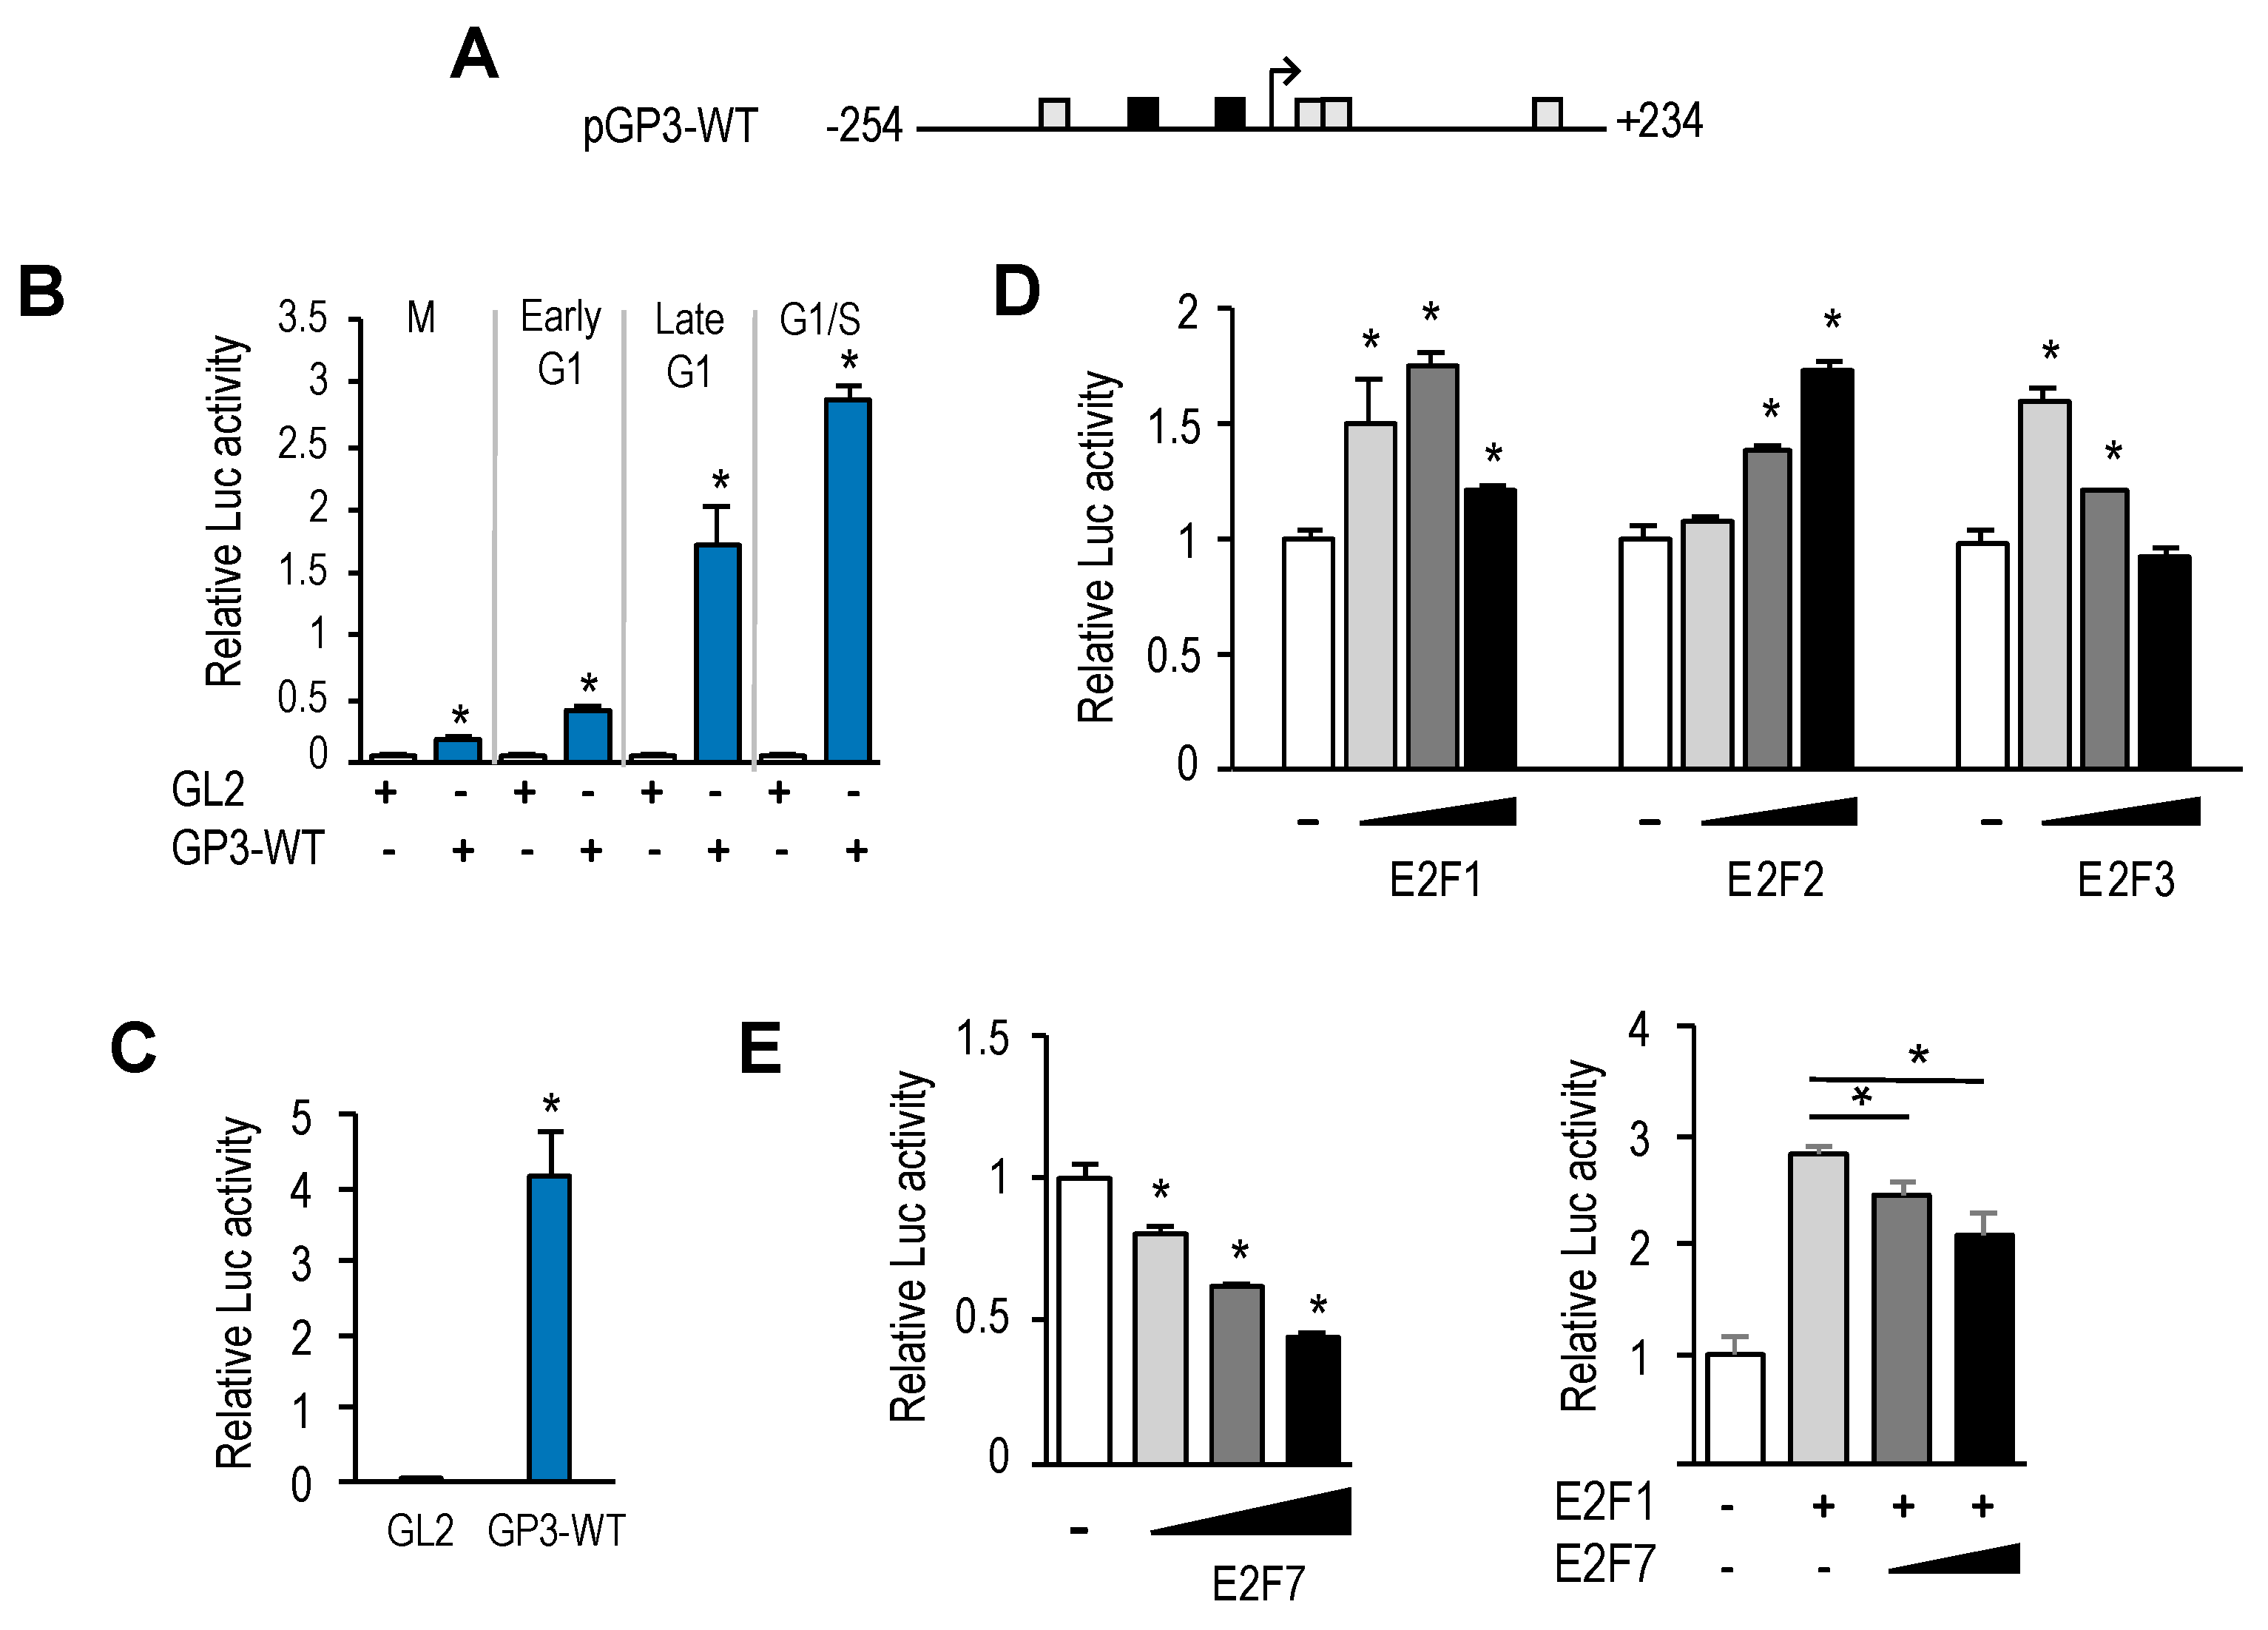
Similarly to many other E2F-regulated genes,
GOLPH3 expression is induced by E2F1-3 and repressed by E2F7. Gene expression during G1 to S progression is thought to be mediated by a complex set of regulatory feedback loops established among members of the E2F family [
23]. According to this model, induction of G1 genes by E2F1-3 would subsequently be repressed by the activity of the repressor arm of the E2F family (E2F6-8), whose own expression follows temporally that of E2F1-3. Our results suggest that the coordinated action of E2F activators and E2F repressors would ensure a tightly regulated expression of
GOLPH3, and perhaps other genes encoding Golgi proteins, within the G1 to S window, prior to Golgi dispersal during mitosis. Thus, E2F factors may be major determinants of Golgi-specific
GOLPH3 gene regulation.
Interestingly, the E2F sites themselves function as negative regulatory elements, as shown by the fact that mutation of E2F motifs leads to an increased basal promoter activity (
Figure 4B,C). A similar type of regulation has been reported for several other E2F target genes, including
MYB,
E2F1,
BRCA1, and it is thought to result from recruitment of E2F repressor complexes containing Retinoblastoma family members [
24,
25,
26]. In this context,
GOLPH3 expression would be regulated negatively in G0 or early G1 by RB-dependent repression and in S-phase by E2F7-dependent expression, with a window in G1 that would allow its induction by E2F1-3.
In addition to E2F motifs, our luciferase reporter data indicate that other regulatory elements in
GOLPH3 promoter have a critical role in
GOLPH3 expression. Most notably, we have identified four CREB/ATF binding motifs that are located in its regulatory region. Two overlapping motifs located adjacent to the transcriptional start site are well conserved in other mammalian genomes, whereas the other two show greater divergence (
Supplementary Figure S3). Mutation of both CREB/ATF overlapping motifs reduces dramatically steady-state activity of
GOLPH3 promoter, suggesting that these elements are essential for
GOLPH3 expression.
The CREB/ATF motif is recognized by proteins of the CREB and ATF families [
18]. Members of these families are structurally similar, but have discrete transcriptional properties that contribute to their distinct regulatory functions [
27]. We presently do not know which individual members are recruited to CREB/ATF motifs in
GOLPH3 promoter to regulate its expression. We find that ectopic expression of ATF2, a transcription factor that can be activated by growth promoting signals, is able to induce
GOLPH3 promoter activity, suggesting that activation of ATF2 early in G1 could contribute to the induction of
GOLPH3 transcription through its CREB/ATF elements. Nevertheless, individual silencing of CREB and ATF family members may give a more comprehensive picture of
GOLPH3 regulation by these transcription factors, known to be activators or repressors depending on the cellular context. Of note, some CREB/ATF family members partially localize to the Golgi [
28]. It will be interesting to analyze their role in the regulation of
GOLPH3 transcription.
It has been suggested that Golgi growth is modulated by a “cell growth checkpoint” at late G1 phase, whereby cell growth signals delivered by S6K1 would control the accumulation of some Golgi proteins and therefore Golgi size [
4]. Our data suggests an additional layer of regulatory mechanism for Golgi growth by identifying a transcriptional mechanism regulating
GOLPH3 expression in G1. Importantly, the delay in G1 to S progression after
GOLPH3 depletion that we have observed suggests the existence of a “Golgi growth checkpoint”, which may impair cell cycle progression if cells are expressing suboptimal amounts of Golgi proteins. Further research is needed to define the mechanism for this regulation.


 ,
, 