Article

RNA Sequencing Reveals Specific Transcriptomic Signatures Distinguishing Effects of the [SWI+] Prion and SWI1 Deletion in Yeast Saccharomyces cerevisiae

by
Yury V. Malovichko
1,2,
Kirill S. Antonets
1,2,
Anna R. Maslova
2,
Elena A. Andreeva
2,3,
Sergey G. Inge-Vechtomov
2,3 and
Anton A. Nizhnikov
1,2,*
1
Laboratory for Proteomics of Supra-Organismal Systems, All-Russia Research Institute for Agricultural Microbiology (ARRIAM), Podbelskogo sh., 3, Pushkin, 196608 St. Petersburg, Russia
2
Department of Genetics and Biotechnology, St. Petersburg State University, Universitetskaya nab., 7/9, 199034 St. Petersburg, Russia
3
Vavilov Institute of General Genetics, St. Petersburg Branch, Universitetskaya nab., 7/9, 199034 St. Petersburg, Russia
*
Author to whom correspondence should be addressed.
Genes 2019, 10(3), 212; https://doi.org/10.3390/genes10030212
Submission received: 10 February 2019 / Revised: 1 March 2019 / Accepted: 8 March 2019 / Published: 12 March 2019
(This article belongs to the Section Microbial Genetics and Genomics)

Abstract

:
Prions are infectious, self-perpetuating protein conformers. In mammals, pathological aggregation of the prion protein causes incurable neurodegenerative disorders, while in yeast Saccharomyces cerevisiae, prion formation may be neutral or even beneficial. According to the prevailing contemporary point of view, prion formation is considered to be a functional inactivation of the corresponding protein whose conformational state shifts from the functional monomeric one to the infectious aggregated one. The Swi1 protein forms the [SWI+] prion and belongs to the nucleosome remodeler complex SWI/SNF controlling the expression of a significant part of the yeast genome. In this work, we performed RNA sequencing of isogenic S. cerevisiae strains grown on the media containing galactose as the sole carbon source. These strains bore the [SWI+] prion or had its structural gene SWI1 deleted. The comparative analysis showed that [SWI+] affects genome expression significantly weaker as compared to the SWI1 deletion. Moreover, in contrast to [SWI+], the SWI1 deletion causes the general inhibition of translation-related genes expression and chromosome I disomy. At the same time, the [SWI+] prion exhibits a specific pattern of modulation of the metabolic pathways and some biological processes and functions, as well as the expression of several genes. Thus, the [SWI+] prion only partially corresponds to the loss-of-function of SWI1 and demonstrates several gain-of-function traits.

1. Introduction

In contrast to the prions of mammals [1], yeast prions determine various phenotypes stably inherited during mitosis and meiosis [2,3]. To date, about ten prions have been identified in yeast Saccharomyces cerevisiae [4,5]. Most of them belong to the transcriptional or translational factors or regulators [6,7,8,9,10,11], and bear glutamine and/or asparagine-rich regions participating in prion formation and propagation [3,12]. The formation of yeast prions may have harmful, neutral, or beneficial consequences for yeast cells [13,14,15]. A growing number of evidence suggests that several yeast prions may determine some adaptive traits under specific environmental conditions [10,14,15]. Nevertheless, most prions exhibit phenotypes similar to the loss-of-function mutations in the corresponding structural genes [3,16]. The molecular explanation of this phenomenon is that the prion state is typically presented by amyloid aggregates, in which the structural protein of a prion may be inactivated as opposed to its functionally active monomeric state [17]. Overall, the prions’ roles, either as regulators of adaptive traits or harmful epigenetic elements, remain ambiguous and require additional clarification.
The ATP-dependent chromatin remodeler complex SWI/SNF [18] is evolutionary conserved and found in all three domains of life [19]. In yeast, it consists of 12 subunits [20,21], most of which were initially identified in yeast screens as involved in mating type switching (SWI, Switching deficient) and governing carbon utilization (SNF, Sucrose/Non-Fermentable) [22,23]. SWI/SNF is a global regulator of expression of the yeast genome [24] and it is required for the stress-specific transcription of numerous genes [25,26]. The genes encoding SWI/SNF complex subunits are the most frequently mutated chromatin modulators in primary human tumors and act as tumor suppressors [27].
The Swi1 protein is a component of SWI/SNF that binds activator regions in promoters, thus it is essential for the transcription of numerous genes controlling sporulation, carbon metabolism, mating type switching, DNA replication, and repair [28,29]. Recent data have suggested that yeast SWI/SNF has a modular architecture consisting of four functional modules: (i) Arp (actin-related proteins) module, (ii) Snf2/Snf11 ATPase module, (iii) Snf5/Swi3 regulatory module, and (iv) Swi1 module [30]. Deletions of several SWI/SNF subunits incompletely disrupted SWI/SNF integrity, resulting in different genome expression patterns in the same conditions [30]. Notably, several subunits of SWI/SNF, including Swi1, may interact with transcriptional regulators individually, at least in vitro [31].
The SWI1 deletion may be as lethal as it is viable in various yeast strains and causes some pleiotropic phenotypic manifestations, including vegetative growth defects, sporulation, and mating type switching deficiencies [32,33]. A unique feature of the S. cerevisiae Swi1 protein is its ability to adopt the prion state called [SWI+] [7]. The [SWI+] forms amyloid-like aggregates, and its N-terminal region rich in asparagine is essential for the maintenance and propagation of the prion [34]. Phenotypically, [SWI+] exhibits a partial loss-of-function phenotype, including sporulation and vegetative growth inhibition [7], which manifests most notably in the media containing galactose or glycerol as the sole carbon source [35]. The [SWI+] formation, similar to the SWI1 deletion, abolishes multicellularity in several yeast strains, and this effect is related to the transcriptional repression of the FLO genes and may also be associated with the sequestration of several Q/N-rich transcriptional factors by the Swi1 aggregates [36]. Recently, [SWI+] has been found to modulate the translation termination efficiency, causing weak translational read-through and omnipotent suppression of the ade1-14UGA and trp1-289UAG nonsense alleles [35,37]. This effect only manifests in yeast strains bearing variants of the SUP35 gene encoding the eRF3 release factor [38,39] with decreased functional activity [35,40] and was found to be associated with a decrease of the level of the SUP45 mRNA [41,42] encoding the eRF1 release factor [38,39]. SWI1 deletion also suppresses the phenotype of the ade1-14UGA mutation [42], but in contrast to [SWI+] [41,42], this effect is caused by the increase of the level of the ade1-14UGA mRNA [43]. Thus, the data obtained suggest that the effects of the [SWI+] prion and SWI1 deletion only partially coincide and detailed transcriptome-wide analysis could facilitate a general understanding of molecular mechanisms underlying their phenotypic manifestations.
To compare the effects of Swi1 prionization and its deletional inactivation, in this work, we performed sequencing of the mRNA isolated from [SWI+], [swi], and swi1Δ cells grown on medium containing galactose as the sole carbon source, where both prion and deletion cause strong growth inhibition.

2. Materials and Methods

2.1. Yeast Strains, Plasmids, and Cultivation Conditions

Three haploid yeast strains, 1-4-1-1-D931 [swi], 12-1-4-1-1-D931 [SWI+], and 11-1-1-D931 swi1Δ [42], were used in this study. These strains are isogenic (MATa sup35Δ:HIS3 ade1-14 his3 leu2 lys2 ura3 trp1-289 [pL-Aβ-Sup35MC]) and differ only in the status of the Swi1 protein, which is soluble in the 1-4-1-1-D931 [SWI], aggregated in the 12-1-4-1-1-D931 [SWI+], and absent in the 11-1-1-D931 swi1Δ strain. The strains contain the deletion of the SUP35 gene encoding the eRF3 release factor [38,39] compensated for by the pL-Aβ-Sup35MC plasmid, which is also necessary to phenotypically check [SWI+] strains by the growth on the media without adenine with 100 µM CuSO4 (the [SWI+] yeast grow while [swi] do not grow on such media) [35,37]. The 11-1-1-D931 swi1Δ strain additionally bears the deletion of the SWI1 chromosomal copy (the region encoding the N-terminal part of the Swi1 protein, including the translation initiation codon, is deleted) [42], substituted with the KanMX4 cassette, providing resistance of the yeast cells to geneticin (G418) aminoglycoside [44].
The pL-Aβ-Sup35MC and pU-Aβ-Sup35MC plasmids bearing LEU2 and URA3 selection markers, respectively, were constructed previously [37]. These plasmids carry the chimeric Aβ-SUP35MC gene under the control of the Copper-inducible CUP1 promoter that is used to compensate for the deletion of the SUP35 chromosomal copy [37]. The YGPM19p21 plasmid from the YSC4613 genomic library (Open Biosystems) bears the fragment of the yeast XVI chromosome containing the intact SWI1 gene and has the LEU2 selection marker. The pYCH-U2 centromeric plasmid contains full-length SUP35 under the control of its endogenous promoter and URA3 selection marker.
The standard liquid and solid yeast cultural media (complete YEPD, or minimal MD) were used [45,46]. The cells were grown at 30 °C. For the transcriptome analysis, the cells were pre-grown in 5 mL of liquid MD medium supplemented with necessary amino acids, nitrogen bases, vitamins, and microelements containing 2% glucose as the carbon source until reaching OD600nm = 0.5. Then, the cells were centrifuged (3000× g, 5 min) and inoculated into the 25 mL of pre-induction MD medium containing 2% raffinose instead of glucose. When the OD600nm reached 0.5, the cells were centrifuged (3000× g, 5 min), inoculated into the 50 mL of MD containing 2% galactose as the sole carbon source, and were grown for 4 h. For the qPCR experiments, the cells were grown on the solid MD plates containing glucose or galactose as the sole carbon source in the indicated number of 24 h passages.
For the nonsense suppression assay, yeast colonies were grown on the MD plates for 48 h, replica-plated on the MD plates without adenine or tryptophan, and grown for five days at 30 °C. To decrease the translation efficiency, aminoglycoside antibiotic paromomycin was added to the cultural media at the indicated concentrations. The growth of the strains on the plates containing galactose as the carbon source was analyzed after three replica-plating of the colonies with the duration of passage in 24 h [35].

2.2. DNA Preparation and qPCR

Genomic DNA for qPCR was extracted from the yeast cells using the MagJET Genomic DNA Kit (Thermo Fisher Scientific, Waltham, MA, USA). The sequences of primers and TaqMan qPCR probes are listed in Table S1. In each qPCR experiment, five independently obtained samples of DNA were tested. The ANK-32 real-time cycler (Institute of Analytical Instrumentation, Moscow, Russia) and BioRad CFX (BioRad, Hercules, CA, USA) were used. The results were processed using the 2−ΔΔCt method [47]. At the initial step, ΔCt that corresponds to the difference between the signal intensities of experimental and reference (ACT1) genes was calculated. Next, ΔΔCt, indicating the difference between ΔCt-s in the experimental and control samples, was calculated. Finally, the mean of 2−ΔΔCt, demonstrating the difference in the amounts of DNA in the experimental and control samples, was obtained. The significance of the differences observed was analyzed with the nonparametric Kruskal-Wallis test in R software (R Foundation, Vienna, Austria).

2.3. RNA Preparation and Whole Transcriptome RNA Sequencing (RNA-Seq)

Total RNA was extracted from the yeast cells using TRIzol LS Reagent (Invitrogen, Carlsbad, CA, USA), according to the manufacturer’s protocol. The concentration of RNA was calculated using the Quantus fluorimeter and QuantiFluor RNA System kit (Promega, Fitchburg, WI, USA). The quality control was performed with QIAxcel Advanced System (Qiagen, Hilden, Germany) capillary gel electrophoresis. The lower threshold for RIS quality control of the samples was no less than 5. The RNA libraries were prepared with the NEBNext Ultra Directional RNA Library Prep Kit for Illumina (New England BioLabs, Ipswich, MA, USA), NEBNext Poly(A) mRNA Magnetic Isolation Module (New England BioLabs), and oligonucleotide indexing set NEBNext Multiplex Oligos for Illumina, Index Primers Set 1 (New England BioLabs) from 1 µg of the total RNA.
The whole transcriptome RNA sequencing (RNA-Seq) was performed with the HiSeq 2500 sequencing platform (Illumina, San Diego, CA, USA) in the paired-end mode and with a read length of 2 × 100 bp using the TruSeq Rapid PE Cluster Kit—HS (Illumina) and TruSeq Rapid SBS Kit—HS (200 cycles) (Illumina).

2.4. RNA-Seq Read Processing, Pseudoalignment, and Data Analysis

Raw data comprising four biological by two technical replicates for each condition were processed as follows. First, the human contamination-related reads were eliminated with the remove_human script from the BBTools [48] package (version 38.16). The remaining reads underwent adapter trimming and quality filtering via the BBDuk trimming script from BBTools. The quality control of trimming was held with the FastQC software [49] (version 0.11.7). K-trimming was performed at the rightmost side of the reads with the k parameter equal to 27 and the quality trimming was performed at both sides with the minimal average quality per read equal to 30. The reads, having passed both operations, comprised 70% to 75% of the initial data, with the average read length of 200 bases. After that, the technical repeats for each biological sample were merged according to the read orientation. All technical information on library size and trimming is summarized in Table S2.
The resulting data were pseudoaligned to the reference protein-coding cDNA collection of the S. cerevisiae strain S288C via Kallisto [50] (version 0.44.0) in the pair-end mode with the number of bootstrap replicates equal to 100. Abundance tables produced at this stage were included in the analysis performed using the R Sleuth package [51] (version 0.30.0). All three biological conditions in question were compared to each other in a pairwise manner using both the likelihood ratio and the Wald post-hoc tests. The genes demonstrated a q-value (p-value undergone Benjamin-Hochberg multiple comparison adjustment [52]) of less than 0.001 in both tests, which were considered to be significantly regulated and included in a further analysis, with the genes possessing a β value (approximate natural log of fold change) of more than zero being treated as upregulated and those with a β value of less than zero being treated as downregulated. As for the swi1Δ to [SWI+] comparison, all significant results were divided into several specific groups according to their expression rate change in [swi] to [SWI+] and [swi] to swi1Δ tests, respectively.

2.5. GO Term Overrepresentation Test

The subsets of up- and downregulated genes in both [swi] to [SWI+] and [swi] to swi1Δ comparisons were tested for GO overrepresented terms via the topGO [53] R package. The gene-to-term mapping was downloaded from the Saccharomyces Genome Database website [54] and processed manually to fit the package function requirements. The gene names for the respective subsets were tested against a gene universe comprising all S. cerevesiae gene names with the Fisher hypergeometric test and the ‘weight01’ graph reduction algorithm with the p-value cutoff baseline of 0.01. For the genes misregulated in the swi1Δ condition, some additional tests with chromosome I genes excluded both from the gene universe and the query were performed in order to assess whether chromosome duplication affects both differential expression and DEG set functional enrichment.
The resulting list of GO terms was exported as both data frames and topGO graph objects, and the latter were then merged by shared vertices and visualized using KEGGGraph [55] and igraph [56] R packages. In the case of graphs illustrating Biological Process and Molecular Function ontology enrichment, several vertices standing for internal non-significant nodes, as well as several reticular edges, were reduced for the sake of representativeness.

2.6. KEGG Pathway Mapping

The respective sets of DEGs were also used for the KEGG Pathway test using the clusterProfiler [57] R package. Mapping was performed via the overrepresentation test, with p-values adjusted according to the Benjamin-Hochberg multiple test adjustment and q-value cutoff of 0.01. For each pathway in each assay, an enrichment ratio was calculated as the rate of genes mapped onto the respective pathway to all genes from S. cerevisiae related to this pathway. The resulting data were visualized with the ggplot2 [58] R package. Pathways of particular interest were also visualized and exported with the pathview R package [59] with a color scheme similar to that used for GO enrichment visualization.

3. Results

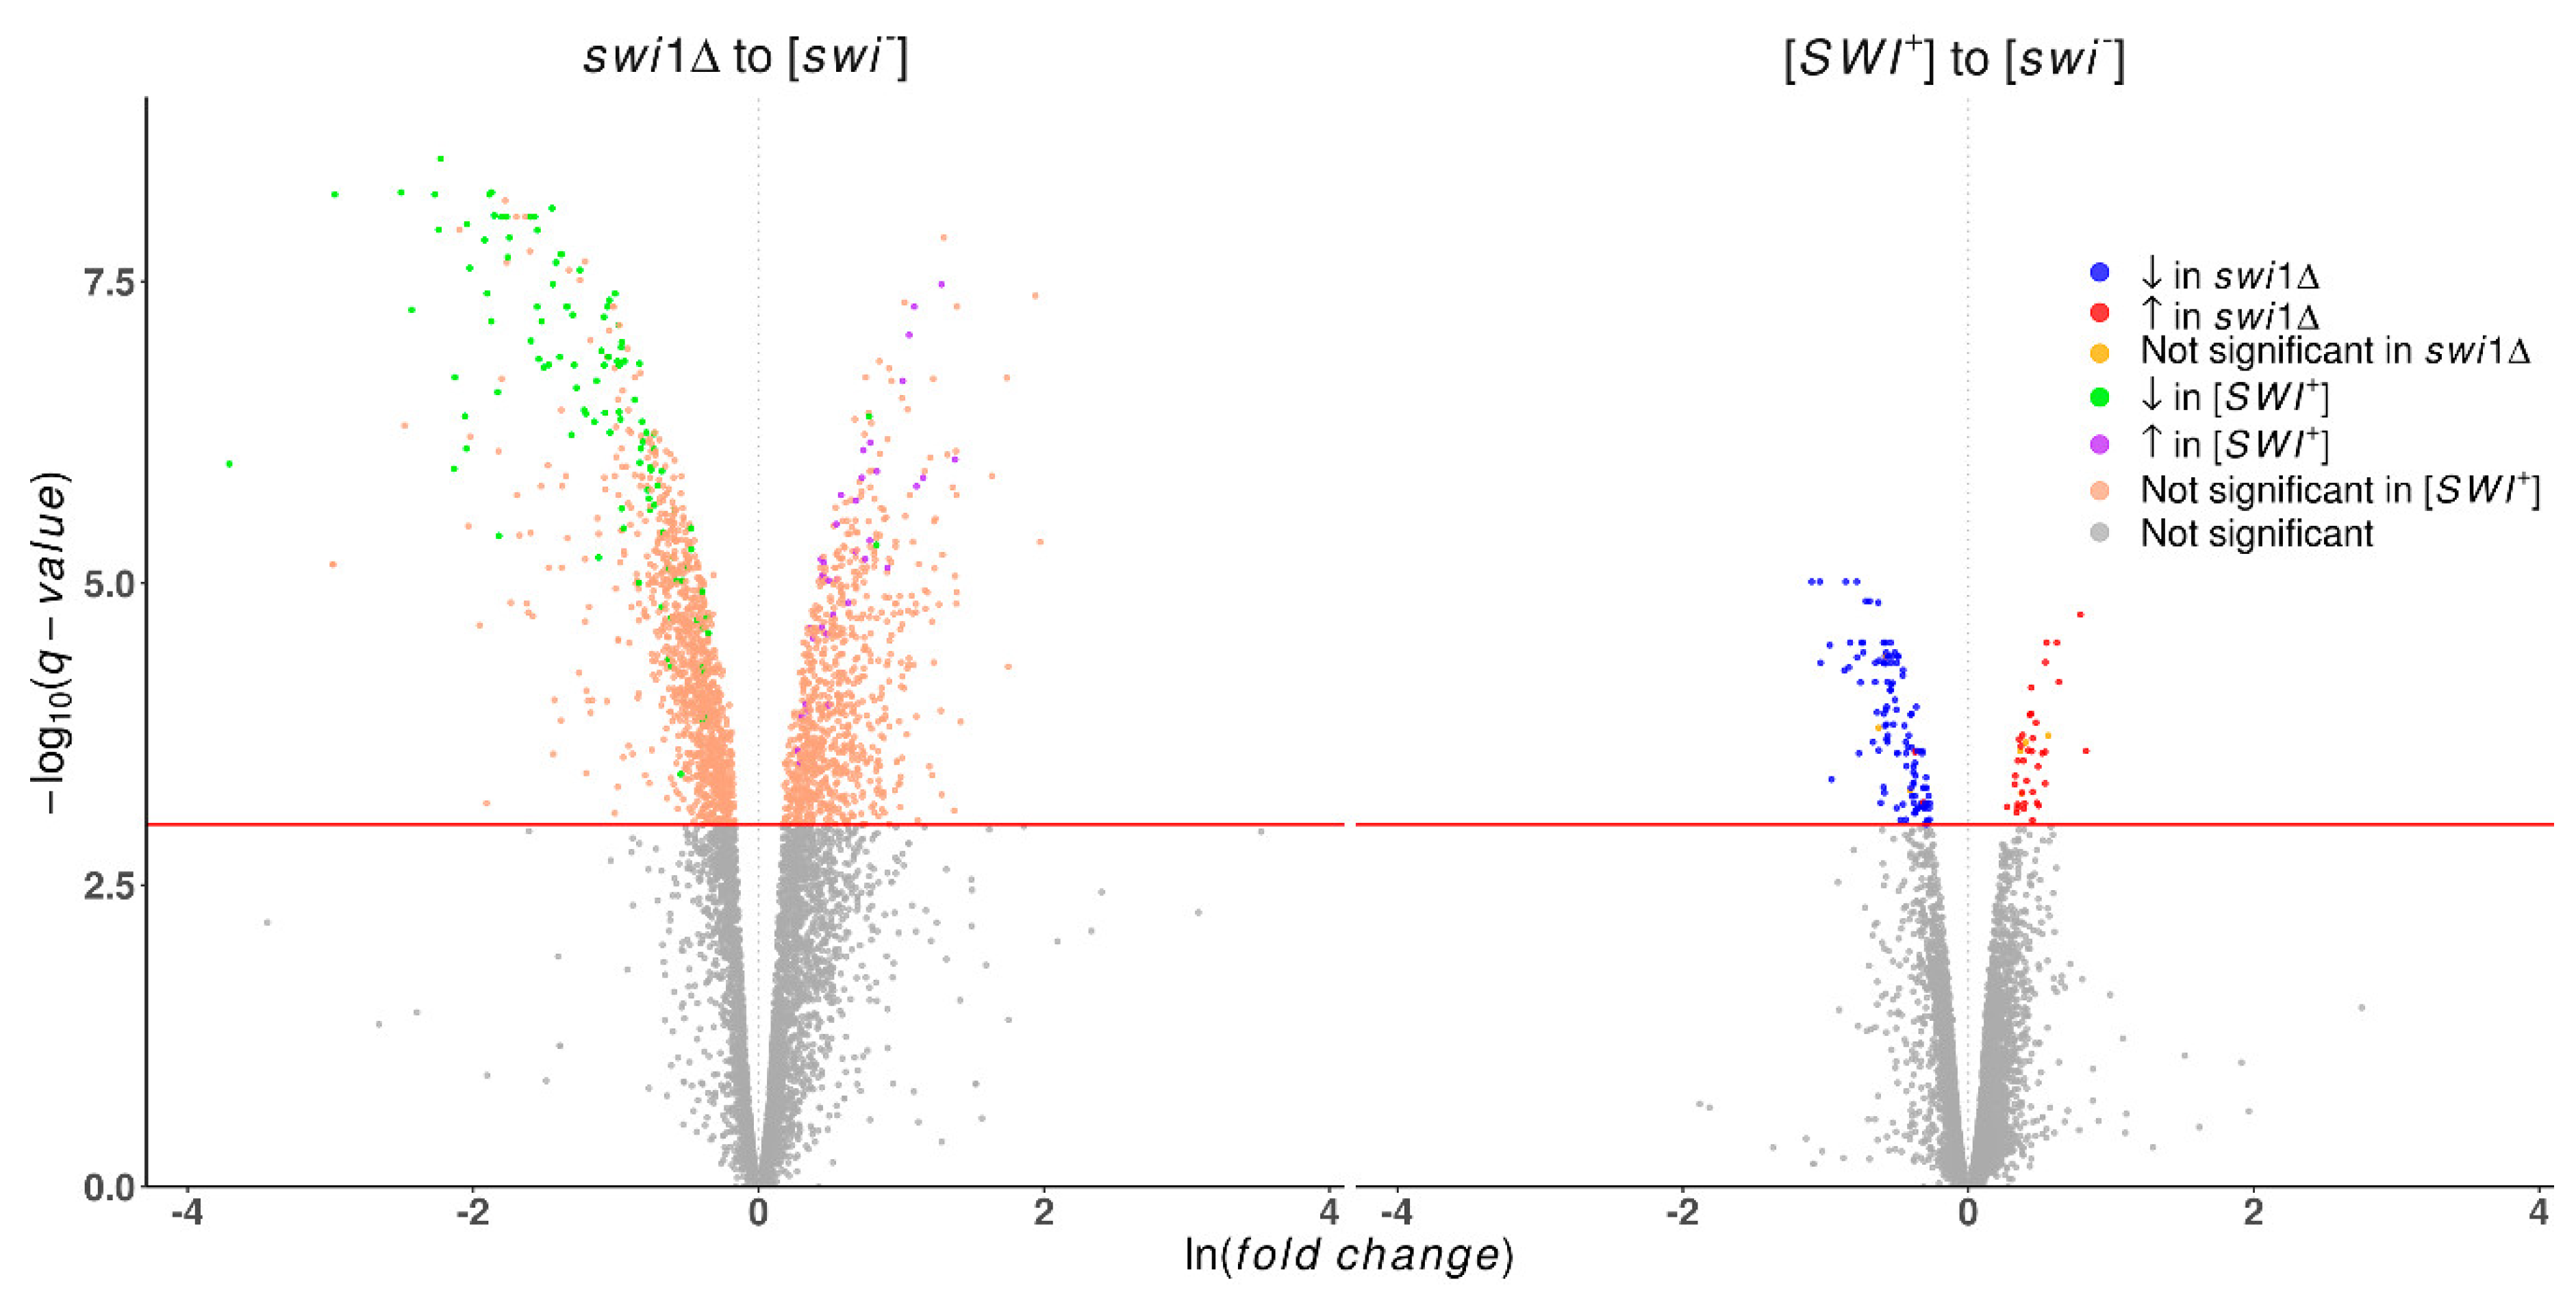
3.1. Transcriptome-Wide Effects of the Swi1 Prion Formation and Deletion of its Structural Gene are Not Equal

A pairwise comparison of the control [swi] and [SWI+] and swi1Δ states revealed a dramatic impact of the SWI gene deletion on the transcriptome, whilst the effect of prion appeared to be far less extensive (Table 1). We also performed a swi1Δ to [SWI+] comparison to elucidate some particular points of difference between these two conditions. As a result, 1139 differentially expressed genes were found, of which 90 genes were assumed to be artifacts of the used approach and excluded from further analysis as they did not appear in any of the experiment-to-control comparisons. The remaining genes from all three tests were processed into 10 groups, depending on the direction and magnitude of expression alteration (Table S3). These data basically imply changes caused by prion appear to simulate those triggered by deletion, but on a smaller scale (Figure 1). However, there were four upregulated genes (ICS2, DLD3, PER33, ENA1) and three downregulated genes (IDP2, FMP16, AGX1) in the prion state whose expression was not affected in the deletion state, as well as two genes (HSP12, HXT5) that were downregulated in the [SWI+] state and upregulated in swi1Δ. These genes encode proteins with different functions, part of which is related to the stress response (Table S4). In cases of concordant alteration expression, the change in deletion-affected strains usually had a notably higher magnitude, as estimated by the β parameter.
To estimate the reach of the observed effect across the yeast genome, we allocated differentially expressed genes to respective chromosomes (Figure 2, Table S5). In both cases, differential expression (both up- and downregulated) is distributed more or less uniformly across the genome, with the [SWI+] prion upregulating less than 1% and downregulating 0.7–3.1% of genes per chromosome and SWI1 deletion affecting 6.9–14.4% and 15.3–18.5% of genes per chromosome, respectively (Table S5). The notable exception of this trend is a massive expression alteration of the genes in chromosome I occurring only on the swi1Δ background and resulting in the upregulation of 64 genes (~50%) and downregulation of only one gene (Table S5). These genes, except for the only repressed candidate, BDH1, are not differentially expressed in a prion-containing strain, leading one to conclude that the activation of genes in chromosome I may serve as a response to SWI/SNF impairment and be caused by the increase in the chromosome I copy number. Another specific feature of the swi1Δ state is the utter repression of several genes located on chromosome XII between bases 469,317 and 489,341 (Figure 2), either within or in close proximity to the RDN1 locus containing multiple tandem copies of the rDNA repeats [60]. These genes comprise the ASP3 paralogue family and five genes encoding putative proteins and share a β value ranging from −2.9 to −7.27, demonstrating the repression of this chromosomal region. However, the equal β value within the paralogous groups indicates that some of these results might be drawbacks of ambiguous alignment. Additionally, both [SWI+] and swi1Δ states do not actually affect expression of the mitochondrial genes, except for the SCEI gene upregulated on the deletion background.

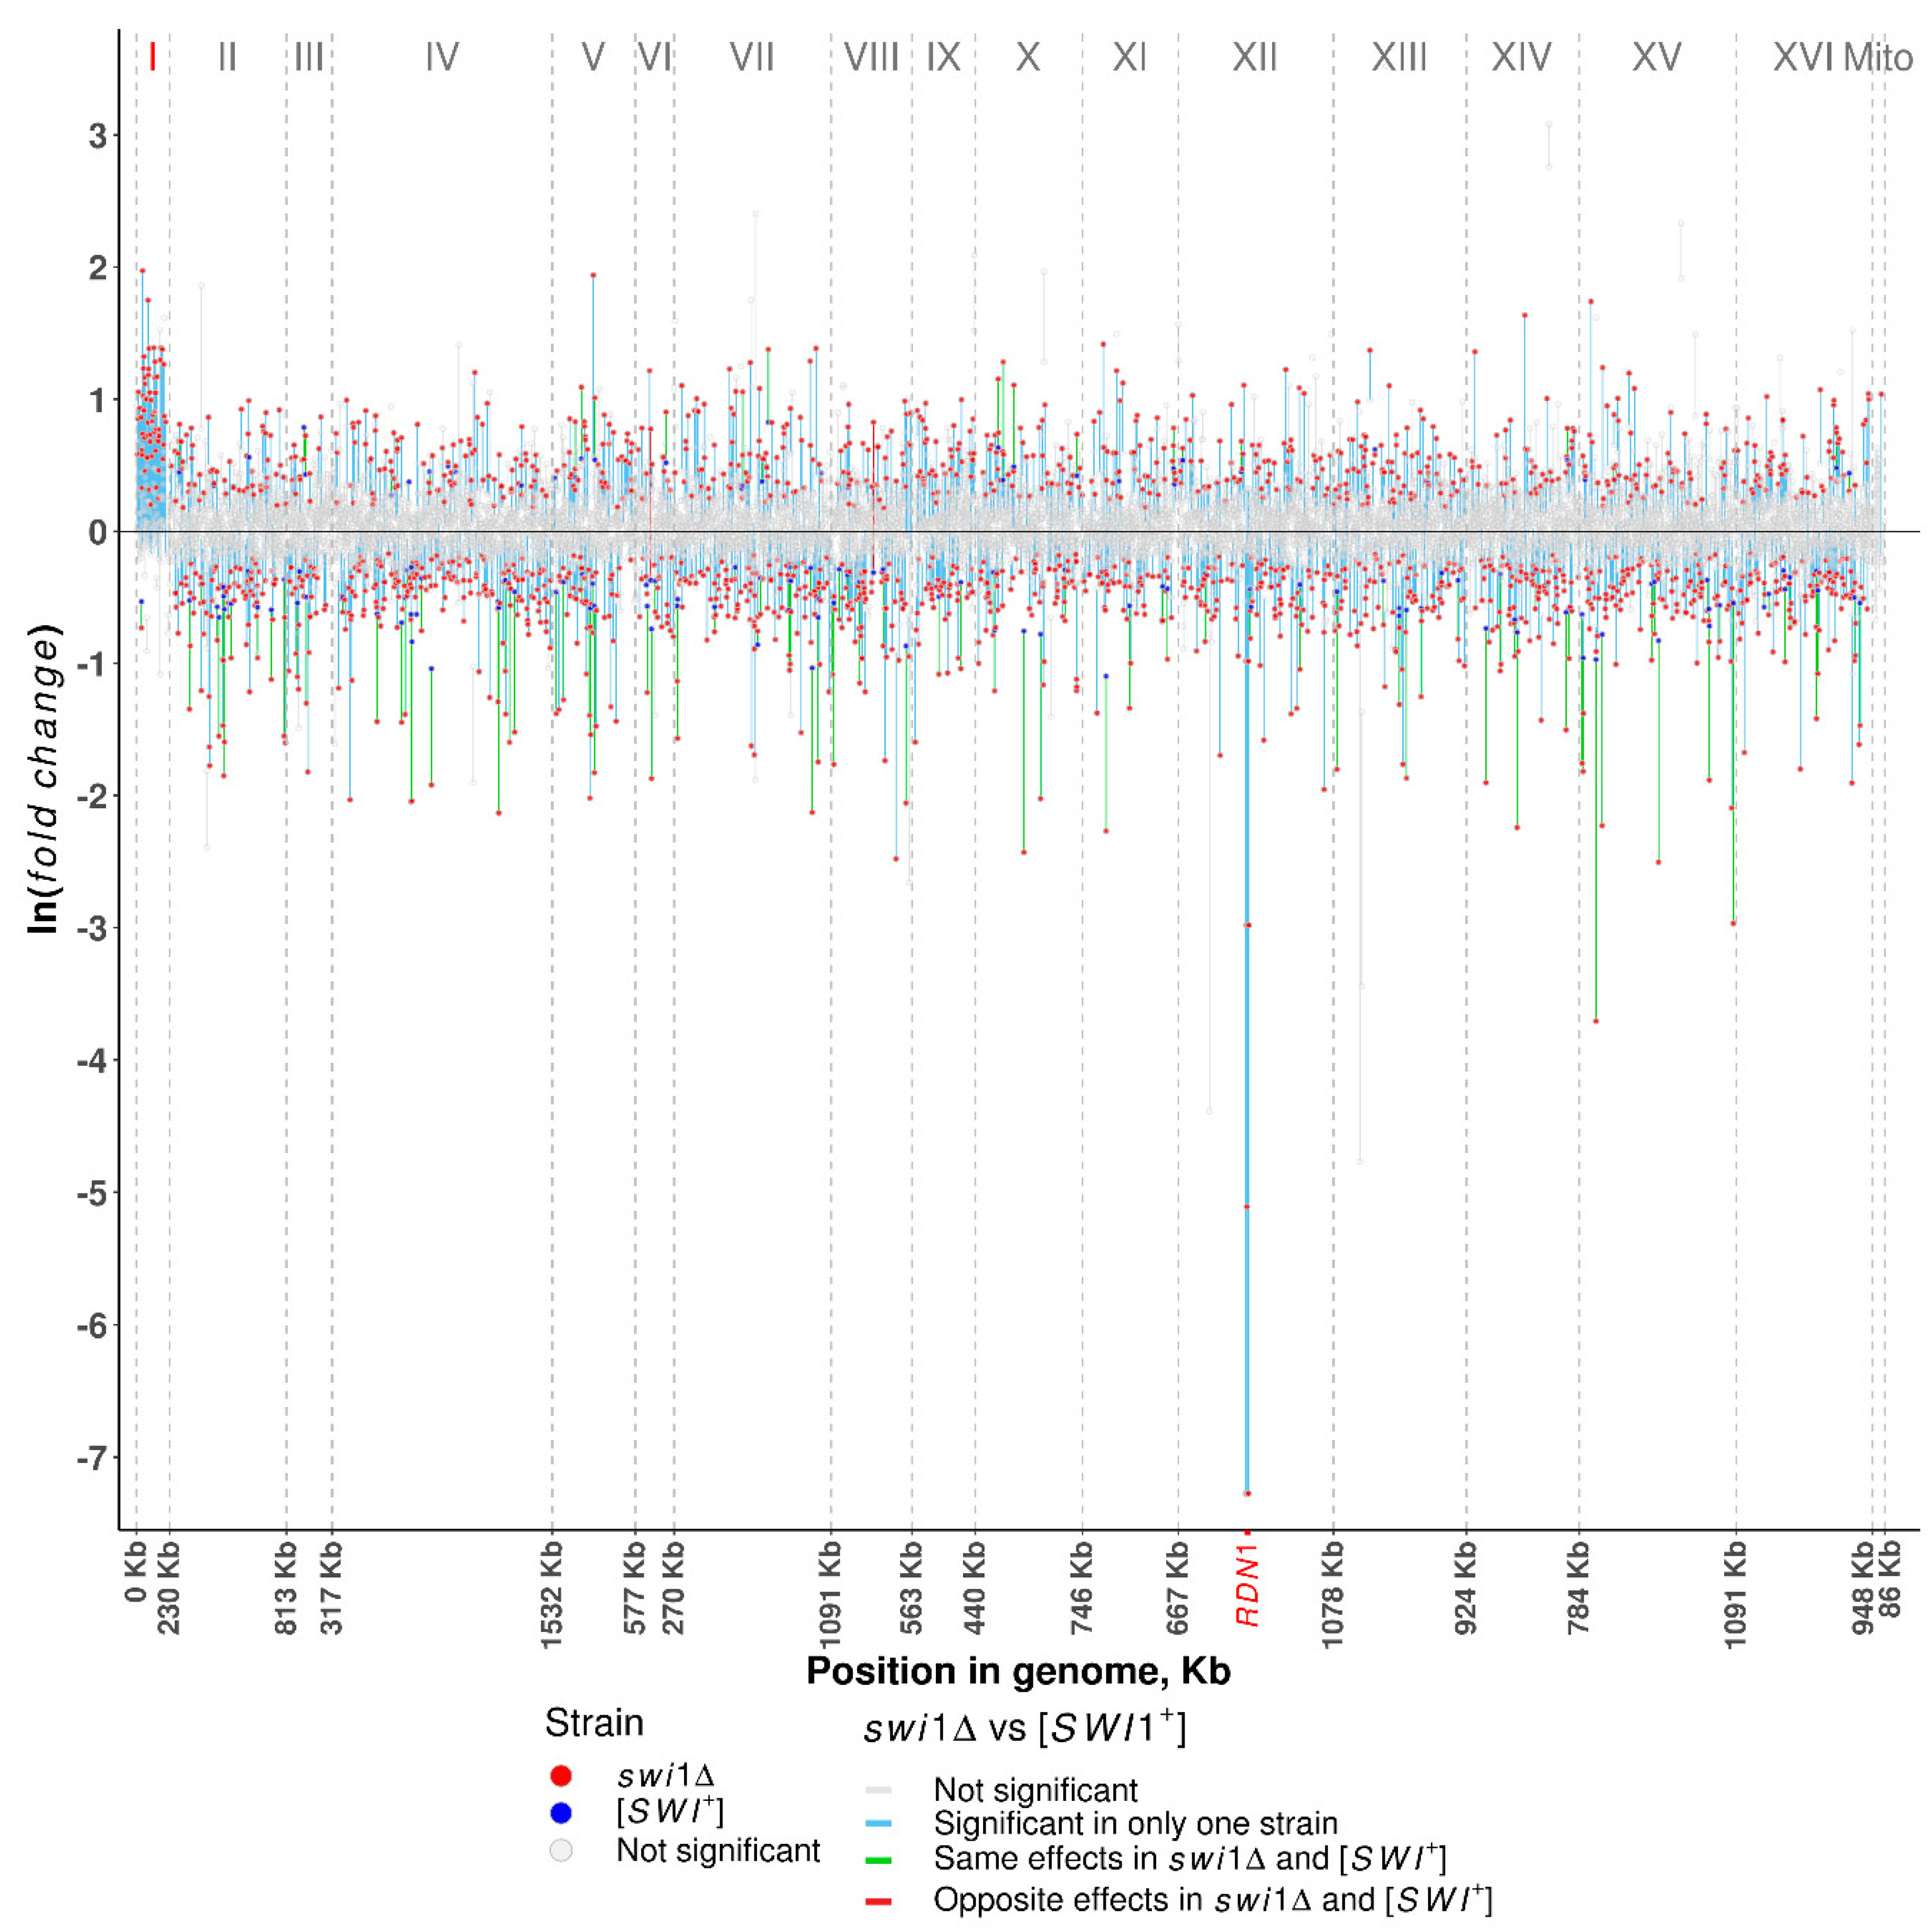
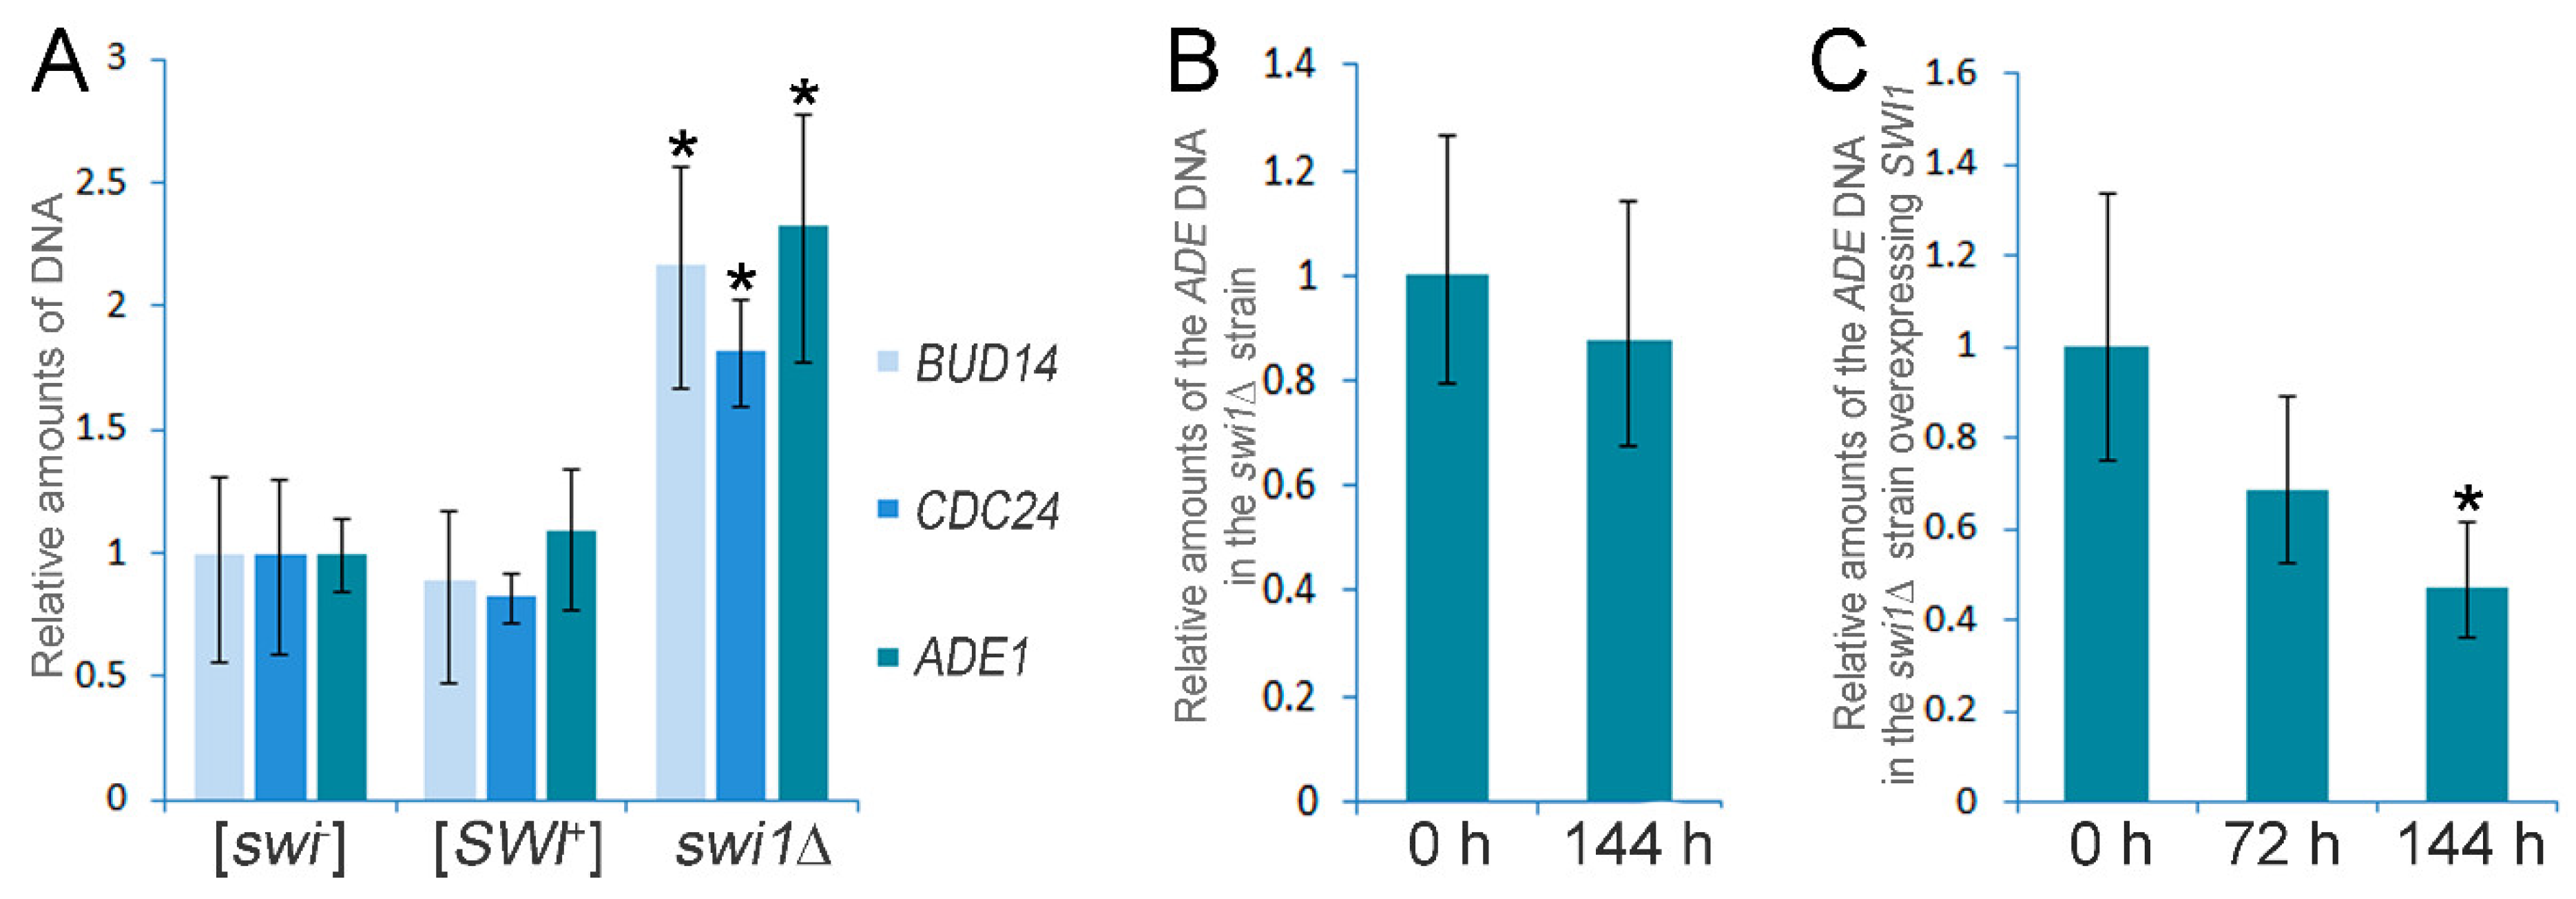
3.2. SWI1 Deletion Causes the Chromosome I Disomy

The deletion of SWI1 was found to cause an increase in the expression of ~50% genes located on the chromosome I (Figure 2, Table S5). This mean was remarkably high for the chromosome I, since for other chromosomes, it varied from 6.9 to 14.4% of the total number of genes (Table S5). Based on these data, we hypothesized that the SWI1 deletion could cause the chromosome I disomy. To clarify whether the chromosome I is duplicated in the swi1Δ strain, we extracted genomic DNA from the [SWI+], [swi], and swi1Δ strains and performed a quantitative polymerase chain reaction (qPCR) using three genetic markers (ADE1 presented by the ade1-14UGA nonsense allele which was previously found to be upregulated in the swi1Δ strain [43], BUD14, and CDC24) located on the chromosome I. The results of the qPCR demonstrated that the copy numbers of all three genes, ADE1, BUD14, and CDC24, are approximately two times higher in the swi1Δ strain in comparison with the [SWI+] and [swi] strains (Figure 3A), thus supporting the data obtained with RNA-Seq and confirming the chromosome I duplication in the swi1Δ strain.
Next, we tested the stability of the chromosome I maintenance on the background of the SWI1 deletion. We grew the swi1Δ cells for 144 h on the complete medium (approximately 60 generations) and tested the chromosome I copy number after this period of cultivation. We found that the copy number of the ade1-14 remained the same after 144 h of cultivation (Figure 3B), showing that the chromosome I disomy is stably inherited in the cell divisions on the background of the SWI1 deletion.
An obvious question was whether the chromosome I disomy compensates for the possible inviability of the SWI1 deletion previously reported for several yeast strains [61,62] or occurs independently on the deleterious effects of the Swi1 disturbance. We shuffled the pL-Aβ-Sup35MC plasmid to pU-Aβ-Sup35MC in the swi1Δ strain and re-introduced SWI1 to this strain by transformation with the YGPM19p21 plasmid from the YSC4613 genomic library carrying the fragment of the XVI chromosome with the intact SWI1 gene. After that, we analyzed the chromosome I copy number in the transformants after 72 h and 144 h of cultivation at 30 °C by the qPCR. The results demonstrated that after 72 h of cultivation (approximately 30 generations), the chromosome I copy number in the SWI1Δ strain remained statistically the same as at the initial point of experiment (Figure 3C). Nevertheless, having passed 60 generations (144 h), the swi1Δ cells lost additional chromosome I and its copy number was approximately two times less than at the beginning (Figure 3C).
Thus, the SWI1 deletion causes the chromosome I disomy on the genetic background of the haploid yeast strain analyzed, and this disomy probably compensates for the lethality of the SWI1 deletion since it is stably inherited but rapidly vanishes after the re-introduction of the SWI1 gene. Notably, the [SWI+] prion formation does not cause the chromosome I disomy in contrast to the effects of the SWI1 deletion.

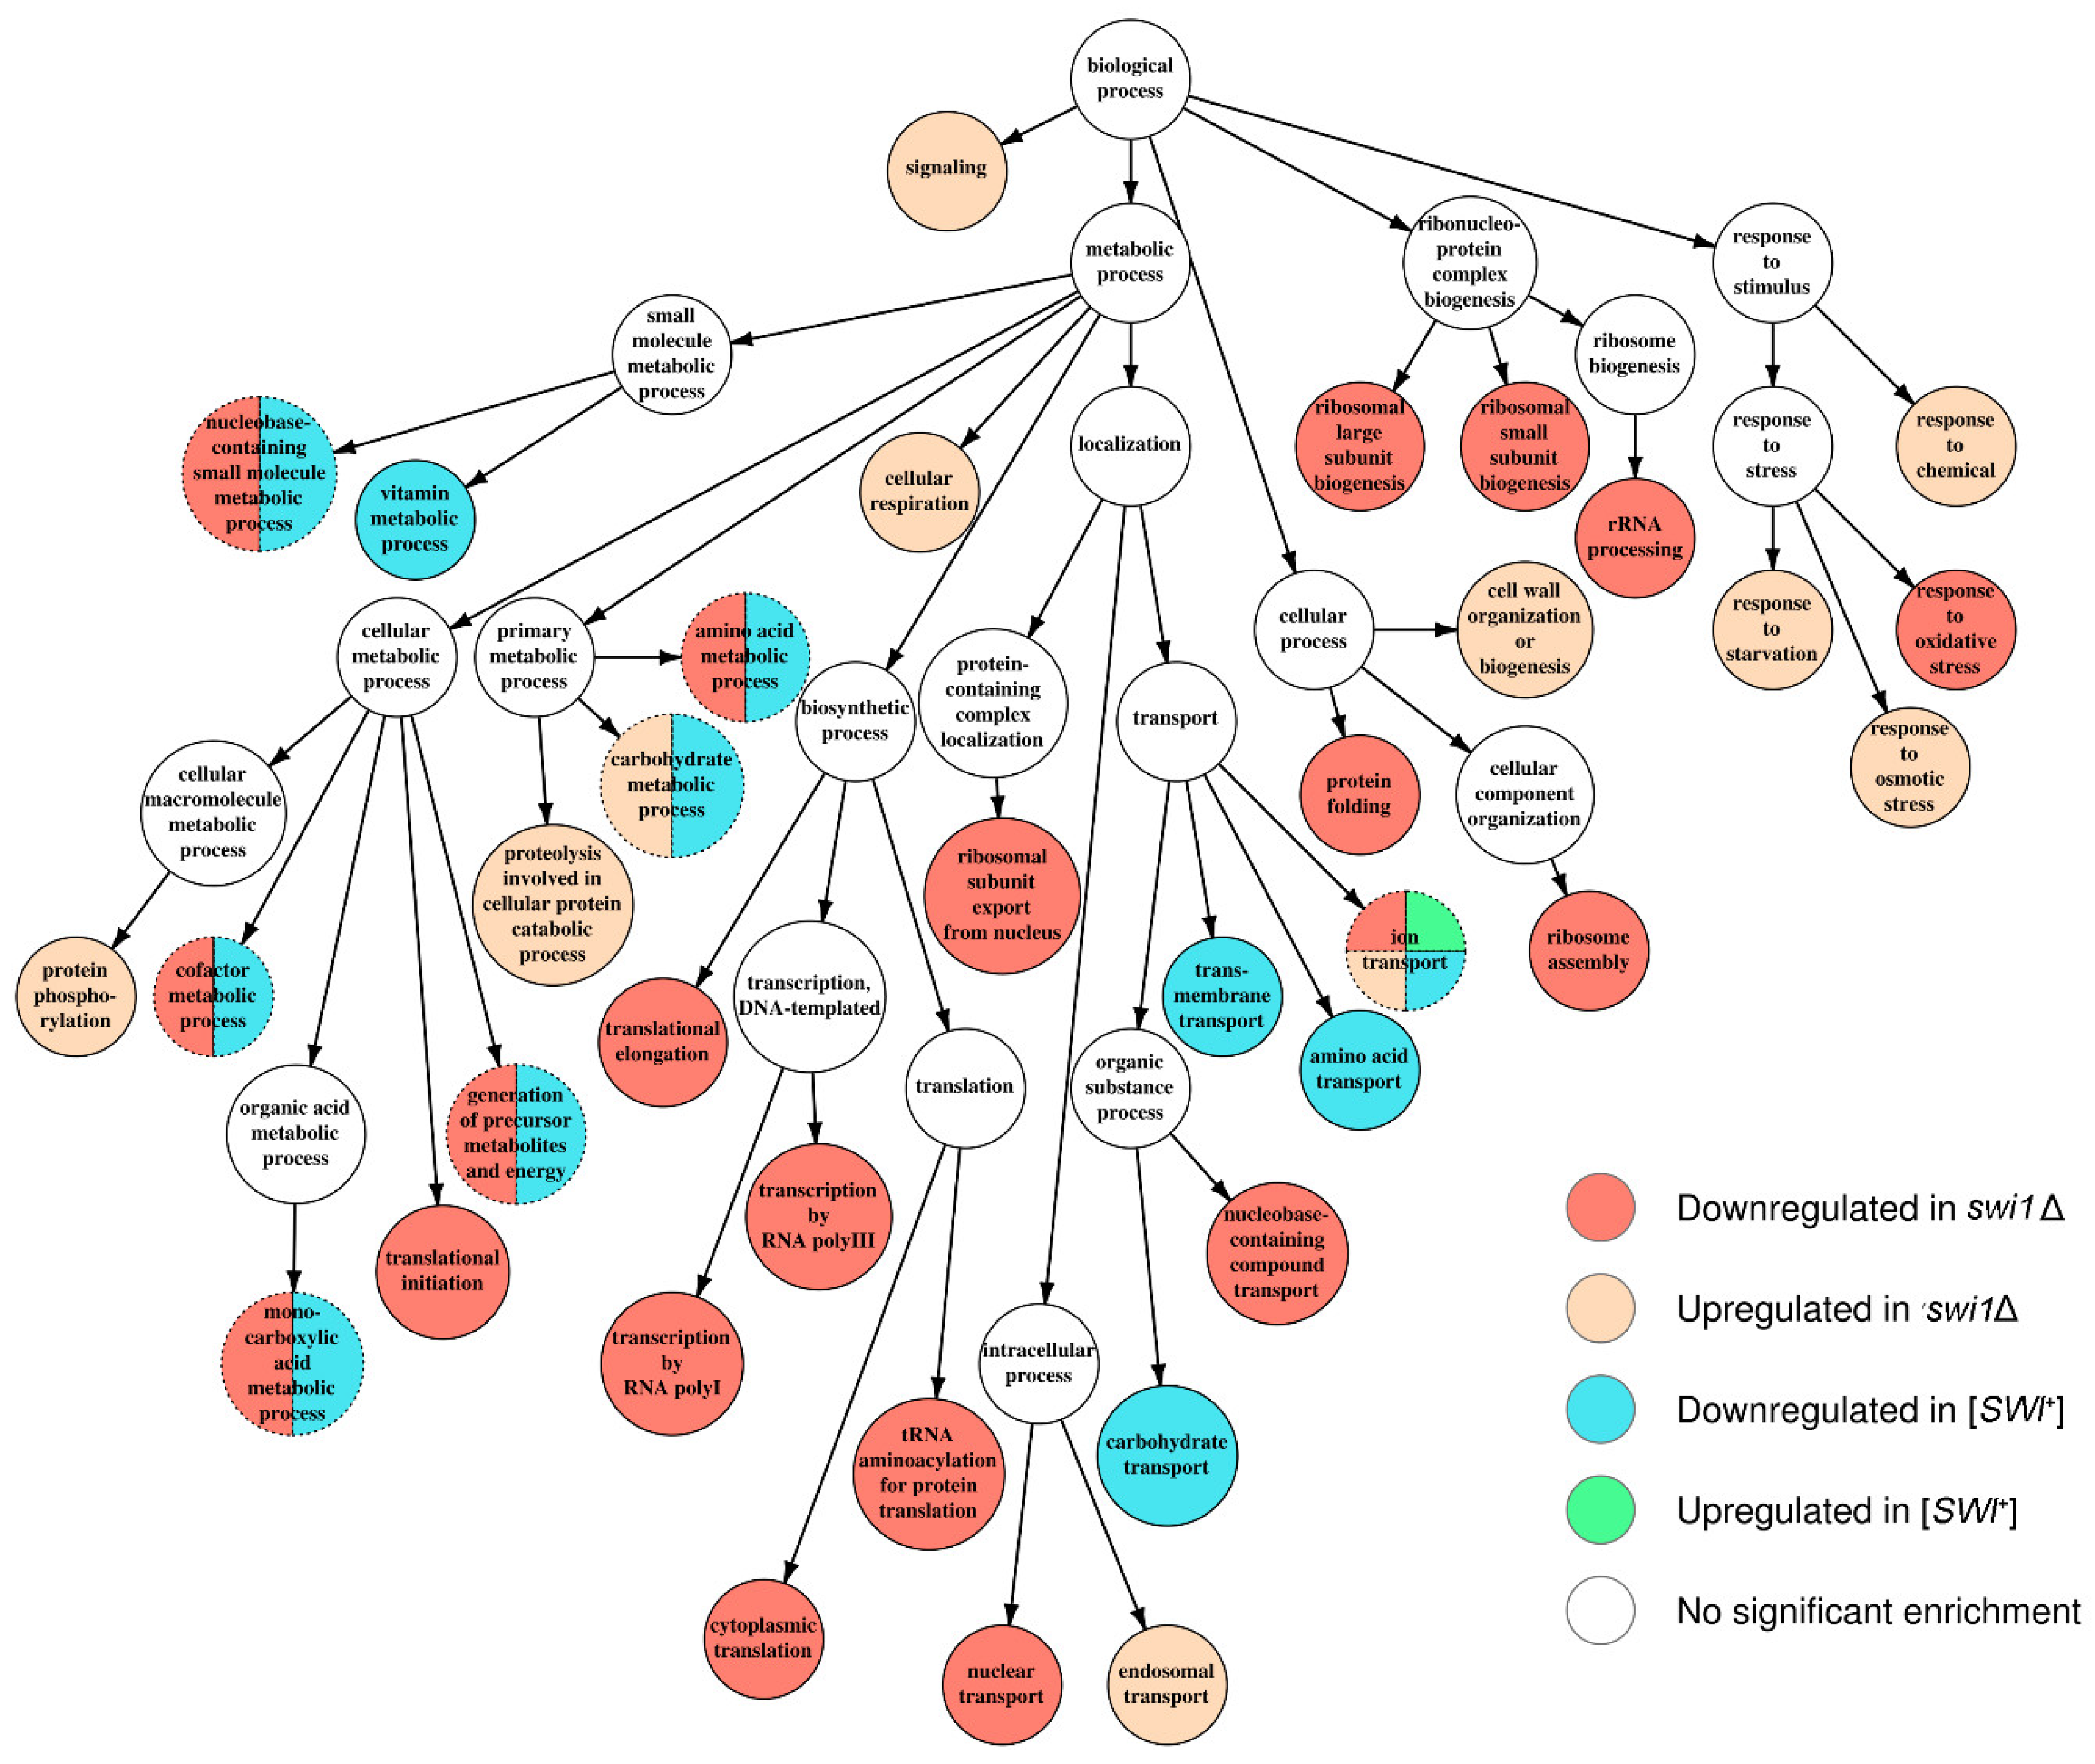
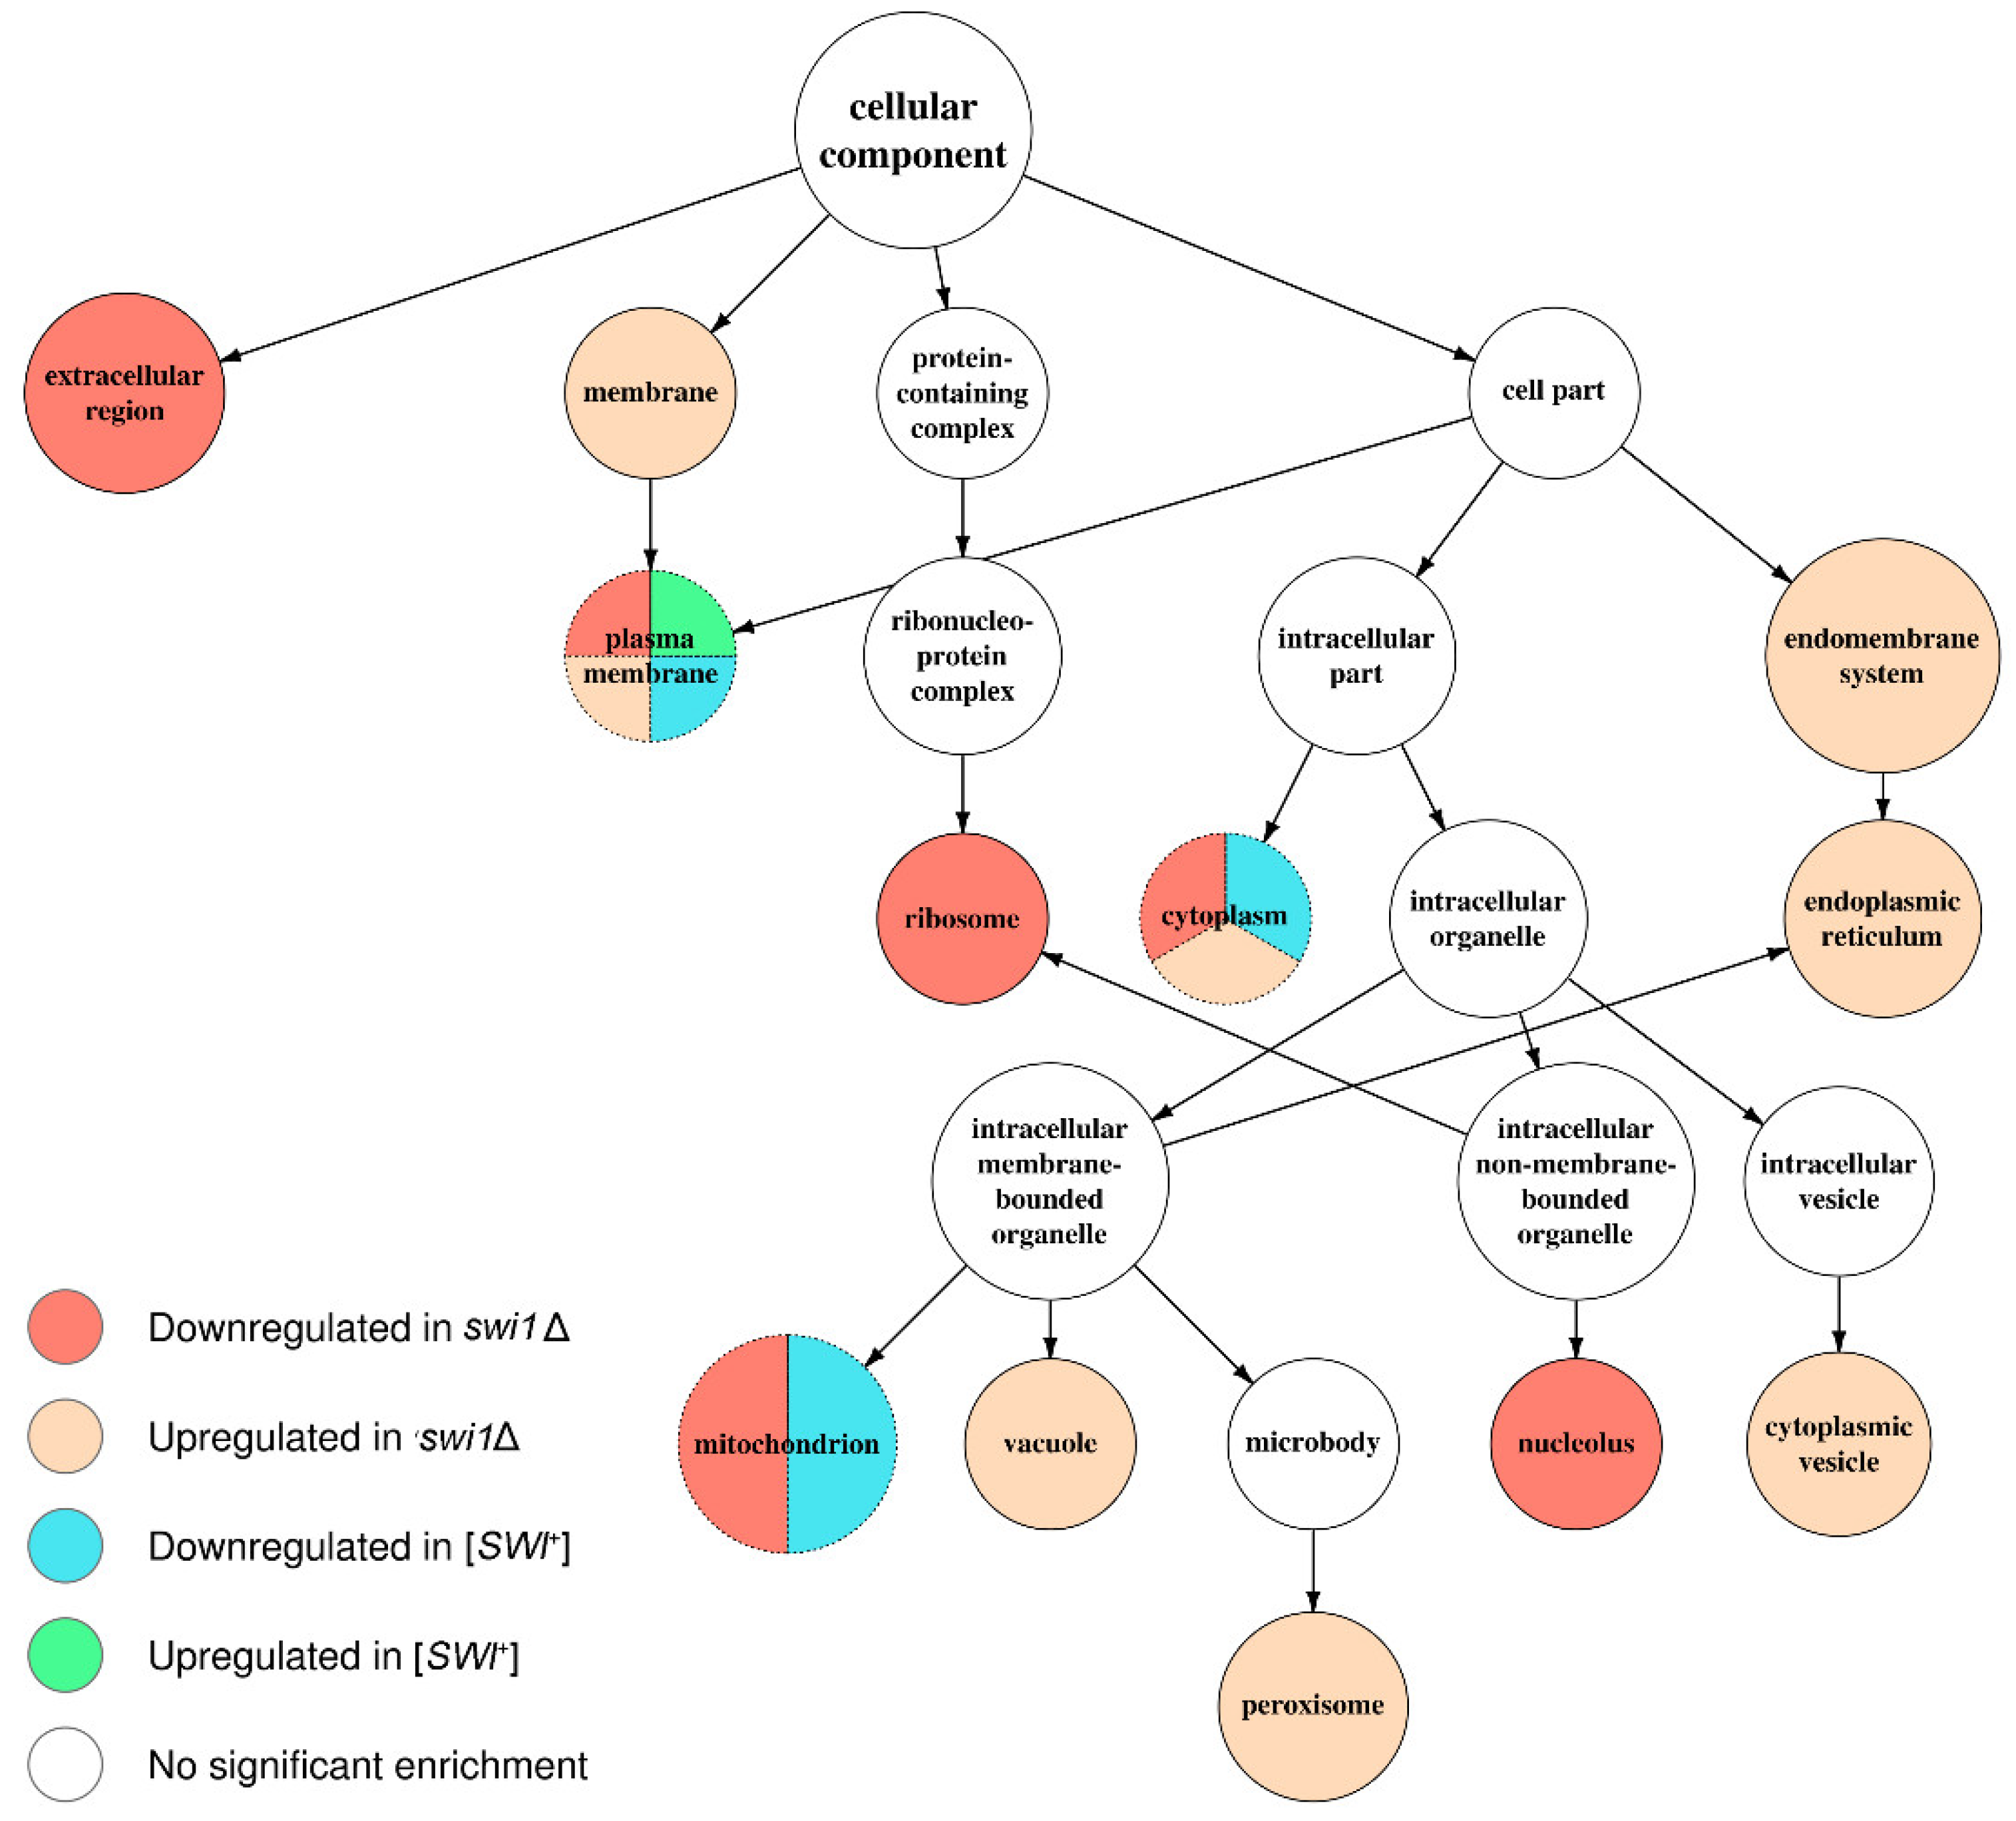
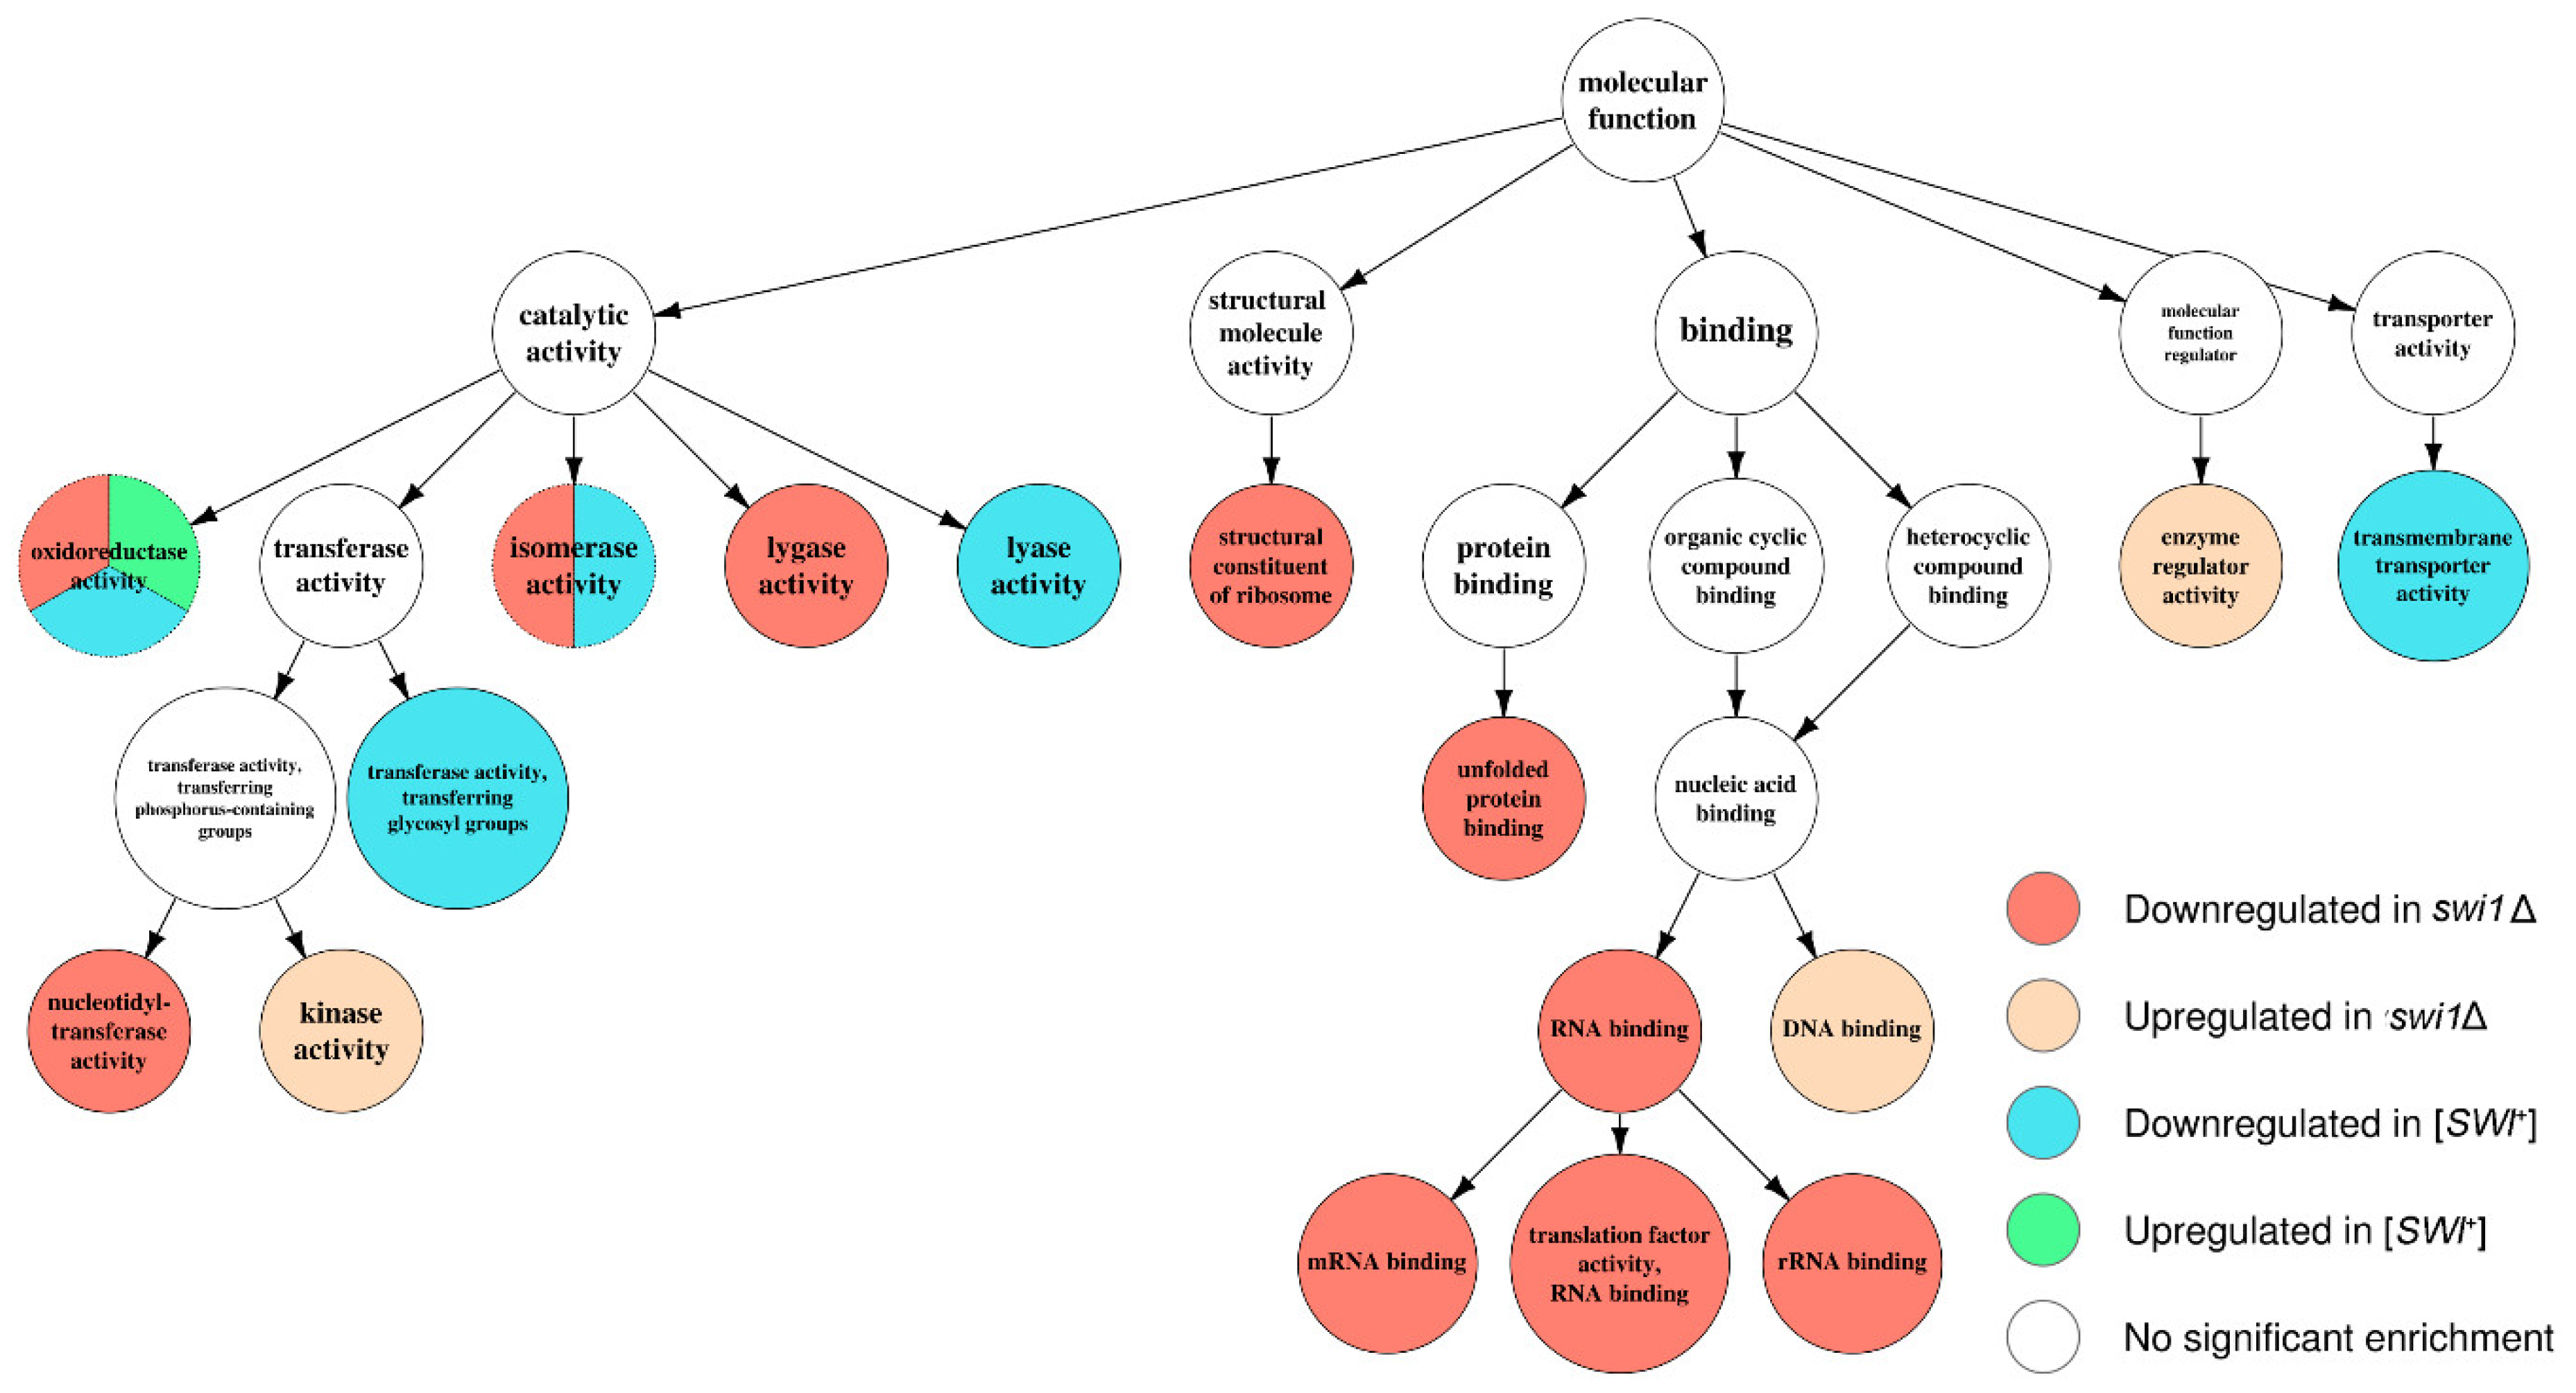
3.3. SWI1 Deletion Modulates a Higher Number of Biological Processes and Molecular Functions than the [SWI+] Prion

In order to specify the effects of the observed transcriptional changes on cell physiology, we performed an annotation of several acquired sets of differentially expressed genes. We started with testing the sets standing for [SWI+] to [swi] and swi1Δ to [swi] comparisons for over-represented Gene Ontology terms using the topGO package for R language (Table S6). The resulting terms were then mapped onto shared term hierarchy graphs depicting three primal ontologies, namely the Biological Process (BP), the Cellular Component (CC), and the Molecular Function (MF) (Figure 4, Figure 5 and Figure 6, Figures S1–S3, respectively). In addition, such analysis was then repeated for swi1Δ to [swi] DEGs, but with the genes located on the chromosome I excluded to avoid possible bias introduced by an adaptive duplication in the deletion-affected samples; this, however, resulted in slight changes in GO mapping of the repressed gene subset (addition of one term per both BP and MF ontology mapping and exclusion of only one term from BP mapping and two terms from CC mapping, respectively, see Table S6).
Apparently, the deletion-regulated gene subset appeared to be more enriched in various terms than the subset from the prion-containing strain. Several terms, most of which comprise BP ontology (Figure 4), are shared between the deletion-related and the prion-related DEGs, and might be related to phenotypic similarities between respective samples. However, most of the enriched terms were not shared between conditions, except for the most common terms, such as ‘ion transport’ from BP (Figure 4) and ‘plasma membrane’ from CC (Figure 5). One of the most notable traits of the deletion-affected samples is the downregulation of genes related to different stages of mRNA translation. The terms related to the translation are especially over-represented in the BP graph (Figure 4) and include rRNA processing and ribosome biogenesis and export to cytoplasm. To add some evidence, this correlates with the downregulation of ‘ribosome’ and ‘nucleolus’ terms in the CC graph (Figure 5) and ‘structural constituent of ribosome’ and cluster of terms inferior to ‘RNA binding’ in the MF graph (Figure 6).
Moreover, the translation impairment affects not only ribosome functionality, but also translational initiation and elongation (Figure 4); it is also noteworthy that ‘nucleotidyl-transferase activity’ from MF ontology is also downregulated (Figure 6) which may, in this aspect, be related to aminoacyl-tRNA synthesis. Finally, the transcriptional activity of RNA polymerases I and III activities also seem to be disrupted by the deletion only (Figure 4). At the same time, the terms promoted by deletion are mostly related to various stress responses and vacuolar transport (Figure 4), which is supported by the upregulation of terms related to vacuoles and other membranous organelles (Figure 5). Unlike this, the [SWI+] prion formation does not affect either transcription or translation and results in downregulation of the genes attributed to the GO terms related to transmembrane transport of various small metabolites, as well as their biogenesis and metabolism (Figure 4 and Figure 6), while the genes whose expression increases in the presence of the prion show very poor enrichment in any of the three ontologies (Figure 4, Figure 5 and Figure 6).

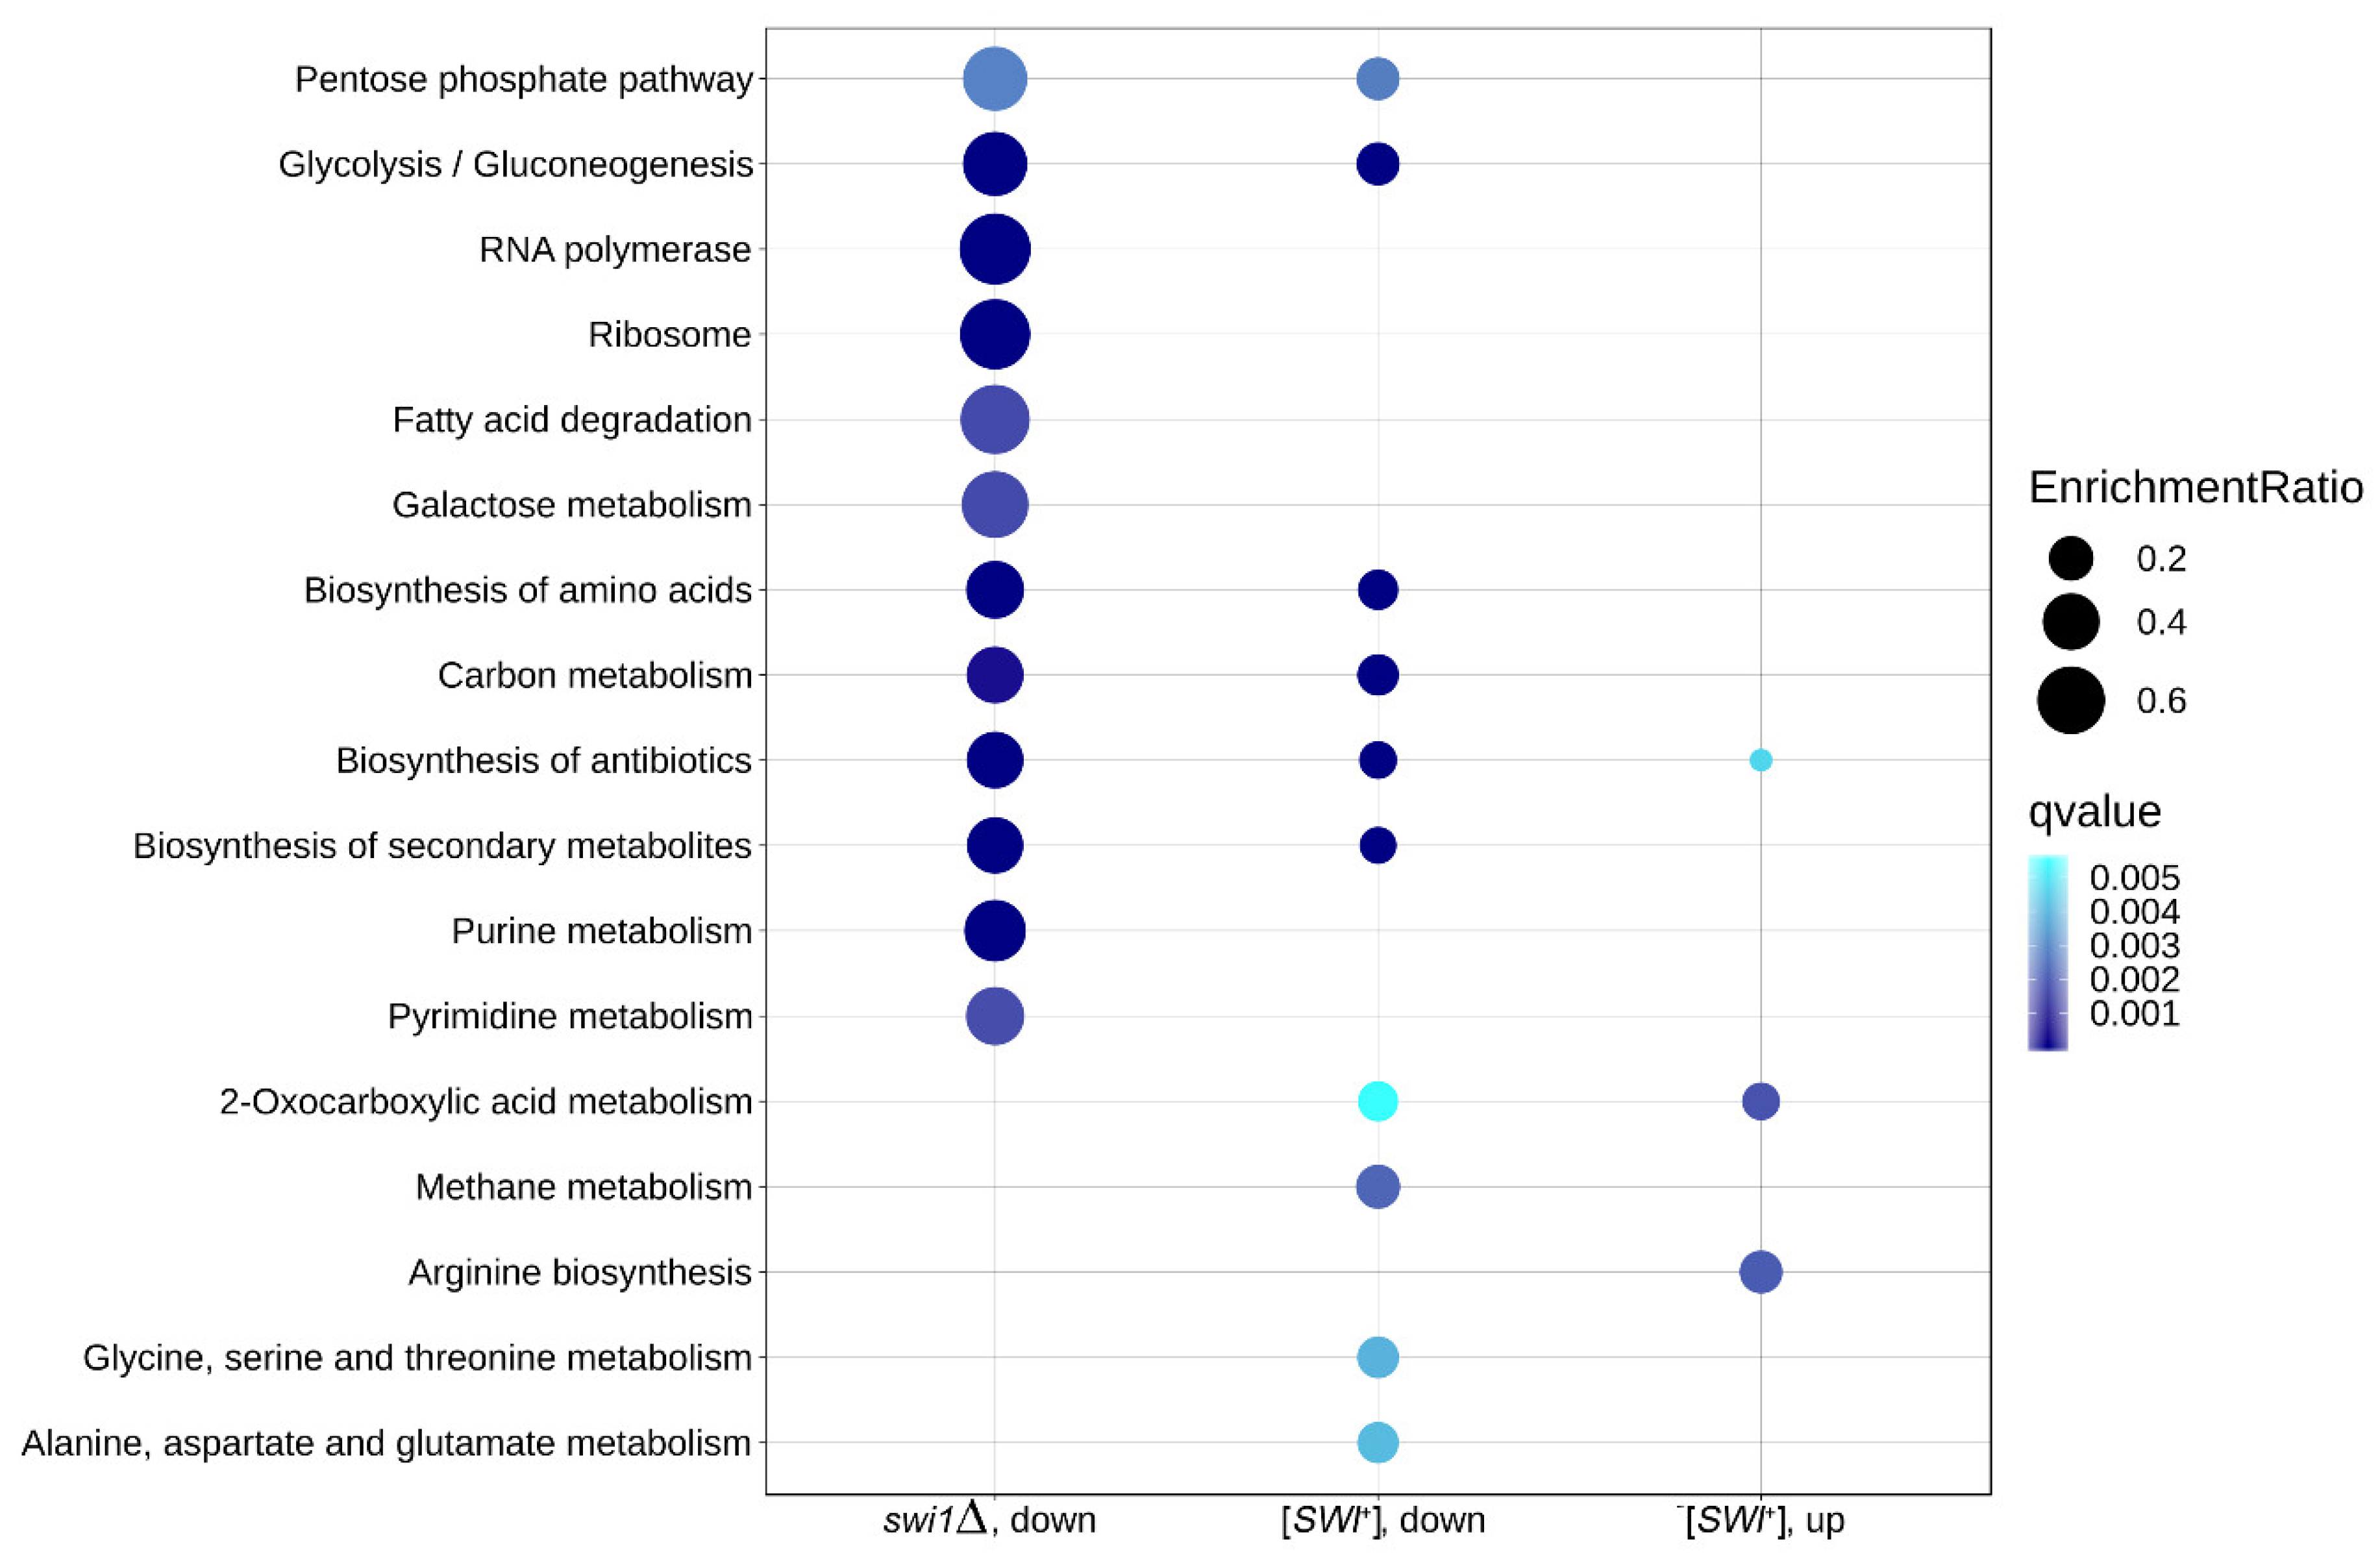
3.4. The Effects of SWI1 Deletion and [SWI+] Prion on Metabolic Pathways Correlate with Their Phenotypic Manifestations

To validate the obtained results and to specify their effect on particular metabolic and functional pathways, we then performed a KEGG Pathway overrepresentation test on down- and upregulated genes in each condition (Figure 7). Surprisingly, no overrepresented pathways were found in the deletion-promoted genes. In the other three subsets, 17 pathways were found to be overrepresented overall, with seven pathways present in at least two subsets. Among these acquired pathways, several were found to be ‘global’ metabolic pathways and thus were dismissed as non-significant, and the rest were visualized via the Pathview R package for a closer look (Figure S4). The genes were mapped for both experimental conditions, even if in one of them, the pathway was not found to be over-represented. Deterioration of the carbohydrate metabolic pathways, such as the glycolysis and pentose phosphate pathway, seems to be concordant between prion- and deletion-affected samples, though the SWI1 deletion replenishes glucose dissimilation with the upregulation of genes recruiting alternative carbon sources to CoA acetylation (Figure S4A,B). At the same time, the galactose metabolism appears to be downregulated exclusively in the deletion state (Figure S4C). Another overrepresented trait of deletion is massive downregulation of the nucleobase synthesis (Figure S4D,E), considering both major biosynthesis pathways and reactions leading to nucleobase-containing cofactors and other nitrogen-containing compounds. The purine synthesis impairment is also partially reproduced in the [SWI+] samples, though the repression there mostly affects downstream reactions, such as inter-nucleobase transmutation rather than major pathways. In addition, [SWI+] tends to both repress and promote specific amino acid metabolic pathways. Despite the fact that the ‘biosynthesis of amino acids’ pathway was overrepresented in the set of genes repressed by the SWI1 deletion, none of the specific pathways were found by the overrepresentation test for the deletion-affected samples, so we mapped these genes onto metabolic pathways acquired for prion-regulated genes, as well as tryptophan biosynthesis, which could be related to the observed phenotype (Figure S4F–H). Surprisingly, prion and deletion showed a similar effect on arginine biosynthesis, with four genes concordantly upregulated and one gene downregulated (Figure S4G). All these results concur with the overrepresented terms obtained for the BP GO ontology for different amino group-containing moieties, including both nucleobase-containing metabolites and amino acids.
Speaking of previously observed translational inactivation on the swi1Δ background, only one related pathway, namely ‘ribosome’, was found to be over-represented (Figure S4I). Indeed, most of the ribosomal proteins present in yeast appear to be deficient in the swi1Δ strain. However, this term solely describes the ribosome constituent, while GO testing revealed a complex negative impact of deletion on the translation machinery. Following this surmise, we collected all translation-related KEGG pathways and mapped all DEGs onto them (Figure S4J–M). Apparently, all the terms are notably impacted by the deletion, while the prion-regulated genes do not appear in the graphs, and that deletion causes the visible activation of several genes involved alongside mostly repressive effects. This mapping allows tracking down a cumulative effect of the SWI1 deletion on almost all stages of translation and protein biogenesis, including ribosome biogenesis and export from the nucleus (Figure S4J), mRNA processing and nonsense-mediated decay (Figure S4K), export to the cytoplasm (Figure S4L), and aminoacyl-tRNA synthesis (Figure S4M).
Since the RNA-Seq data demonstrated that the deletion of SWI1 caused general repression of the translation-related processes, while [SWI+] did not lead to these effects, we checked whether this difference can be detected phenotypically. The [SWI+] prion was initially identified in our strains as a weak omnipotent suppressor of the nonsense alleles ade1-14UAG and trp1-289UGA [37]. This causes translational read-through that leads to omnipotent nonsense suppression, resulting in the growth of the [SWI+] strain on the media without adenine or tryptophan, respectively. This effect is phenotypically detected only in the presence of the mutant variants of SUP35 encoding release factor eRF3 with decreased functional activity [35]. Here, we tested the phenotypes of the [SWI+] and swi1Δ strains in which a weak suppressor SUP35 variant Aβ-Sup35MC was substituted for a wild-type SUP35 under the control of its endogenous promoter located on the pYCH-U2 plasmid. As expected, the [SWI+] and swi1Δ strains exhibited the same growth on the MD plates with glucose as the sole carbon source, but demonstrated strong growth inhibition on the MD plates with galactose as the sole carbon source (Figure 8A). Surprisingly, the swi1Δ strain exhibited strong nonsense suppression on the media without adenine and tryptophan, reflecting global disturbance of translation occurring in the presence of SWI1 deletion, while [SWI+] did not exhibit this effect (Figure 8A). Nevertheless, addition to the cultural media of the aminoglycoside antibiotic paromomycin that has multiple binding sites in the eukaryotic ribosome and inhibits almost all stages of protein synthesis [63], thus mimicking the SWI1 deletion effects, caused the appearance of the same suppressor phenotype in the [SWI+] strain (Figure 8A), confirming the crucial role of the ribosome biogenesis defect in developing the phenotypic manifestation of the SWI1 deletion.

4. Discussion

The comparative analysis of the transcriptomic effects of the prion formation and deletion of the structural gene of the Swi1 protein performed in this study demonstrated that both the [SWI+] prion and SWI1 deletion modulate the expression of hundreds of genes on the media containing galactose as the sole carbon source (Table 1). These changes affect various molecular functions, biological processes, and metabolic pathways (Figure 4, Figure 5, Figure 6 and Figure 7), reflecting pleiotropic phenotypic manifestations of the [SWI+] prion and the SWI1 deletion described in various studies (Table 2). Despite some general similarities between the subsets of genes affected by these two states of SWI1, the effects of swi1Δ are much stronger than [SWI+] and involve at least two highly specific effects that do not arise in the presence of the prion: (i) the chromosome I disomy and (ii) the repression of the ribosome biogenesis and translation, including the downregulation of almost all genes for ribosomal proteins, as well as genes located on the chromosome XII within rDNA locus RDN1.
The repression of the locus RDN1 encoding rRNA demonstrated (in this work) for the SWI1 deletion was previously found to be also caused by the deletion of SNF2 encoding another component of the SWI/SNF chromatin remodeler [64]. Moreover, we found that not only the expression of RND1 is affected by the SWI1 deletion, but the genes encoding ribosomal proteins, the translation factors, and biosynthesis of most of the aminoacyl-tRNAs are also downregulated on such a background (Figure S4). The downregulation of the translation-related genes was also demonstrated for the SNF2 and SWI3 mutants [30,65]. Thus, inactivation of at least three subunits of SWI/SNF affects ribosome biogenesis, suggesting the role of this complex as the essential regulator of translation. Moreover, at least three of the four SWI/SNF modules [30] (catalytic (presented by Snf2), regulatory (Swi3), and Swi1 module) are involved in the expression of translation-related genes. Interestingly, the deletions of peripheral subunits of SWI/SNF (Snf5 and Snf12) did not affect translational machinery [30]. Thus, SWI1 is likely to be important for the core function of SWI/SNF, at least in the regulation of the translation-related genes.
Notably, the prion formation by SWI1 does not cause a significant decrease of the translation-related genes, which can be easily monitored by the growth of the [SWI+] strains containing respective nonsense mutations (ade1-14UGA and trp1-289UAG) on the media that lacked adenine or tryptophan (nonsense suppression) (Figure 8A). We found that the SWI1 deletion causes strong omnipotent nonsense suppression, even in the presence of the wild-type Sup35 (eRF3) (Figure 8A), while [SWI+] causes nonsense suppression either in the presence of mutant Sup35 with decreased eRf3 functional activity [35,42] or on the media with aminoglycoside antibiotics [40] that block different stages of translation [63], imitating the effects of the SWI1 deletion. Taking together, in contrast to [SWI+], the deletion of the SWI1 gene causes global inhibition of translation that is detected phenotypically.
The SWI/SNF remodelers are known to be essential for genome stability, not only as master regulators of transcription, but also via maintaining sister chromosome cohesion and the DNA damage response, at least in mammals [66]. We found that SWI1 deletion causes a stably inherited chromosome I disomy on the genetic background of the 11-1-1-D931 yeast strain, but an additional chromosome I copy gradually disappears when the wild-type SWI1 is re-introduced, suggesting a compensatory effect of such a disomy (Figure 3). A similar effect was previously found in several [PSI+] (a prion of Sup35) strains [67] that also exhibited a strong nonsense suppressor phenotype [68]. Thus, the chromosome I disomy could play an important role in compensation of the defects in translation termination fidelity. Nevertheless, the SWI1 deletion also causes downregulation of the purine biosynthesis (Figure S4). Thus, the chromosome I disomy may potentially alleviate this process by increasing ade1-14 levels, which was previously found to compensate for the growth defects of the strains with the same genotype on a media without adenine [43]. Notably, the aneuploidy was demonstrated to be associated with the formation of different non-chromosomal determinants affecting the translation termination efficiency, like [ISP+] (initially described as a prion form of the transcriptional regulator Sfp1 [11] and later connected with the chromosome II copy number [69]), as well as the [ASP+] (chromosome VIII disomy [70]). Probably, the prion formation by several proteins regulating key biological processes could induce genome instability in a few fractions of cells that are inherited by progeny under selective pressure and determine adaptive phenotypic traits like resistance to poisonous compounds.
Another feature of the chromosome I disomy, proteotoxic stress caused by the impairment of protein quality-control pathways, resulted in intense protein aggregation in the cytoplasm, which was described in [71]. In our study, swi1Δ yeast was marked by abundant expression misregulation of genes related to protein folding control (HSP10, HSP12, HSP26, HSP30, HSP42, and HSP104), ubiquitination (UBP5, UBP11, and UBP13), and proteasome biogenesis and proteolytic activity (RPN4-9, HUL5, SPG5, POC4, SEM1, HSC82, SRP1, and several more), thus indirectly backing up the notion about the deteriorating effect of the chromosome I disomy on proper folding supervision. Furthermore, most of these effects were not registered in [SWI+] cells’ transcriptome.
The molecular processes underlying even similar phenotypic manifestations of the [SWI+] and SWI1 deletion are different. In the case of the suppression of ade1-14, [SWI+] causes a decrease in the eRF1 (SUP45) amounts that leads to the phenotypically detected nonsense suppression only in the presence of the mutant eRF3 variants, with decreased functional activity [35,42] (Figure 8B). In contrast, the SWI1 deletion causes both the general inhibition of translation-related genes and overexpression of ade1-14 by the chromosome I disomy that leads to nonsense suppression, even in the presence of wild-type SUP35 (Figure 8 B). The inhibition of the translation-related genes seems to be a primary source of nonsense suppression since trp1-289 is suppressed in the swi1Δ strains expressing wild-type SUP35, and this effect can be reached in the [SWI+] strain by the addition of aminoglycosides (Figure 8B). The deletion of the SWI1 blocks induction of the GAL regulon essential for the galactose metabolism [72,73] (Figure S4), thus leading to the inhibition of growth on the media containing galactose as the sole carbon source, while [SWI+] causes the same effect, but does not affect the expression of GAL genes (Figure S4). Galactose is involved in the energy production by either a consequent transmutation into lactose and then α-d-glusose or an exchange between α-d-galactose phosphate and UDP-glucose [74]; in both cases, the glucose-derived product is then recruited to glycolysis. This might shed light on the nature of this phenocopy as most of the glycolitic enzymes are concordantly repressed in both [SWI+] and swi1Δ samples (Figure S4).
Another feature of swiΔ cells is the altered response to various stress conditions (Figure 4). The recent findings suggest that SWI/SNF plays an important role in the stress response. Indeed, the Snf2 catalytic subunit of SWI/SNF was shown to be recruited to response of the genes under osmotic stress by means of the Cyc8-Tup1 regulatory network [75], and this recruitment is positively affected by kinases of the PKA family [76]. In addition, the sets of genes misregulated by deletions of SWI2 and TAF14 that encode the transcriptional regulator involved in the stress alleviation overlap significantly [77]. However, it does not explain why most of the response types are positively modulated in the swi1Δ cells, while the oxidative stress response is repressed. On the latter, one might suggest a link to positive regulation of the ‘cellular respiration’ term (Figure 4) and thus interdependence between the repression of the oxidative stress response genes and the activation of the oxidative phosphorylation genes. To date, the connection between SWI/SNF activity and ROS formation has been found in human cells, where inactivation of the ARID1B SWI1-like protein leads to the deterioration of the oncogene-induced senescence of malignant cells, a process associated with ROS formation [78].
It is noteworthy that at least seven genes were found to be altered in their expression in [SWI+] yeast, though they remained intact on the swi1Δ background. Of these, four genes (ICS2, DLD3, PER33, and ENA1) were activated and three (IDP2, FMP16, and AGX1) were repressed by the prion. In addition, HSP12 and HXT5 were downregulated in the [SWI+] cells and upregulated in swi1Δ. Respective proteins seem to share nothing in common in their functions; however, further inspection showed that all of these genes fall under regulation by the Oaf1 transcription factor either directly or via downstream transcription regulators. The Oaf1 protein is involved in the control of fatty acid β-oxidation, peroxisome formation, and telomeric silencing, and is encoded by a gene located in chromosome I [79,80]. This gene is also upregulated in swi1Δ cells, presumably by means of dose compensation. Probably, compensatory chromosome I disomy leading to OAF1 upregulation in the SWI1Δ but not [SWI+] cells might partially alleviate the effects of Swi1 inactivation.
Taken together, both the [SWI+] prion and the SWI1 deletion cause global changes in the expression of the yeast genome. Despite overall similarity between the subsets of the genes whose expression is modulated by [SWI+] and swi1Δ and their phenotypic manifestations, the impact of SWI1 deletion on the modulation of gene expression is significantly much stronger and involves specific effects. These effects of swi1Δ include: (i) the general downregulation of the translation-related genes; (ii) the chromosome I disomy; and (iii) different patterns of up- and downregulation of various biological processes, molecular functions, and metabolic pathways, including the downregulation of GAL regulon and purine metabolism. In contrast, [SWI+] does not cause such a repression of the main metabolic pathways and processes and specifically modulates the expression of several genes. Thus, [SWI+] prion formation exhibits only partial loss-of-function effects, with several gain-of-function features. These data suggest that yeast prions are modulators of functions of normal cellular proteins rather than pathological ‘dead ends’ of their misfolding and aggregation.

Supplementary Materials

The following are available online at https://www.mdpi.com/2073-4425/10/3/212/s1, Table S1: Oligonucleotides used in this study, Table S2: RNA-Seq library sizes before and after trimming and technical repeat merging, Table S3: Genes whose expression levels are affected by the [SWI+] prion or SWI1 deletion, Table S4: Genes whose expression is specifically modulated by the [SWI+] prion, Table S5: Distribution of differentially expressed genes across chromosomes and mtDNA, Table S6: Biological processes, molecular functions, and cellular components that are affected by the [SWI+] prion or SWI1 deletion, Figure S1: Biological Process Graph in svg format, Figure S2: Cellular Component Graph in svg format, Figure S3: Molecular Function Graph in svg format, Figure S4: Visualized KEGG pathways with DEG mapping from [SWI+] and swi1Δ.

Author Contributions

Conceptualization, A.A.N., K.S.A., and S.G.I.-V.; methodology, Y.V.M., K.S.A., and A.A.N.; validation, Y.V.M., K.S.A., and A.A.N.; formal analysis, Y.V.M., K.S.A., and A.A.N.; investigation, Y.V.M., K.S.A., A.R.M., E.A.A., and A.A.N.; writing—original draft preparation, A.A.N., Y.V.M., and K.S.A.; writing—review and editing A.A.N., Y.V.M., and K.S.A.; visualization, K.S.A., Y.V.M., and A.A.N.; funding acquisition, A.A.N. and S.G.I.-V.

Funding

This study was supported by the Russian Foundation for Basic Research (RFBR), Grant 17-04-00816.

Acknowledgments

The authors acknowledge “Biobank” and “Development of Molecular and Cell Technologies” Resource Centers of the Research Park of St. Petersburg State University.

Conflicts of Interest

The authors declare no conflict of interest.

References

  1. McKinley, M.P.; Bolton, D.C.; Prusiner, S.B. A protease-resistant protein is a structural component of the scrapie prion. Cell 1983, 35, 57–62. [Google Scholar] [CrossRef]
  2. Chernova, T.A.; Wilkinson, K.D.; Chernoff, Y.O. Physiological and environmental control of yeast prions. FEMS Microbiol. Rev. 2014, 38, 326–344. [Google Scholar] [CrossRef] [PubMed]
  3. Wickner, R.B.; Shewmaker, F.P.; Bateman, D.A.; Edskes, H.K.; Gorkovskiy, A.; Dayani, Y.; Bezsonov, E.E. Yeast Prions: Structure, Biology, and Prion-Handling Systems. Microbiol. Mol. Biol. Rev. 2015, 79. [Google Scholar] [CrossRef] [PubMed]
  4. Wickner, R.B.; Kelly, A.C. Prions are affected by evolution at two levels. Cell. Mol. Life Sci. 2016, 73, 1131–1144. [Google Scholar] [CrossRef]
  5. Nizhnikov, A.A.; Antonets, K.S.; Bondarev, S.A.; Inge-Vechtomov, S.G.; Derkatch, I.L. Prions, amyloids, and RNA: Pieces of a puzzle. Prion 2016, 10, 182–206. [Google Scholar] [CrossRef] [PubMed]
  6. Patel, B.K.; Gavin-Smyth, J.; Liebman, S.W. The yeast global transcriptional co-repressor protein Cyc8 can propagate as a prion. Nat. Cell Biol. 2009, 11, 344–349. [Google Scholar] [CrossRef]
  7. Du, Z.; Park, K.K.-W.; Yu, H.; Fan, Q.; Li, L. Newly identified prion linked to the chromatin-remodeling factor Swi1 in Saccharomyces cerevisiae. Nat. Genet. 2008, 40, 460–465. [Google Scholar] [CrossRef]
  8. Wickner, R.B. [URE3] as an altered URE2 protein: Evidence for a prion analog in Saccharomyces cerevisiae. Science 1994, 264, 566–569. [Google Scholar] [CrossRef]
  9. Alberti, S.; Halfmann, R.; King, O.; Kapila, A.; Lindquist, S. A systematic survey identifies prions and illuminates sequence features of prionogenic proteins. Cell 2009, 137, 146–158. [Google Scholar] [CrossRef]
  10. Suzuki, G.; Shimazu, N.; Tanaka, M. A yeast prion, Mod5, promotes acquired drug resistance and cell survival under environmental stress. Science 2012, 336, 355–359. [Google Scholar] [CrossRef]
  11. Rogoza, T.; Goginashvili, A.; Rodionova, S.; Ivanov, M.; Viktorovskaya, O.; Rubel, A.; Volkov, K.; Mironova, L. Non-Mendelian determinant [ISP+] in yeast is a nuclear-residing prion form of the global transcriptional regulator Sfp1. Proc. Natl. Acad. Sci. USA 2010, 107, 10573–10577. [Google Scholar] [CrossRef]
  12. Michelitsch, M.D.; Weissman, J.S. A census of glutamine/asparagine-rich regions: Implications for their conserved function and the prediction of novel prions. Proc. Natl. Acad. Sci. USA 2000, 97, 11910–11915. [Google Scholar] [CrossRef]
  13. McGlinchey, R.P.; Kryndushkin, D.; Wickner, R.B. Suicidal [PSI+] is a lethal yeast prion. Proc. Natl. Acad. Sci. USA 2011, 108, 5337–5341. [Google Scholar] [CrossRef]
  14. Halfmann, R.; Jarosz, D.F.; Jones, S.K.; Chang, A.; Lancaster, A.K.; Lindquist, S. Prions are a common mechanism for phenotypic inheritance in wild yeasts. Nature 2012, 482, 363–368. [Google Scholar] [CrossRef]
  15. Holmes, D.L.; Lancaster, A.K.; Lindquist, S.; Halfmann, R. Heritable remodeling of yeast multicellularity by an environmentally responsive prion. Cell 2013, 153, 153–165. [Google Scholar] [CrossRef]
  16. Wickner, R.B.; Edskes, H.K.; Bateman, D.; Kelly, A.C.; Gorkovskiy, A. The yeast prions [PSI+] and [URE3] are molecular degenerative diseases. Prion 2011, 5, 258–262. [Google Scholar] [CrossRef]
  17. Wickner, R.B. Yeast and fungal prions. Cold Spring Harb. Perspect. Biol. 2016, 8, a023531. [Google Scholar] [CrossRef]
  18. Dechassa, M.L.; Zhang, B.; Horowitz-Scherer, R.; Persinger, J.; Woodcock, C.L.; Peterson, C.L.; Bartholomew, B. Architecture of the SWI/SNF-nucleosome complex. Mol. Cell. Biol. 2008, 28, 6010–6021. [Google Scholar] [CrossRef]
  19. Tang, L.; Nogales, E.; Ciferri, C. Structure and function of SWI/SNF chromatin remodeling complexes and mechanistic implications for transcription. Prog. Biophys. Mol. Biol. 2010, 102, 122–128. [Google Scholar] [CrossRef]
  20. Smith, C.L.; Horowitz-Scherer, R.; Flanagan, J.F.; Woodcock, C.L.; Peterson, C.L. Structural analysis of the yeast SWI/SNF chromatin remodeling complex. Nat. Struct. Biol. 2003, 10, 141–145. [Google Scholar] [CrossRef]
  21. Schubert, H.L.; Wittmeyer, J.; Kasten, M.M.; Hinata, K.; Rawling, D.C.; Héroux, A.; Cairns, B.R.; Hill, C.P. Structure of an actin-related subcomplex of the SWI/SNF chromatin remodeler. Proc. Natl. Acad. Sci. USA 2013, 110, 3345–3350. [Google Scholar] [CrossRef]
  22. Neigeborn, L.; Carlson, M. Genes affecting the regulation of SUC2 gene expression by glucose repression in Saccharomyces cerevisiae. Genetics 1984, 108, 845–858. [Google Scholar]
  23. Peterson, C.L.; Herskowitz, I. Characterization of the yeast SWI1, SWI2, and SWI3 genes, which encode a global activator of transcription. Cell 1992, 68, 573–583. [Google Scholar] [CrossRef]
  24. Sudarsanam, P.; Iyer, V.R.; Brown, P.O.; Winston, F. Whole-genome expression analysis of snf/swi mutants of Saccharomyces cerevisiae. Proc. Natl. Acad. Sci. USA 2000, 97, 3364–3369. [Google Scholar] [CrossRef]
  25. Shivaswamy, S.; Iyer, V.R. Stress-dependent dynamics of global chromatin remodeling in yeast: Dual role for SWI/SNF in the heat shock stress response. Mol. Cell. Biol. 2008, 28, 2221–2234. [Google Scholar] [CrossRef]
  26. Dutta, A.; Gogol, M.; Kim, J.H.; Smolle, M.; Venkatesh, S.; Gilmore, J.; Florens, L.; Washburn, M.P.; Workman, J.L. Swi/Snf dynamics on stress-responsive genes is governed by competitive bromodomain interactions. Genes Dev. 2014, 28, 2314–2330. [Google Scholar] [CrossRef]
  27. Kadoch, C.; Hargreaves, D.C.; Hodges, C.; Elias, L.; Ho, L.; Ranish, J.; Crabtree, G.R. Proteomic and bioinformatic analysis of mammalian SWI/SNF complexes identifies extensive roles in human malignancy. Nat. Genet. 2013, 45, 592–601. [Google Scholar] [CrossRef]
  28. Breeden, L.; Nasmyth, K. Cell cycle control of the yeast HO gene: Cis- and Trans-acting regulators. Cell 1987, 48, 389–397. [Google Scholar] [CrossRef]
  29. Hirschhorn, J.N.; Brown, S.A.; Clark, C.D.; Winston, F. Evidence that SNF2/SWI2 and SNF5 activate transcription in yeast by altering chromatin structure. Genes Dev. 1992, 6, 2288–2298. [Google Scholar] [CrossRef]
  30. Dutta, A.; Sardiu, M.; Gogol, M.; Gilmore, J.; Zhang, D.; Florens, L.; Abmayr, S.M.; Washburn, M.P.; Workman, J.L. Composition and Function of Mutant Swi/Snf Complexes. Cell Rep. 2017. [Google Scholar] [CrossRef]
  31. Neely, K.E.; Hassan, A.H.; Brown, C.E.; Howe, L.; Workman, J.L. Transcription activator interactions with multiple SWI/SNF subunits. Mol. Cell. Biol. 2002, 22, 1615–1625. [Google Scholar] [CrossRef]
  32. Haber, J.E.; Garvik, B. A new gene affecting the efficiency of mating-type interconversions in homothallic strains of Saccharomyces cerevisiae. Genetics 1977, 87, 33–50. [Google Scholar]
  33. Taguchi, A.K.; Young, E.T. The cloning and mapping of ADR6, a gene required for sporulation and for expression of the alcohol dehydrogenase II isozyme from Saccharomyces cerevisiae. Genetics 1987, 116, 531–540. [Google Scholar]
  34. Du, Z.; Crow, E.T.; Kang, H.S.; Li, L. Distinct Subregions of Swi1 Manifest Striking Differences in Prion Transmission and SWI/SNF Function. Mol. Cell. Biol. 2010, 30, 4644–4655. [Google Scholar] [CrossRef]
  35. Nizhnikov, A.A.; Magomedova, Z.M.; Rubel, A.A.; Kondrashkina, A.M.; Inge-Vechtomov, S.G.; Galkin, A.P. Determinant has a pleiotropic phenotypic manifestation that is modulated by SUP35, SUP45, and VTS1 genes. Curr. Genet. 2012, 58, 35–47. [Google Scholar] [CrossRef]
  36. Du, Z.; Zhang, Y.; Li, L. The Yeast Prion [SWI+] Abolishes Multicellular Growth by Triggering Conformational Changes of Multiple Regulators Required for Flocculin Gene Expression. Cell Rep. 2015, 13, 2865–2878. [Google Scholar] [CrossRef]
  37. Saifitdinova, A.F.; Nizhnikov, A.A.; Lada, A.G.; Rubel, A.A.; Magomedova, Z.M.; Ignatova, V.V.; Inge-Vechtomov, S.G.; Galkin, A.P. [NSI+]: A novel non-Mendelian nonsense suppressor determinant in Saccharomyces cerevisiae. Curr. Genet. 2010, 56, 467–478. [Google Scholar] [CrossRef]
  38. Zhouravleva, G.; Frolova, L.; Le Goff, X.; Le Guellec, R.; Inge-Vechtomov, S.; Kisselev, L.; Philippe, M. Termination of translation in eukaryotes is governed by two interacting polypeptide chain release factors, eRF1 and eRF3. EMBO J. 1995, 14, 4065–4072. [Google Scholar] [CrossRef]
  39. Stansfield, I.; Jones, K.M.; Ter-Avanesyan, M.D.; Tuite, M.F. The products of the SUP45 (eRF1) and SUP35 genes interact to mediate translation termination in Saccharomyces cerevisiae. EMBO J. 1995, 14, 4365–4373. [Google Scholar] [CrossRef]
  40. Nizhnikov, A.A.; Kondrashkina, A.M.; Galkin, A.P. Interactions of [NSI+] prion-like determinant with SUP35 and VTS1 genes in Saccharomyces cerevisiae. Russ. J. Genet. 2013, 49, 1004–1012. [Google Scholar] [CrossRef]
  41. Kondrashkina, A.M.; Antonets, K.S.; Galkin, A.P.; Nizhnikov, A.A. Prion-Like Determinant [NSI+] Decreases the Expression of the SUP45 Gene in Saccharomyces cerevisiae. Mol. Biol. 2014, 48, 688–693. [Google Scholar] [CrossRef]
  42. Nizhnikov, A.A.; Ryzhova, T.A.; Volkov, K.V.; Zadorsky, S.P.; Sopova, J.V.; Inge-Vechtomov, S.G.; Galkin, A.P. Interaction of Prions Causes Heritable Traits in Saccharomyces cerevisiae. PLoS Genet. 2016, 12, e1006504. [Google Scholar] [CrossRef]
  43. Antonets, K.S.; Kliver, S.F.; Polev, D.E.; Shuvalova, A.R.; Andreeva, E.A.; Inge-Vechtomov, S.G.; Nizhnikov, A.A. Distinct mechanisms of phenotypic effects of inactivation and prionization of Swi1 protein in Saccharomyces cerevisiae. Biochemistry 2017, 82, 1147–1157. [Google Scholar] [CrossRef]
  44. Wach, A.; Brachat, A.; Pöhlmann, R.; Philippsen, P. New heterologous modules for classical or PCR-based gene disruptions in Saccharomyces cerevisiae. Yeast 1994, 10, 1793–1808. [Google Scholar] [CrossRef]
  45. Kaiser, C.; Michaelis, S.; Mitchell, A.; Cold Spring Harbor Laboratory. Methods in Yeast Genetics: A Cold Spring Harbor Laboratory Course Manual; Cold Spring Harbor Laboratory Press: Cold Spring Harbor, NY, USA, 1994; ISBN 0879694513. [Google Scholar]
  46. Zakharov, I.A.; Kozhin, S.A.; Kozhina, T.N.; Fedorova, I.V. Collected Methods in Genetics of the Yeast Saccharomyces; Nauka: Leningrad, Russia, 1984. [Google Scholar]
  47. Livak, K.J.; Schmittgen, T.D. Analysis of relative gene expression data using real-time quantitative PCR and the 2−ΔΔCT method. Methods 2001, 25, 402–408. [Google Scholar] [CrossRef]
  48. Bushnell, B. BBMap: A Fast, Accurate, Splice-Aware Aligner; Lawrence Berkeley National Lab. (LBNL): Berkeley, CA, USA, 2014. [Google Scholar]
  49. Andrews, S. FastQC: A quality control tool for high throughput sequence data. Babraham Bioinform. 2010. Available online: http://www.bioinformatics.babraham.ac.uk/projects/fastqc (accessed on 20 December 2018).
  50. Bray, N.L.; Pimentel, H.; Melsted, P.; Pachter, L. Near-optimal probabilistic RNA-seq quantification. Nat. Biotechnol. 2016, 34, 525–527. [Google Scholar] [CrossRef]
  51. Pimentel, H.; Bray, N.L.; Puente, S.; Melsted, P.; Pachter, L. Differential analysis of RNA-seq incorporating quantification uncertainty. Nat. Methods 2017, 14, 687–690. [Google Scholar] [CrossRef]
  52. Hochberg, B. Controlling the False Discovery Rate: A Practical and Powerful Approach to Multiple Testing. J. R. Stat. Soc. 1995, 57, 289–300. [Google Scholar] [CrossRef]
  53. Alexa, A.; Rahnenfuhrer, J. topGO: Enrichment Analysis for Gene Ontology; R Packag. Version 2.34.0; Bioconductor, 2018. [Google Scholar] [CrossRef]
  54. Saccharomyces Genome Database (Index of/Curation/Literature). Available online: https://downloads.yeastgenome.org/curation/literature/go_slim_mapping.tab (accessed on 20 December 2018).
  55. Zhang, J.D.; Wiemann, S. KEGGgraph: A graph approach to KEGG PATHWAY in R and bioconductor. Bioinformatics 2009, 25, 1470–1471. [Google Scholar] [CrossRef]
  56. Csárdi, G.; Nepusz, T. The igraph software package for complex network research. Inter. J. Complex Syst. 2014, 1695–1704. [Google Scholar]
  57. Yu, G.; Wang, L.-G.; Han, Y.; He, Q.-Y. clusterProfiler: An R Package for Comparing Biological Themes Among Gene Clusters. Omics J. Integr. Biol. 2012, 16, 284–287. [Google Scholar] [CrossRef]
  58. Ginestet, C. ggplot2: Elegant Graphics for Data Analysis. J. R. Stat. Soc. Ser. A Stat. Soc. 2011, 174, 245–246. [Google Scholar] [CrossRef]
  59. Luo, W.; Brouwer, C. Pathview: An R/Bioconductor package for pathway-based data integration and visualization. Bioinformatics 2013, 29, 1830–1831. [Google Scholar] [CrossRef]
  60. Venema, J.; Tollervey, D. Ribosome Synthesis in Saccharomyces cerevisiae. Annu. Rev. Genet. 1999, 33, 261–311. [Google Scholar] [CrossRef]
  61. Giaever, G.; Chu, A.M.; Ni, L.; Connelly, C.; Riles, L.; Véronneau, S.; Dow, S.; Lucau-Danila, A.; Anderson, K.; André, B.; et al. Functional profiling of the Saccharomyces cerevisiae genome. Nature 2002, 418, 387–391. [Google Scholar] [CrossRef]
  62. Castrillo, J.I.; Zeef, L.A.; Hoyle, D.C.; Zhang, N.; Hayes, A.; Gardner, D.C.J.; Cornell, M.J.; Petty, J.; Hakes, L.; Wardleworth, L.; et al. Growth control of the eukaryote cell: A systems biology study in yeast. J. Biol. 2007, 6, 4. [Google Scholar] [CrossRef]
  63. Prokhorova, I.; Altman, R.B.; Djumagulov, M.; Shrestha, J.P.; Urzhumtsev, A.; Ferguson, A.; Chang, C.-W.T.; Yusupov, M.; Blanchard, S.C.; Yusupova, G. Aminoglycoside interactions and impacts on the eukaryotic ribosome. Proc. Natl. Acad. Sci. USA 2017, 114, E10899–E10908. [Google Scholar] [CrossRef]
  64. Dror, V.; Winston, F. The Swi/Snf Chromatin Remodeling Complex Is Required for Ribosomal DNA and Telomeric Silencing in Saccharomyces cerevisiae. Mol. Cell. Biol. 2004, 24, 8227–8235. [Google Scholar] [CrossRef]
  65. Venkataramanan, S.; Douglass, S.; Galivanche, A.R.; Johnson, T.L. The chromatin remodeling complex Swi/Snf regulates splicing of meiotic transcripts in Saccharomyces cerevisiae. Nucleic Acids Res. 2017. [Google Scholar] [CrossRef]
  66. Brownlee, P.M.; Meisenberg, C.; Downs, J.A. The SWI/SNF chromatin remodelling complex: Its role in maintaining genome stability and preventing tumourigenesis. DNA Repair (Amst.) 2015, 32, 127–133. [Google Scholar] [CrossRef]
  67. Chan, P.H.W.; Lee, L.; Kim, E.; Hui, T.; Stoynov, N.; Nassar, R.; Moksa, M.; Cameron, D.M.; Hirst, M.; Gsponer, J.; et al. The [PSI+] yeast prion does not wildly affect proteome composition whereas selective pressure exerted on [PSI+] cells can promote aneuploidy. Sci. Rep. 2017, 7, 8442. [Google Scholar] [CrossRef]
  68. Cox, B. Psi, a cytoplasmic supperssor of supersuppressors in yeast. Heredity 1965, 20, 505–521. [Google Scholar] [CrossRef]
  69. Drozdova, P.; Mironova, L.; Zhouravleva, G. Haploid yeast cells undergo a reversible phenotypic switch associated with chromosome II copy number. BMC Genet. 2016, 17, 152. [Google Scholar] [CrossRef]
  70. Zadorsky, S.P.; Sopova, Y.V.; Andreichuk, D.Y.; Startsev, V.A.; Medvedeva, V.P.; Inge-Vechtomov, S.G. Chromosome VIII disomy influences the nonsense suppression efficiency and transition metal tolerance of the yeast Saccharomyces cerevisiae. Yeast 2015, 32, 479–497. [Google Scholar] [CrossRef]
  71. Oromendia, A.B.; Dodgson, S.E.; Amon, A. Aneuploidy causes proteotoxic stress in yeast. Genes Dev. 2012, 26, 2696–2708. [Google Scholar] [CrossRef]
  72. Reddy Pannala, V.; Jayadeva Bhat, P.; Bhartiya, S.; Venkatesh, K.V. Systems biology of GAL regulon in Saccharomyces cerevisiae. Wiley Interdiscip. Rev. Syst. Biol. Med. 2010, 2, 98–106. [Google Scholar] [CrossRef]
  73. Timson, D.J. Galactose Metabolism in Saccharomyces cerevisiae. Dyn. Biochem. Process Biotechnol. Mol. Biol. 2007, 1, 63–73. [Google Scholar] [CrossRef]
  74. Holden, H.M.; Rayment, I.; Thoden, J.B. Structure and Function of Enzymes of the Leloir Pathway for Galactose Metabolism. J. Biol. Chem. 2003, 278, 43885–43888. [Google Scholar] [CrossRef]
  75. Proft, M.; Struhl, K. Hog1 kinase converts the Sko1-Cyc8-Tup1 repressor complex into an activator that recruits SAGA and SWI/SNF in response to osmotic stress. Mol. Cell 2002, 9, 1307–1317. [Google Scholar] [CrossRef]
  76. Baccarini, L.; Martínez-Montañés, F.; Rossi, S.; Proft, M.; Portela, P. PKA-chromatin association at stress responsive target genes from Saccharomyces cerevisiae. Biochim. Biophys. Acta Gene Regul. Mech. 2015, 1849, 1329–1339. [Google Scholar] [CrossRef] [PubMed]
  77. Nemet, J.; Vidan, N.; Sopta, M. A meta-analysis reveals complex regulatory properties at Taf14-repressed genes. BMC Genom. 2017, 18, 175. [Google Scholar] [CrossRef] [PubMed]
  78. Tordella, L.; Khan, S.; Hohmeyer, A.; Banito, A.; Klotz, S.; Raguz, S.; Martin, N.; Dhamarlingam, G.; Carroll, T.; González Meljem, J.M.; et al. SWI/SNF regulates a transcriptional program that induces senescence to prevent liver cancer. Genes Dev. 2016, 30, 2187–2198. [Google Scholar] [CrossRef] [PubMed]
  79. Karpichev, I.V.; Small, G.M. Global Regulatory Functions of Oaf1p and Pip2p (Oaf2p), Transcription Factors That Regulate Genes Encoding Peroxisomal Proteins in Saccharomyces cerevisiae. Mol. Cell. Biol. 2015, 18, 6560–6570. [Google Scholar] [CrossRef]
  80. Smith, J.J.; Miller, L.R.; Kreisberg, R.; Vazquez, L.; Wan, Y.; Aitchison, J.D. Environment-responsive transcription factors bind subtelomeric elements and regulate gene silencing. Mol. Syst. Biol. 2011, 7, 455. [Google Scholar] [CrossRef]
Sample Availability: Raw Illumina reads for 24 samples in total are stored in NIH NCBI SRA under accession numbers SRR8552466 through SRR8552482. The SRA repository also refers to BioProject accession PRJNA521274 and BioSamples accessions SAMN10882201, SAMN10882202 and SAMN10882203, respectively.
Figure 1. Volcano plots demonstrating differentially expressed genes in the swi1Δ and [SWI+] compared with [swi] strains. Plotted on the x-axis is the ln fold difference between [swi] and the corresponding strain. Plotted on the y-axis is the −log10(q-value) calculated with R package Sleuth [51]. Genes whose expression changes are nonsignificant are shown in gray below the red line, while significant differentially expressed genes (FDR < 0.001) are divided into categories, as follows. On the plot comparing swi1Δ to [swi], green indicates genes significantly downregulated in [SWI+], purple represents genes significantly upregulated in [SWI+], and pink signifies genes which are nonsignificant in the comparison of [SWI+] to [swi]. On the plot of [SWI+] to [swi], genes downregulated in swi1Δ are shown blue, those upregulated in swi1Δ are red, and those which are nonsignificant in the comparison of swi1Δ to [swi] are yellow.
Genes 10 00212 g001
Figure 2. Distribution of differentially expressed genes along the chromosomes. Plotted on the y-axis is the ln fold difference between the swi1Δ or [SWI+] and [swi] strains. Plotted on the x-axis are genomic coordinates. Vertical dashed lines denote the borders of chromosomes with the length of chromosomes shown on the x-axis and the name of chromosomes shown in the upper part of the plot. Red dots denote the significant (FDR < 0.001) changes in the swi1Δ and blue dots denote the significant changes in the [SWI+] strains. Grey dots denote nonsignificant changes in all strains. Lines connecting changes in the same genes, are (i) grey when changes in both swi1Δ and [SWI+] strains are nonsignificant, (ii) blue when change is significant in only one strain (swi1Δ or [SWI+]), (iii) green when a gene is up- or downregulated in both swi1Δ and [SWI+] strains, and (iv) red when a gene is upregulated in one strain and downregulated in another.
Genes 10 00212 g002
Figure 3. qPCR verification of the Chromosome I disomy in the swi1Δ strain and analysis of its stability and elimination. (A) Comparative qPCR analysis of the ADE1, BUD14, and CDC24 genes copy number in the [SWI+], [swi], and swi1Δ strains is shown. (B) Analysis of the stability of the Chromosome I disomy in the swi1Δ strain (ADE1 was used as the marker of the chromosome I copy number). (C) The effects of the SWI1 expression in the swi1Δ strain on the Chromosome I copy number (ADE1 was used as the copy number marker). In all experiments, qPCR was performed using genomic DNA of the corresponding strain as the template and primers and probes listed in the Table S1. Yeast cells were grown on the complete media at 30 °C for the indicated time. The ACT1 gene was used as a control. The results are shown as the 2−ΔΔCt ± the standard deviation. The means of the 2−ΔΔCt in the control samples or at the initial points of the experiments were set as 1. Five biological repeats were obtained for each experiment. The significance of the differences observed was analyzed with the nonparametric Kruskal-Wallis test. Asterisk indicates p ≤ 0.01.
Genes 10 00212 g003
Figure 4. Graph of over-represented terms from Biological Process (BP) Gene Ontology. Several internal nodes and reticular edges were deleted to improve representativeness. For a full resolution image, see Figure S1.
Genes 10 00212 g004
Figure 5. Graph of over-represented terms from Cellular Component (CC) Gene Ontology. Several internal nodes and reticular edges were deleted to improve representativeness. For a full resolution image, see Figure S2.
Genes 10 00212 g005
Figure 6. Graph of over-represented terms from Molecular Function (MF) Gene Ontology. For a full resolution image, see Figure S3.
Genes 10 00212 g006
Figure 7. Over-represented KEGG Pathway term found in this work. Dot size represents the enrichment ratio, and color gradient depicts the experimental q-value in the respective assay. Pathways are sorted in descendant order based on the total enrichment ratio in all three categories.
Genes 10 00212 g007
Figure 8. Nonsense suppression and mechanisms of its development in the [SWI+] and swi1Δ strains. (A) Deletion of SWI1 causes omnipotent nonsense suppression, even in the presence of wild type SUP35, while the addition of aminoglycoside antibiotic paromomycin leads to nonsense suppression in both the [SWI+] and swi1Δ strains. Images of –Ade and –Trp plates were obtained after five days of incubation at 30 °C. Images of MD plates with glucose (Glu) and galactose (Gal) as the sole carbon sources were taken after 24 h of incubation at 30 °C (before this, Gal plate was three times replica plated with duration of passages in 24 h). (B) Scheme illustrating molecular mechanisms of the nonsense suppression in the [SWI+] and swi1Δ strains (for details, see Discussion).
Genes 10 00212 g008
Table 1. Transcriptomic effects of the [SWI+] prion and SWI1 deletion on the media with galactose as the sole carbon source.
Changes in Gene ExpressionComparison
[SWI+] to [swi]swi1Δ to [swi]swiΔ to [SWI+]
Upregulated40822409
Downregulated1191156730
Total15919781139
Table 2. Similarities and differences between the effects of the [SWI+] prion and the swi1 deletion.
Effect or PhenotypeManifestation in the Strain ContainingConditionReference
[SWI+] PrionSWI1 Deletion
Decreased vegetative growth++Media with galactose, glycerol or raffinose as carbon source and Antimycin-A[7]
Nonsense suppression in the presence of mutant SUP35 (eRF3) variants++Media without adenine; in the presence of mutant eRF3 variants with decreased functional activity[35,37,40,42]
Decreased vegetative growth++Media with galactose or glycerol as carbon source[35]
Loss of flocculation++Stationary-phase cultures[36]
Loss of invasiveness++Complete media, 6 days of incubation[36]
Abolished pseudohyphal growth++SLAD media containing 4% glucose[36]
Repression of the FLO1 and FLO11 expression++Complete media with glucose as carbon source[36]
Increased expression of the ADE1 gene-+Complete media[43]
Chromosome I disomy -+Complete mediaThis study
Inhibition of the ribosome biogenesis and translation-+Complete media with galactose as carbon sourceThis study
Omnipotent nonsense suppression in the presence of wild-type SUP35 (eRF3)-+Media without adenine or tryptophan; in the presence of the wild-type eRF3This study
Decreased expression of the SUP45 (eRF1) gene+-Complete media with glucose as carbon source[41,42]
Aggregation of the Mss11, Sap30, Gts1 and Msn1 transcriptional regulators+-Overproduction of the YFP-fused proteins under the GAL1 promoter[36]

