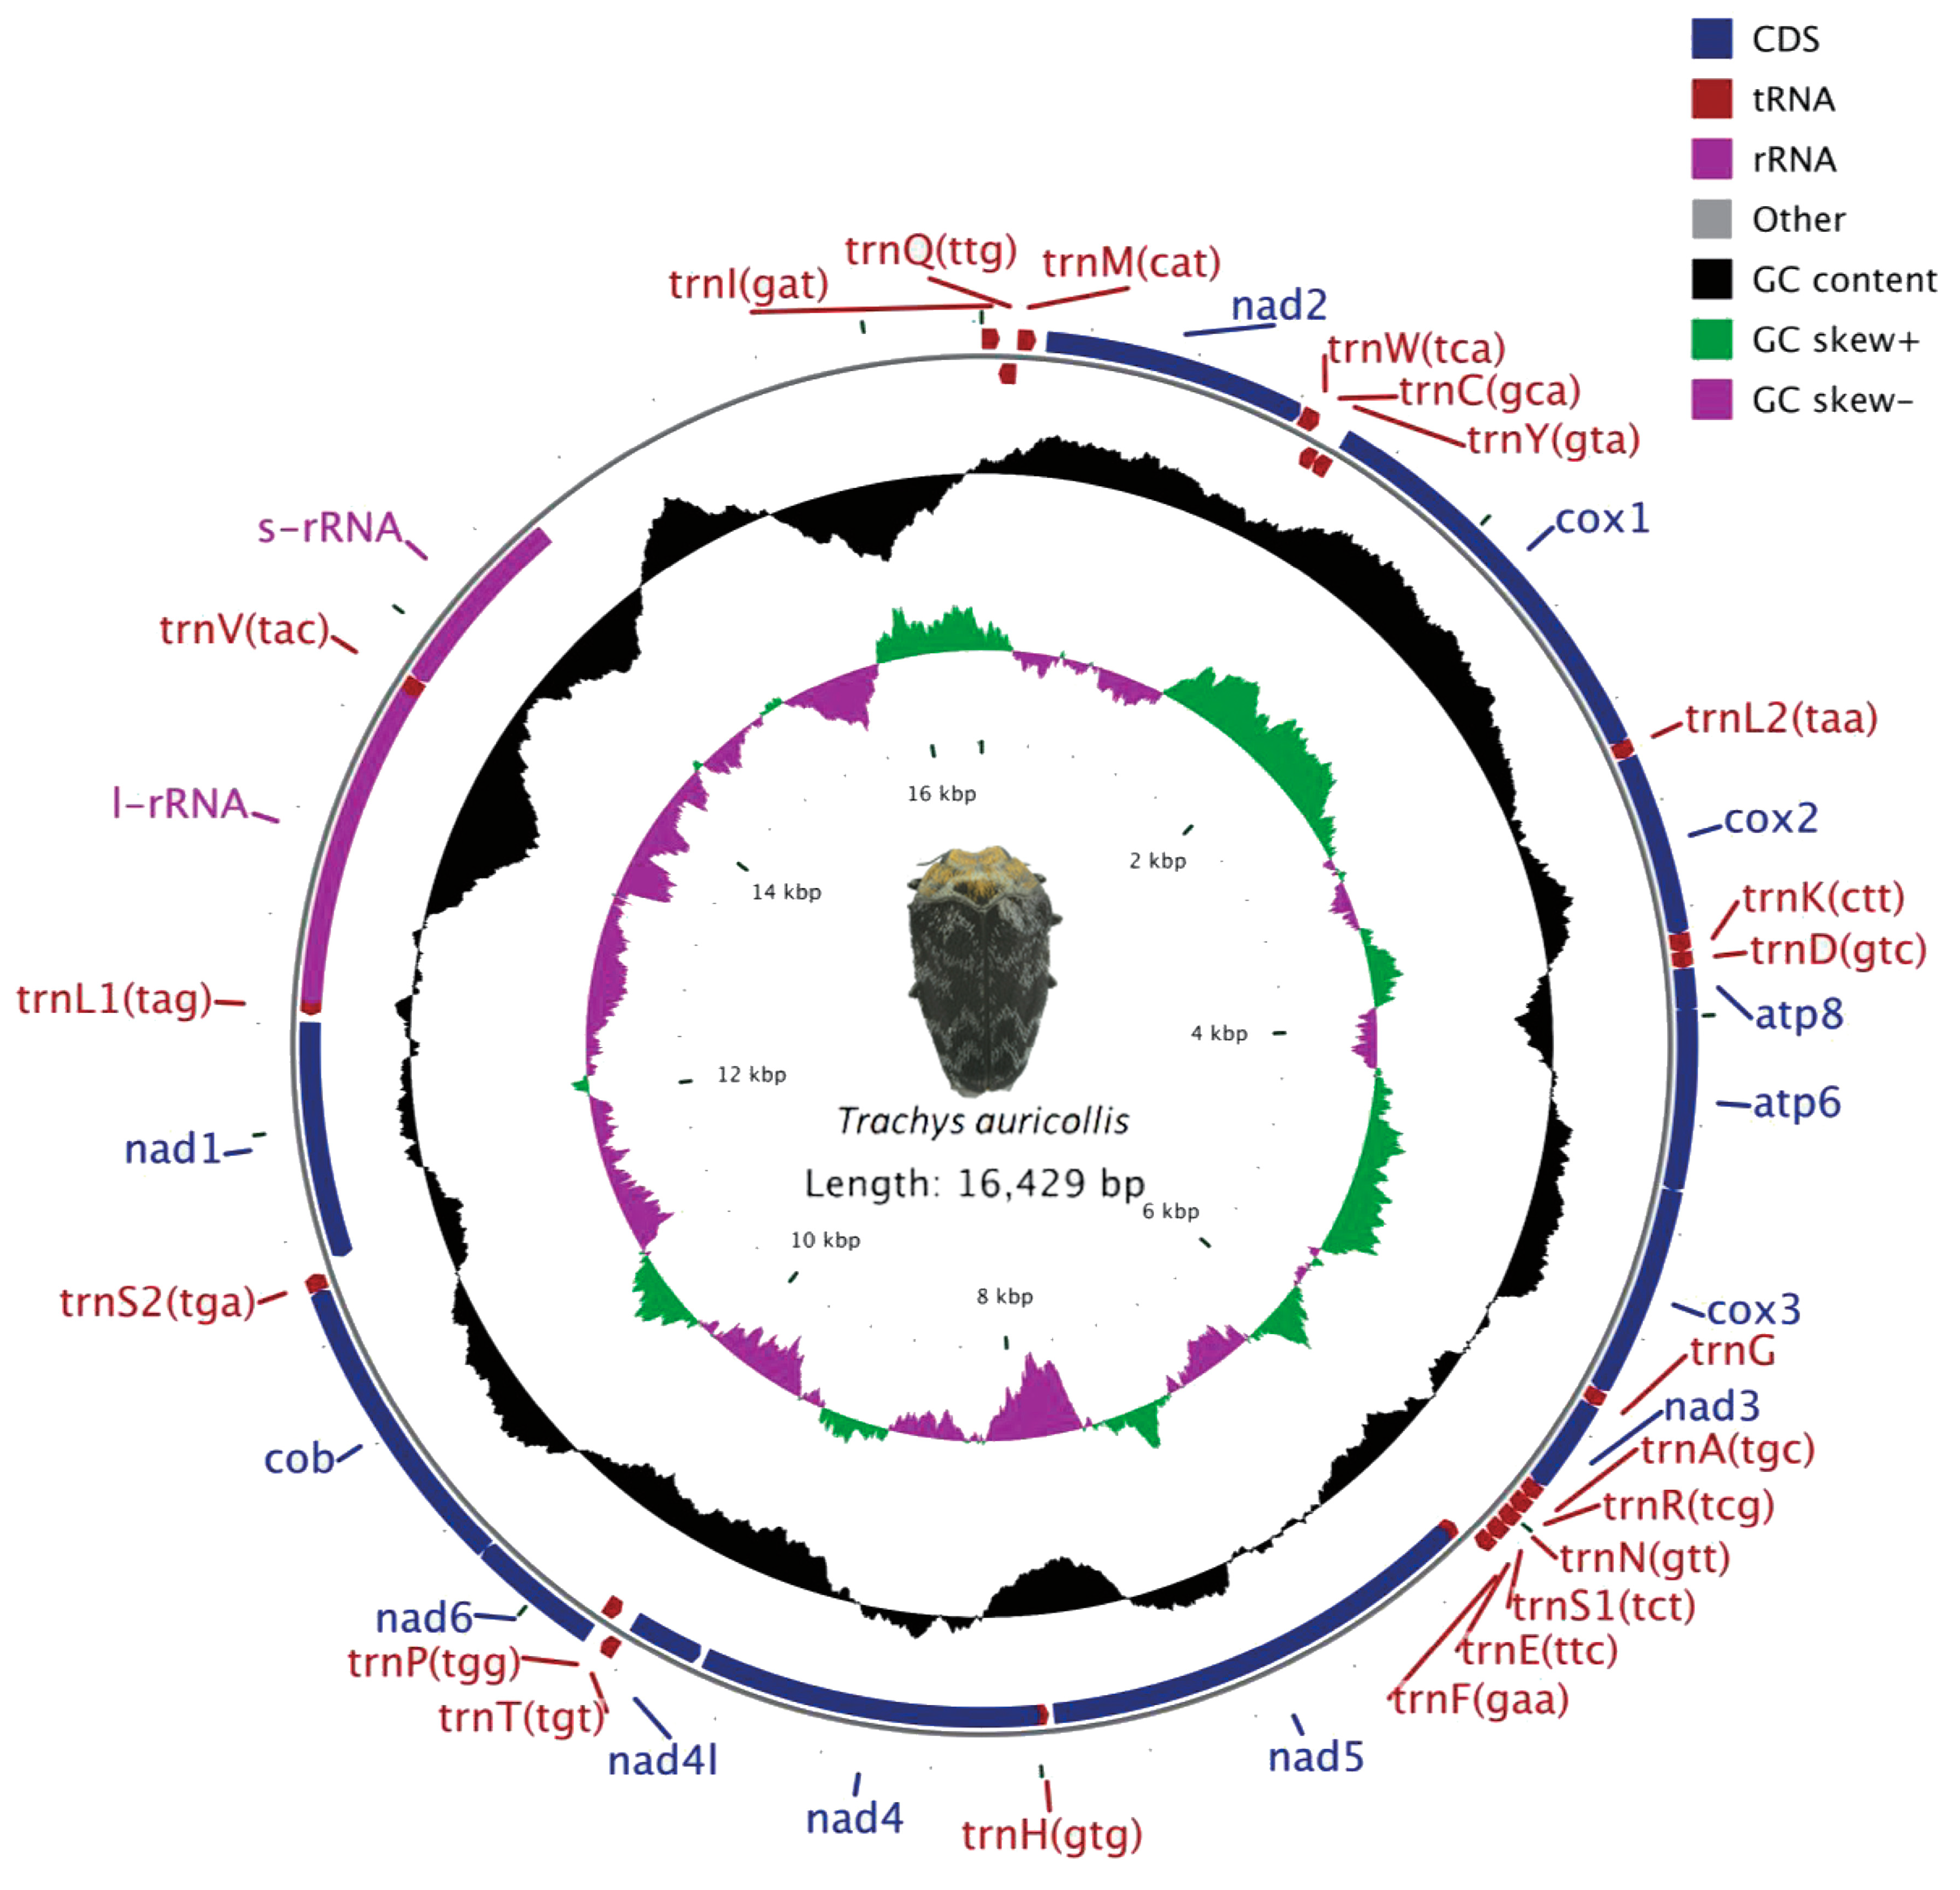
Complete Mitogenome of a Leaf-Mining Buprestid Beetle, Trachys auricollis, and Its Phylogenetic Implications

 and
and
Abstract
1. Introduction
2. Materials and Methods
2.1. Sampling and DNA Extraction
2.2. Genome Sequencing and Analyses
2.3. Phylogenetic Analyses
3. Results and Discussion
3.1. Genome Organization and Base Composition
3.2. Protein-Coding Genes
3.3. Codon Usage
3.4. Transfer RNAs
3.5. Ribosomal RNAs
3.6. A + T-Rich Region
3.7. Intergenic Spacer and Overlapping Regions
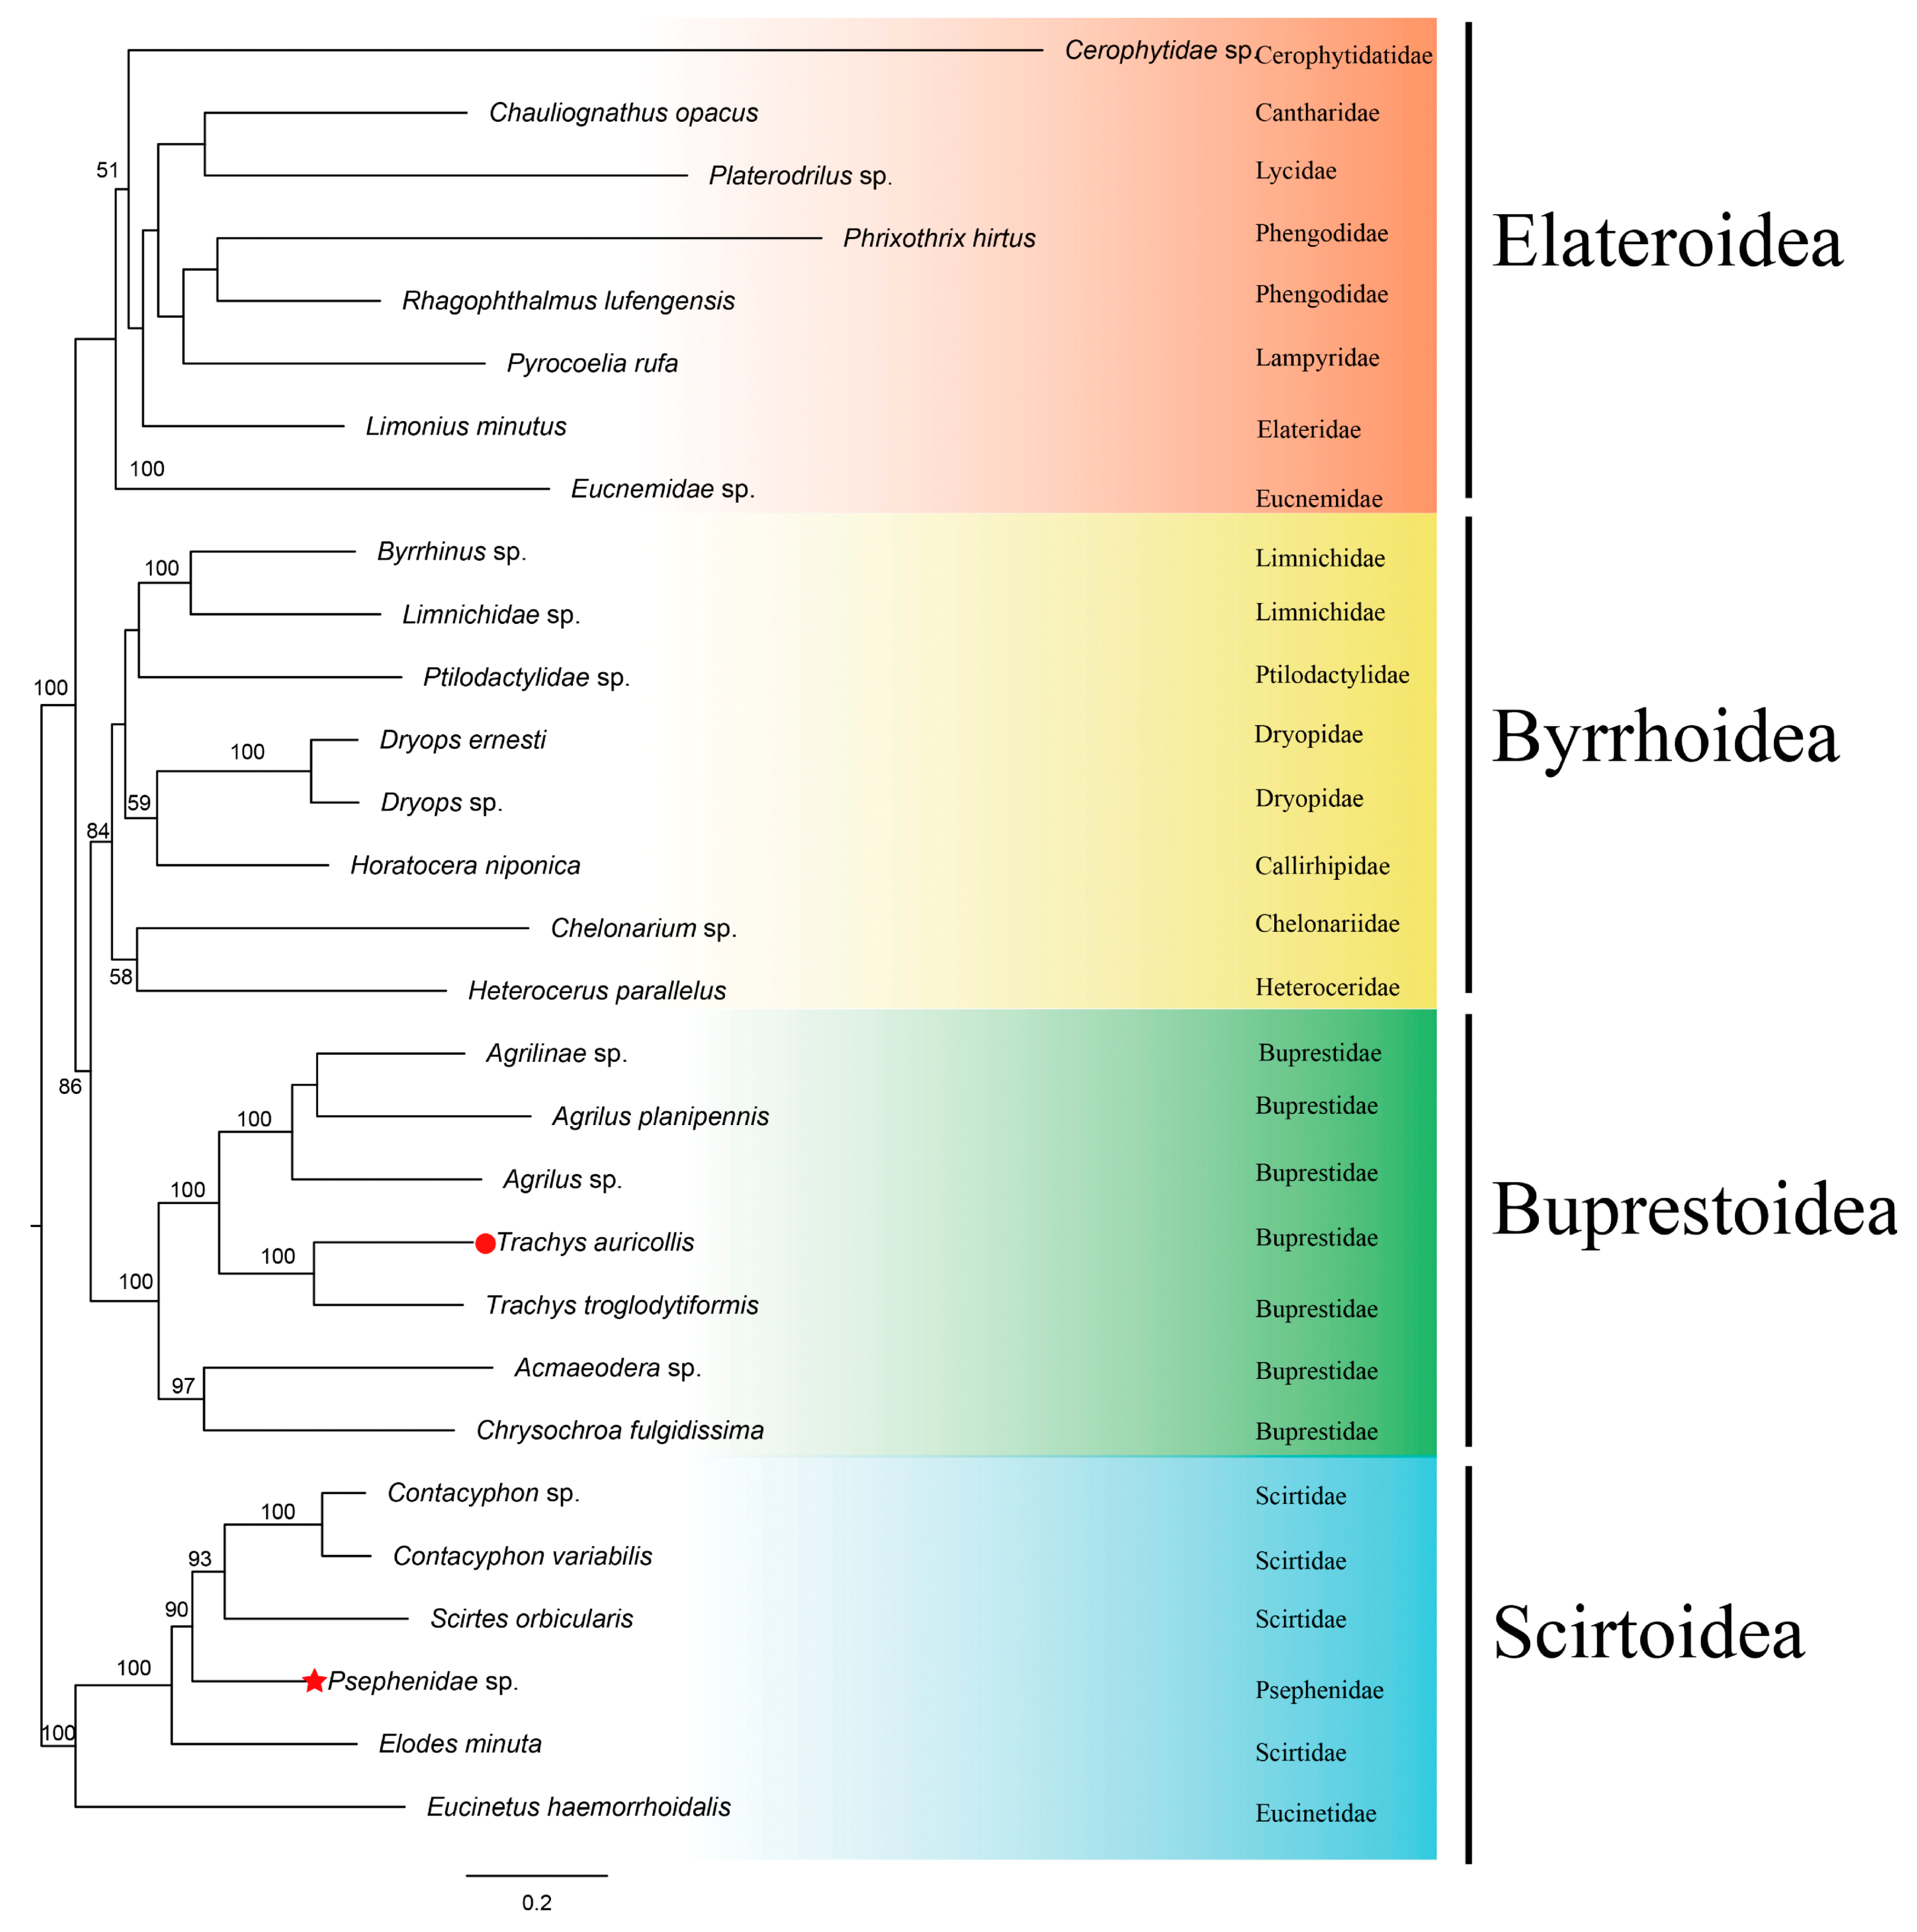
3.8. Phylogenetic Analyses
4. Conclusions
Supplementary Materials
Author Contributions
Funding
Acknowledgments
Conflicts of Interest
References
- Evans, A.M.; Mckenna, D.D.; Bellamy, C.L.; Farrell, B.D. Large-scale molecular phylogeny of metallic wood-boring beetles (Coleoptera: Buprestoidea) provides new insights into relationships and reveals multiple evolutionary origins of the larval leaf-mining habit. Syst. Entomol. 2015, 40, 385–400. [Google Scholar] [CrossRef]
- Pan, X.; Chang, H.; Ren, D.; Shih, C. The first fossil buprestids from the Middle Jurassic Jiulongshan Formation of China (Coleoptera: Buprestidae). Zootaxa 2011, 2745, 53–62. [Google Scholar] [CrossRef]
- Bellamy, C.L. A World Catalogue and Bibliography of the Jewel Beetles (Coleoptera: Buprestoidea); Pensoft Publishers: Sofia-Moscow, Russia, 2008. [Google Scholar]
- NCBI Resource Coordinators. Database resources of the National Center for Biotechnology Information. Nucl. Acids Res. 2018, 35, 5–12. [Google Scholar] [CrossRef]
- Ross, H.; Arnet, J.; Thomas, M.C.; Skelley, P.E.; Frank, H.J. American Beetles, Volume II: Polyphaga: Scarabaeoidea through Curculionoidea; CRC Press: Boca Raton, FL, USA, 2002; p. 861. [Google Scholar]
- Hering, E.M. Biology of the Leaf Miners; Dr. W. Junk: The Hague, The Netherlands, 1951; p. 420. [Google Scholar]
- Akiyama, K.; Omomo, S. The Buprestid Beetles of the World; Gekkan-Mushi: Tokyo, Japan, 2000; p. 330. [Google Scholar]
- Xiao, L.; Dai, X.; Wang, J. Research progress on leaf-mining jewel beetles. North. Hortic. 2017, 15, 162–167. [Google Scholar] [CrossRef]
- Imai, K.; Miura, K.; Iida, H.; Reardon, R.; Fujisaki, K. Herbivorous insect fauna of Kudzu, Pueraria montana (Leguminosae), in Japan. Fla. Entomol. 2010, 93, 454–456. [Google Scholar]
- Forseth, I.N.; Innis, A.F. Kudzu (Pueraria montana): History, physiology, and ecology combine to make a major ecosystem threat. Crit. Rev. Plant Sci. 2004, 23, 401–413. [Google Scholar] [CrossRef]
- Beutel, R.G.; Leschen, R.A.B. Coleoptera, Beetles. Volume 1: Morphology and Systematics; De Gruyter: Berlin, Germany, 2016; p. 812. [Google Scholar]
- Lawrence, J.F.; Ślipiński, A.; Seago, A.E.; Thayer, M.K.; Newton, A.F.; Marvaldi, A.E. Phylogeny of the Coleoptera based on morphological characters of adults and larvae. Ann. Zool. 2011, 61, 1–217. [Google Scholar] [CrossRef]
- Xu, H. Study on Systematics of Coraebini from China (Coleoptera: Buprestoidea: Agrilinae); University of Chinese Academy of Sciences: Beijing, China, 2013. [Google Scholar]
- Lawrence, J.F. Families and sub-families of Coleoptera (with selected genera, notes, references and data on family-group names). In Biology, Phylogeny, and Classification of Coleoptera. Papers Celebrating the 80th Birthday of Roy A. Crowson; Muzeum i Instytut Zoologii PAN: Warszawa, Poland, 1995; pp. 779–1083. [Google Scholar]
- Nelson, G.; Bellamy, C. A revision and phylogenetic re-evaluation of the family Schizopodidae (Coleoptera, Buprestoidea). J. Nat. Hist. 1991, 25, 985–1026. [Google Scholar] [CrossRef]
- McKenna, D.D.; Wild, A.L.; Kanda, K.; Bellamy, C.L.; Beutel, R.G.; Caterino, M.S.; Farnum, C.W.; Hawks, D.C.; Ivie, M.A.; Jameson, M.L.; et al. The beetle tree of life reveals that Coleoptera survived end-Permian mass extinction to diversify during the Cretaceous terrestrial revolution. Syst. Entomol. 2015, 40, 835–880. [Google Scholar] [CrossRef]
- Zhang, S.; Che, L.; Li, Y.; Liang, D.; Pang, H.; Ślipiński, A.; Zhang, P. Evolutionary history of Coleoptera revealed by extensive sampling of genes and species. Nat. Commun. 2018, 9, 1–11. [Google Scholar] [CrossRef]
- Hunt, T.; Bergsten, J.; Levkanicova, Z.; Papadopoulou, A.; John, O.S.; Wild, R.; Hammond, P.M.; Ahrens, D.; Balke, M.; Caterino, M.S.; et al. A comprehensive phylogeny of beetles reveals the evolutionary origins of a superradiation. Science 2007, 318, 1913–1916. [Google Scholar] [CrossRef]
- Crowson, R. On the dryopoid affinities of Buprestidae. Coleopt. Bull. 1982, 36, 22–25. [Google Scholar]
- Bouchard, P.; Bousquet, Y.; Davies, A.; Alonso-Zarazaga, M.; Lawrence, J.; Lyal, C.; Newton, A.; Reid, C.; Schmitt, M.; Slipinski, A.; et al. Family-group names in Coleoptera (Insecta). ZooKeys 2011, 88, 1–972. [Google Scholar] [CrossRef]
- Lawrence, J.F. Rhinorhipidae, a new beetle family from Australia, with comments on the phylogeny of the Elateriformia. Invertebr. Syst. 1988, 2, 1–53. [Google Scholar] [CrossRef]
- Costa, C.; Vanin, S.A.; Ide, S. Systematics and bionomics of Cneoglossidae with a cladistic analysis of Byrrhoidea. Arq. Zool. 1999, 35, 231–300. [Google Scholar] [CrossRef][Green Version]
- Cao, L.; Wang, X. The complete mitochondrial genome of the jewel beetle Trachys variolaris (Coleoptera: Buprestidae). Mitochondrial DNA Part B 2019, 4, 3042–3043. [Google Scholar] [CrossRef]
- Cao, L.; Wang, X. The complete mitochondrial genome of the jewel beetle Coraebus cavifrons (Coleoptera: Buprestidae). Mitochondrial DNA Part B 2019, 4, 2407–2408. [Google Scholar] [CrossRef]
- Duan, J.; Quan, G.; Mittapalli, O.; Cusson, M.; Krell, P.J.; Doucet, D. The complete mitogenome of the Emerald Ash Borer (EAB), Agrilus planipennis (Insecta: Coleoptera: Buprestidae). Mitochondrial DNA Part B 2017, 2, 134–135. [Google Scholar] [CrossRef]
- Timmermans, M.J.; Vogler, A.P. Phylogenetically informative rearrangements in mitochondrial genomes of Coleoptera, and monophyly of aquatic elateriform beetle (Dryopoidea). Mol. Phylogenet. Evol. 2012, 63, 299–304. [Google Scholar] [CrossRef]
- Bocakova, M.; Bocak, L.; Hunt, T.; Teraväinen, M.; Vogler, A.P. Molecular phylogenetics of Elateriformia (Coleoptera): Evolution of bioluminescence and neoteny. Cladistics 2007, 23, 477–496. [Google Scholar] [CrossRef]
- Bocak, L.; Barton, C.; Crampton-Platt, A.; Chesters, D.; Ahrens, D.; Vogler, A.P. Building the Coleoptera tree-of-life for >8000 species: Composition of public DNA data and fit with Linnaean classification. Syst. Entomol. 2014, 39, 97–110. [Google Scholar] [CrossRef]
- Kusy, D.; Motyka, M.; Andújar, C.; Bocek, M. Genome sequencing of Rhinorhipus Lawrence exposes an early branch of the Coleoptera. Front. Zool. 2018, 15, 1–25. [Google Scholar] [CrossRef]
- Kundrata, R.; Jäch, M.A.; Bocak, L. Molecular phylogeny of the Byrrhoidea–Buprestoidea complex (Coleoptera: Elateriformia). Zool. Scr. 2017, 46, 1–15. [Google Scholar] [CrossRef]
- Crampton-Platt, A.; Timmermans, M.J.; Gimmel, M.L.; Kutty, S.N.; Cockerill, T.D.; Vun Khen, C.; Vogler, A.P. Soup to tree: The phylogeny of beetles inferred by mitochondrial metagenomics of a Bornean rainforest sample. Mol. Biol. Evol. 2015, 32, 2302–2316. [Google Scholar] [CrossRef]
- Yang, F.; Du, Y.; Cao, J.; Huang, F. Analysis of three leafminers’ complete mitochondrial genomes. Gene 2013, 529, 1–6. [Google Scholar] [CrossRef]
- Chen, Z.; Du, Y. First mitochondrial genome from Nemouridae (Plecoptera) reveals novel features of the elongated control region and phylogenetic implications. Int. J. Mol. Sci. 2017, 18, 996. [Google Scholar] [CrossRef]
- Amaral, D.T.; Mitani, Y.; Ohmiya, Y.; Viviani, V.R. Organization and comparative analysis of the mitochondrial genomes of bioluminescent Elateroidea (Coleoptera: Polyphaga). Gene 2016, 586, 254–262. [Google Scholar] [CrossRef]
- Li, X.; Ogoh, K.; Ohba, N.; Liang, X.; Ohmiya, Y. Mitochondrial genomes of two luminous beetles, Rhagophthalmus lufengensis and R. ohbai (Arthropoda, Insecta, Coleoptera). Gene 2007, 392, 196–205. [Google Scholar] [CrossRef]
- Arnoldi, F.G.; Ogoh, K.; Ohmiya, Y.; Viviani, V.R. Mitochondrial genome sequence of the Brazilian luminescent click beetle Pyrophorus divergens (Coleoptera: Elateridae): Mitochondrial genes utility to investigate the evolutionary history of Coleoptera and its bioluminescence. Gene 2007, 405, 1–9. [Google Scholar] [CrossRef]
- Boore, J.L. Animal mitochondrial genomes. Nucl. Acids Res. 1999, 27, 1767–1780. [Google Scholar] [CrossRef]
- Hong, M.Y.; Jeong, H.C.; Kim, M.J.; Jeong, H.U.; Lee, S.H.; Kim, I. Complete mitogenome sequence of the jewel beetle, Chrysochroa fulgidissima (Coleoptera: Buprestidae). Mitochondrial DNA 2009, 20, 46–60. [Google Scholar] [CrossRef]
- Li, W.; Wang, Z.; Che, Y. The complete mitogenome of the wood-feeding Cockroach Cryptocercus meridianus (Blattodea: Cryptocercidae) and its phylogenetic relationship among Cockroach families. Int. J. Mol. Sci. 2017, 18, 2397. [Google Scholar] [CrossRef]
- Du, C.; He, S.; Song, X.; Liao, Q.; Zhang, X.; Yue, B. The complete mitochondrial genome of Epicauta chinensis (Coleoptera: Meloidae) and phylogenetic analysis among Coleopteran insects. Gene 2016, 578, 274–280. [Google Scholar] [CrossRef]
- Guo, Q.; Xu, J.; Liao, C.; Dai, X.; Jiang, X. Complete mitochondrial genome of a leaf-mining beetle, Agonita chinensis Weise (Coleoptera: Chrysomelidae). Mitochondrial DNA Part B 2017, 2, 532–533. [Google Scholar] [CrossRef]
- Kim, H.; Lee, S. A molecular phylogeny of the tribe Aphidini (Insecta: Hemiptera: Aphididae) based on the mitochondrial tRNA/COII, 12S/16S and the nuclear EF1α genes. Syst. Entomol. 2008, 33, 711–721. [Google Scholar] [CrossRef]
- Yang, X.; Cameron, S.L.; Lees, D.C.; Xue, D.; Han, H. A mitochondrial genome phylogeny of owlet moths (Lepidoptera: Noctuoidea), and examination of the utility of mitochondrial genomes for lepidopteran phylogenetics. Mol. Phylogenet. Evol. 2015, 85, 230–237. [Google Scholar] [CrossRef]
- Widmann, J.; Harris, J.K.; Lozupone, C.; Wolfson, A.; Knight, R. Stable tRNA-based phylogenies using only 76 nucleotides. RNA 2010, 16, 1469–1477. [Google Scholar] [CrossRef][Green Version]
- Kumazawa, Y.; Nishida, M. Sequence evolution of mitochondrial tRNA genes and deep-branch animal phylogenetics. J. Mol. Evol. 1993, 37, 380–398. [Google Scholar] [CrossRef]
- Kumazawa, Y.; Nishida, M. Variations in mitochondrial tRNA gene organization of reptiles as phylogenetic markers. Mol. Biol. Evol. 1995, 12, 759–772. [Google Scholar]
- Cameron, S.L.; Lambkin, C.L.; Barker, S.C.; Whiting, M.F. A mitochondrial genome phylogeny of Diptera: Whole genome sequence data accurately resolve relationships over broad timescales with high precision. Syst. Entomol. 2007, 32, 40–59. [Google Scholar] [CrossRef]
- Cameron, S.L.; Sullivan, J.; Song, H.; Miller, K.B.; Whiting, M.F. A mitochondrial genome phylogeny of the Neuropterida (lace-wings, alderflies and snakeflies) and their relationship to the other holometabolous insect orders. Zool. Scr. 2009, 38, 575–590. [Google Scholar] [CrossRef]
- Fenn, J.D.; Song, H.; Cameron, S.L.; Whiting, M.F. A preliminary mitochondrial genome phylogeny of Orthoptera (Insecta) and approaches to maximizing phylogenetic signal found within mitochondrial genome data. Mol. Phylogenet. Evol. 2008, 49, 59–68. [Google Scholar] [CrossRef] [PubMed]
- Coil, D.; Jospin, G.; Darling, A.E. A5-miseq: An updated pipeline to assemble microbial genomes from Illumina MiSeq data. Genomics 2014, 31, 587–589. [Google Scholar] [CrossRef] [PubMed]
- Bankevich, A.; Nurk, S.; Antipov, D.; Gurevich, A.A.; Dvorkin, M.; Kulikov, A.S.; Lesin, V.M.; Nikolenko, S.I.; Pham, S.; Prjibelski, A.D.; et al. SPAdes: A new genome assembly algorithm and its applications to single-cell sequencing. J. Comput. Biol. 2012, 19, 455–477. [Google Scholar] [CrossRef]
- Kurtz, S.; Phillippy, A.; Delcher, A.L.; Smoot, M.; Shumway, M.; Antonescu, C.; Salzberg, S.L. Versatile and open software for comparing large genomes. Genome Biol. 2004, 5, R12. [Google Scholar] [CrossRef]
- Walker, B.J.; Abeel, T.; Shea, T.; Priest, M.; Abouelliel, A.; Sakthikumar, S.; Cuomo, C.A.; Zeng, Q.; Wortman, J.; Young, S.K.; et al. Pilon: An integrated tool for comprehensive microbial variant detection and genome assembly improvement. PLoS ONE 2014, 9, e112963. [Google Scholar] [CrossRef]
- Kearse, M.; Moir, R.; Wilson, A. Geneious basic. Bioinformatics 2012, 28, 1647–1649. [Google Scholar] [CrossRef]
- Kumar, S.; Stecher, G.; Tamura, K. MEGA7: Molecular evolutionary genetics analysis version 7.0 for bigger datasets. Mol. Biol. Evol. 2016, 33, 1870–1874. [Google Scholar] [CrossRef]
- Bernt, M.; Merkle, D.; Ramsch, K.; Fritzsch, G.; Perseke, M.; Bernhard, D.; Schlegel, M.; Stadler, P.F.; Middendorf, M. CREx: Inferring genomic rearrangements based on common intervals. Bioinformatics 2007, 23, 2957–2958. [Google Scholar] [CrossRef]
- Zhang, D.; Gao, F.; Li, W.X.; Jakovlić, I.; Zou, H.; Zhang, J.; Wang, G.T. PhyloSuite: An integrated and scalable desktop platform for streamlined molecular sequence data management and evolutionary phylogenetics studies. Mol. Ecol. Resour. 2018, 489088. [Google Scholar] [CrossRef]
- Katoh, K.; Standley, D.M. MAFFT multiple sequence alignment software version 7: Improvements in performance and usability. Mol. Biol. Evol. 2013, 30, 772–780. [Google Scholar] [CrossRef]
- Lanfear, R.; Frandsen, P.; Wright, A.; Senfeld, T.; Calcott, B. PartitionFinder 2: New methods for selecting partitioned models of evolution for molecular and morphological phylogenetic analyses. Mol. Biol. Evol. 2017, 34, 772–773. [Google Scholar] [CrossRef] [PubMed]
- Nguyen, L.-T.; Schmidt, H.A.; von Haeseler, A.; Minh, B.Q. IQ-TREE: A fast and effective stochastic algorithm for estimating maximum-likelihood phylogenies. Mol. Biol. Evol. 2014, 32, 268–274. [Google Scholar] [CrossRef] [PubMed]
- Ronquist, F.; Teslenko, M.; Van Der Mark, P.; Ayres, D.L.; Darling, A.; Höhna, S.; Larget, B.; Liu, L.; Suchard, M.A.; Huelsenbeck, J.P. MrBayes 3.2: Efficient Bayesian phylogenetic inference and model choice across a large model space. Syst. Biol. 2012, 61, 539–542. [Google Scholar] [CrossRef]
- Rambaut, A. FigTree 1.4.3 Software; Institute of Evolutionary Biology, University of Edinburgh: Edinburgh, Scotland, UK, 2016. [Google Scholar]
- Sheffield, N.C.; Song, H.; Cameron, S.L.; Whiting, M.F. Nonstationary evolution and compositional heterogeneity in beetle mitochondrial phylogenomics. Soc. Syst. Biol. 2009, 58, 381–394. [Google Scholar] [CrossRef]
- Timmermans, M.J.T.N.; Lim, J.; Dodsworth, S.; Haran, J.; Ahrens, D.; Bocak, L.; London, A.; Culverwell, L.; Vogler, A.P. Mitogenomics of the Coleoptera under dense taxon sampling. Unpublished.
- Hunter, A.; Moriniere, J.; Tang, P.; Linard, B.; Crampton-Platt, A.; Vogler, A.P. Mitochondria of beetle species. Unpublished.
- Linard, B.; Andujar, C.; Arribas, P.; Vogler, A.P. Direct Submission to GenBank. Unpublished.
- Linard, B.; Andujar, C.; Arribas, P.; Vogler, A.P. Mitochondria of unsequenced beetle families. Unpublished.
- Linard, B.; Arribas, P.; Andujar, C.; Crampton-Platt, A.; Vogler, A.P. Lessons from genome skimming of arthropod-preserving ethanol. Mol. Ecol. Resour. 2016, 16, 1365–1377. [Google Scholar] [CrossRef]
- Bae, J.S.; Kim, I.; Sohn, H.D.; Jin, B.R. The mitochondrial genome of the firefly, Pyrocoelia rufa: Complete DNA sequence, genome organization, and phylogenetic analysis with other insects. Mol. Phylogenet. Evol. 2004, 32, 978–985. [Google Scholar] [CrossRef]
- Uribe, J.E.; Gutierrez-Rodriguez, J. The complete mitogenome of the trilobite beetle, Platerodrilus sp. (Elateroidea: Lycidae). Mitochondrial DNA B Resour. 2016, 1, 658–659. [Google Scholar] [CrossRef]
- Sheffield, N.C.; Song, H.; Cameron, S.L.; Whiting, M.F. A comparative analysis of mitochondrial genomes in coleoptera (Arthropoda: Insecta) and genome descriptions of six new beetles. Mol. Biol. Evol. 2008, 25, 2499–2509. [Google Scholar] [CrossRef]
- Nie, R.; Yang, X. Research progress in mitochondrial genomes of Coleoptera. Acta Biochim. Biophys. Sin. 2014, 57, 860–868. [Google Scholar]
- Ma, C.; Liu, C.; Yang, P.; Kang, L. The complete mitochondrial genomes of two band-winged grasshoppers, Gastrimargus marmoratus and Oedaleus asiaticus. BMC Genom. 2009, 10, 156. [Google Scholar] [CrossRef] [PubMed]
- Marín, A.; Xia, X. GC skew in protein-coding genes between the leading and lagging strands in bacterial genomes: New substitution models incorporating strand bias. J. Theor. Biol. 2008, 253, 508–513. [Google Scholar] [CrossRef] [PubMed]
- Sahyoun, A.H.; Bernt, M.; Stadler, P.F.; Toutb, K. GC skew and mitochondrial origins of replication. Mitochondrion 2014, 17, 56–66. [Google Scholar] [CrossRef] [PubMed]
- Nardi, F.; Carapelli, A.; Fanciulli, P.P.; Dallai, R.; Frati, F. The complete mitochondrial DNA sequence of the basal hexapod Tetrodontophora bielanensis: Evidence for heteroplasmy and tRNA translocations. Mol. Biol. Evol. 2001, 18, 1293–1304. [Google Scholar] [CrossRef]
- Chen, S.C.; Wang, X.Q.; Li, P.W.; Hu, X.; Wang, J.J.; Peng, P. The complete mitochondrial genome of Aleurocanthus camelliae: Insights into gene arrangement and genome organization within the family Aleyrodidae. Int. J. Mol. Sci. 2016, 17, 1843. [Google Scholar] [CrossRef]
- Yang, Z.; Bielawski, J.P. Statistical methods for detecting molecular adaptation. Trends Ecol. Evol. 2000, 15, 496–503. [Google Scholar] [CrossRef]
- Hurst, L.D. The Ka/Ks ratio: Diagnosing the form of sequence evolution. Trends Genet. 2002, 18, 486–487. [Google Scholar] [CrossRef]
- Shen, X.; Li, X.; Sha, Z.; Yan, B.; Xu, Q. Complete mitochondrial genome of the Japanese snapping shrimp Alpheus japonicus (Crustacea: Decapoda: Caridea): Gene rearrangement and phylogeny within Caridea. Sci. China Life Sci. 2012, 55, 591–598. [Google Scholar] [CrossRef]
- Shen, X.; Wang, H.; Wang, M.; Liu, B. The complete mitochondrial genome sequence of Euphausia pacifica (Malacostraca: Euphausiacea) reveals a novel gene order and unusual tandem repeats. Genome 2011, 54, 911–922. [Google Scholar] [CrossRef]
- Zhang, H.; Luo, Q.; Sun, J.; Liu, F.; Wu, G.; Yu, J.; Wang, W. Mitochondrial genome sequences of Artemia tibetiana and Artemia urmiana: Assessing molecular changes for high plateau adaptation. Sci. China Life Sci. 2013, 56, 440–452. [Google Scholar] [CrossRef]
- Liu, Y.-Q.; Li, Y.-P.; Wang, H.; Xia, R.-X.; Chai, C.-L.; Pan, M.-H.; Lu, C.; Xiang, Z.-H. The complete mitochondrial genome of the wild type of Antheraea pernyi (Lepidoptera: Saturniidae). Ann. Entomol. Soc. Am. 2012, 105, 498–505. [Google Scholar] [CrossRef]
- Li, N.; Hu, G.-L.; Hua, B.-Z. Complete mitochondrial genomes of Bittacus strigosus and Panorpa debilis and genomic comparisons of Mecoptera. Int. J. Biol. Macromol. 2019, 140, 672–681. [Google Scholar] [CrossRef] [PubMed]
- Gong, R.; Guo, X.; Ma, J.; Song, X.; Shen, Y.; Geng, F.; Price, M.; Zhang, X.; Yue, B. Complete mitochondrial genome of Periplaneta brunnea (Blattodea: Blattidae) and phylogenetic analyses within Blattodea. J. Asia Pac. Entomol. 2018, 21, 885–895. [Google Scholar] [CrossRef]
- Oliveira, D.C.S.G.; Raychoudhury, R.; Lavrov, D.V.; Werren, J.H. Rapidly evolving mitochondrial genome and directional selection in mitochondrial genes in the parasitic wasp Nasonia (Hymenoptera: Pteromalidae). Mol. Biol. Evol. 2008, 25, 2167–2180. [Google Scholar] [CrossRef]
- Li, H.; Liu, H.; Song, F.; Shi, A.; Zhou, X.; Cai, W. Comparative mitogenomic analysis of damsel bugs representing three tribes in the family Nabidae (Insecta: Hemiptera). PLoS ONE 2012, 7, e45925. [Google Scholar] [CrossRef]
- Śmietanka, B.; Burzyński, A.; Wenne, R. Comparative genomics of marine mussels (Mytilus spp.) gender associated mtDNA: Rapidly evolving atp8. J. Mol. Evol. 2010, 71, 385–400. [Google Scholar] [CrossRef]
- Arquez, M.; Colgan, D.; Castro, L.R. Sequence and comparison of mitochondrial genomes in the genus Nerita (Gastropoda: Neritimorpha: Neritidae) and phylogenetic considerations among gastropods. Mar. Genom. 2014, 15, 45–54. [Google Scholar] [CrossRef]
- Gao, B.; Peng, C.; Chen, Q.; Zhang, J.; Shi, Q. Mitochondrial genome sequencing of a vermivorous cone snail Conus quercinus supports the correlative analysis between phylogenetic relationships and dietary types of Conus species. PLoS ONE 2018, 13, e0193053. [Google Scholar] [CrossRef]
- Li, X.; Huang, Y.; Lei, F. Comparative mitochondrial genomics and phylogenetic relationships of the Crossoptilon species (Phasianidae, Galliformes). BMC Genom. 2015, 16, 42. [Google Scholar] [CrossRef]
- Jiang, F.; Miao, Y.; Liang, W.; Ye, H.; Liu, H.; Liu, B. The complete mitochondrial genomes of the whistling duck (Dendrocygna javanica) and black swan (Cygnus atratus): Dating evolutionary divergence in Galloanserae. Mol. Biol. Rep. 2010, 37, 3001–3015. [Google Scholar] [CrossRef]
- Wei, H.; Li, F.; Wang, X.; Wang, Q.; Chen, G.; Zong, H.; Chen, S. The characterization of complete mitochondrial genome and phylogenetic relationship within Rattus genus (Rodentia: Muridae). Biochem. Syst. Ecol. 2017, 71, 179–186. [Google Scholar] [CrossRef]
- Li, J.; Zhang, Z.; Vang, S.; Yu, J.; Wong, G.K.; Wang, J. Correlation between Ka/Ks and Ks is related to substitution model and evolutionary lineage. J. Mol. Evol. 2009, 68, 414–423. [Google Scholar] [CrossRef] [PubMed]
- Coates, B.S.; Sumerford, D.V.; Hellmich, R.L.; Lewis, L.C. Partial mitochondrial genome sequences of Ostrinia nubilalis and Ostrinia furnicalis. Int. J. Biol. Sci. 2004, 1, 13–18. [Google Scholar] [CrossRef] [PubMed]
- Kim, M.; Wan, X.; Kim, I. Complete mitochondrial genome of the seven-spotted lady beetle, Coccinella septempunctata (Coleoptera: Coccinellidae). Mitochondrial DNA 2012, 23, 179–181. [Google Scholar] [CrossRef]
- Wang, Y.; Chen, J.; Jiang, L.Y.; Qiao, G.X. The complete mitochondrial genome of Mindarus keteleerifoliae (Insecta: Hemiptera: Aphididae) and comparison with other Aphididae insects. Int. J. Mol. Sci. 2015, 16, 30091–30102. [Google Scholar] [CrossRef]
- Taanman, J.W. The mitochondrial genome: Structure, transcription, translation and replication. Biochim. Biophys. Acta 1999, 1410, 102–123. [Google Scholar] [CrossRef]
- Hendrich, L.; Pons, J.; Ribera, I.; Balke, M. Mitochondrial cox1 sequence data reliably uncover patterns of insect diversity but suffer from high lineage-idiosyncratic error rates. PLoS ONE 2010, 5, e14448. [Google Scholar] [CrossRef]


| Taxonomic Level | Elateriformia Groups Used * | Genes Used | References |
|---|---|---|---|
| Coleoptera | 4 superfamilies + Scirtoidea 30 families 704 species | rRNA: 18S, 28S mtDNA: rrnl, cox1(cox1-5, cox1-3’) | [28] |
| Coleoptera | 4 superfamilies + Scirtoidea 33 families 59 species | rRNA: 18S, 28S nuclear: AK, AS, CAD, EF1a, PEPCK, WG | [16] |
| Coleoptera | 4 superfamilies 7 families 34 morphospecies | mtDNA: 1–13 PCGs | [31] |
| Coleoptera | 4 superfamilies + Scirtoidea 29 families 564 species | rRNA:18S, 28S mtDNA: rrnl, cox1 Transcriptomes: 4220 orthologs | [29] |
| Coleoptera | 4 superfamilies + Scirtoidea 27 families 85 species | nuclear: 95 PCGs | [17] |
| Coleoptera | 4 superfamilies 46 subfamilies 189 species | rRNA: 18S mtDNA: rrnl, cox1 | [18] |
| Coleoptera | 3 superfamilies 8 families 12 species | mtDNA: 12 or 13 PCGs | [25] |
| Elateriformia | 4 superfamilies + Scirtoidea 28 families 112 species | rRNA: 18S, 28S mtDNA: rrnl, cox1 | [27] |
| Elateriformia | 4 superfamilies 17 families 27 species | mtDNA: 12 PCGs or cob-nad6 | [26] |
| Elateriformia | 4 superfamilies + Scirtoidea 31 families 488 species | rRNA: 18S, 28S mtDNA: rrnl, cox1 | [30] |
| Elateriformia | 3 superfamilies + Scirtoidea 19 species | mtDNA: all 13 PCGs | [23] |
| Elateriformia | 3 superfamilies + Scirtoidea 18 species | mtDNA: all 13 PCGs | [24] |
| Elateriformia | 3 superfamilies + Scirtoidea 18 families 31 species | mtDNA: all 13 PCGs, rrnl, rrnlS, 22 tRNA | this study |
| Superfamily | Family | Species* | GenBank NO. | Size (bp) | Total A + T% | AT% of all PCGs | References |
|---|---|---|---|---|---|---|---|
| Buprestoidea | Buprestidae | Acmaeodera sp. | FJ613420 | 16,217 | 68.4 | 66.2 | [63] |
| Buprestoidea | Buprestidae | Agrilus planipennis | KT363854 | 15,942 | 71.9 | 70.1 | [25] |
| Buprestoidea | Buprestidae | Agrilus sp. | JX412834 | 16,210 | 70.1 | 68.4 | [64] |
| Buprestoidea | Buprestidae | Chrysochroa fulgidissima | NC012765 | 15,592 | 69.9 | 68.6 | [38] |
| Buprestoidea | Buprestidae | Trachys auricollis | MH638268 | 16,429 | 71 | 69.3 | This study |
| Buprestoidea | Buprestidae | Trachys troglodytiformis | KX087357 | 16,316 | 74.6 | 73.6 | [65] |
| Buprestoidea | Buprestidae | Agrilinae sp. | MH789732 | 16,173 | 72.5 | 70.3 | [31] |
| Byrrhoidea | Limnichidae | Byrrhinus sp. | JX412827 | 16,812 | 72.4 | 70.3 | [64] |
| Byrrhoidea | Callirhipidae | Horatocera niponica | KX035160 | 16,107 | 75.5 | 73.4 | [66] |
| Byrrhoidea | Dryopidae | Dryops ernesti | KX035147 | 15,672 | 73 | 71 | [67] |
| Byrrhoidea | Dryopidae | Dryops luridus | KT876888 | 16,710 | 72.9 | 71.1 | [68] |
| Byrrhoidea | Heteroceridae | Heterocerus parallelus | KX087297 | 15,845 | 74 | 72.5 | [65] |
| Byrrhoidea | Limnichidae | Limnichidae sp. | JQ034416 | 14,388 | 74.6 | 73.5 | [26] |
| Byrrhoidea | Psephenidae | Psephenidae sp. | KX035154 | 16,312 | 78.1 | 75.6 | [66] |
| Byrrhoidea | Ptilodactylidae | Ptilodactylidae sp. | MH789727 | 15,991 | 74.8 | 72.1 | [31] |
| Byrrhoidea | Chelonariidae | Chelonarium sp. | KX035150 | 15,095 | 75.6 | 72.9 | [67] |
| Elateroidea | Cantharidae | Chauliognathus opacus | FJ613418 | 14,893 | 76.8 | 76.2 | [63] |
| Elateroidea | Cerophytidae | Cerophytidae sp. | KX035161 | 15,741 | 80.4 | 79 | [67] |
| Elateroidea | Elateridae | Limonius minutus | KX087306 | 16,727 | 76.7 | 74.8 | [65] |
| Elateroidea | Lampyridae | Pyrocoelia rufa | AF452048 | 17,739 | 77.4 | 76.3 | [69] |
| Elateroidea | Lycidae | Platerodrilus sp. | KU878647 | 16,394 | 76.9 | 76 | [70] |
| Elateroidea | Phengodidae | Phrixothrix hirtus | KM923891 | 18,919 | 78 | 77.9 | [34] |
| Elateroidea | Rhagophthalmidae | Rhagophthalmus lufengensis | NC010969 | 15,982 | 79.6 | 78.1 | [35] |
| Elateroidea | Eucnemidae | Eucnemidae sp. | MH923241 | 16,170 | 78.3 | 76.2 | [31] |
| Scirtoidea | Scirtidde | Cyphon sp. | NC011320 | 15,919 | 75.2 | 72.8 | [71] |
| Scirtoidea | Scirtidde | Contacyphon variabilis | KT876886 | 15,901 | 75.9 | 71.1 | [68] |
| Scirtoidea | Scirtidde | Elodes minuta | KX087288 | 17,043 | 76.8 | 72.8 | [65] |
| Scirtoidea | Eucinetidae | Eucinetus haemorrhoidalis | NC036278 | 17,954 | 81 | 78.4 | [67] |
| Scirtoidea | Scirtidae | Scirtes orbicularis | KX087343 | 13,944 | 76.5 | 75.4 | [65] |
| Feature | Strand | Position | Length (bp) | Initiation Codon | Stop Codon | Anticodon | IGN |
|---|---|---|---|---|---|---|---|
| trnI | N | 1–67 | 67 | GTA | −3 | ||
| trnQ | J | 65–133 | 69 | TTG | |||
| trnM | N | 134–202 | 69 | CAT | 39 | ||
| nad2 | N | 242–1222 | 981 | ATG | TAA | 5 | |
| trnW | N | 1228–1300 | 73 | TCA | −8 | ||
| trnC | J | 1293–1352 | 60 | GCA | |||
| trnY | J | 1353–1417 | 65 | GTA | −8 | ||
| cox1 | N | 1410–2954 | 1,545 | ATT | TAA | −5 | |
| trnL2 | N | 2950–3014 | 65 | TAA | |||
| cox2 | N | 3015–3696 | 682 | ATA | T(AA) | −3 | |
| trnK | N | 3694–3764 | 71 | CTT | −2 | ||
| trnD | N | 3763–3824 | 62 | GTC | |||
| atp8 | N | 3825–3983 | 159 | ATT | TAA | −7 | |
| atp6 | N | 3977–4651 | 675 | ATG | TAA | −1 | |
| cox3 | N | 4651–5437 | 787 | ATG | T(AA) | ||
| trnG | N | 5438–5499 | 62 | TCC | |||
| nad3 | N | 5500–5883 | 354 | ATA | TAG | −2 | |
| trnA | N | 5852–5914 | 63 | TGC | −1 | ||
| trnR | N | 5914–5980 | 67 | TCG | −1 | ||
| trnN | N | 5980–6044 | 65 | GTT | |||
| trnS1 | N | 6045–6111 | 67 | TCT | |||
| trnE | N | 6112–6173 | 62 | TTC | −1 | ||
| trnF | J | 6173–6235 | 63 | GAA | −20 | ||
| nad5 | J | 6216–7934 | 1,719 | ATT | TAG | 18 | |
| trnH | J | 7953–8015 | 63 | GTG | −30 | ||
| nad4 | J | 7986–9321 | 1,336 | ATG | T(AA) | 23 | |
| nad4l | J | 9345–9632 | 288 | ATG | TAA | 2 | |
| trnT | N | 9635–9697 | 63 | TGT | −1 | ||
| trnP | J | 9697–9762 | 66 | TGG | −8 | ||
| nad6 | N | 9755–10252 | 498 | ATT | TAA | −1 | |
| cob | N | 10252–11397 | 1,146 | ATG | TAA | −2 | |
| trnS2 | N | 11396–11462 | 67 | TGA | 23 | ||
| nad1 | J | 11486–12412 | 927 | ATT | TAA | 25 | |
| trnL1 | J | 12438–12502 | 65 | TAG | −23 | ||
| rrnL | J | 12480–13773 | 1,294 | −19 | |||
| trnV | J | 13755–13824 | 70 | TAC | |||
| rrnS | J | 13825–14582 | 758 | 1847 | |||
| CR | - | 14582–16429 | 1,846 | ||||
| Genome Size | 16429 | 0 | |||||
© 2019 by the authors. Licensee MDPI, Basel, Switzerland. This article is an open access article distributed under the terms and conditions of the Creative Commons Attribution (CC BY) license (http://creativecommons.org/licenses/by/4.0/).
Share and Cite
Xiao, L.; Zhang, S.; Long, C.; Guo, Q.; Xu, J.; Dai, X.; Wang, J. Complete Mitogenome of a Leaf-Mining Buprestid Beetle, Trachys auricollis, and Its Phylogenetic Implications. Genes 2019, 10, 992. https://doi.org/10.3390/genes10120992
Xiao L, Zhang S, Long C, Guo Q, Xu J, Dai X, Wang J. Complete Mitogenome of a Leaf-Mining Buprestid Beetle, Trachys auricollis, and Its Phylogenetic Implications. Genes. 2019; 10(12):992. https://doi.org/10.3390/genes10120992
Chicago/Turabian StyleXiao, Lifang, Shengdi Zhang, Chengpeng Long, Qingyun Guo, Jiasheng Xu, Xiaohua Dai, and Jianguo Wang. 2019. "Complete Mitogenome of a Leaf-Mining Buprestid Beetle, Trachys auricollis, and Its Phylogenetic Implications" Genes 10, no. 12: 992. https://doi.org/10.3390/genes10120992
APA StyleXiao, L., Zhang, S., Long, C., Guo, Q., Xu, J., Dai, X., & Wang, J. (2019). Complete Mitogenome of a Leaf-Mining Buprestid Beetle, Trachys auricollis, and Its Phylogenetic Implications. Genes, 10(12), 992. https://doi.org/10.3390/genes10120992