RNA-seq Analysis of Salt-Stressed Versus Non Salt-Stressed Transcriptomes of Chenopodium quinoa Landrace R49


Abstract
1. Introduction
2. Materials and Methods
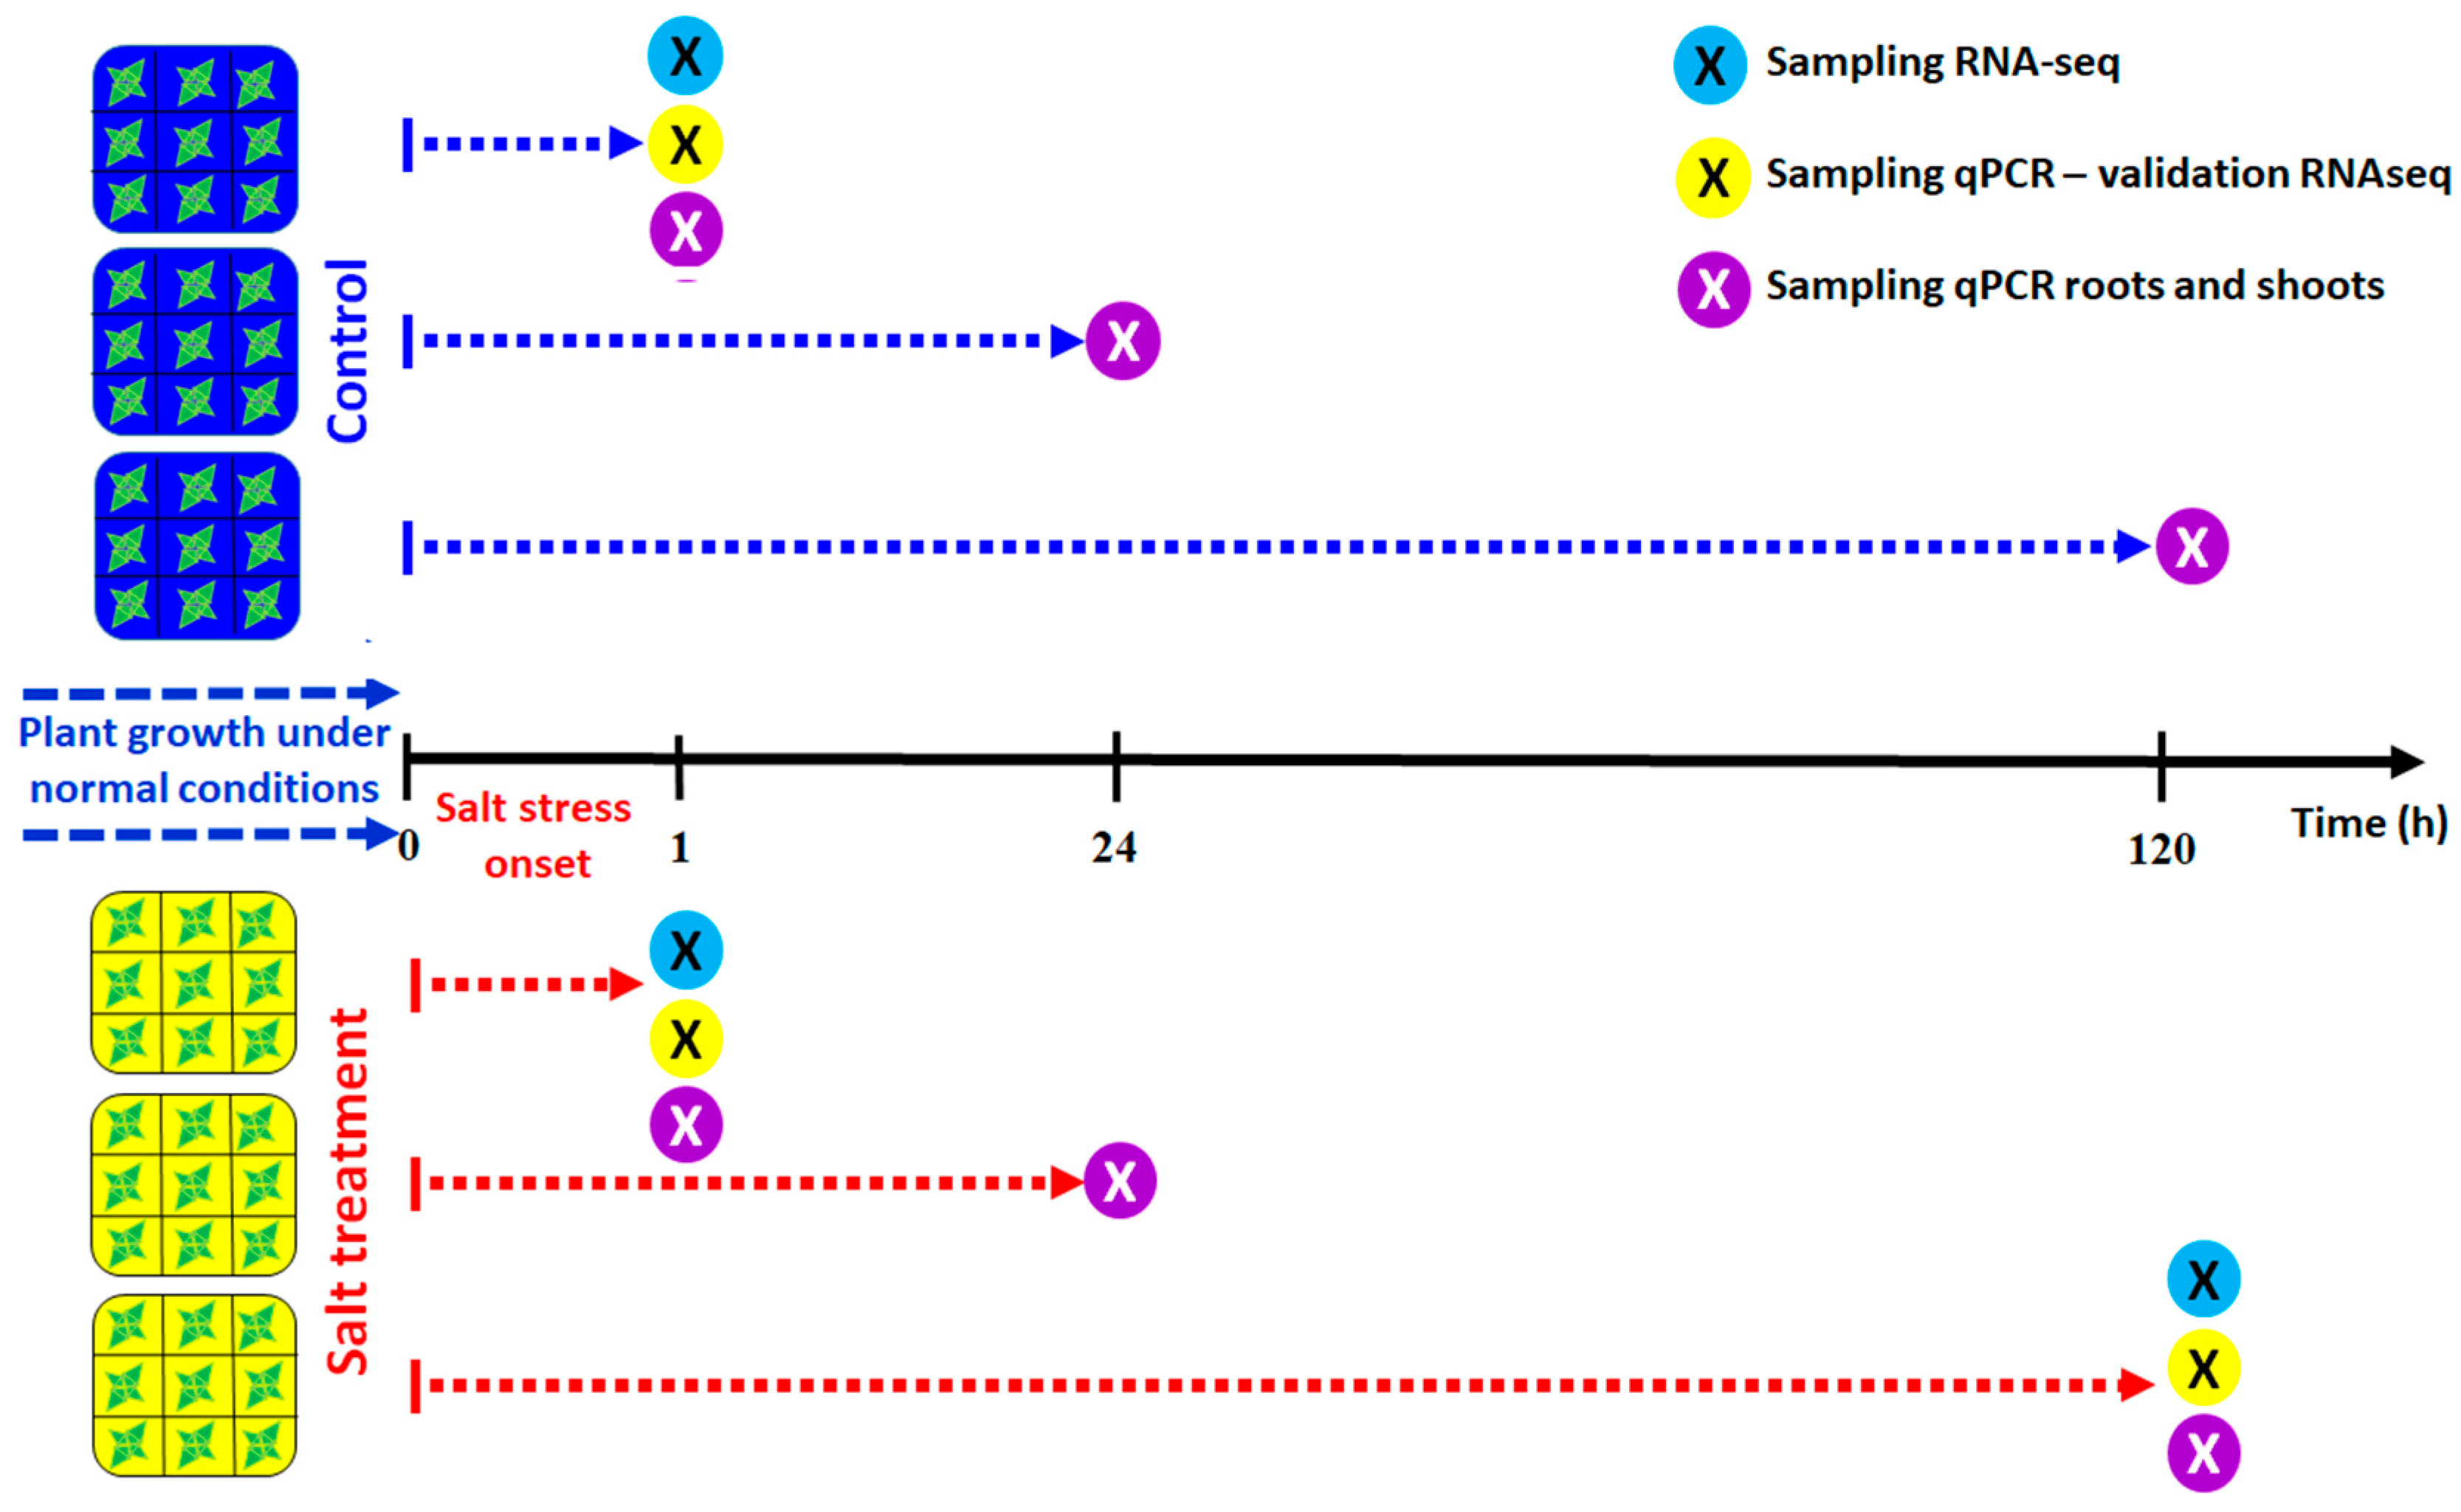
2.1. Plant Material
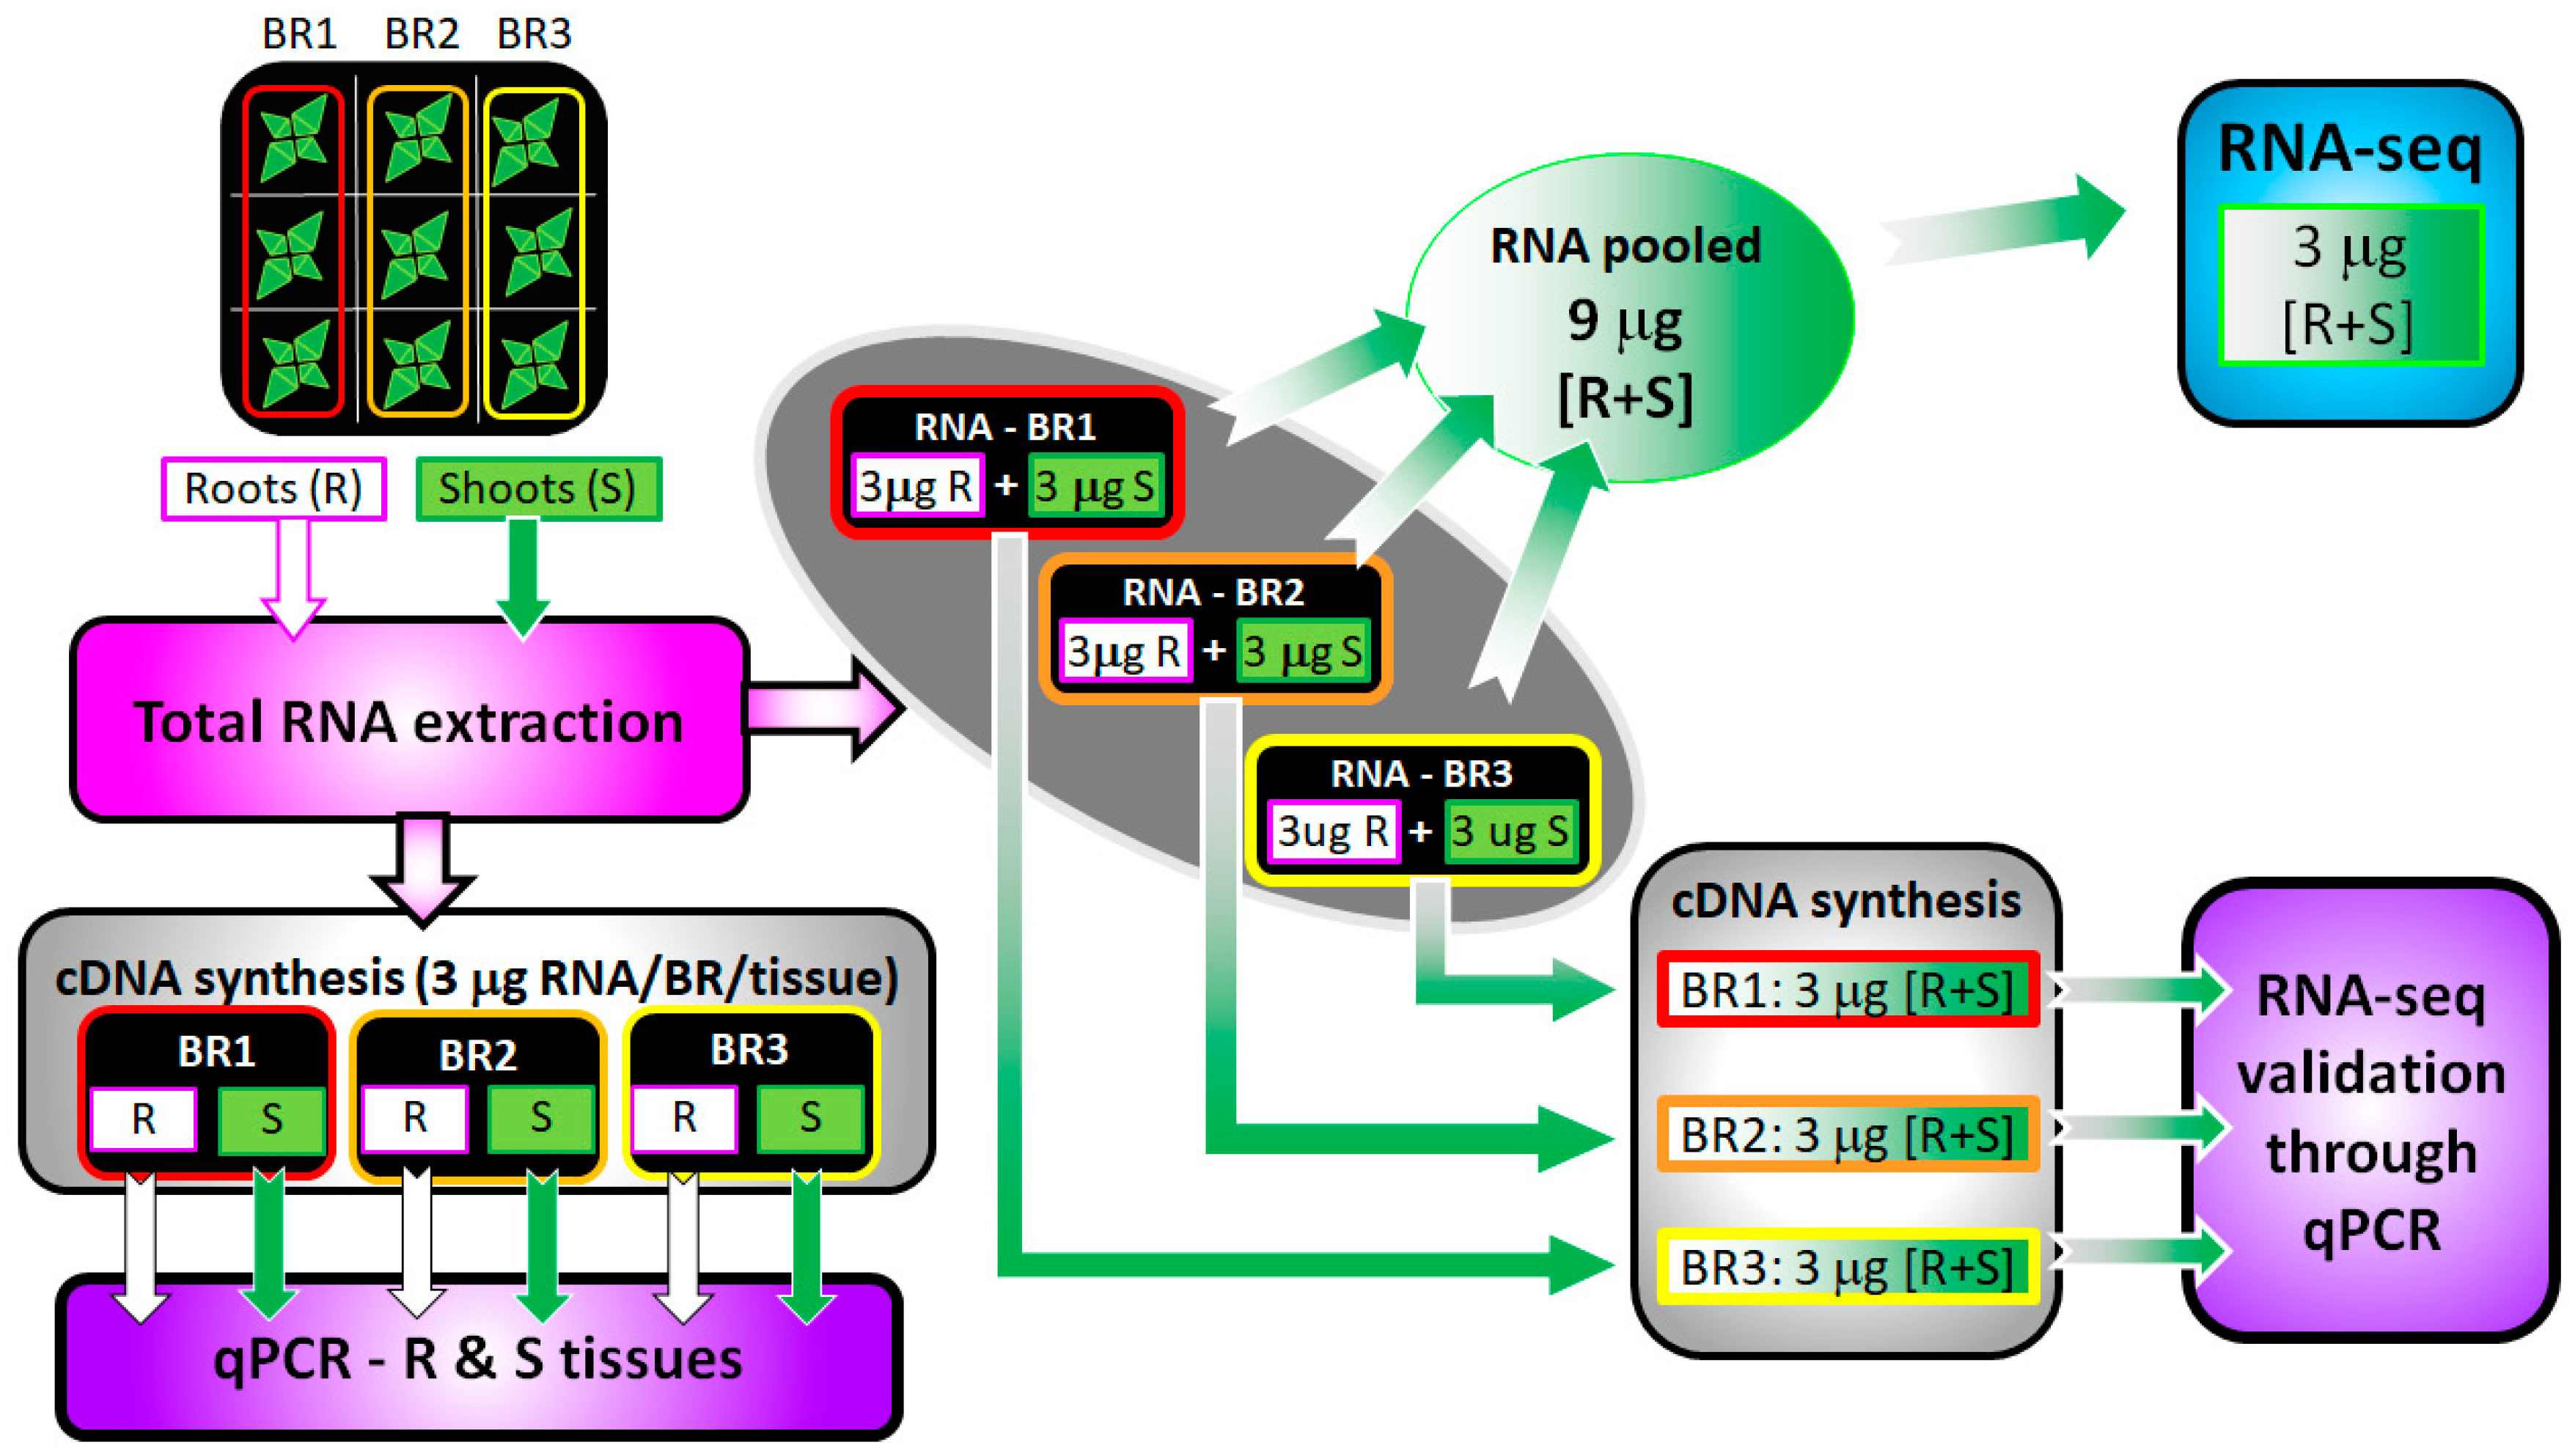
2.2. RNA Extraction
2.3. Library Preparation and RNA Sequencing
2.4. RNA Sequence Analysis
2.5. Functional Annotation of Reference Transcriptome and Gene Ontology Over-Representation Analysis
2.6. Real-time Quantitative Reverse Transcription-Polymerase Chain Reaction (RT-qPCR)
2.7. Statistical Analysis
3. Results
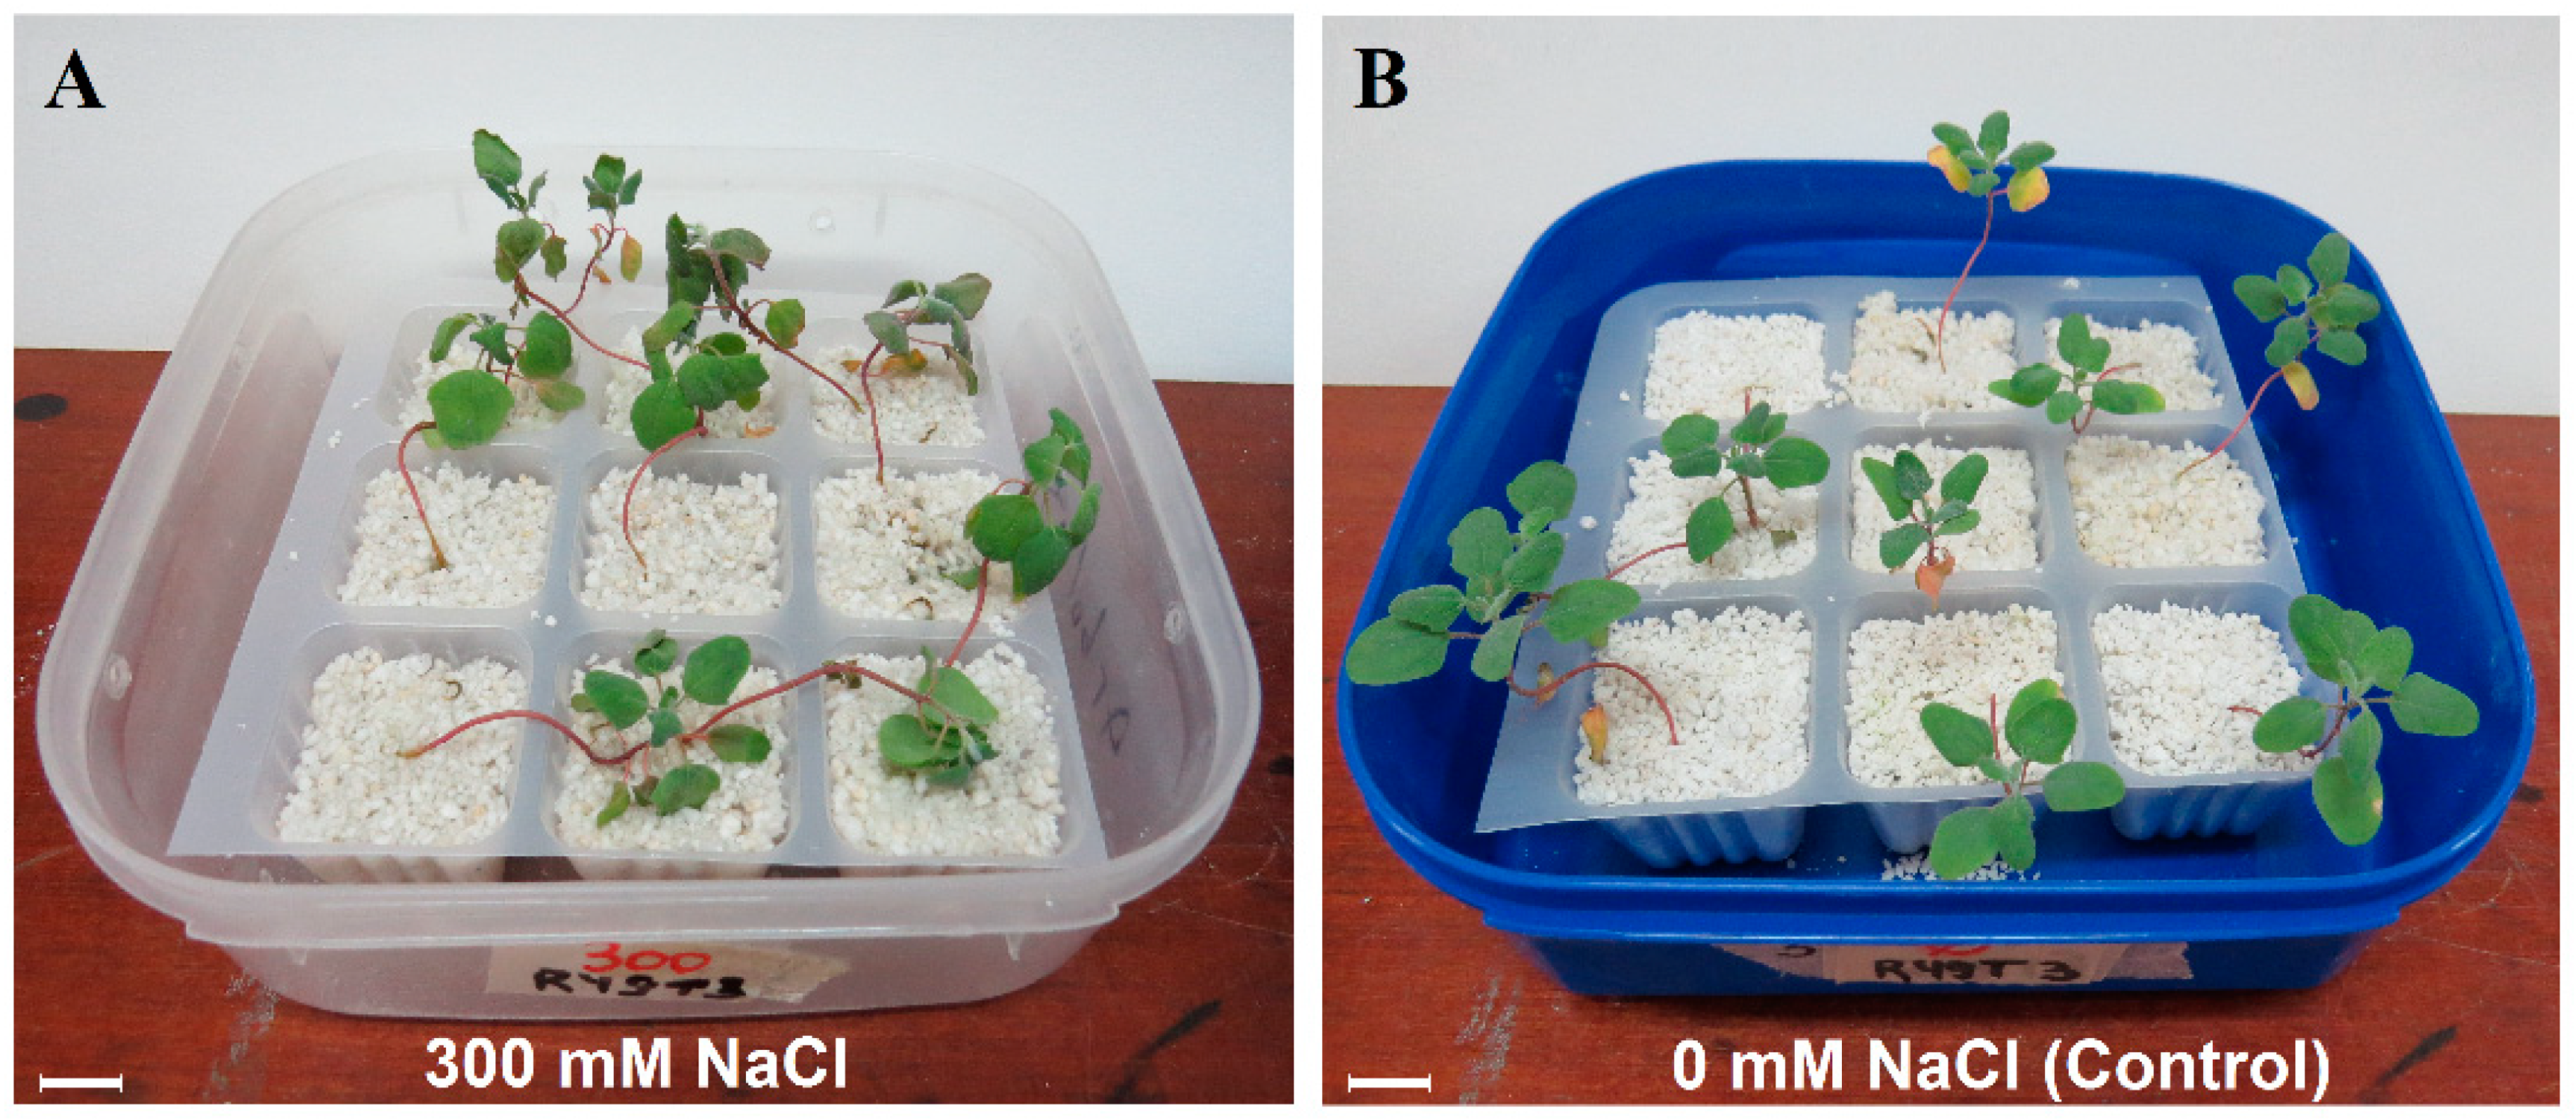
3.1. Phenotype Response and Transcriptome Sequencing
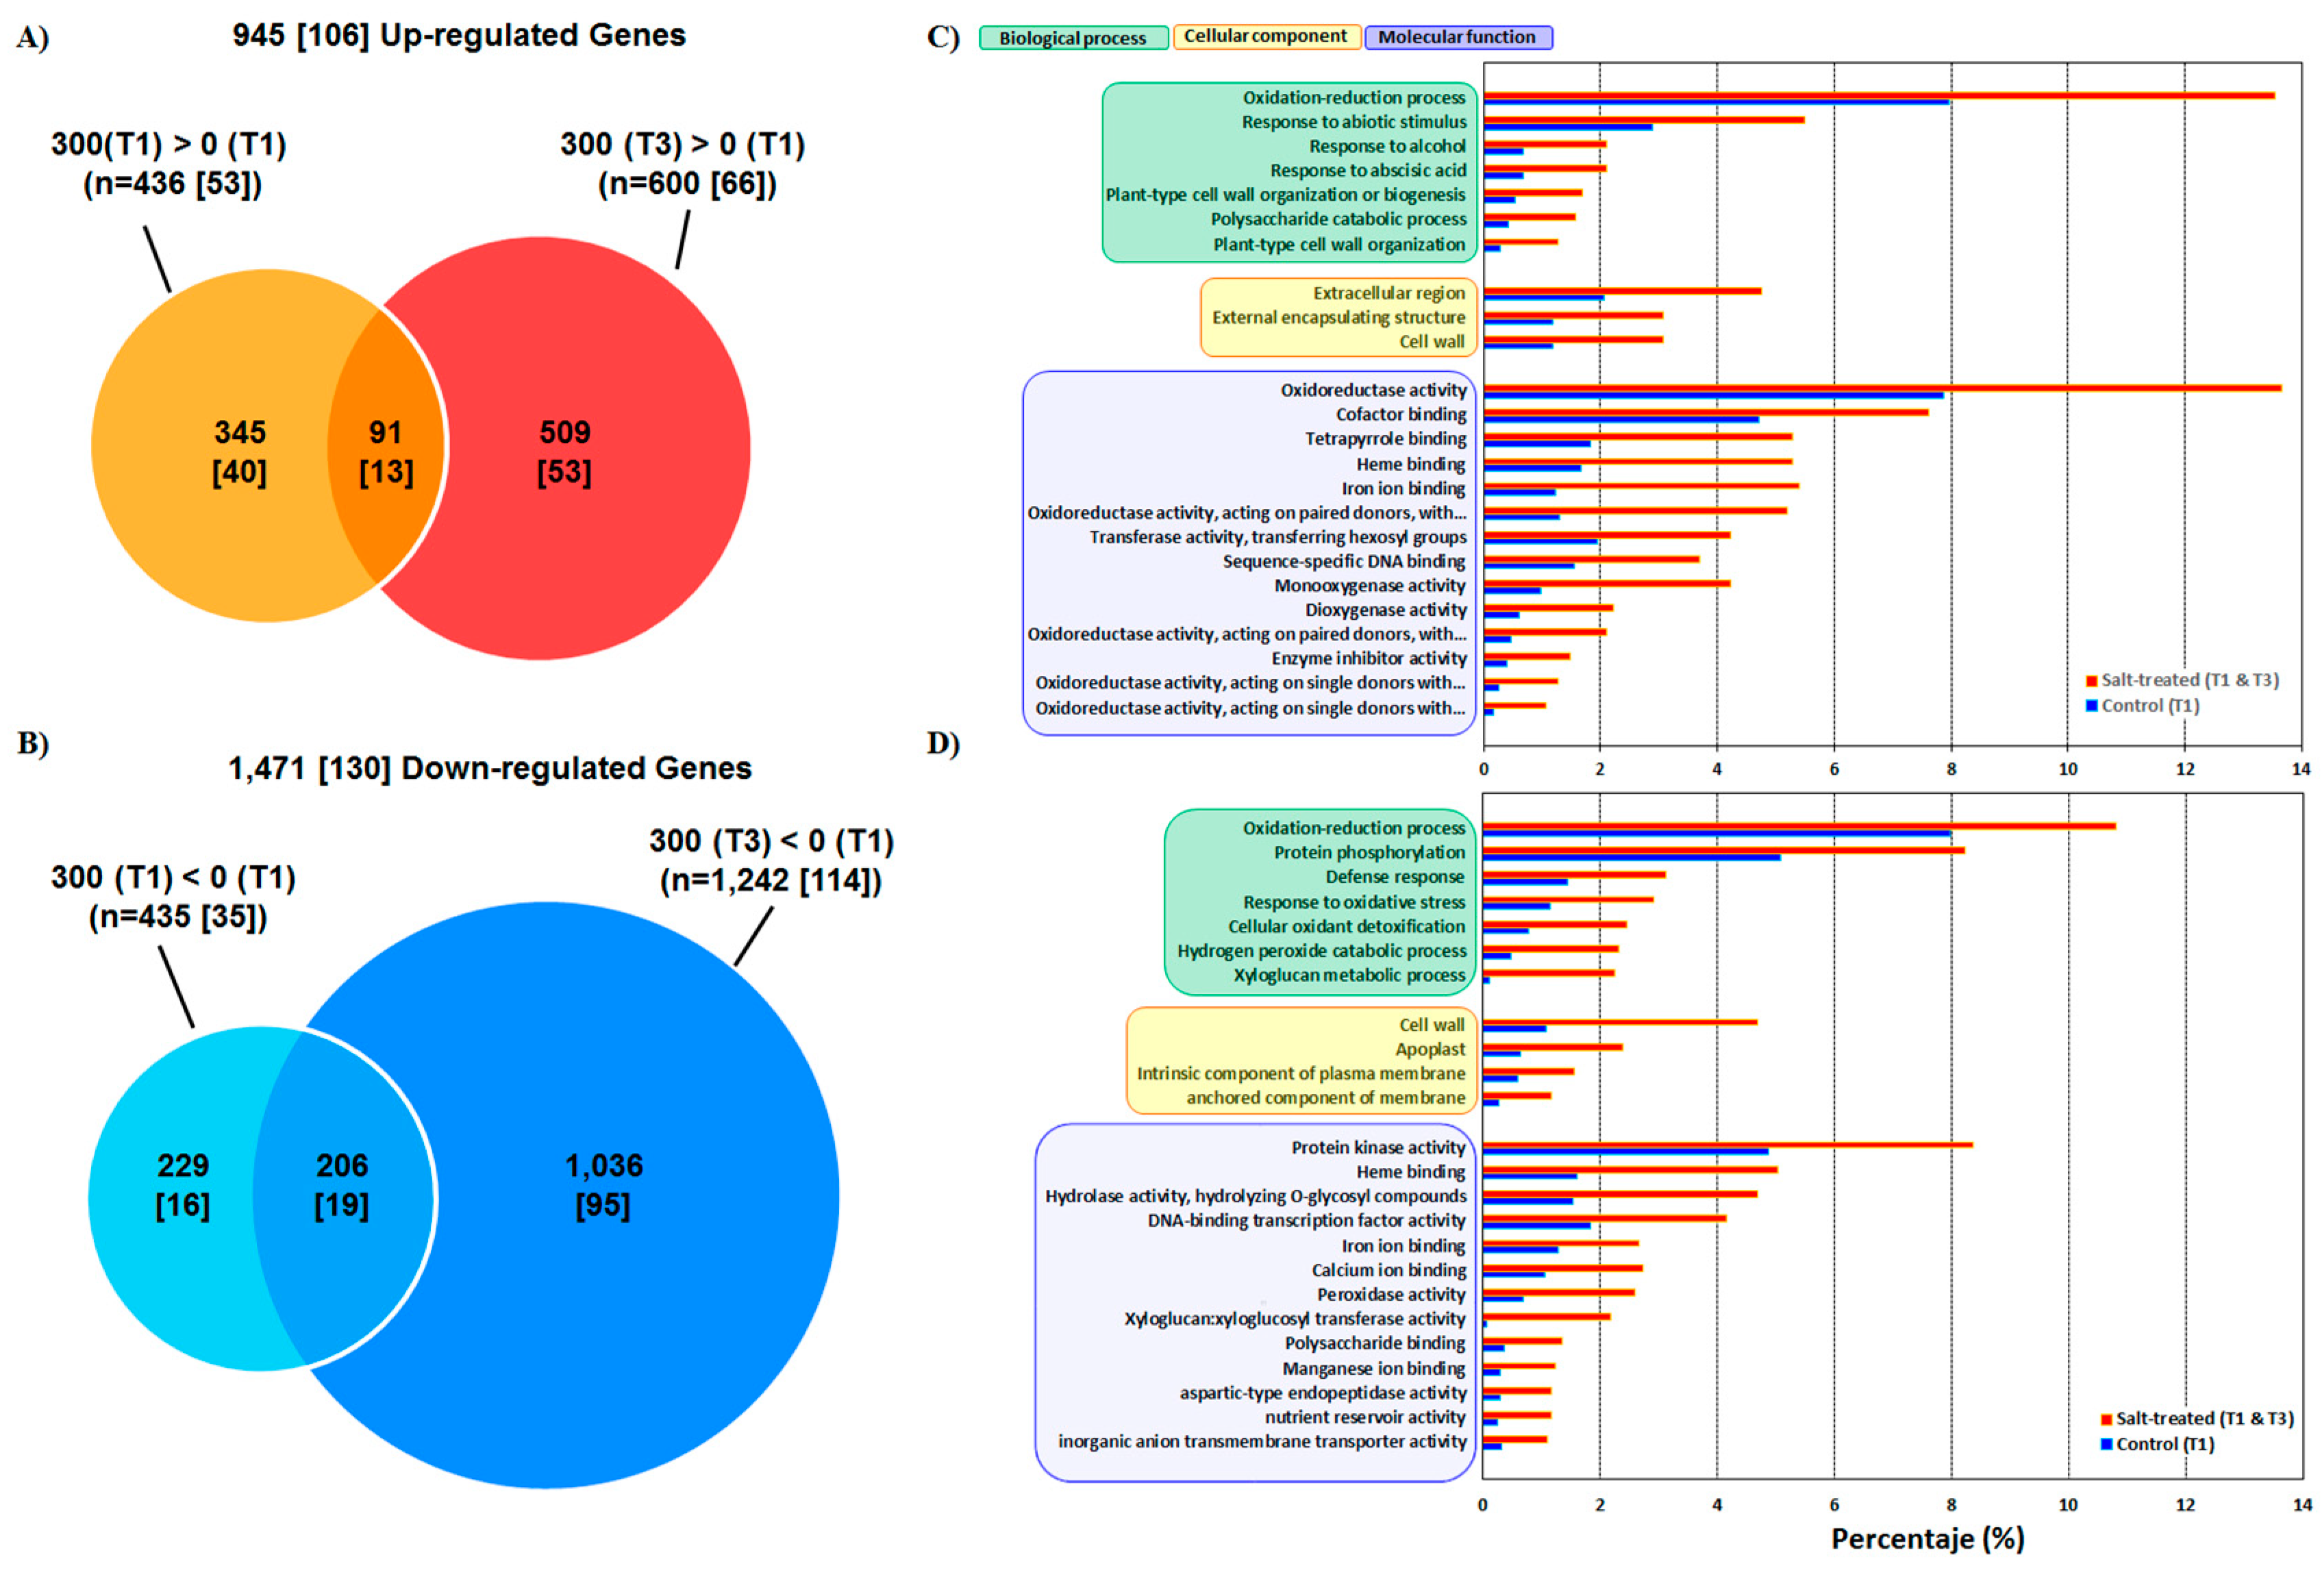
3.2. Functional Annotation and GO
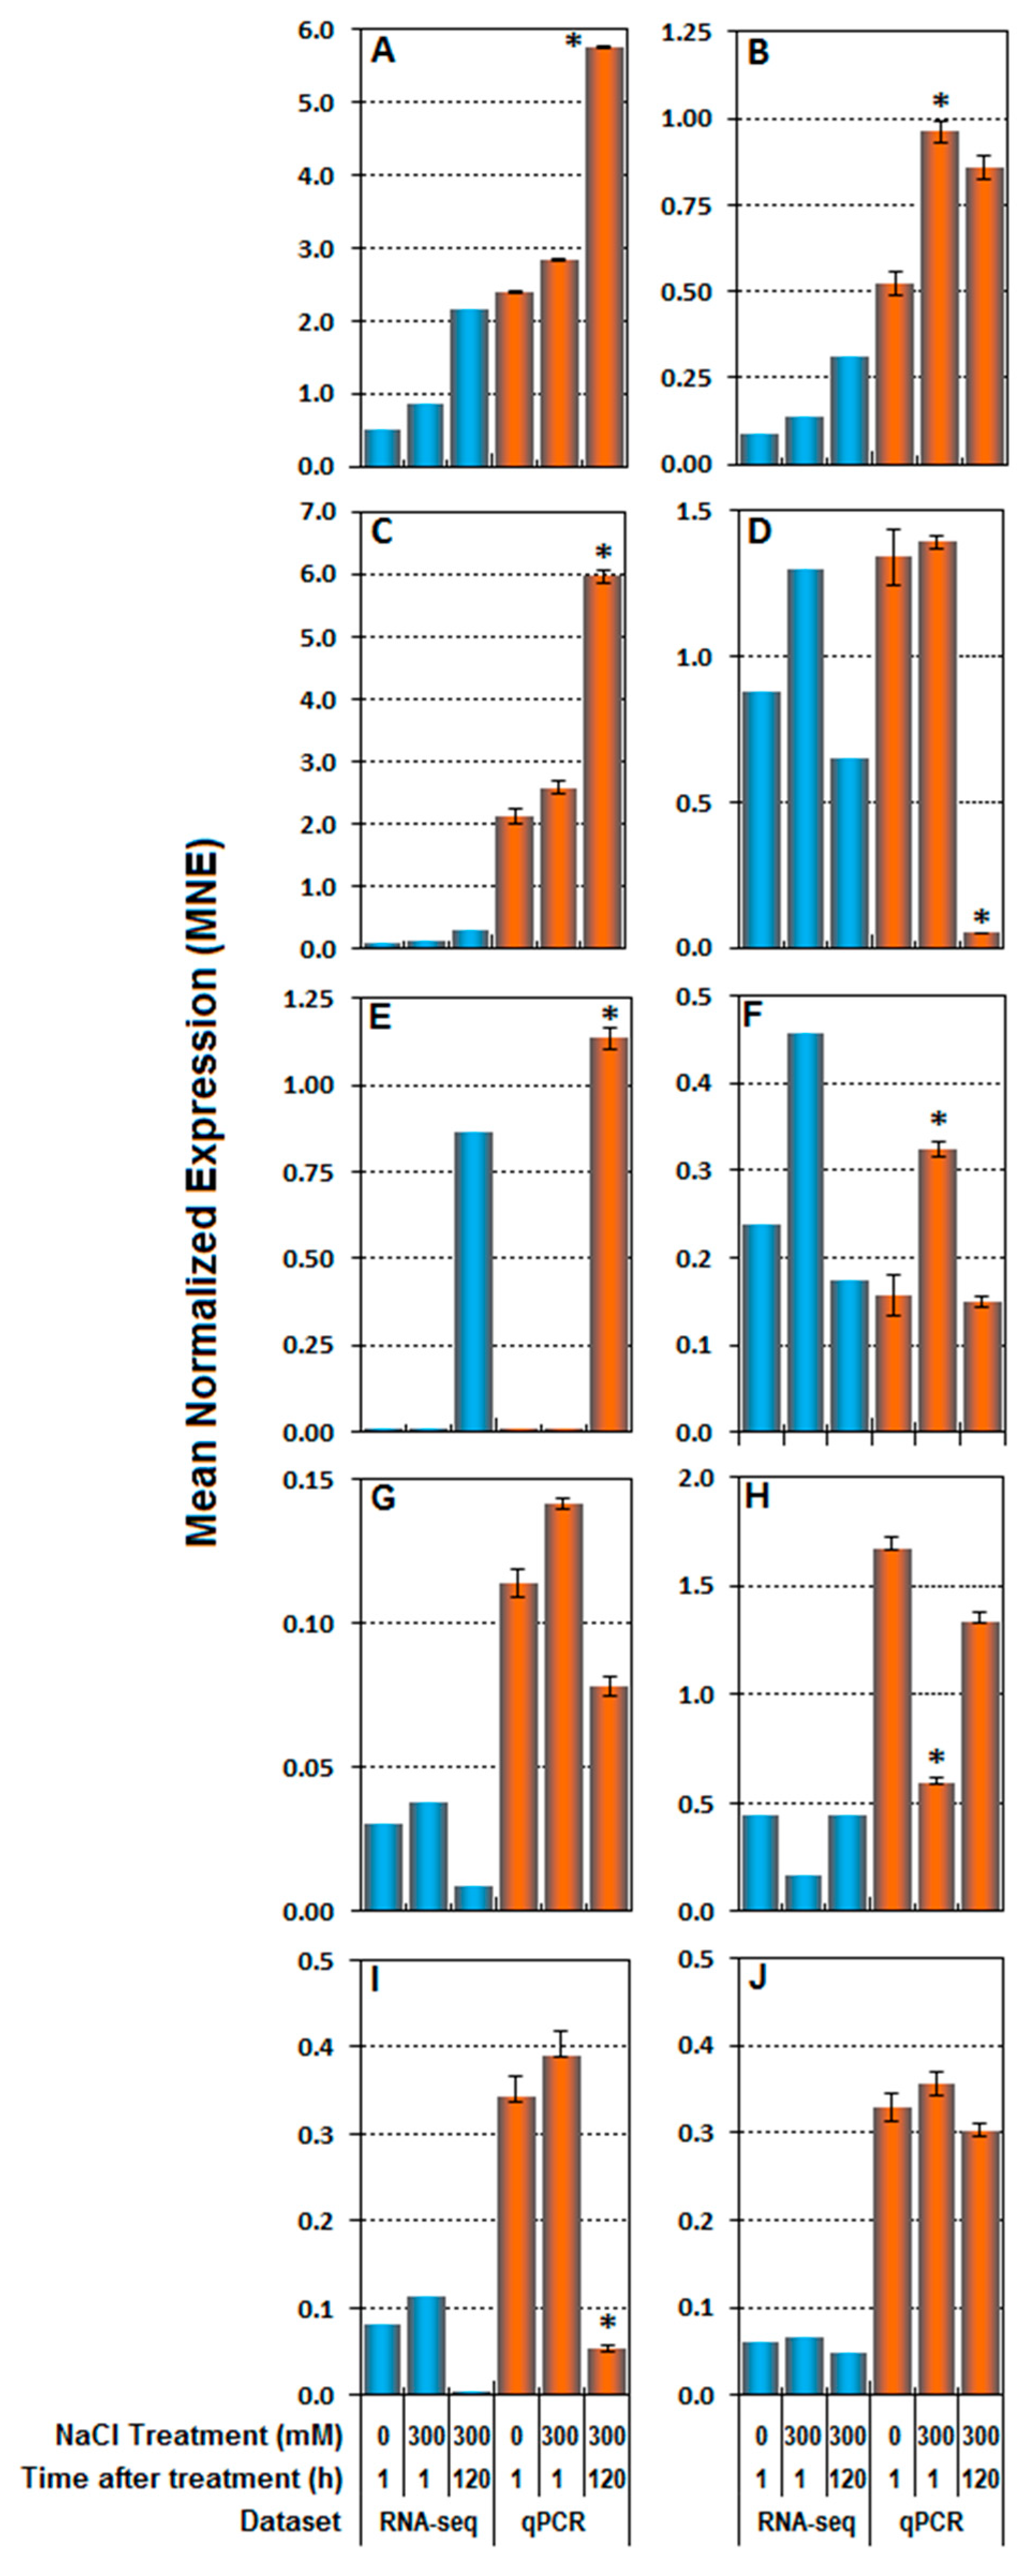
3.3. RNA-seq Validation by Real-Time RT-qPCR
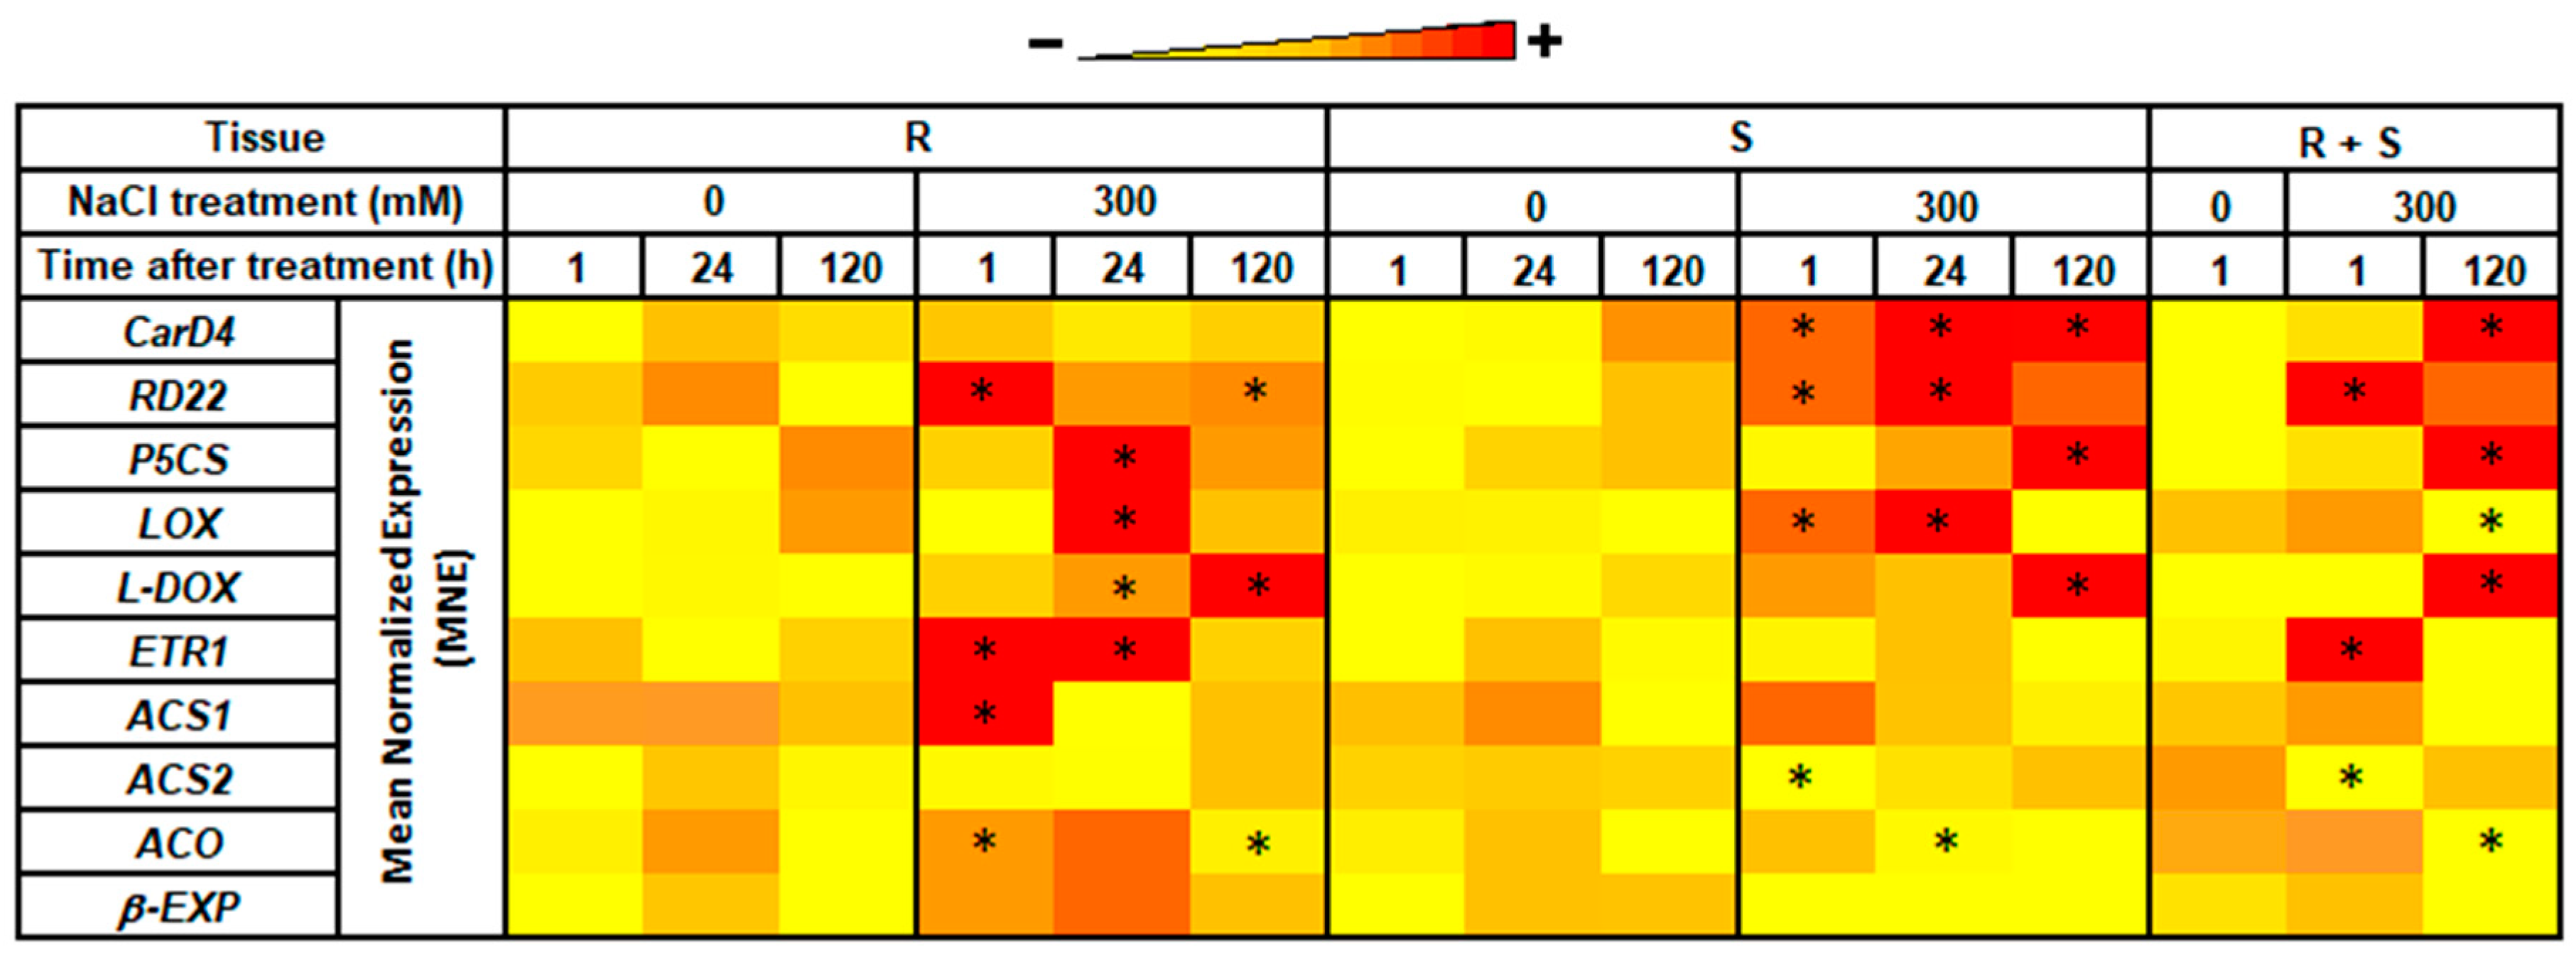
3.4. Expression Levels in Roots vs. Shoots
4. Discussion
4.1. Salinity Induces Transcriptome-Wide Changes in Quinoa
4.2. Comprehensive Analysis of DEGs induced by Salt Stress and Biological Insight
5. Conclusions
Supplementary Materials
Author Contributions
Funding
Acknowledgments
Conflicts of Interest
References
- Abugoch, L. Chapter 1 Quinoa (Chenopodium quinoa Willd.). Adv. Food Nutr. Res. 2009, 58, 1–31. [Google Scholar] [CrossRef]
- Graf, B.L.; Rojas Silva, P.; Rojo, L.E.; Delatorre Herrera, J.; Baldeón, M.E.; Raskin, I. Innovations in health value and functional food development of quinoa (Chenopodium quinoa Willd.). Compr. Rev. Food. Sci. Food Saf 2015, 14, 431–445. [Google Scholar] [CrossRef] [PubMed]
- Sun, Y.; Liu, F.; Bendevis, M.; Shabala, S.; Jacobsen, S.E. Sensitivity of two quinoa (Chenopodium quinoa Willd.) varieties to progressive drought stress. J. Agron. Crop Sci. 2014, 200, 12–23. [Google Scholar] [CrossRef]
- Ruiz, K.B.; Biondi, S.; Martínez, E.A.; Orsini, F.; Antognoni, F.; Jacobsen, S.E. Quinoa–a model crop for understanding salt-tolerance mechanisms in halophytes. Plant Biosyst. Int. J. Deal. All Asp. Plant Biol. 2016, 150, 357–371. [Google Scholar] [CrossRef]
- Ruiz, K.B.; Biondi, S.; Oses, R.; Acuña-Rodríguez, I.S.; Antognoni, F.; Martínez-Mosqueira, E.A.; Coulibaly, A.; Canahua-Murillo, A.; Pinto, M.; Zurita-Silva, A.; et al. Quinoa biodiversity and sustainability for food security under climate change. A review. Agron. Sustain. Dev. 2014, 34, 349–359. [Google Scholar] [CrossRef]
- De Ron, A.M.; Sparvoli, F.; Pueyo, J.J.; Bazile, D. Protein crops: Food and feed for the future. Front. Plant Sci. 2017, 8, 105. [Google Scholar] [CrossRef]
- Pizarro, R.; Martínez, E. Mercado Real y Potencial de la Quínoa en Chile. Tierra Adentro—Edición Especial 2015, 108, 74–78. Available online: http://biblioteca.inia.cl/medios/biblioteca/ta/TA108.pdf (accessed on 7 December 2019).
- Ruiz, K.B.; Rapparini, F.; Bertazza, G.; Silva, H.; Torrigiani, P.; Biondi, S. Comparing salt-induced responses at the transcript level in a salares and coastal-lowlands landrace of quinoa (Chenopodium quinoa Willd). Environ. Exp. Bot. 2017, 139, 127–142. [Google Scholar] [CrossRef]
- Schmöckel, S.M.; Lightfoot, D.J.; Razali, R.; Tester, M.; Jarvis, D.E. Identification of putative transmembrane proteins Involved in Salinity Tolerance in Chenopodium quinoa by Integrating Physiological Data, RNAseq, and SNP Analyses. Front. Plant Sci. 2017, 8, 1023. [Google Scholar] [CrossRef]
- Maughan, P.J.; Turner, T.B.; Coleman, C.E.; Elzinga, D.B.; Jellen, E.N.; Morales, J.A.; Udall, J.A.; Fairbanks, D.J.; Bonifacio, A. Characterization of Salt overly sensitive 1 (SOS1) gene homoeologs in quinoa (Chenopodium quinoa Willd.). Genome 2009, 52, 647–657. [Google Scholar] [CrossRef]
- Ruiz-Carrasco, K.; Antognoni, F.; Coulibaly, A.K.; Lizardi, S.; Covarrubias, A.; Martinez, E.A.; Molina-Montenegro, M.A.; Biondi, S.; Zurita-Silva, A. Variation in salinity tolerance of four lowland genotypes of quinoa (Chenopodium quinoa Willd.) as assessed by growth, physiological traits, and sodium transporter gene expression. Plant Physiol. Biochem. 2011, 49, 1333–1341. [Google Scholar] [CrossRef] [PubMed]
- Yasui, Y.; Hirakawa, H.; Oikawa, T.; Toyoshima, M.; Matsuzaki, C.; Ueno, M.; Mizuno, N.; Nagatoshi, Y.; Imamura, T.; Miyago, M.; et al. Draft genome sequence of an inbred line of Chenopodium quinoa, an allotetraploid crop with great environmental adaptability and outstanding nutritional properties. DNA Res. 2016, 23, 535–546. [Google Scholar] [CrossRef] [PubMed]
- Jarvis, D.E.; Ho, Y.S.; Lightfoot, D.J.; Schmöckel, S.M.; Li, B.; Borm, T.J.; Ohyanagi, H.; Mineta, K.; Michell, C.T.; Saber, N.; et al. The genome of Chenopodium quinoa. Nature 2017, 542, 307–312. [Google Scholar] [CrossRef] [PubMed]
- Bazile, D.; Thomet, M. El aporte de las comunidades indígenas y locales a la conservación de la quínoa. Tierra Adentro 2015, 108, 22–27. [Google Scholar]
- Morales, A.; Zurita-Silva, A.; Maldonado, J.; Silva, H. Transcriptional responses of Chilean quinoa (Chenopodium quinoa Willd.) under water deficit conditions uncovers ABA-independent expression patterns. Front. Plant Sci. 2017, 8, 216. [Google Scholar] [CrossRef]
- Raney, J.; Reynolds, D.; Elzinga, D.; Page, J.; Udall, J.A.; Jellen, E.N.; Bonfacio, A.; Fairbanks, D.J.; Maughan, P.J. Transcriptome analysis of drought induced stress in Chenopodium quinoa. Am. J. Plant Sci. 2014, 5, 338–357. [Google Scholar] [CrossRef]
- Ruiz, K.B.; Aloisi, I.; Del Duca, S.; Canelo, V.; Torrigiani, P.; Silva, H.; Biondi, S. Salares versus coastal ecotypes of quinoa: Salinity responses in Chilean landraces from contrasting habitats. Plant Physiol. Biochem. 2016, 101, 1–13. [Google Scholar] [CrossRef]
- Taji, T.; Seki, M.; Satou, M.; Sakurai, T.; Kobayashi, M.; Ishiyama, K.; Narusaka, Y.; Narusaka, M.; Zhu, J.K.; Shinozaki, K. Comparative genomics in salt tolerance between Arabidopsis and Arabidopsis-related halophyte salt cress using Arabidopsis microarray. Plant Physiol. 2004, 135, 1697–1709. [Google Scholar] [CrossRef]
- Gong, Q.; Li, P.; Ma, S.; Indu Rupassara, S.; Bohnert, H.J. Salinity stress adaptation competence in the extremophile Thellungiella halophila in comparison with its relative Arabidopsis thaliana. Plant J. 2005, 44, 826–839. [Google Scholar] [CrossRef]
- Himabundi, Y.; Chakradhar, T.; Reddy, M.C.; Kanygin, A.; Redding, K.E.; Chandrasekhar, T. Salt-tolerant genes from halophytes are potential key players of salt tolerance in glycophytes. Environ. Exp. Bot. 2016, 124, 39–63. [Google Scholar] [CrossRef]
- Chang, S.; Puryear, J.; Cairney, J.A. Simple and efficient method for isolating RNA from pine trees. Plant Mol. Biol. Rep. 1993, 11, 113–116. [Google Scholar] [CrossRef]
- Kal, A.J.; van Zonneveld, A.J.; Benes, V.; van den Berg, M.; Koerkamp, M.G.; Albermann, K.; Strack, N.; Ruijter, J.M.; Richter, A.; Dujon, B.; et al. Dynamics of gene expression revealed by comparison of serial analysis of gene expression transcript profiles from yeast grown on two different carbon sources. Mol. Biol. Cell 1999, 10, 1859–1872. [Google Scholar] [CrossRef] [PubMed]
- Hansen, K.D.; Irizarry, R.A.; Wu, Z. Removing technical variability in RNA-seq data using conditional quantile normalization. Biostatistics 2012, 13, 204–216. [Google Scholar] [CrossRef] [PubMed]
- Dillies, M.A.; Rau, A.; Aubert, J.; Hennequet-Antier, C.; Jeanmougin, M.; Servant, N.; Keime, C.; Marot, G.; Castel, D.; Estelle, J.; et al. A comprehensive evaluation of normalization methods for Illumina high-throughput RNA sequencing data analysis. Brief. Bioinform. 2013, 14, 671–683. [Google Scholar] [CrossRef]
- Conesa, A.; Gotz, S. Blast2GO: A comprehensive suite for functional analysis in plant genomics. Int. J. Plant Genom. 2008, 2008, 619832. [Google Scholar] [CrossRef]
- Altschul, S.F.; Gish, W.; Miller, W.; Myers, E.W.; Lipman, D.J. Basic local alignment search tool. J. Mol. Biol. 1990, 215, 403–410. [Google Scholar] [CrossRef]
- Hunter, S.; Apweiler, R.; Attwood, T.K.; Bairoch, A.; Bateman, A.; Binns, D.; Bork, P.; Das, U.; Daugherty, L.; Duquenne, L.; et al. InterPro: The integrative protein signature database. Nucleic Acids Res. 2009, 37, D211–D215. [Google Scholar] [CrossRef]
- Di Rienzo, J.A.; Casanoves, F.; Balzarini, M.G.; Gonzalez, L.; Tablada, M.; Robledo, C.W. InfoStat versión Grupo InfoStat; FCA; Universidad Nacional de Córdoba: Argentina, South America, 2015; Available online: http://www.infostat.com.ar (accessed on 7 December 2019).
- Delatorre, J.; Salinas, A.; Sánchez, M. Revista Agricultura Del Desierto; Cultivo de la Quinua: Iquique, Chile, 2008; p. 111. ISSN 0717-2769. [Google Scholar]
- García, M.; Raes, D.; Jacobsen, S.E.; Michel, T. Agroclimatic constraints for rainfed agriculture in the Bolivian altiplano. J. Arid. Environ. 2007, 71, 109–121. [Google Scholar] [CrossRef]
- Gandarillas, A.; Saravia, R.; Plata, G.; Quispe, R.; Ortiz-Romero, R. Quinoa in Chile. In State of the Art Report of Quinoa in the World in 2013; Bazile, D., Bertero, H.D., Nieto, C., Eds.; FAO and CIRAD: Rome, Italy, 2015; pp. 401–421. ISBN 978-92-5-108558-5. [Google Scholar]
- Adolf, V.I.; Shabala, S.; Andersen, M.N.; Razzaghi, F.; Jacobsen, S.E. Varietal differences of quinoa’s tolerance to saline conditions. Plant Soil 2012, 357, 117–129. [Google Scholar] [CrossRef]
- Matsui, A.; Ishida, J.; Morosawa, T.; Mochizuki, Y.; Kaminuma, E.; Endo, T.A.; Okamoto, M.; Nambara, E.; Nakajima, M.; Kawashima, M. Arabidopsis transcriptome analysis under drought, cold, high-salinity and ABA treatment conditions using a tiling array. Plant Cell Physiol. 2008, 49, 1135–1149. [Google Scholar] [CrossRef]
- Lei, Y.; Xu, Y.; Hettenhausen, C.; Lu, C.; Shen, G.; Zhang, C.; Li, J.; Song, J.; Lin, H.; Wu, J. Comparative analysis of alfalfa (Medicago sativa L.) leaf transcriptomes reveals genotype-specific salt tolerance mechanisms. BMC Plant Biol. 2018, 18, 35. [Google Scholar] [CrossRef] [PubMed]
- Wang, G.L.; Ren, X.Q.; Liu, J.X.; Yang, F.; Wang, Y.P.; Xiong, A.S. Transcript profiling reveals an important role of cell wall remodeling and hormone signaling under salt stress in garlic. Plant Physiol. Biochem. 2019, 135, 87–98. [Google Scholar] [CrossRef] [PubMed]
- Mantri, N.L.; Ford, R.; Coram, T.E.; Pang, E.C. Transcriptional profiling of chickpea genes differentially regulated in response to high-salinity, cold and drought. BMC Genom. 2007, 8, 303. [Google Scholar] [CrossRef] [PubMed]
- Wang, W.S.; Zhao, X.Q.; Li, M.; Huang, L.Y.; Xu, J.L.; Zhang, F.; Cui, Y.R.; Fu, B.Y.; Li, Z.K. Complex molecular mechanisms underlying seedling salt tolerance in rice revealed by comparative transcriptome and metabolomic profiling. J. Exp. Bot. 2015, 67, 405–419. [Google Scholar] [CrossRef] [PubMed]
- Chai, W.W.; Wang, W.Y.; Ma, Q.; Yin, H.J.; Hepworth, S.; Wang, S.M. Comparative transcriptome analysis reveals unique genetic adaptations conferring salt tolerance in a xerohalophyte. Funct. Plant Biol. 2019, 46, 670–683. [Google Scholar] [CrossRef] [PubMed]
- Peng, Z.; He, S.; Gong, W.; Sun, J.; Pan, Z.; Xu, F.; Lu, Y.; Du, X. Comprehensive analysis of differentially expressed genes and transcriptional regulation induced by salt stress in two contrasting cotton genotypes. BMC Genom. 2014, 15, 760. [Google Scholar] [CrossRef]
- Antognoni, F.; Faudale, M.; Poli, F.; Biondi, S. Methyl jasmonate differentially affects tocopherol content and tyrosine amino transferase activity in cultured cells of Amaranthus caudatus and Chenopodium quinoa. Plant Biol. 2009, 11, 161–169. [Google Scholar] [CrossRef]
- Aloisi, I.; Parrotta, L.; Ruiz, K.B.; Landi, C.; Bini, L.; Cai, G.; Biondi, S.; Del Duca, S. New insight into quinoa seed quality under salinity: Changes in proteomic and amino acid profiles, phenolic content, and antioxidant activity of protein extracts. Front. Plant Sci. 2016, 7, 656. [Google Scholar] [CrossRef]
- Yang, J.; Yen, H.E. Early salt stress effects on the changes in chemical composition in leaves of ice plant and Arabidopsis. A Fourier transform infrared spectroscopy study. Plant Physiol. 2002, 130, 1032–1042. [Google Scholar] [CrossRef]
- Le Gall, H.; Philippe, F.; Domon, J.M.; Gillet, F.; Pelloux, J.; Rayon, C. Cell wall metabolism in response to abiotic stress. Plants 2015, 4, 112–166. [Google Scholar] [CrossRef]
- Li, H.; Yan, S.; Zhao, L.; Tan, J.; Zhang, Q.; Gao, F.; Wang, P.; Hou, H.; Li, L. Histone acetylation associated up-regulation of the cell wall related genes is involved in salt stress induced maize root swelling. BMC Plant Biol. 2014, 14, 105. [Google Scholar] [CrossRef] [PubMed]
- Shen, X.; Wang, Z.; Song, X.; Xu, J.; Jiang, C.; Zhao, Y.; Ma, C.; Zhang, H. Transcriptomic profiling revealed an important role of cell wall remodeling and ethylene signaling pathway during salt acclimation in Arabidopsis. Plant Mol. Biol. 2014, 86, 303–317. [Google Scholar] [CrossRef] [PubMed]
- Rozema, J. Growth, water and ion relationships of halophytic monocotyledonae and dicotyledonae; a unified concept. Aquat. Bot. 1991, 39, 17–33. [Google Scholar] [CrossRef]
- James, R.A.; Munns, R.; Von Caemmerer, S.; Trejo, C.; Miller, C.; Condon, T. Photosynthetic capacity is related to the cellular and subcellular partitioning of Na+, K+ and Cl− in salt-affected barley and durum wheat. Plant Cell Environ. 2006, 29, 2185–2197. [Google Scholar] [CrossRef]
- Touchette, B.W. Seagrass-salinity interactions: Physiological mechanisms used by submersed marine angiosperms for a life at sea. J. Exp. Mar. Biol. Ecol. 2007, 350, 194–215. [Google Scholar] [CrossRef]
- Cosgrove, D.J. Loosening of plant cell walls by expansins. Nature 2000, 407, 321–326. [Google Scholar] [CrossRef]
- Chen, Y.; Zhang, B.; Li, C.; Lei, C.; Kong, C.; Yang, Y.; Gong, M. A comprehensive expression analysis of the expansin gene family in potato (Solanum tuberosum) discloses stress-responsive expansin-like B genes for drought and heat tolerances. PLoS ONE 2019, 14, e0219837. [Google Scholar] [CrossRef]
- Buchanan, C.D.; Lim, S.; Salzman, R.A.; Kagiampakis, I.; Morishige, D.T.; Weers, B.D. Sorghum bicolor’s transcriptome response to dehydration, high salinity and ABA. Plant Mol. Biol. 2005, 58, 699–720. [Google Scholar] [CrossRef]
- Pitann, B.; Zörb, C.; Mühling, K.H. Comparative proteome analysis of maize (Zea mays L.) expansins under salinity. J. Plant Nutr. Soil Sci. 2009, 172, 75–77. [Google Scholar] [CrossRef]
- Geilfus, C.M.; Zörb, C.; Mühling, K.H. Salt stress differentially affects growth-mediating β-expansins in resistant and sensitive maize (Zea mays L.). Plant Physiol. Biochem. 2010, 48, 993–998. [Google Scholar] [CrossRef]
- Adolf, V.I.; Jacobsen, S.E.; Shabala, S. Salt tolerance mechanisms in quinoa (Chenopodium quinoa Willd.). Environ. Exp. Bot. 2013, 92, 43–54. [Google Scholar] [CrossRef]
- Brandi, F.; Bar, E.; Mourgues, F.; Horvath, G.; Turcsi, E.; Giuliano, G.; Liverani, A.; Tartarini, S.; Lewinsohn, E.; Rosati, C. Study of ‘Redhaven’ peach and its white-fleshed mutant suggests a key role of CCD4 carotenoid dioxygenase in carotenoid and nor-isoprenoid volatile metabolism. BMC Plant Biol. 2011, 11, 24. [Google Scholar] [CrossRef] [PubMed]
- Ohmiya, A.; Kishimoto, S.; Aida, R.; Yoshioka, S.; Sumitomo, K. Carotenoid cleavage dioxygenase (CmCCD4a) contributes to white color formation in Chrysanthemum petals. Plant Physiol. 2006, 142, 1193–1201. [Google Scholar] [CrossRef] [PubMed]
- Huang, F.C.; Molnár, P.; Schwab, W. Cloning and functional characterization of carotenoid cleavage dioxygenase 4 genes. J. Exp. Bot. 2009, 60, 3011–3022. [Google Scholar] [CrossRef]
- Walter, M.H.; Strack, D. Carotenoids and their cleavage products: Biosynthesis and functions. Nat. Prod. Rep. 2011, 28, 663–692. [Google Scholar] [CrossRef]
- Zheng, X.; Xie, Z.; Zhu, K.; Xu, Q.; Deng, X.; Pan, Z. Isolation and characterization of carotenoid cleavage dioxygenase 4 genes from different citrus species. Mol. Genet. Genom. 2015, 290, 1589–1603. [Google Scholar] [CrossRef]
- Tan, B.C.; Joseph, L.M.; Deng, W.T.; Liu, L.; Li, Q.B.; Cline, K.; McCarty, D.R. Molecular characterization of the Arabidopsis 9-cis epoxycarotenoid dioxygenase gene family. Plant J. 2003, 35, 44–56. [Google Scholar] [CrossRef]
- Rubio, A.; Rambla, J.L.; Santaella, M.; Gómez, M.D.; Orzaez, D.; Granell, A.; Gómez-Gómez, L. Cytosolic and plastoglobule-targeted carotenoid dioxygenases from Crocus sativus are both involved in beta-ionone release. J. Biol. Chem. 2008, 283, 24816–24825. [Google Scholar] [CrossRef]
- Rubio-Moraga, A.; Rambla, J.L.; Fernández-de-Carmen, A.; Trapero-Mozos, A.; Ahrazem, O.; Orzáez, D.; Granell, A.; Gómez-Gómez, L. New target carotenoids for CCD4 enzymes are revealed with the characterization of a novel stress-induced carotenoid cleavage dioxygenase gene from Crocus sativus. Plant Mol. Biol. 2014, 86, 555–569. [Google Scholar] [CrossRef]
- Hanana, M.; Deluc, L.; Fouquet, R.; Daldoul, S.; Leon, C.; Barrieu, F.; Ghorbel, A.; Mliki, A.; Hamdi, S. Identification and characterization of “rd22” dehydration responsive gene in grapevine (Vitis vinifera L.). Compets R Biol. 2008, 331, 569–578. [Google Scholar] [CrossRef]
- Nakashima, K.; Yamaguchi-Shinozaki, K.; Shinozaki, K. The transcriptional regulatory network in the drought response and its crosstalk in abiotic stress responses including drought, cold, and heat. Front. Plant Sci. 2014, 5, 170. [Google Scholar] [CrossRef] [PubMed]
- Acosta, I.F.; Farmer, E.E. Jasmonates. In Arabidopsis Book; American Society of Plant Biologist, BioOne Complete: Washington, DC, USA, 2010; Available online: https://doi.org/10.1199/tab.0129 (accessed on 7 December 2019).
- Hwang, I.S.; Hwang, B.K. The pepper 9-lipoxygenase gene CaLOX1 functions in defense and cell death responses to microbial pathogens. Plant Physiol. 2010, 152, 948–967. [Google Scholar] [CrossRef] [PubMed]
- Lim, C.W.; Han, S.W.; Hwang, I.S.; Kim, D.S.; Hwang, B.K.; Lee, S.C. The pepper lipoxygenase CaLOX1 plays a role in osmotic, drought and high salinity stress response. Plant Cell Physiol. 2015, 56, 930–942. [Google Scholar] [CrossRef] [PubMed]
- Dang, Z.H.; Zheng, L.L.; Wang, J.; Gao, Z.; Wu, S.B.; Qi, Z.; Wang, Y.C. Transcriptomic profiling of the salt-stress response in the wild recretohalophyte Reaumuria trigyna. BMC Genom. 2013, 14, 397–402. [Google Scholar] [CrossRef]
- Berli, F.J.; Fanzone, M.; Piccoli, P.; Bottini, R. Solar UV-B and ABA are involved in phenol metabolism of Vitis vinifera L. increasing biosynthesis of berry skin polyphenols. J. Agric. Food Chem. 2011, 59, 4874–4884. [Google Scholar] [CrossRef]
- Zhang, H.; Du, C.; Wang, Y.; Wang, J.; Zheng, L.; Wang, Y. The Reaumuria trigyna leucoanthocyanidin dioxygenase (RtLDOX) gene complements anthocyanidin synthesis and increases the salt tolerance potential of a transgenic Arabidopsis LDOX mutant. Plant Physiol. Biochem. 2016, 106, 278–287. [Google Scholar] [CrossRef]
- Dou, L.; He, K.; Higaki, T.; Wang, X.; Mao, T. Ethylene signaling modulates cortical microtubule reassembly in response to salt stress. Plant Physiol. 2018, 176, 2071–2081. [Google Scholar] [CrossRef]
- Prerostova, S.; Dobrev, P.I.; Gaudinova, A.; Hosek, P.; Soudek, P.; Knirsch, V.; Vankova, R. Hormonal dynamics during salt stress responses of salt-sensitive Arabidopsis thaliana and salt-tolerant Thellungiella salsuginea. Plant Sci. 2017, 264, 188–198. [Google Scholar] [CrossRef]
- Zhang, M.; Smith, J.; Harberd, N.P.; Jiang, C. The regulatory roles of ethylene and reactive oxygen species (ROS) in plant salt stress responses. Plant Mol. Biol. 2016, 91, 651–659. [Google Scholar] [CrossRef]
- Rong, W.; Qi, L.; Wang, A.; Ye, X.; Du, L.; Liang, H.; Xin, Z.; Zhang, Z. The ERF transcription factor TaERF3 promotes tolerance to salt and drought stresses in wheat. Plant Biotechnol. J. 2014, 12, 468–479. [Google Scholar] [CrossRef]
- Wu, D.; Ji, J.; Wang, G.; Guan, C.; Jin, C. LchERF, a novel ethylene-responsive transcription factor from Lycium chinense, confers salt tolerance in transgenic tobacco. Plant Cell Rep. 2014, 33, 2033–2045. [Google Scholar] [CrossRef]
- Asensi-Fabado, M.A.; Cela, J.; Müller, M.; Arrom, L.; Chang, C.; Munné-Bosch, S. Enhanced oxidative stress in the ethylene-insensitive (ein3-1) mutant of Arabidopsis thaliana exposed to salt stress. J. Plant Physiol. 2012, 169, 360–368. [Google Scholar] [CrossRef]
- Nikalje, G.D.; Nikam, T.; Suprasanna, P. Looking at halophytic adaptation to high salinity through genomics landscape. Curr. Genom. 2017, 18, 542–552. [Google Scholar] [CrossRef]
- Gharbi, E.; Martínez, J.P.; Benahmed, H.; Fauconnier, M.L.; Lutts, S.; Quinet, M. Salicylic acid differently impacts ethylene and polyamine synthesis in the glycophyte Solanum lycopersicum and the wild-related halophyte Solanum chilense exposed to mild salt stress. Physiol. Plant 2016, 158, 152–167. [Google Scholar] [CrossRef]
- Garg, R.; Shankar, R.; Thakkar, B.; Kudapa, H.; Krishnamurthy, L.; Mantri, N.; Varshney, R.K.; Bhatia, S.; Jain, M. Transcriptome analyses reveal genotype- and developmental stage-specific molecular responses to drought and salinity stresses in chickpea. Sci. Rep. 2016, 6, 19228. [Google Scholar] [CrossRef]
- Patterson, J.H.; Newbigin, E.D.; Tester, M.; Bacic, A.; Roessner, U. Metabolic responses to salt stress of barley (Hordeum vulgare L.) cultivars, Sahara and Clipper, which differ in salinity tolerance. J. Exp. Bot. 2009, 60, 4089–4103. [Google Scholar] [CrossRef]
- Kazachkova, Y.; Eshel, G.; Pantha, P.; Cheeseman, J.M.; Dassanayake, M.; Barak, S. Halophytism: What have we learnt from Arabidopsis thaliana relative model systems? Plant Physiol. 2018, 178, 972–988. [Google Scholar] [CrossRef]
- Cheeseman, J. Food Security in the Face of Salinity, Drought, Climate Change, and Population Growth. In Halophytes for Food Security in Dry Lands; Khan, M.A., Ozturk, M., Gul, B., Ahmed, M.Z., Eds.; Academic Press, Nikki Levy: Waltham, MA, USA, 2016; ISBN 9780128018545. [Google Scholar]
- Bascuñán-Godoy, L.; Sanhueza, C.; Pinto, K.; Cifuentes, L.; Reguera, M.; Briones, V.; Zurita-Silva, A.; Álvarez, R.; Morales, A.; Silva, H. Nitrogen physiology of contrasting genotypes of Chenopodium quinoa Willd. (Amaranthaceae). Sci. Rep. 2018, 8, 17524. [Google Scholar] [CrossRef]


| (Treatment) Time | |||
|---|---|---|---|
| (0) T1 | (300) T1 | (300) T3 | |
| Total Bases | 4,971,425,434 | 4,581,155,576 | 4,883,948,526 |
| Read Count | 49,222,034 | 45,357,976 | 48,355,926 |
| GC (%) | 43.34 | 43.31 | 43.51 |
| Average Length (bp) | 101 | 101 | 101 |
| Inputs Reads | 47,543,290 | 43,853,712 | 46,700,950 |
| Mapped Reads | 34,220,702 | 31,442,862 | 33,862,731 |
| Mapped Rate (%) | 71.98 | 71.7 | 72.51 |
| Q20 (%) | 96.59 | 96.7 | 96.58 |
| Q30 (%) | 91.71 | 91.96 | 91.68 |
| Gene | Gene Ontology (GO) | Annotation | Kal’s Z-test | |||
|---|---|---|---|---|---|---|
| 300) T1 > (0) T1 | (300) T3 > (0) T1 | |||||
| Fold Change | FDR p-Value | Fold Change | FDR p-Value | |||
| AUR62029344-RA | GO:0006355 Regulation of transcription, DNA-templated | NAC domain-containing protein 72 | 2.68 | 0.00 | 2.45 | 0.00 |
| AUR62026261-RA | homeobox-leucine zipper protein HAT5 | 2.90 | 0.00 | 2.49 | 0.00 | |
| AUR62021507-RA | heat stress transcription factor C-1 | 4.06 | 0.00 | 2.50 | 0.00 | |
| AUR62004541-RA | homeobox-leucine zipper protein ATHB-12-like | 4.64 | 0.00 | 5.11 | 0.00 | |
| AUR62023642-RA | ethylene-responsive transcription factor ERF014-like | −3.12 | 0.00 | −4.13 | 0.00 | |
| AUR62004723-RA | ethylene-responsive transcription factor ERF014-like | −2.68 | 0.00 | −3.85 | 0.00 | |
| AUR62025525-RA | ethylene-responsive transcription factor ERF071 | −2.27 | 0.00 | −4.07 | 0.00 | |
| AUR62032882-RA | ethylene-responsive transcription factor ERF021-like | −6.55 | 0.01 | − ∞ | 0.00 | |
| AUR62032288-RA | GO:0006952 Defense response | acidic chitinase | − ∞ | 0.00 | −103.63 | 0.00 |
| AUR62027590-RA | LRR receptor-like serine/threonine-protein kinase FLS2 | −2.59 | 0.00 | −3.27 | 0.00 | |
| AUR62033289-RA | GO:0006950 Response to stress | putative 4-hydroxy-4-methyl-2-oxoglutarate aldolase 3 | 2.79 | 0.00 | 4.93 | 0.00 |
| AUR62037323-RA | universal stress protein A-like protein | 4.57 | 0.00 | 6.98 | 0.00 | |
| AUR62031231-RA | MLP-like protein 43 | 2.14 | 0.00 | 2.37 | 0.00 | |
| AUR62012039-RA | 18 kDa seed maturation protein-like | 3.82 | 0.01 | 14.18 | 0.00 | |
| AUR62021371-RA | putative 4-hydroxy-4-methyl-2-oxoglutarate aldolase 3 | 4.92 | 0.00 | 4.56 | 0.00 | |
| AUR62032222-RA | inhibitor of trypsin and hageman factor-like | −2.81 | 0.00 | −28.13 | 0.00 | |
| AUR62017675-RA | chalcone synthase | −3.16 | 0.00 | −2.70 | 0.00 | |
| AUR62020156-RA | asparagine synthetase [glutamine-hydrolyzing] | −3.70 | 0.00 | −64.32 | 0.00 | |
| AUR62031453-RA | S-type anion channel SLAH2 isoform X3 | −2.35 | 0.00 | −3.15 | 0.00 | |
| AUR62014092-RA | peroxidase 5 | −2.09 | 0.03 | −6.63 | 0.00 | |
| AUR62009744-RA | peroxidase 57 | −2.67 | 0.00 | −10.86 | 0.00 | |
| AUR62030623-RA | GO:0071554 Cell wall organization or biogenesis | expansin A10 | 4.70 | 0.00 | 2.59 | 0.00 |
| AUR62024921-RA | expansin A10 | 4.93 | 0.00 | 2.90 | 0.00 | |
| AUR62002580-RA | polygalacturonase At1g48100 | 2.60 | 0.00 | 2.37 | 0.00 | |
| AUR62018907-RA | xyloglucan endotransglycosylase/hydrolase | −2.36 | 0.00 | −9.18 | 0.00 | |
| AUR62020893-RA | xyloglucan endotransglucosylase/hydrolase 2-like | −3.08 | 0.00 | −3.77 | 0.00 | |
| AUR62024859-RA | xyloglucan endotransglucosylase/hydrolase protein 22-like | −2.40 | 0.00 | −3.17 | 0.00 | |
| AUR62035069-RA | COBRA-like protein 7 | −2.48 | 0.00 | −2.80 | 0.00 | |
| AUR62018602-RA | expansin-A7-like | −3.07 | 0.05 | −3.78 | 0.01 | |
| AUR62018634-RA | Cellulose synthase-like protein D3 | −2.45 | 0.00 | −3.84 | 0.00 | |
| AUR62003130-RA | GO:0009688 Abscisic acid biosynthetic process | nodulin-related protein 1-like | 2.14 | 0.00 | 2.63 | 0.00 |
| AUR62012136-RA | GO:0009737 Response to abscisic acid | protein phosphatase 2C 37-like | 2.10 | 0.00 | 2.03 | 0.00 |
| AUR62023479-RA | abscisic acid receptor PYL9 | 3.14 | 0.00 | 2.10 | 0.00 | |
| AUR62012310-RA | abscisic acid receptor PYL4 | −4.31 | 0.00 | −10.00 | 0.00 | |
| AUR62010485-RA | abscisic acid 8’-hydroxylase 1-like | −3.44 | 0.00 | −3.63 | 0.00 | |
| AUR62022950-RA | abscisic acid receptor PYL4 | −2.38 | 0.00 | −11.05 | 0.00 | |
© 2019 by the authors. Licensee MDPI, Basel, Switzerland. This article is an open access article distributed under the terms and conditions of the Creative Commons Attribution (CC BY) license (http://creativecommons.org/licenses/by/4.0/).
Share and Cite
Ruiz, K.B.; Maldonado, J.; Biondi, S.; Silva, H. RNA-seq Analysis of Salt-Stressed Versus Non Salt-Stressed Transcriptomes of Chenopodium quinoa Landrace R49. Genes 2019, 10, 1042. https://doi.org/10.3390/genes10121042
Ruiz KB, Maldonado J, Biondi S, Silva H. RNA-seq Analysis of Salt-Stressed Versus Non Salt-Stressed Transcriptomes of Chenopodium quinoa Landrace R49. Genes. 2019; 10(12):1042. https://doi.org/10.3390/genes10121042
Chicago/Turabian StyleRuiz, Karina B., Jonathan Maldonado, Stefania Biondi, and Herman Silva. 2019. "RNA-seq Analysis of Salt-Stressed Versus Non Salt-Stressed Transcriptomes of Chenopodium quinoa Landrace R49" Genes 10, no. 12: 1042. https://doi.org/10.3390/genes10121042
APA StyleRuiz, K. B., Maldonado, J., Biondi, S., & Silva, H. (2019). RNA-seq Analysis of Salt-Stressed Versus Non Salt-Stressed Transcriptomes of Chenopodium quinoa Landrace R49. Genes, 10(12), 1042. https://doi.org/10.3390/genes10121042