Genome-Wide Runs of Homozygosity, Effective Population Size, and Detection of Positive Selection Signatures in Six Chinese Goat Breeds

 , ,
, ,
Abstract
1. Introduction
2. Materials and Methods
2.1. Ethics Statement
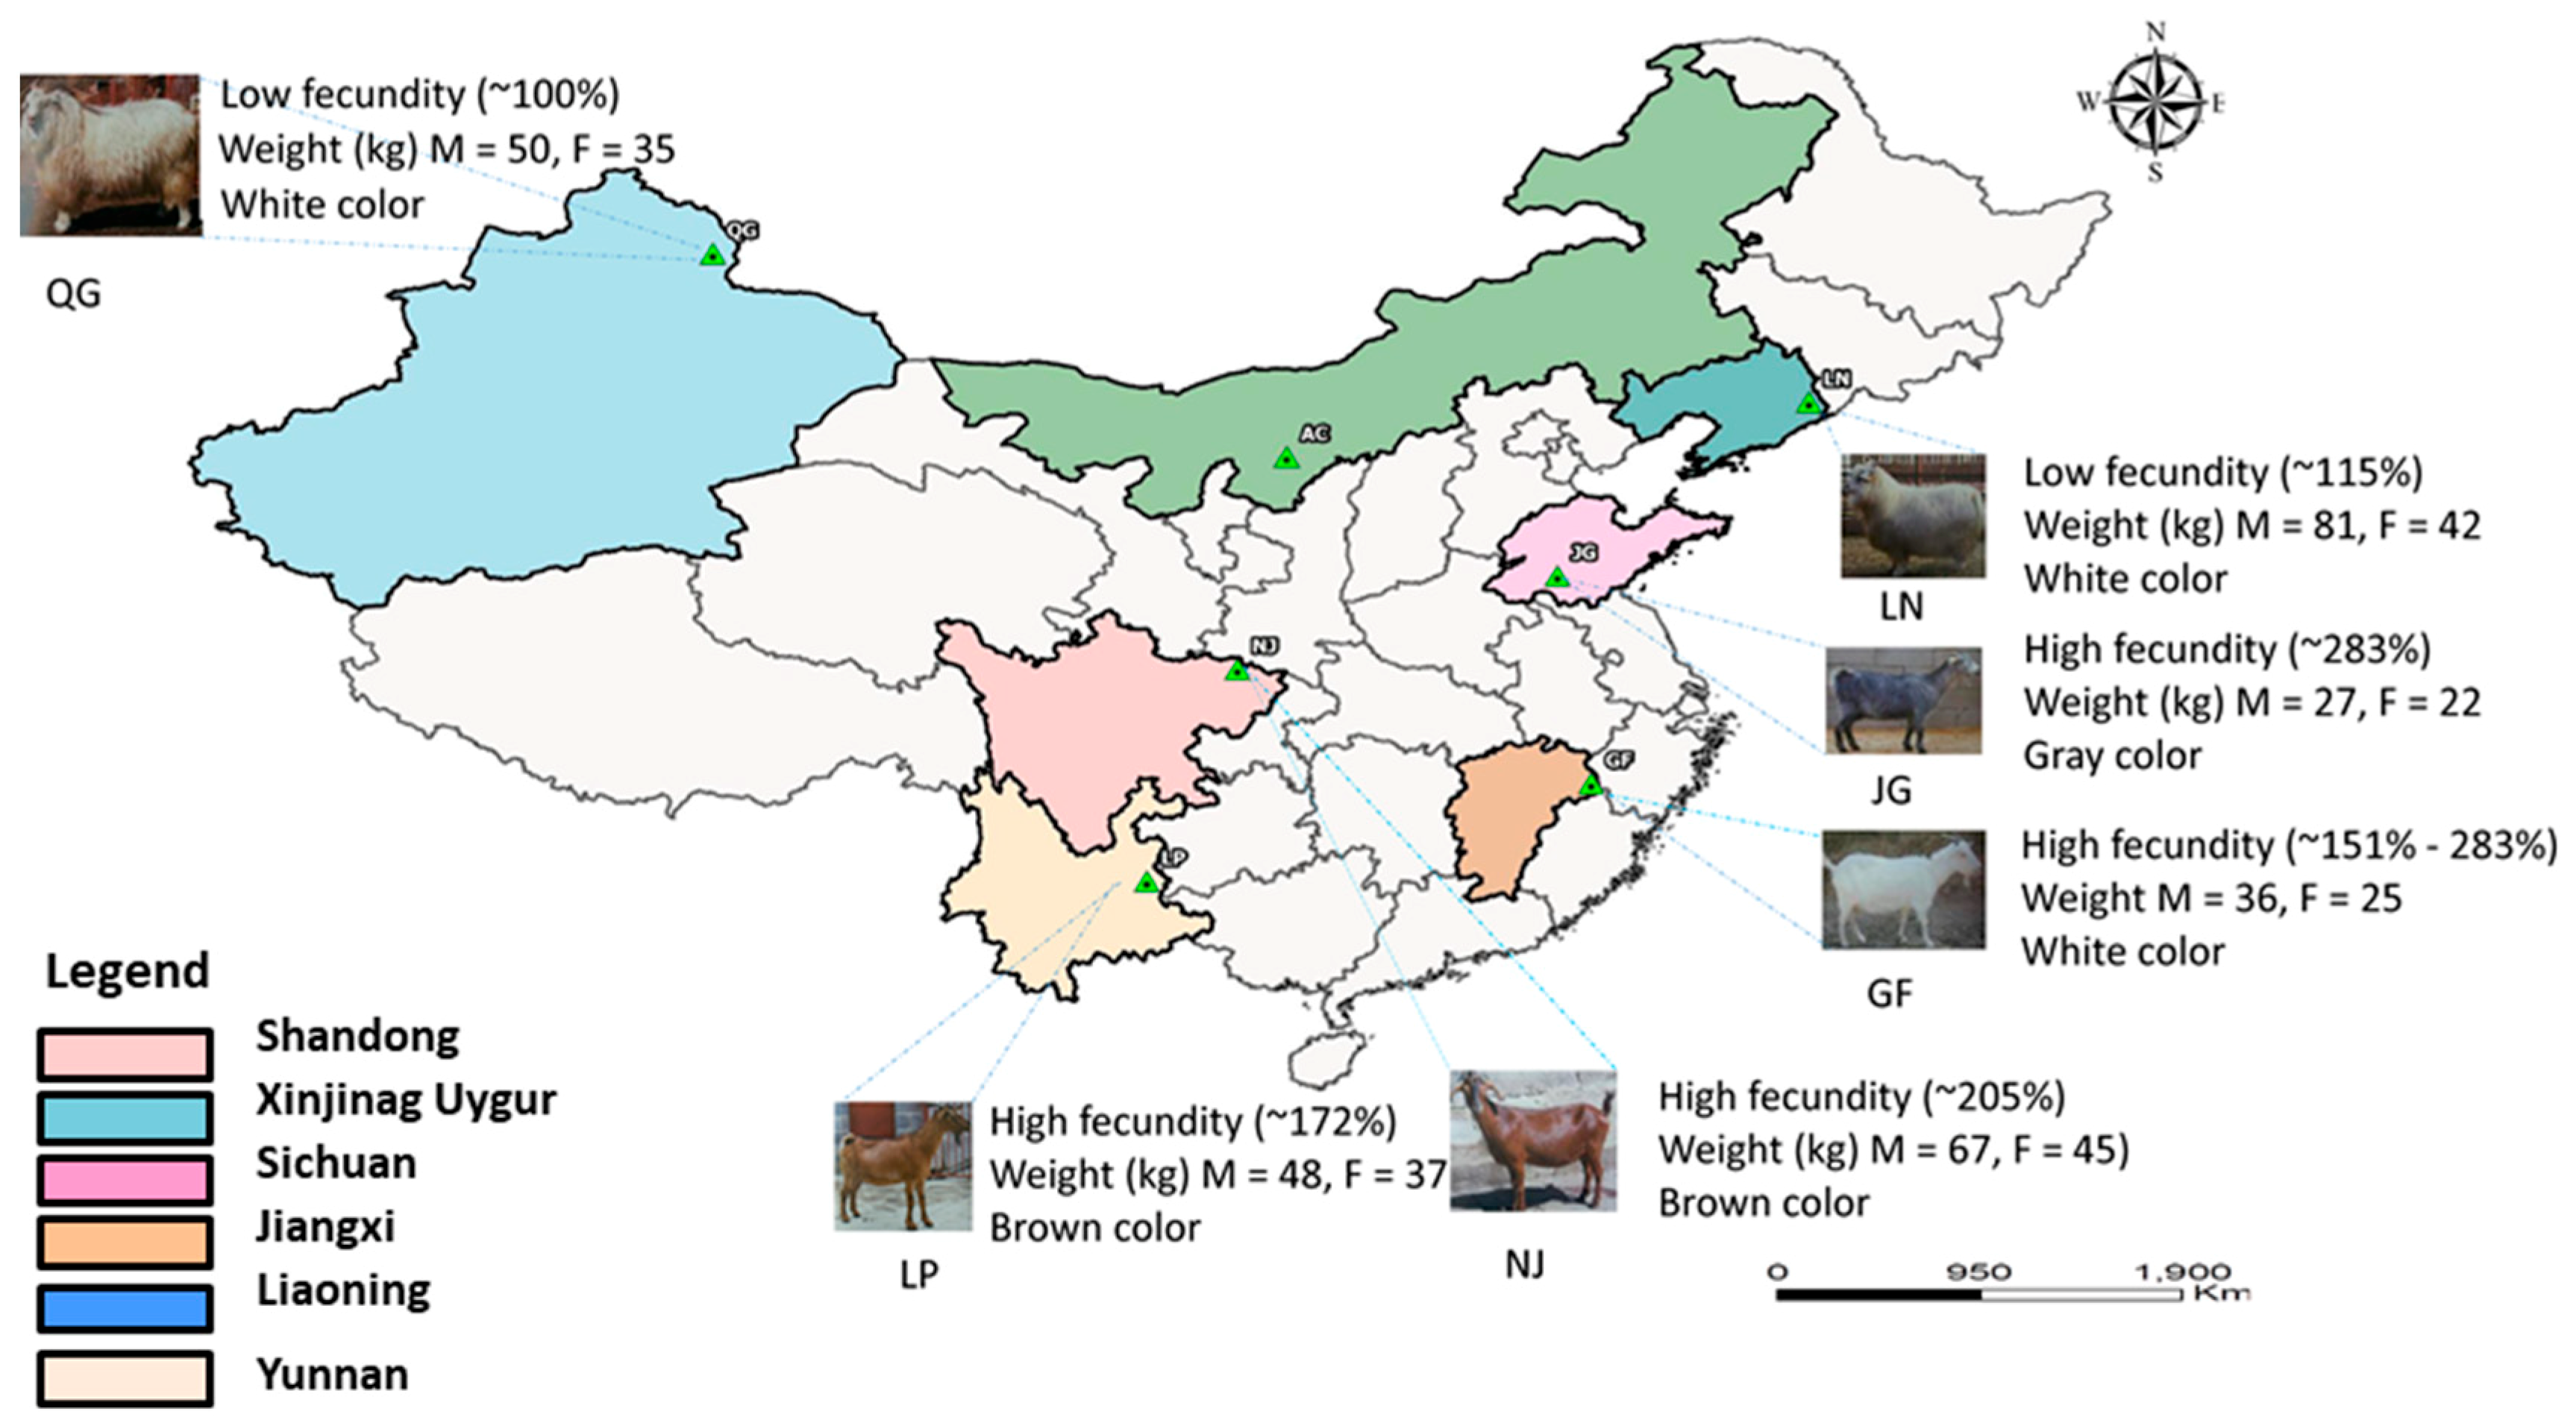
2.2. Sampling and Genotyping
2.3. Data Quality Control
2.4. Detection of Runs of Homozygosity
2.4.1. Distribution of ROH
2.4.2. Inbreeding Coefficient
2.4.3. Detection of Common ROHs
2.5. Homozygosity by Descent (HBD)
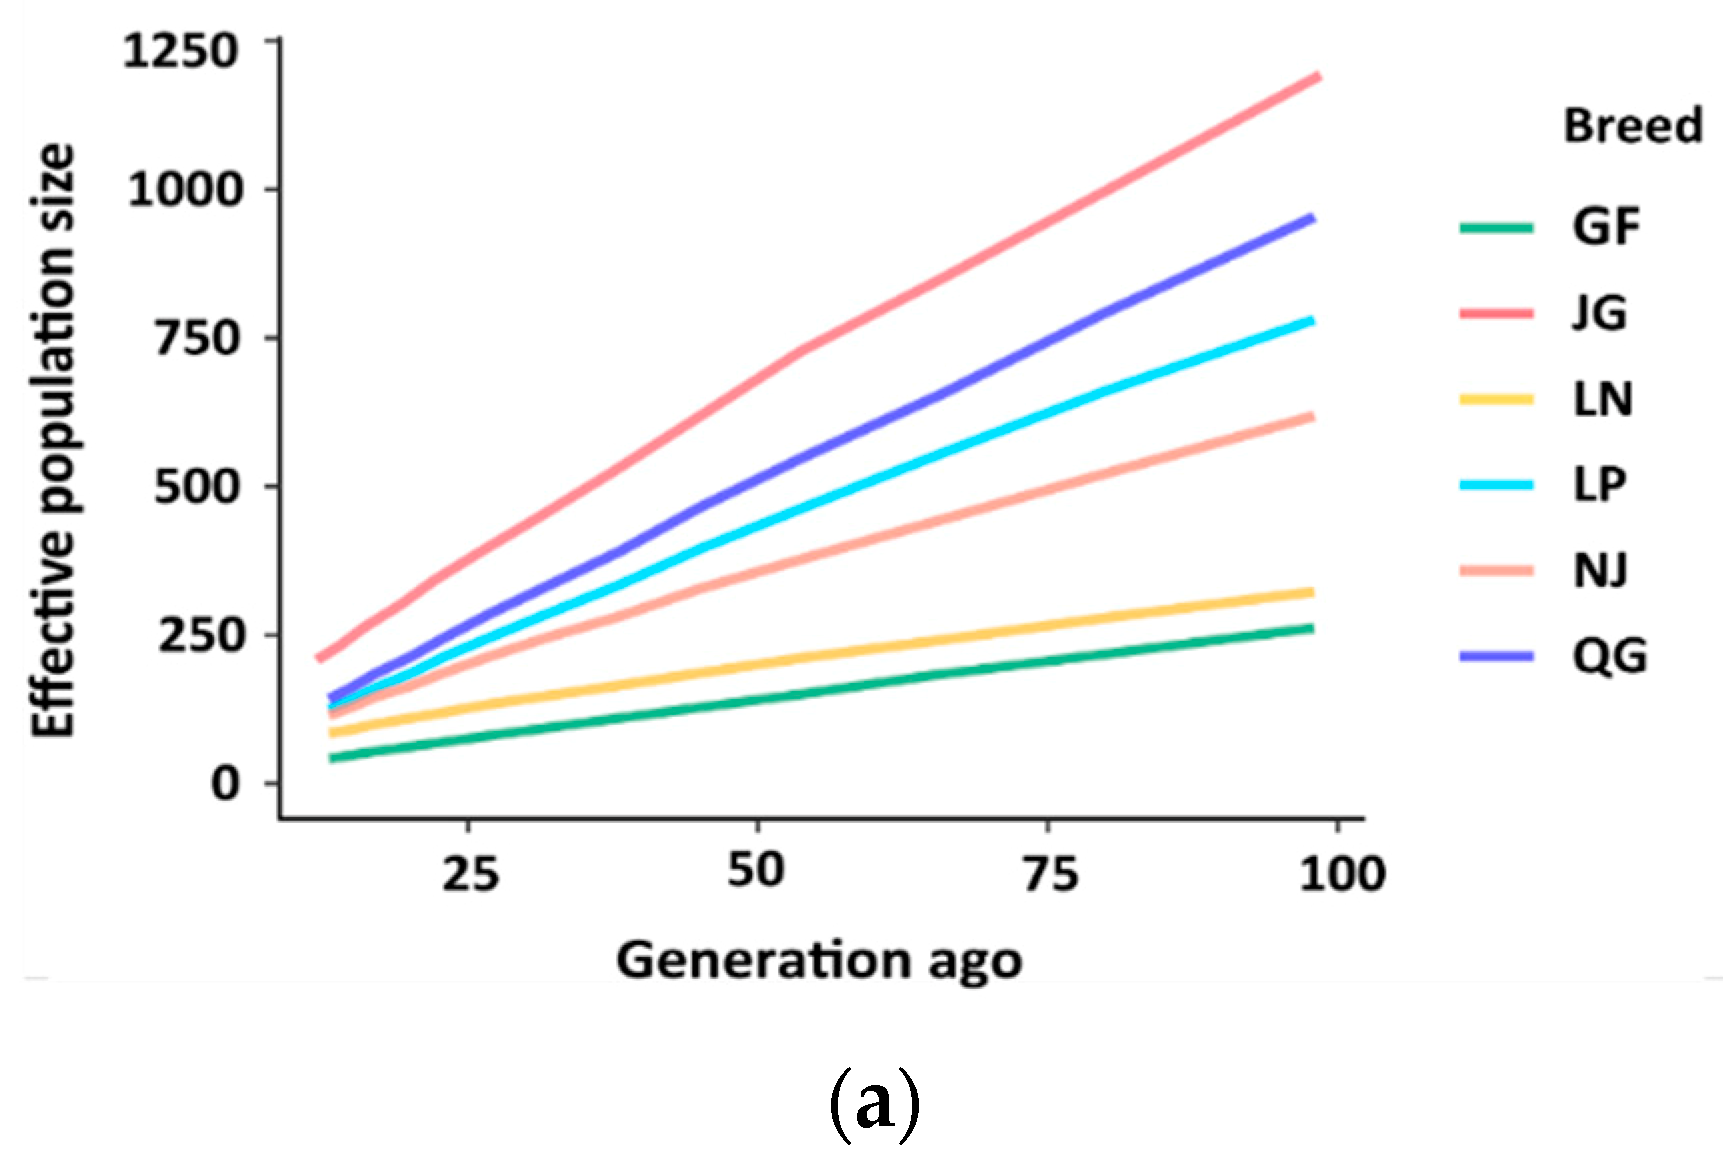
2.6. Effective Population Size (Ne)
2.7. Population Differentiation, Analysis of Molecular Variance, and Structure
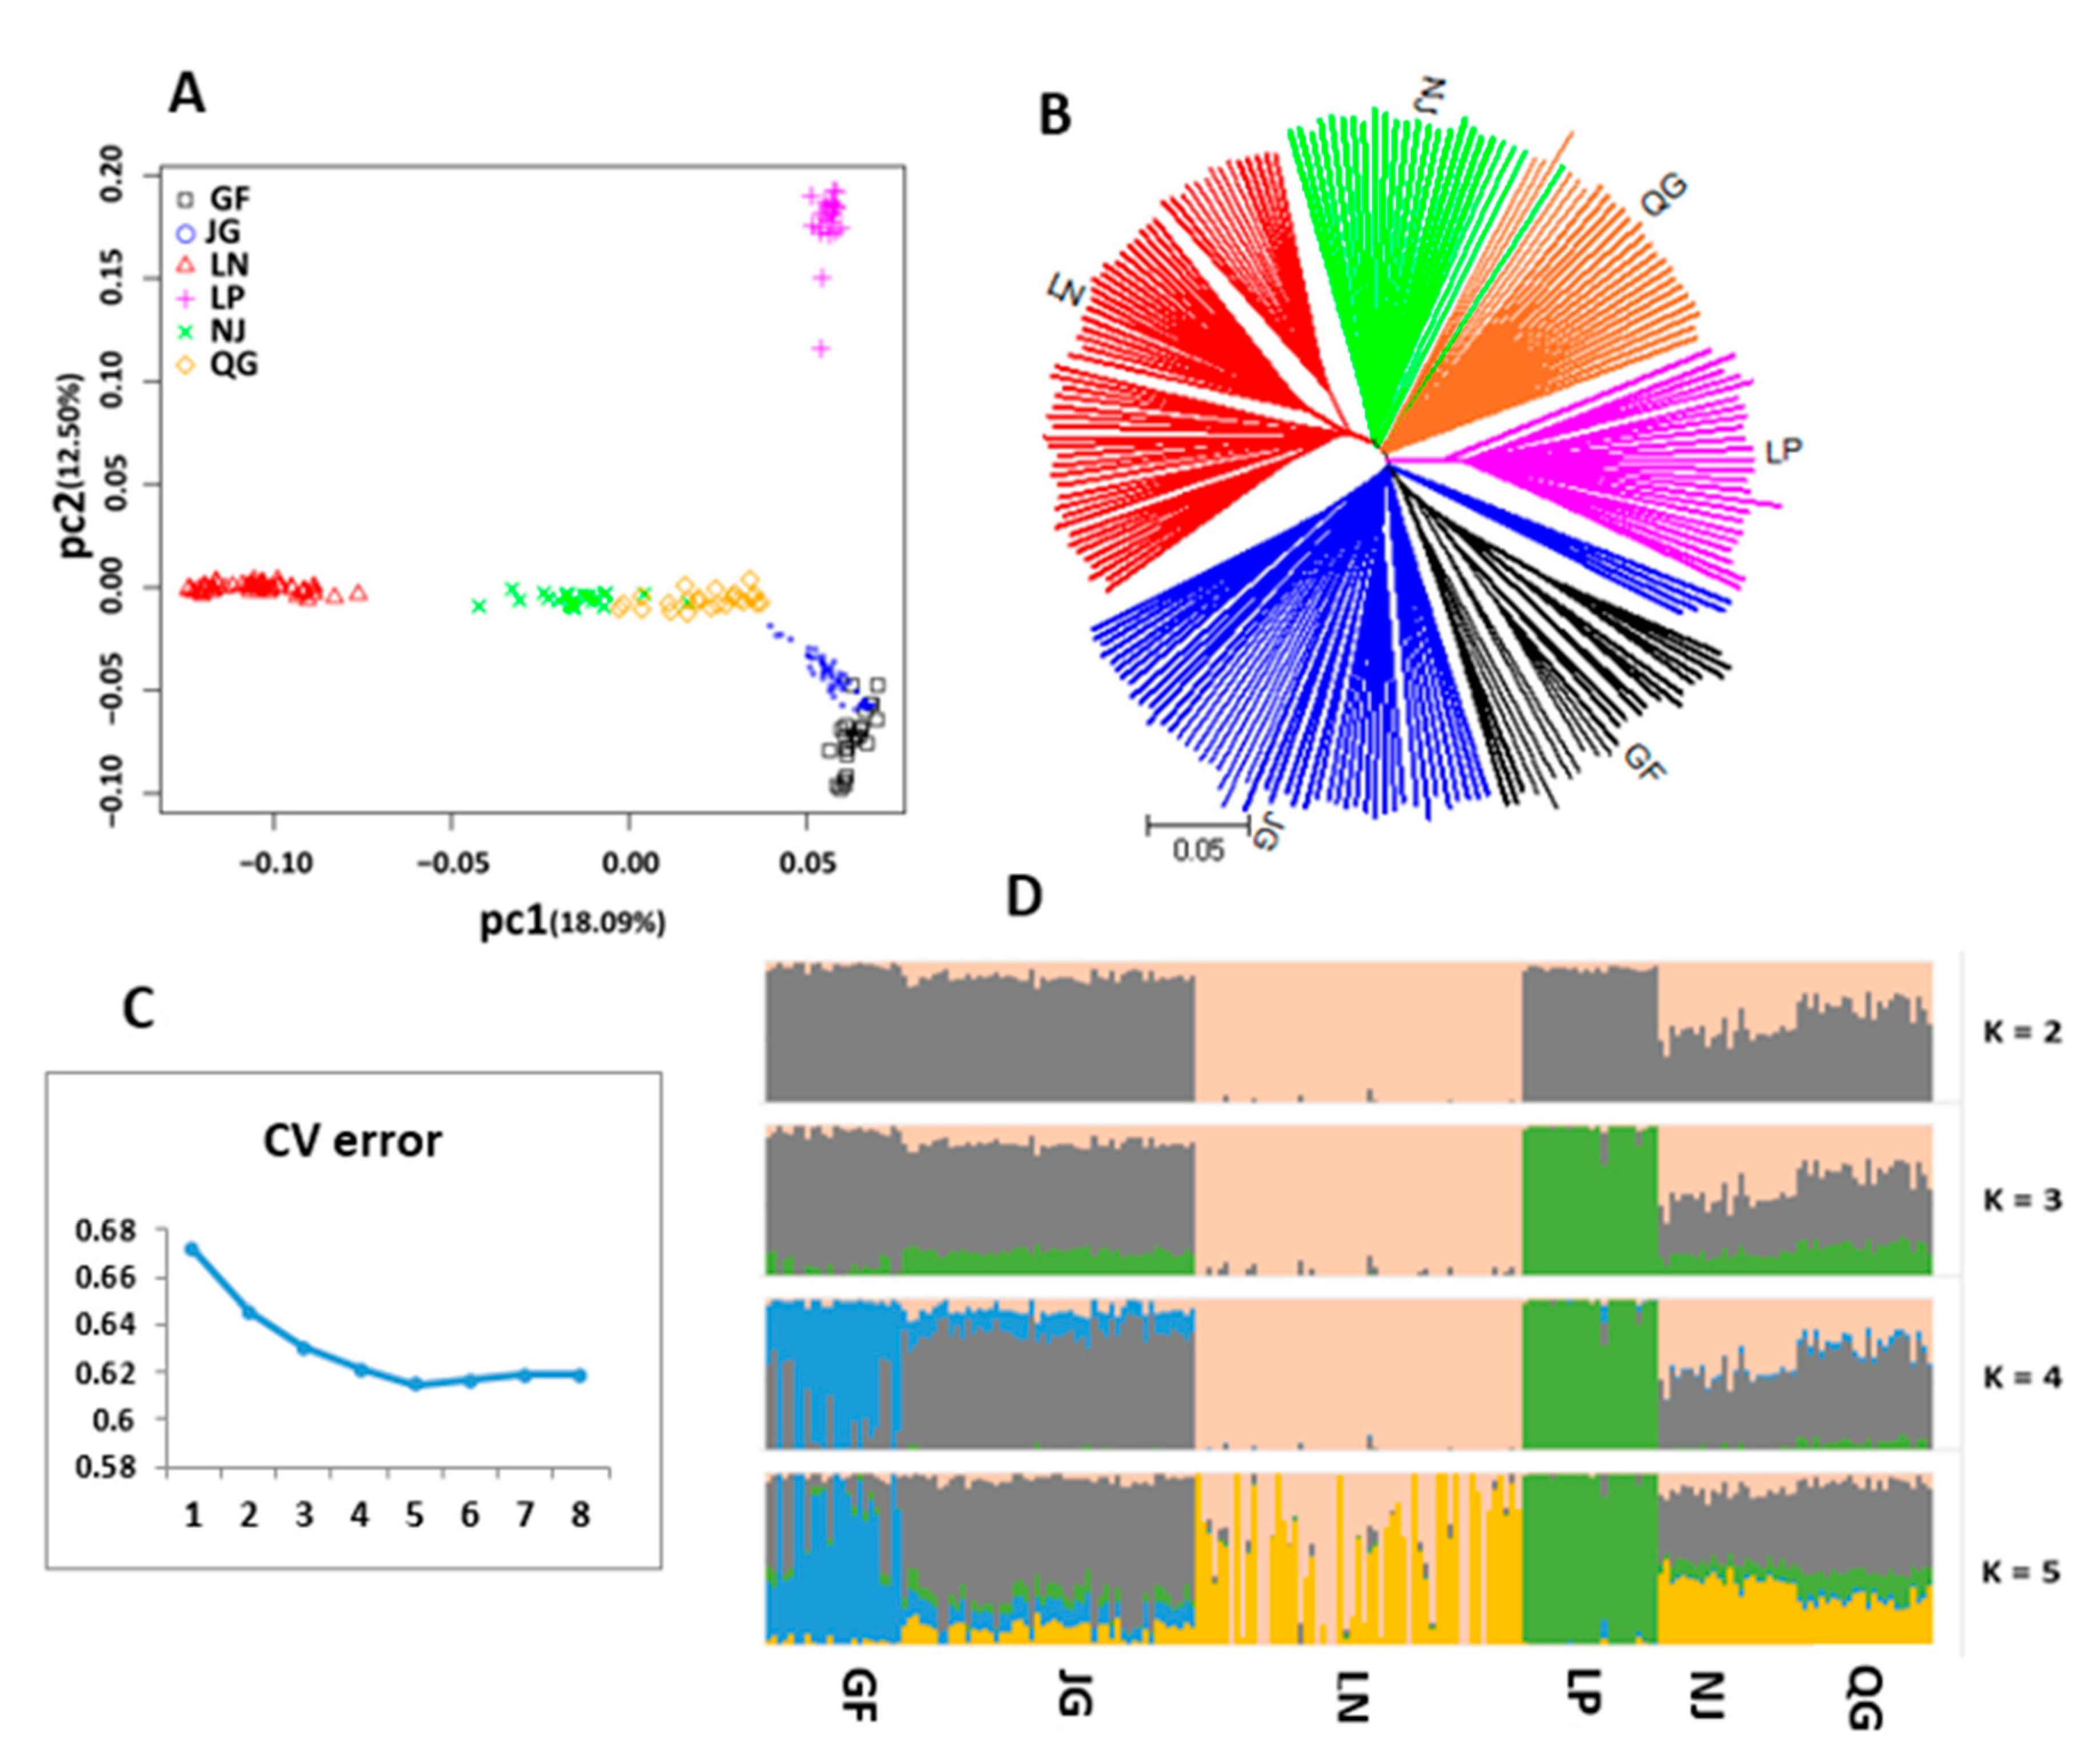
2.7.1. Principal Component Analysis
2.7.2. Neighbor-Joining Tree
2.7.3. Admixture Analysis
2.8. Selective Sweep Analysis
2.8.1. Population Differentiation Index (FST) Approach
2.8.2. Nucleotide Diversity (π)
2.8.3. Estimation of Cross-population extended haplotype homozygosity (XP-EHH)
2.8.4. Gene Annotation and Functional Enrichment Analysis
3. Results
3.1. Sample and SNP Filtration
3.2. ROHs
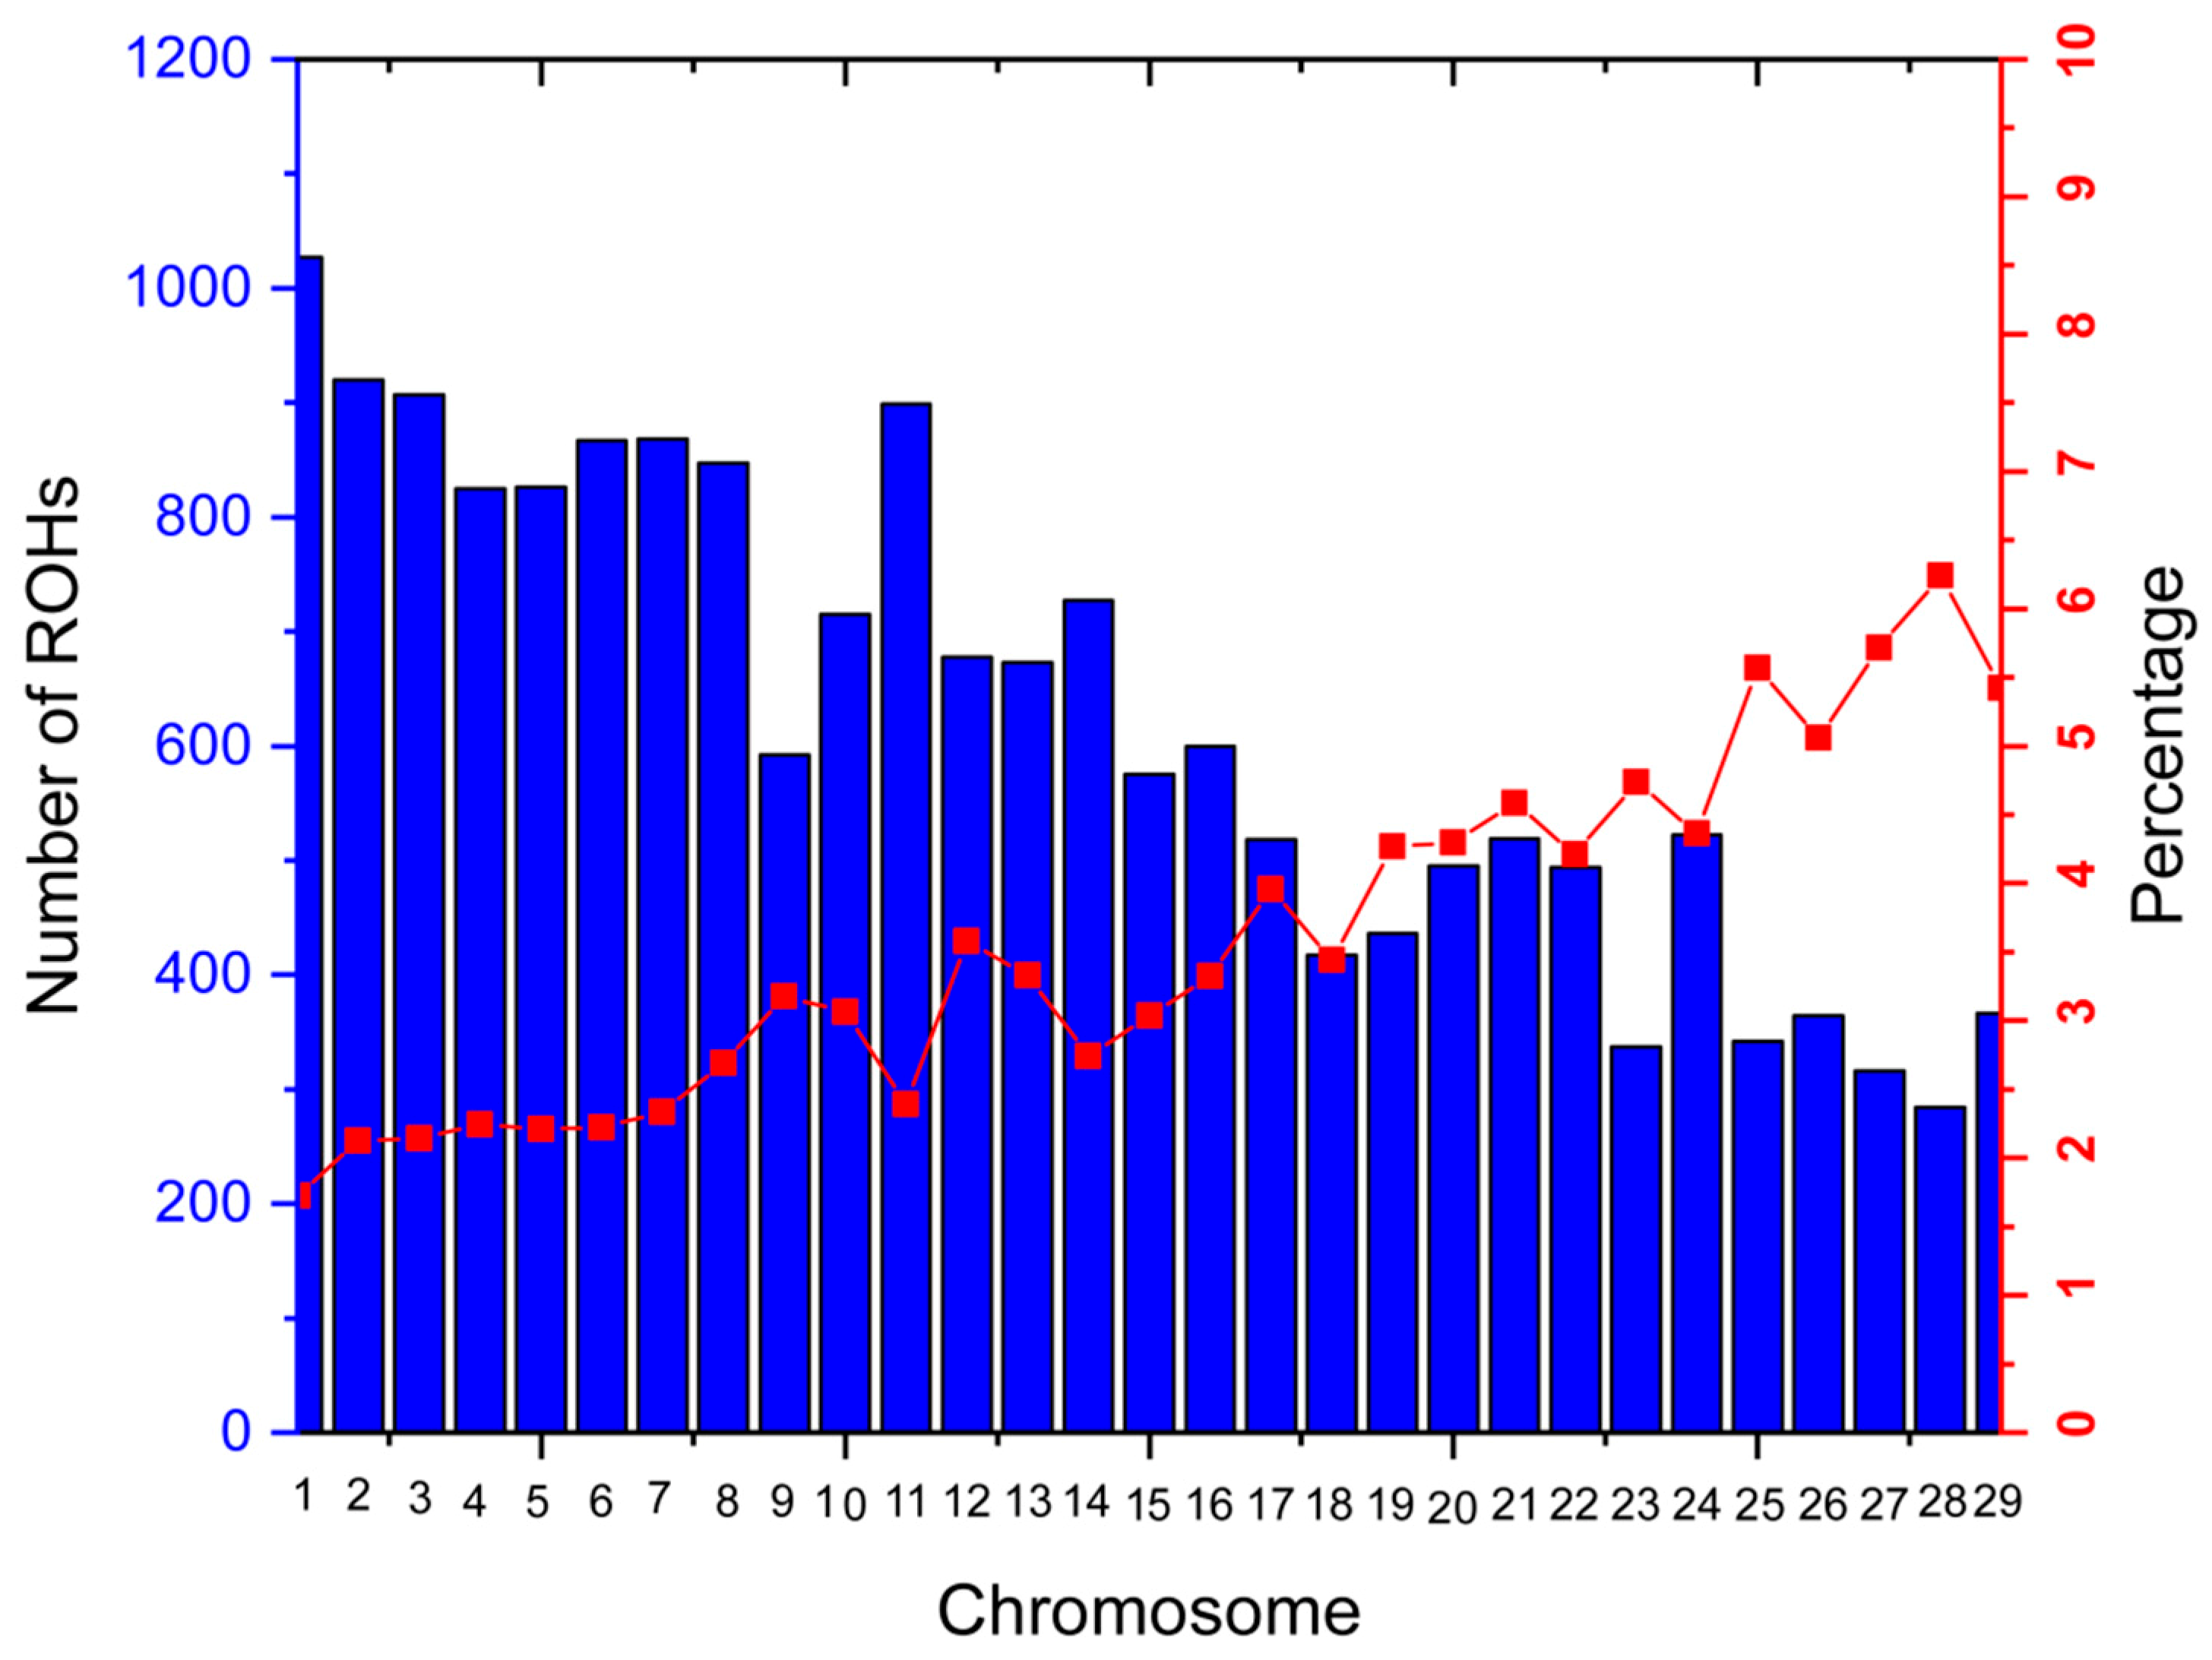
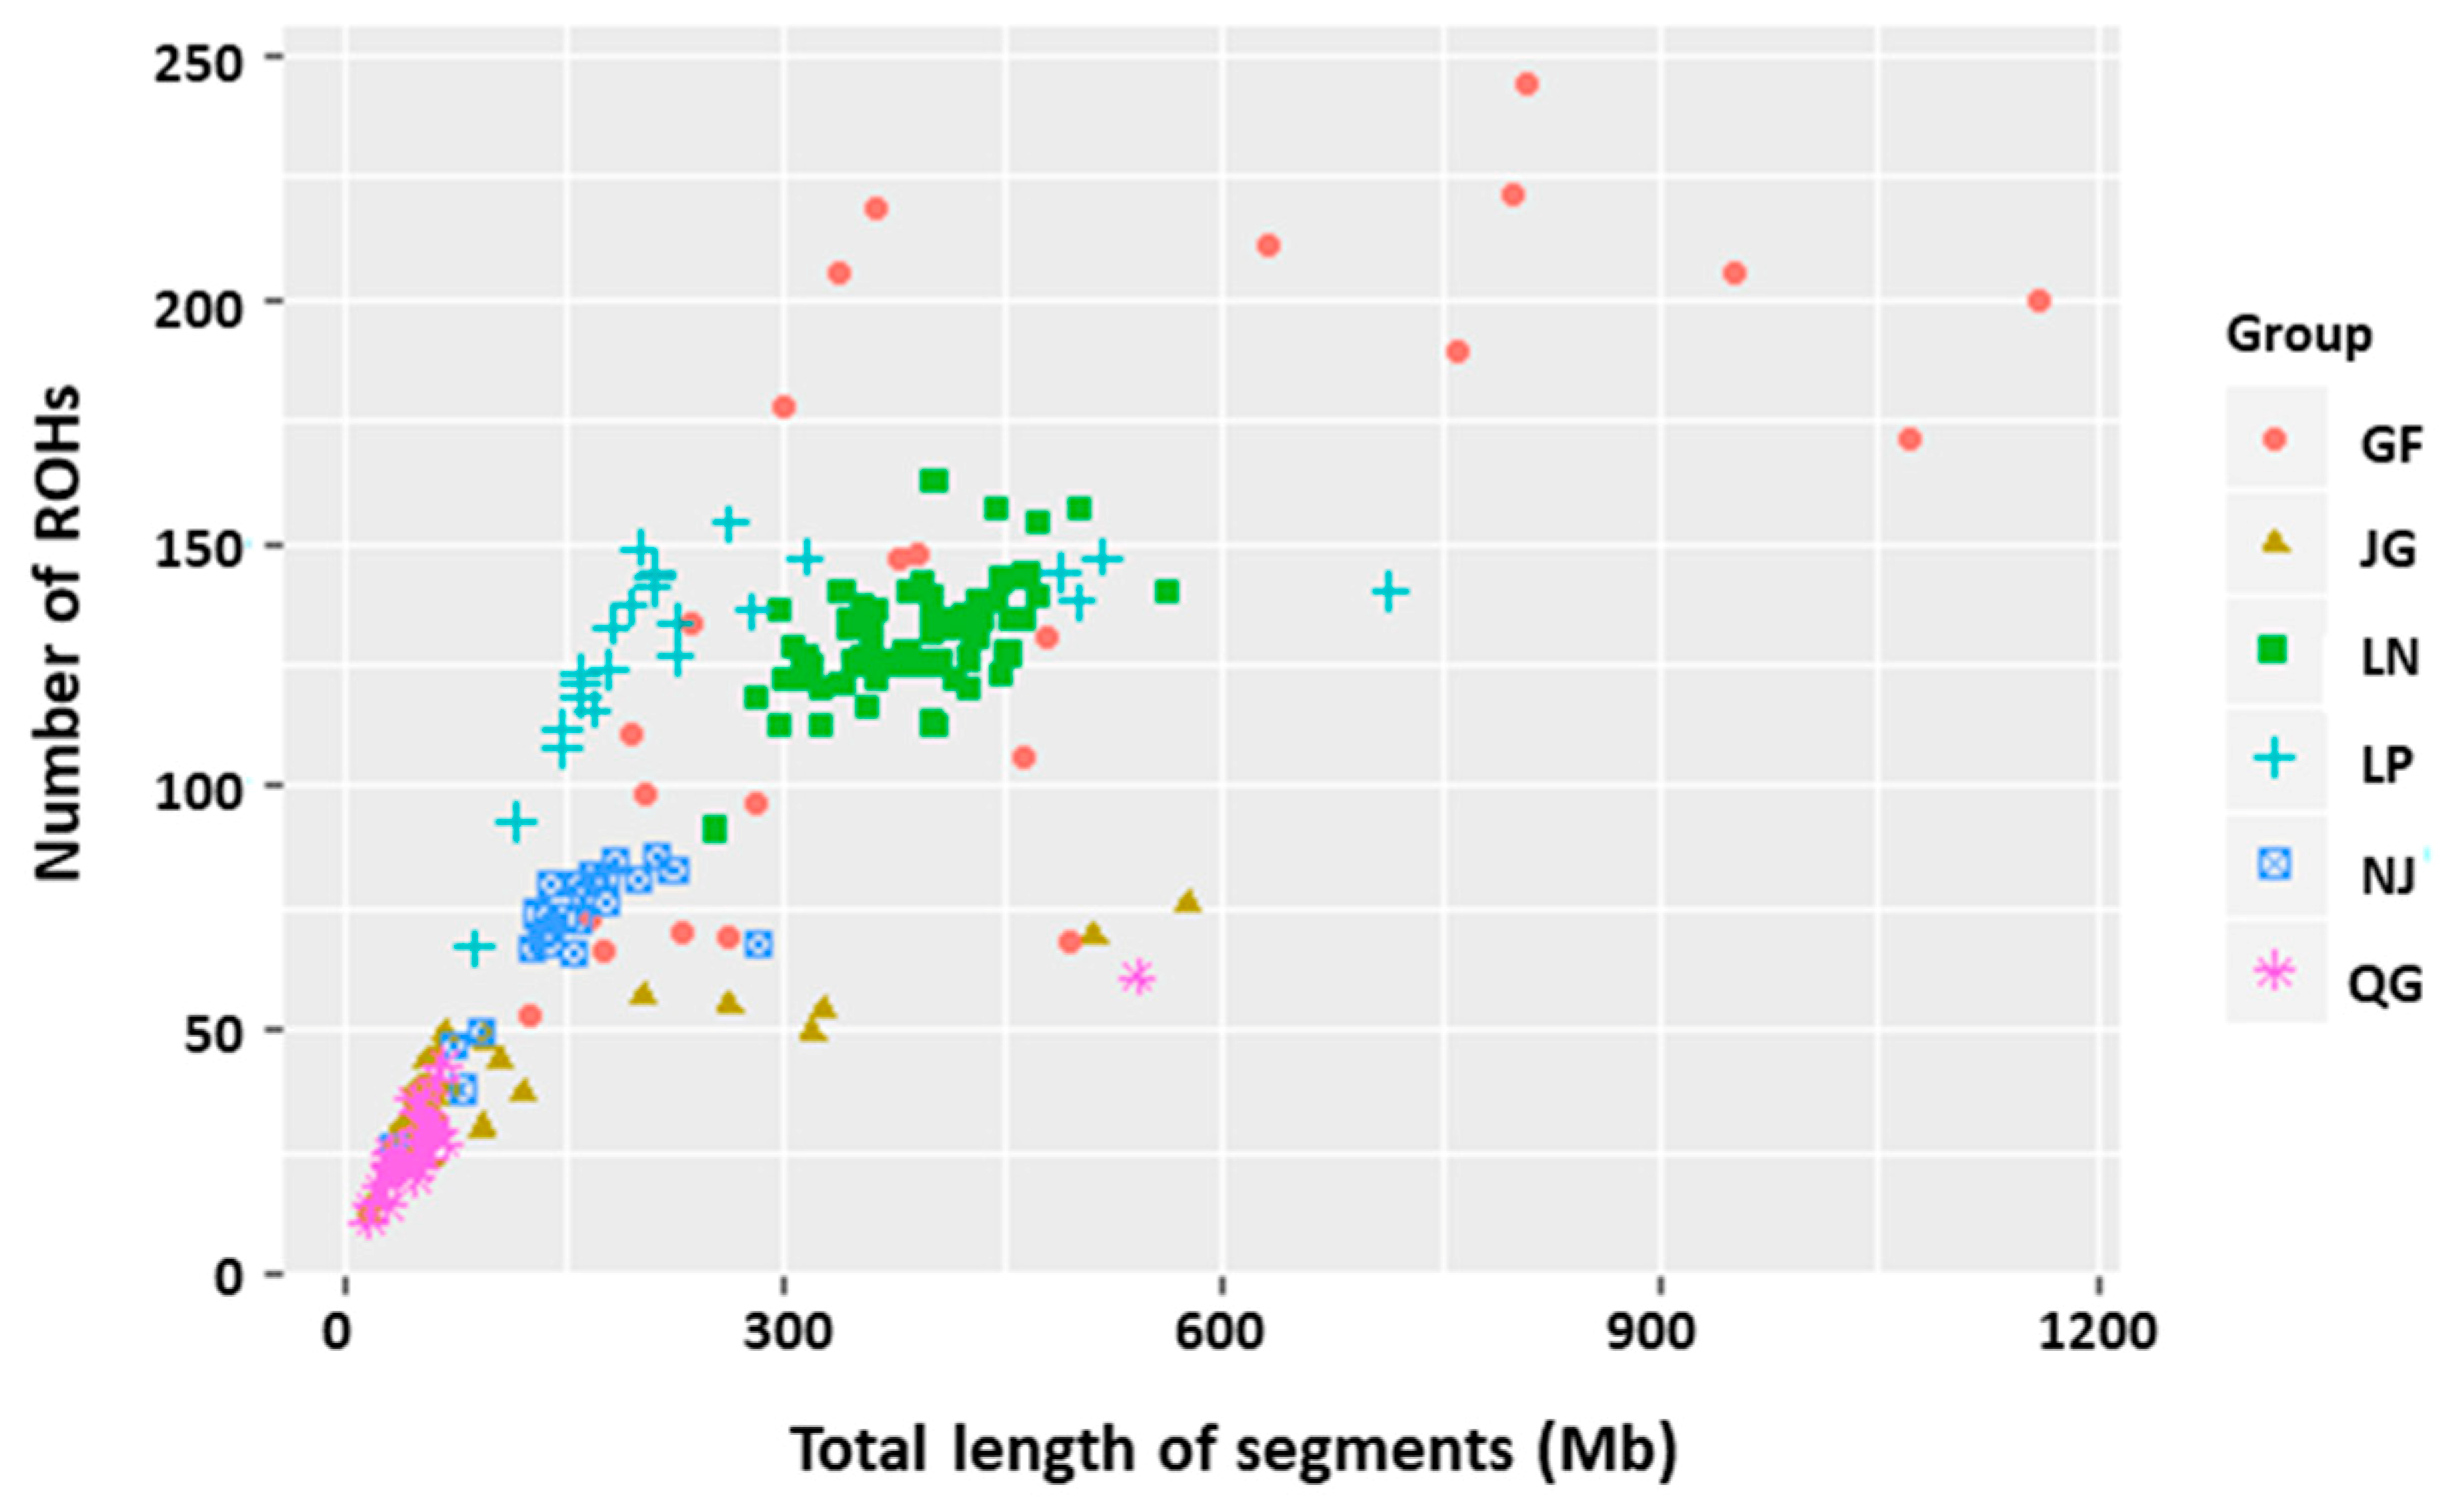
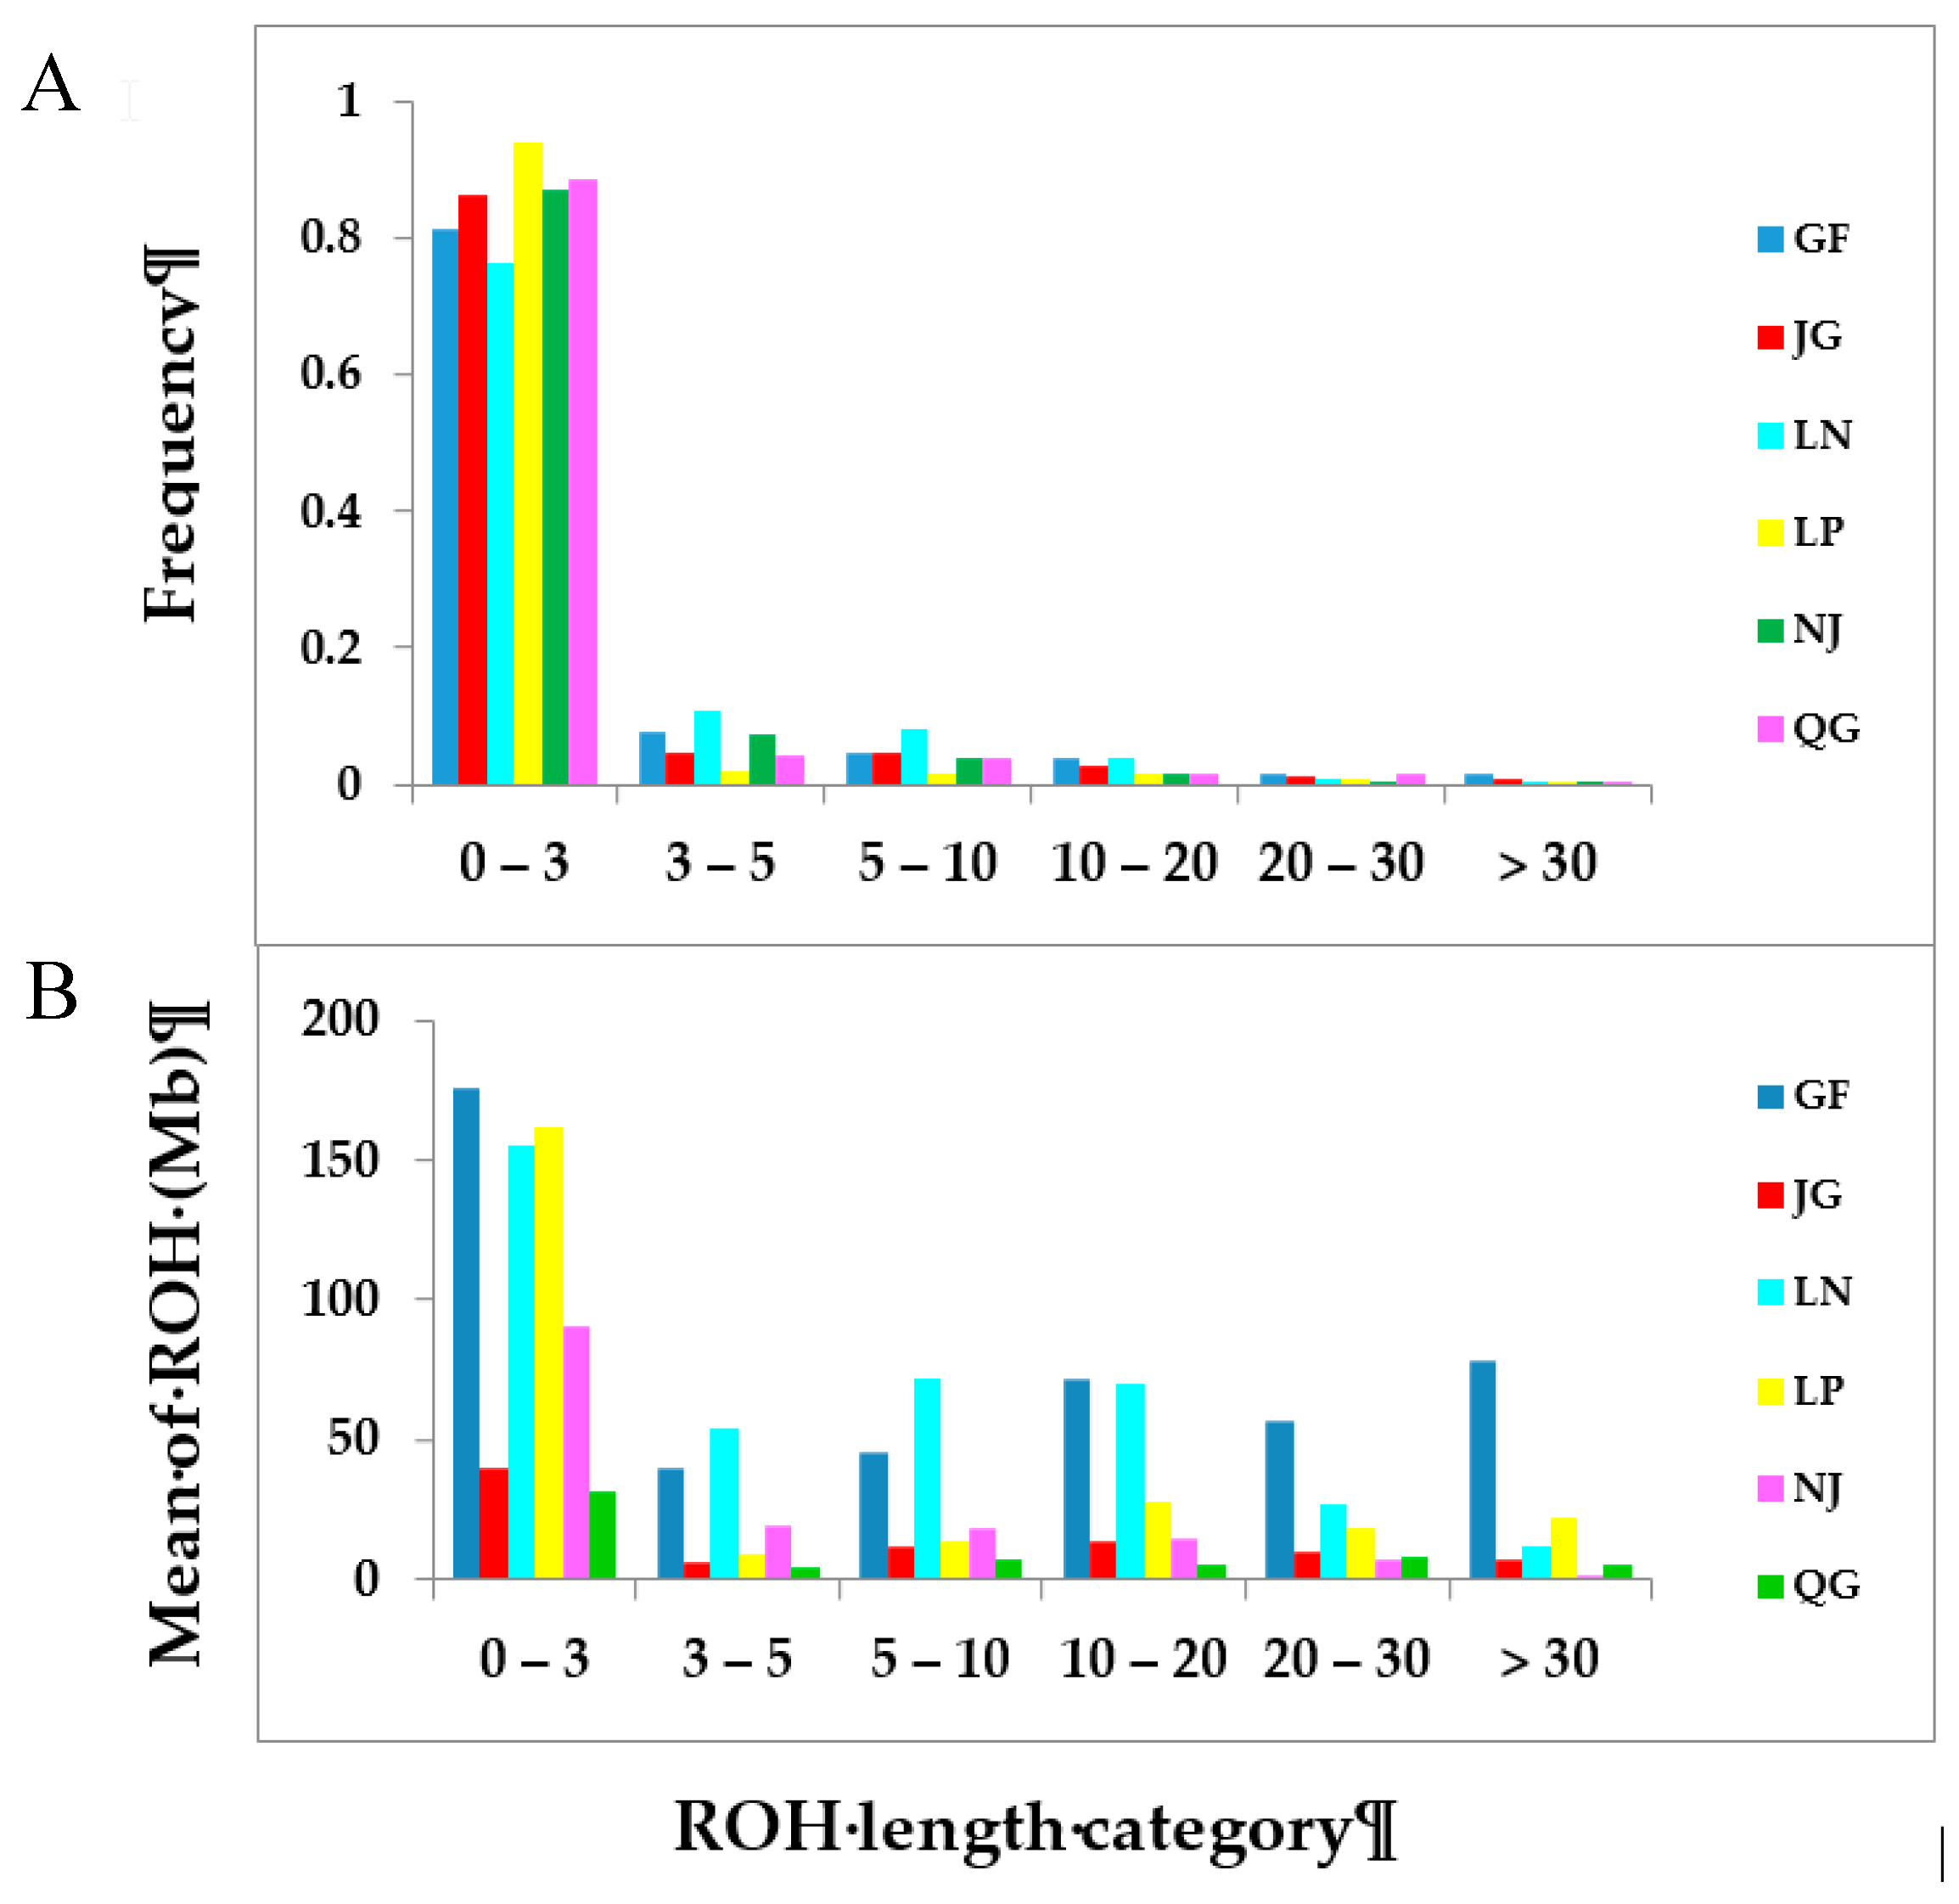
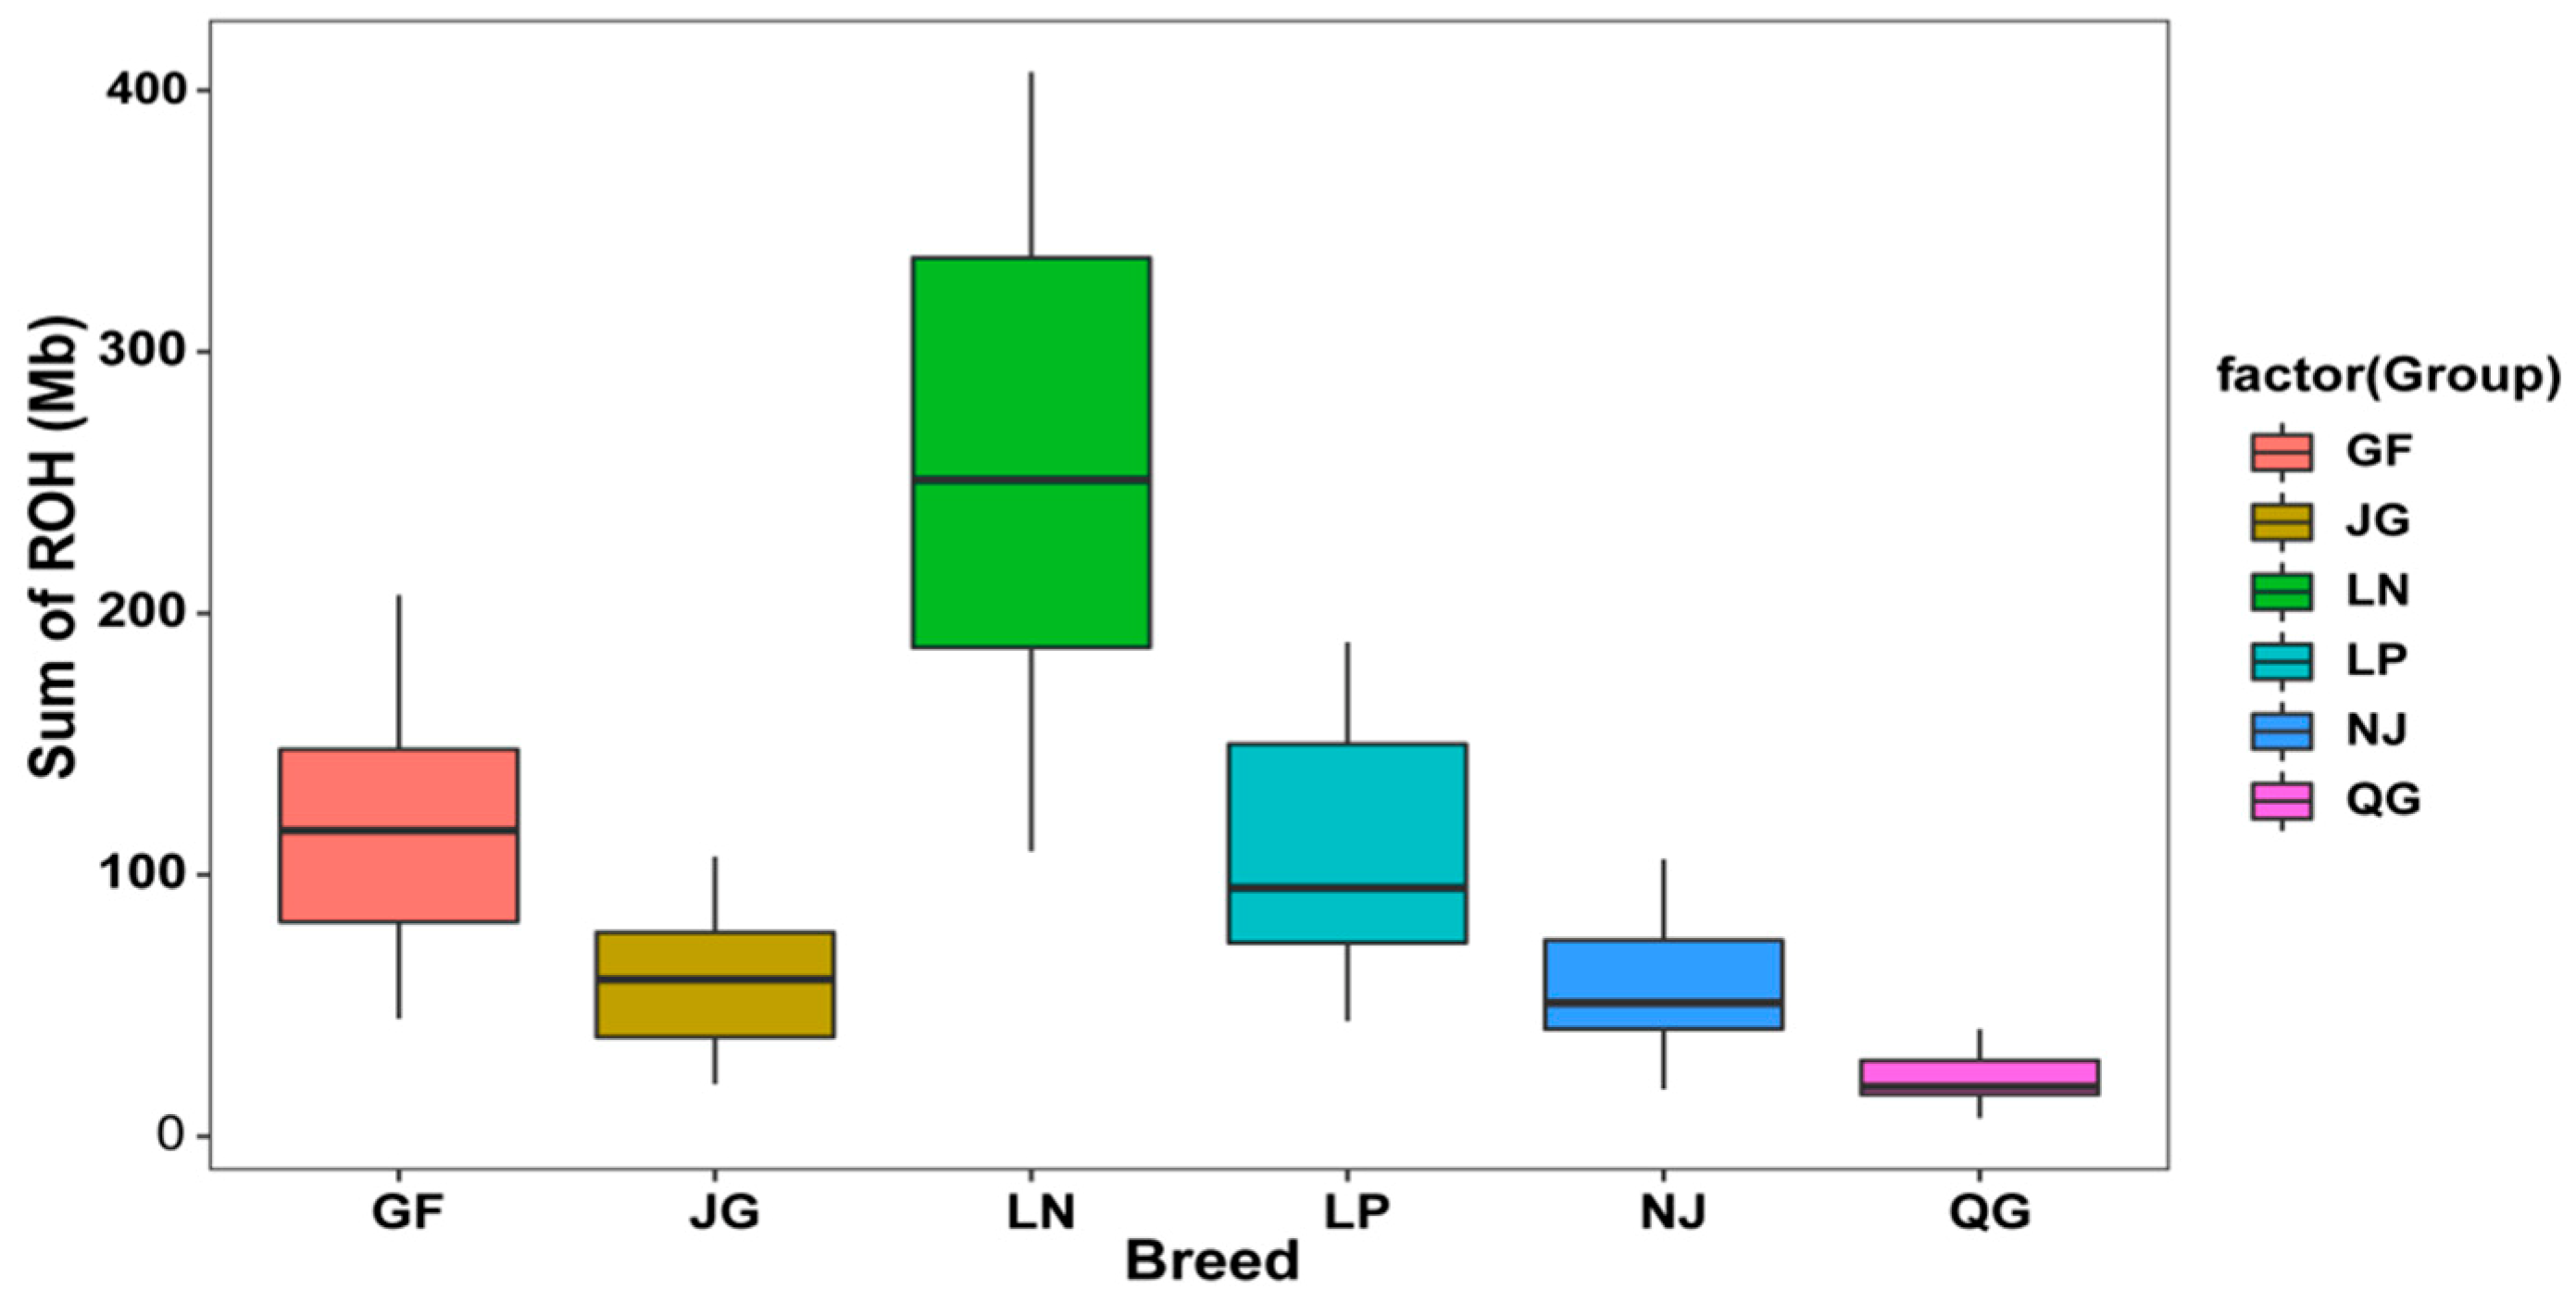
3.2.1. ROH Patterns
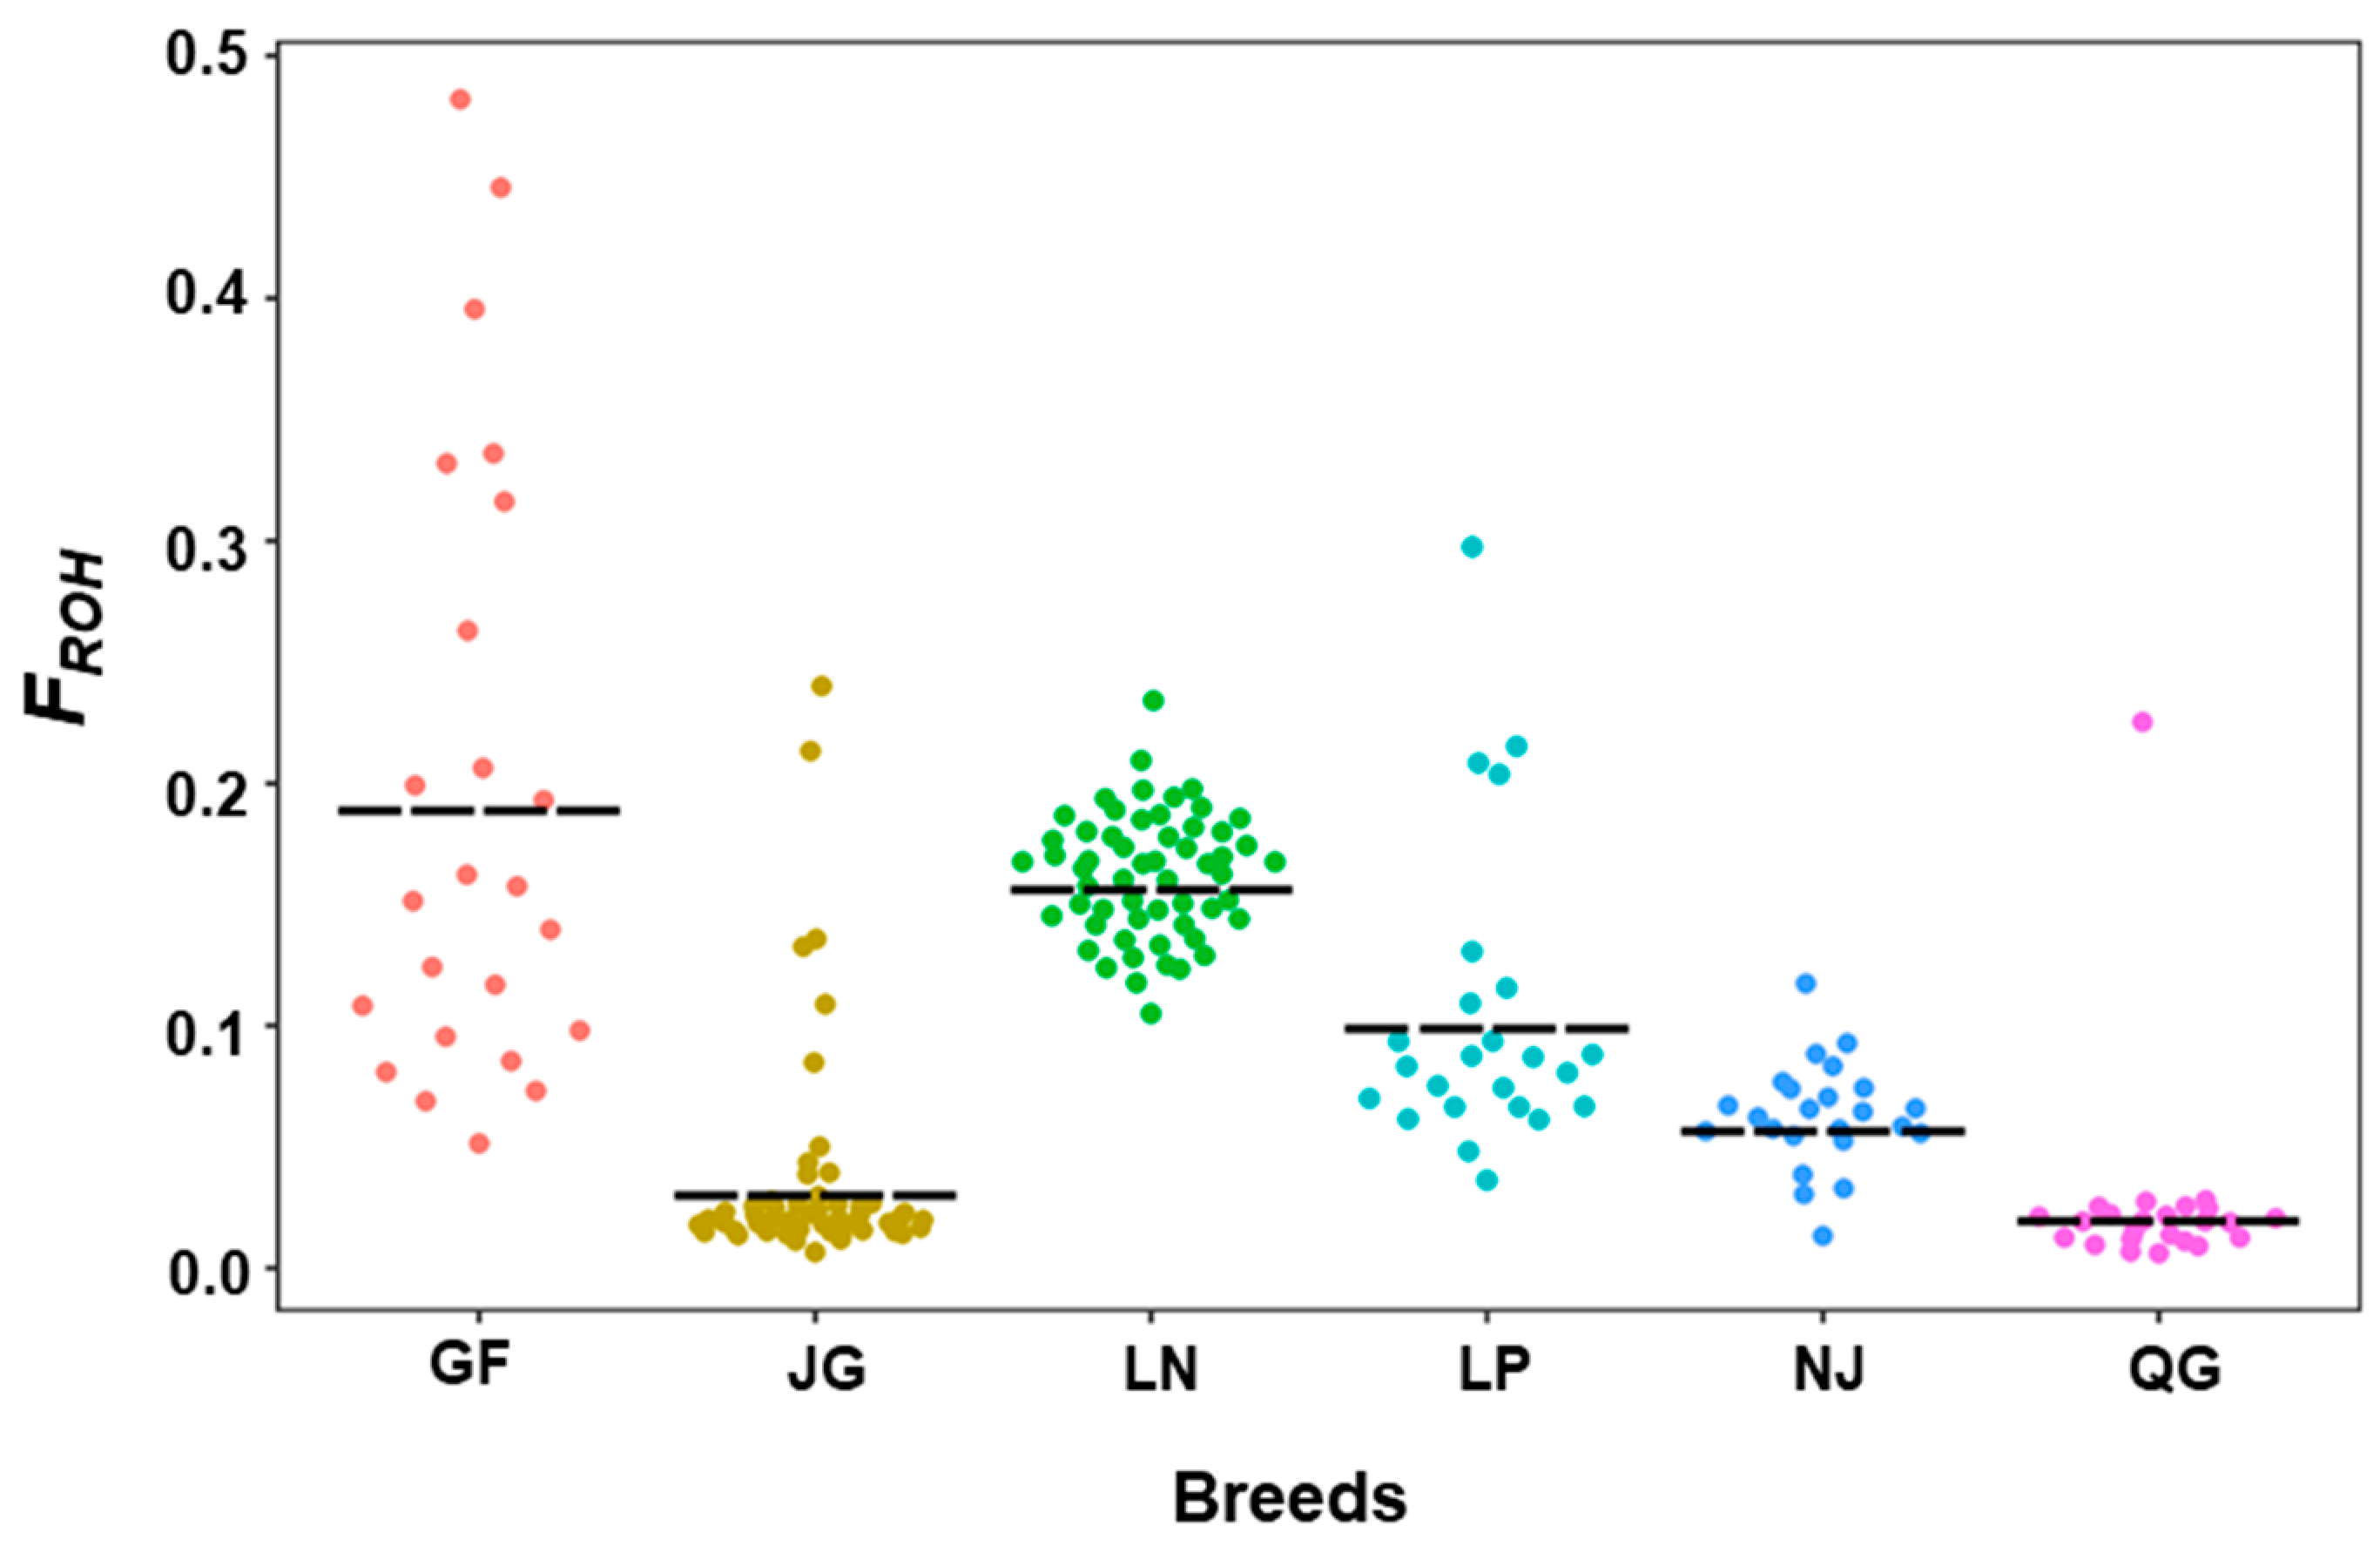
3.2.2. Inbreeding Coefficient of Runs of Homozygosity (FROH)
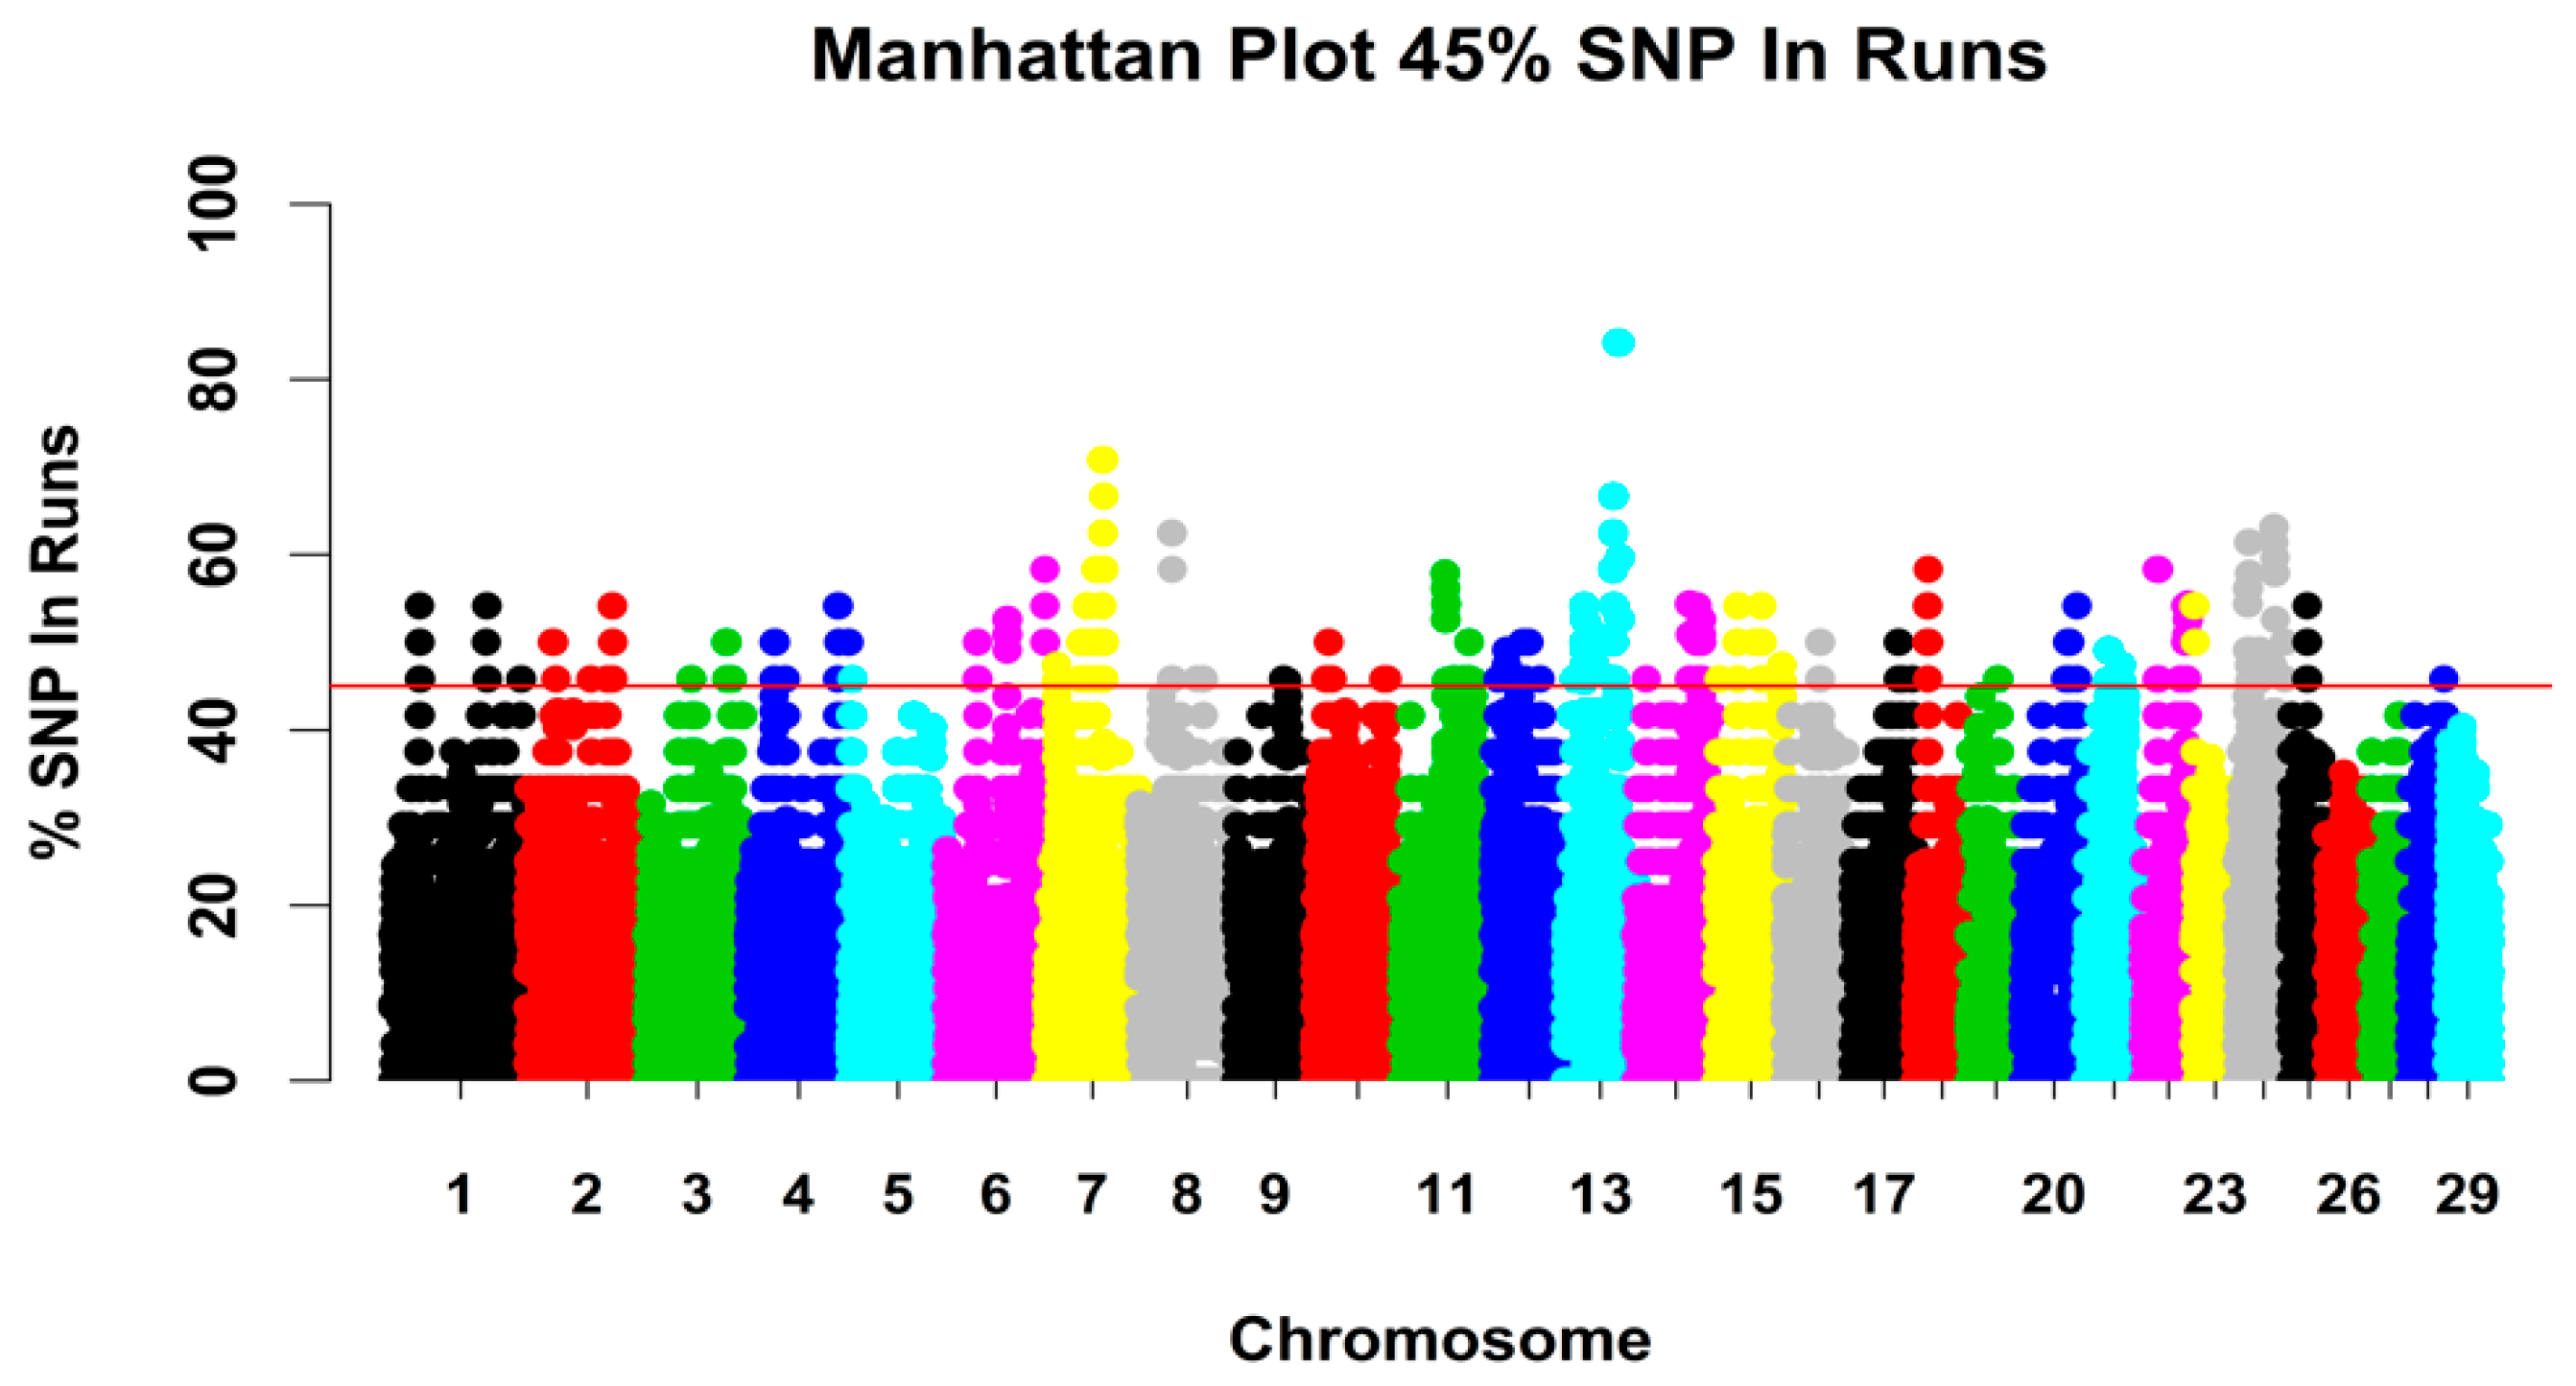
3.2.3. Genomic Regions with a High ROH Frequency
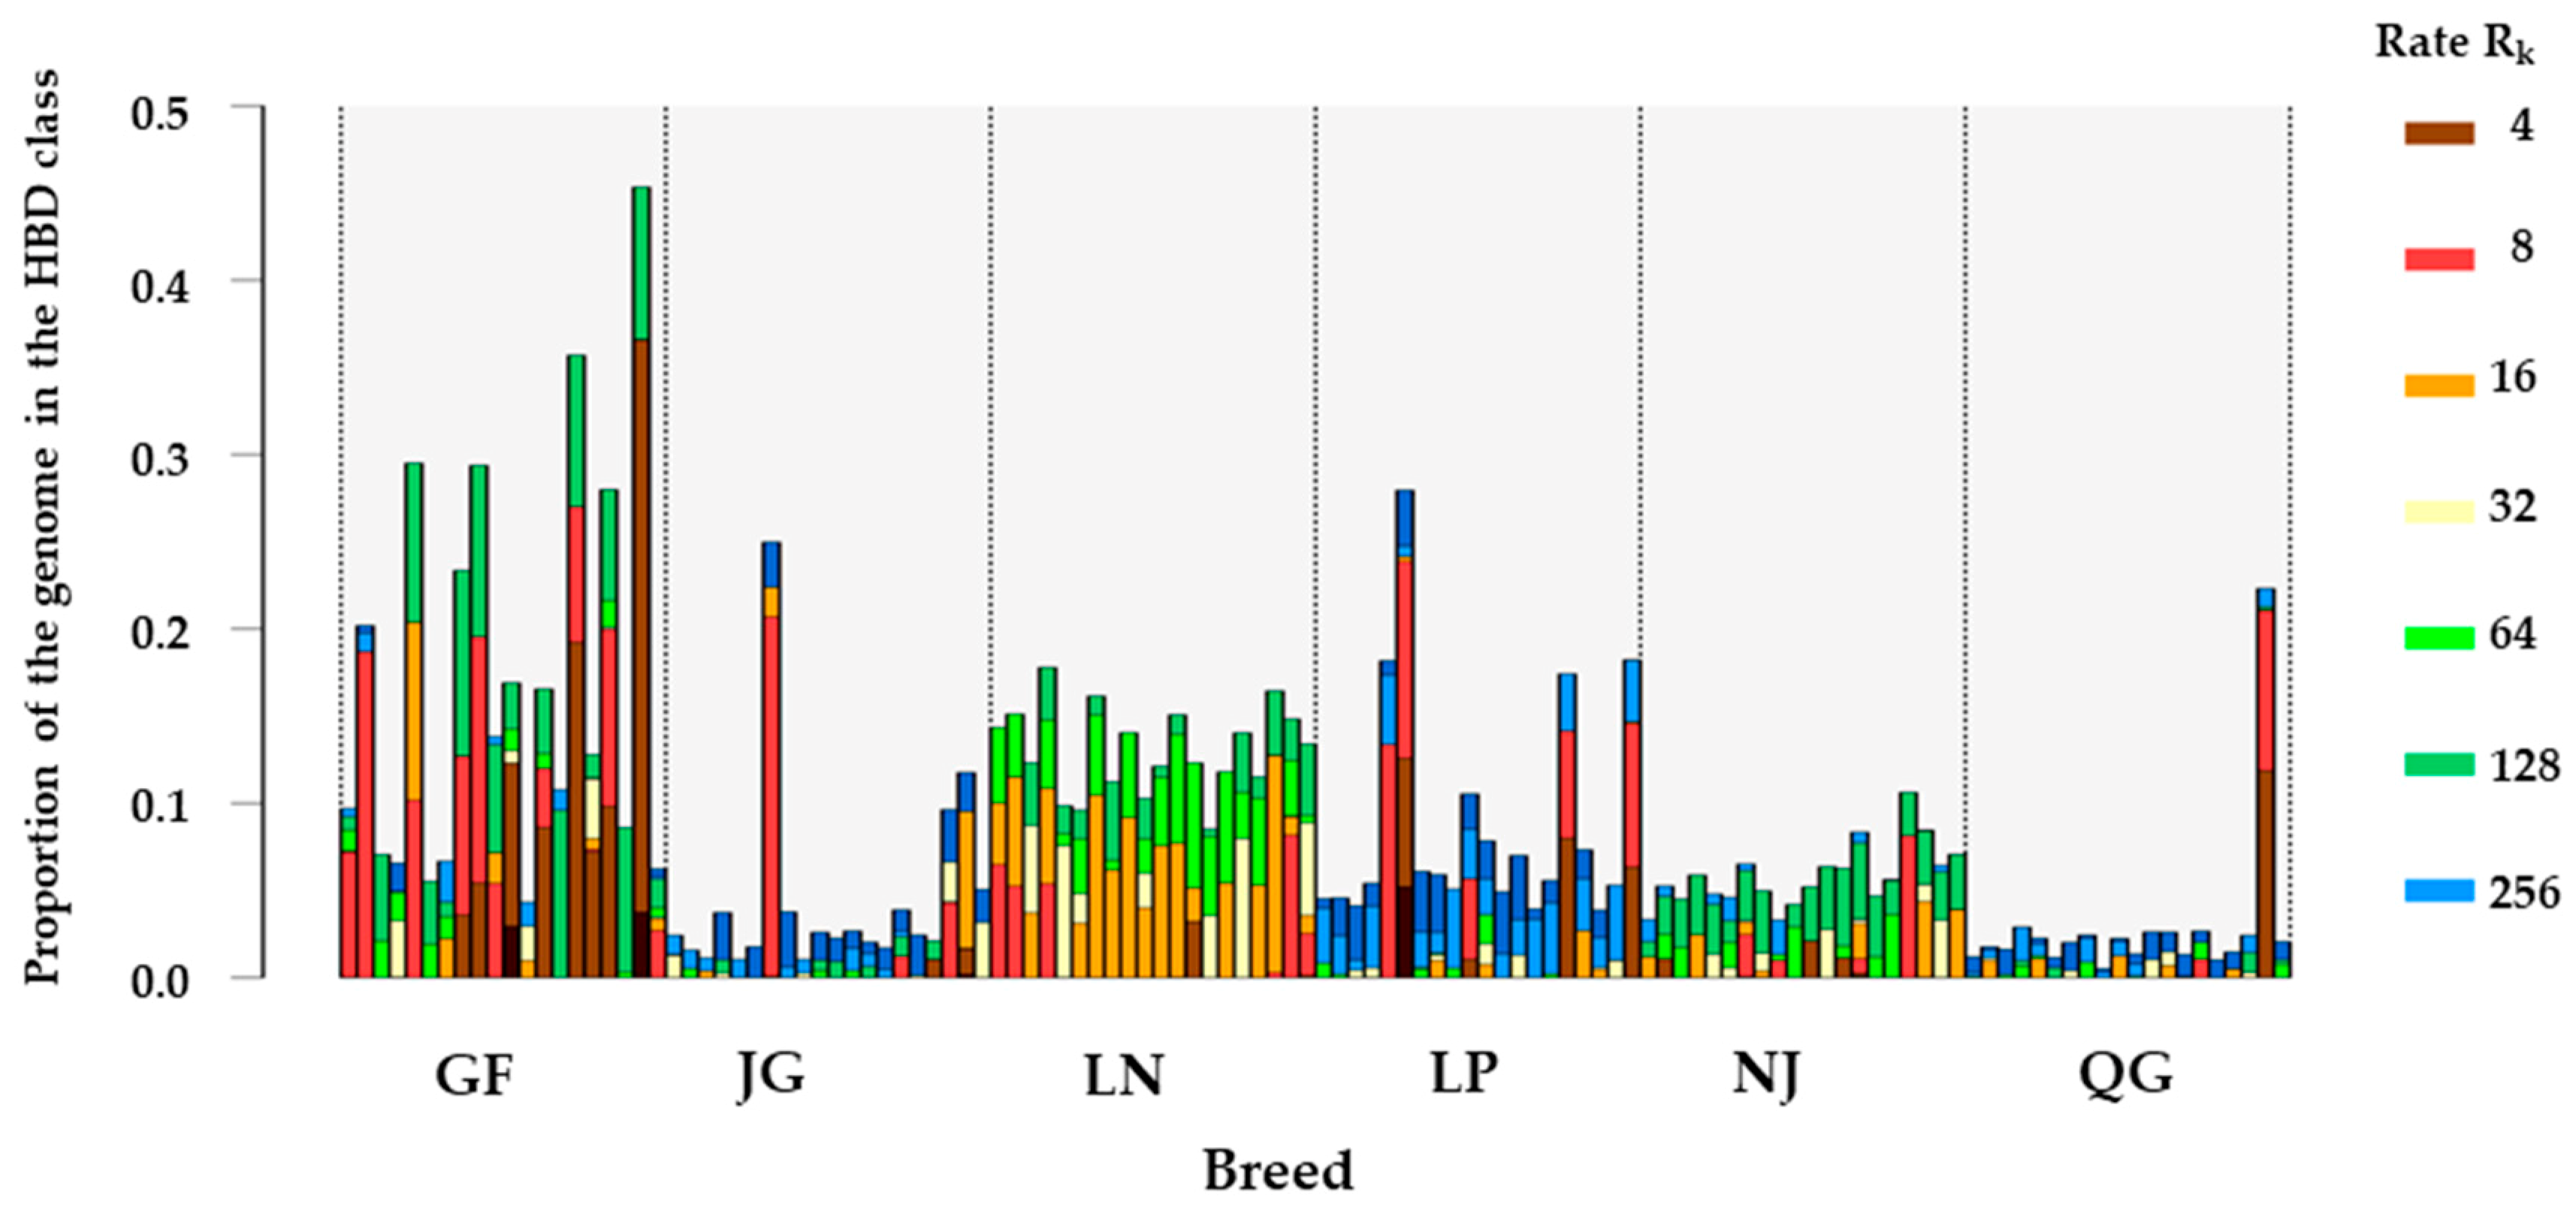
3.3. Homozygosity by Descent (HBD) Classes
3.4. Effective Population Size (Ne)
3.5. Population Differentiation, AMOVA, and Structure
3.6. Detection of Signature of Selection
3.6.1. Distinct Population Structure Pattern
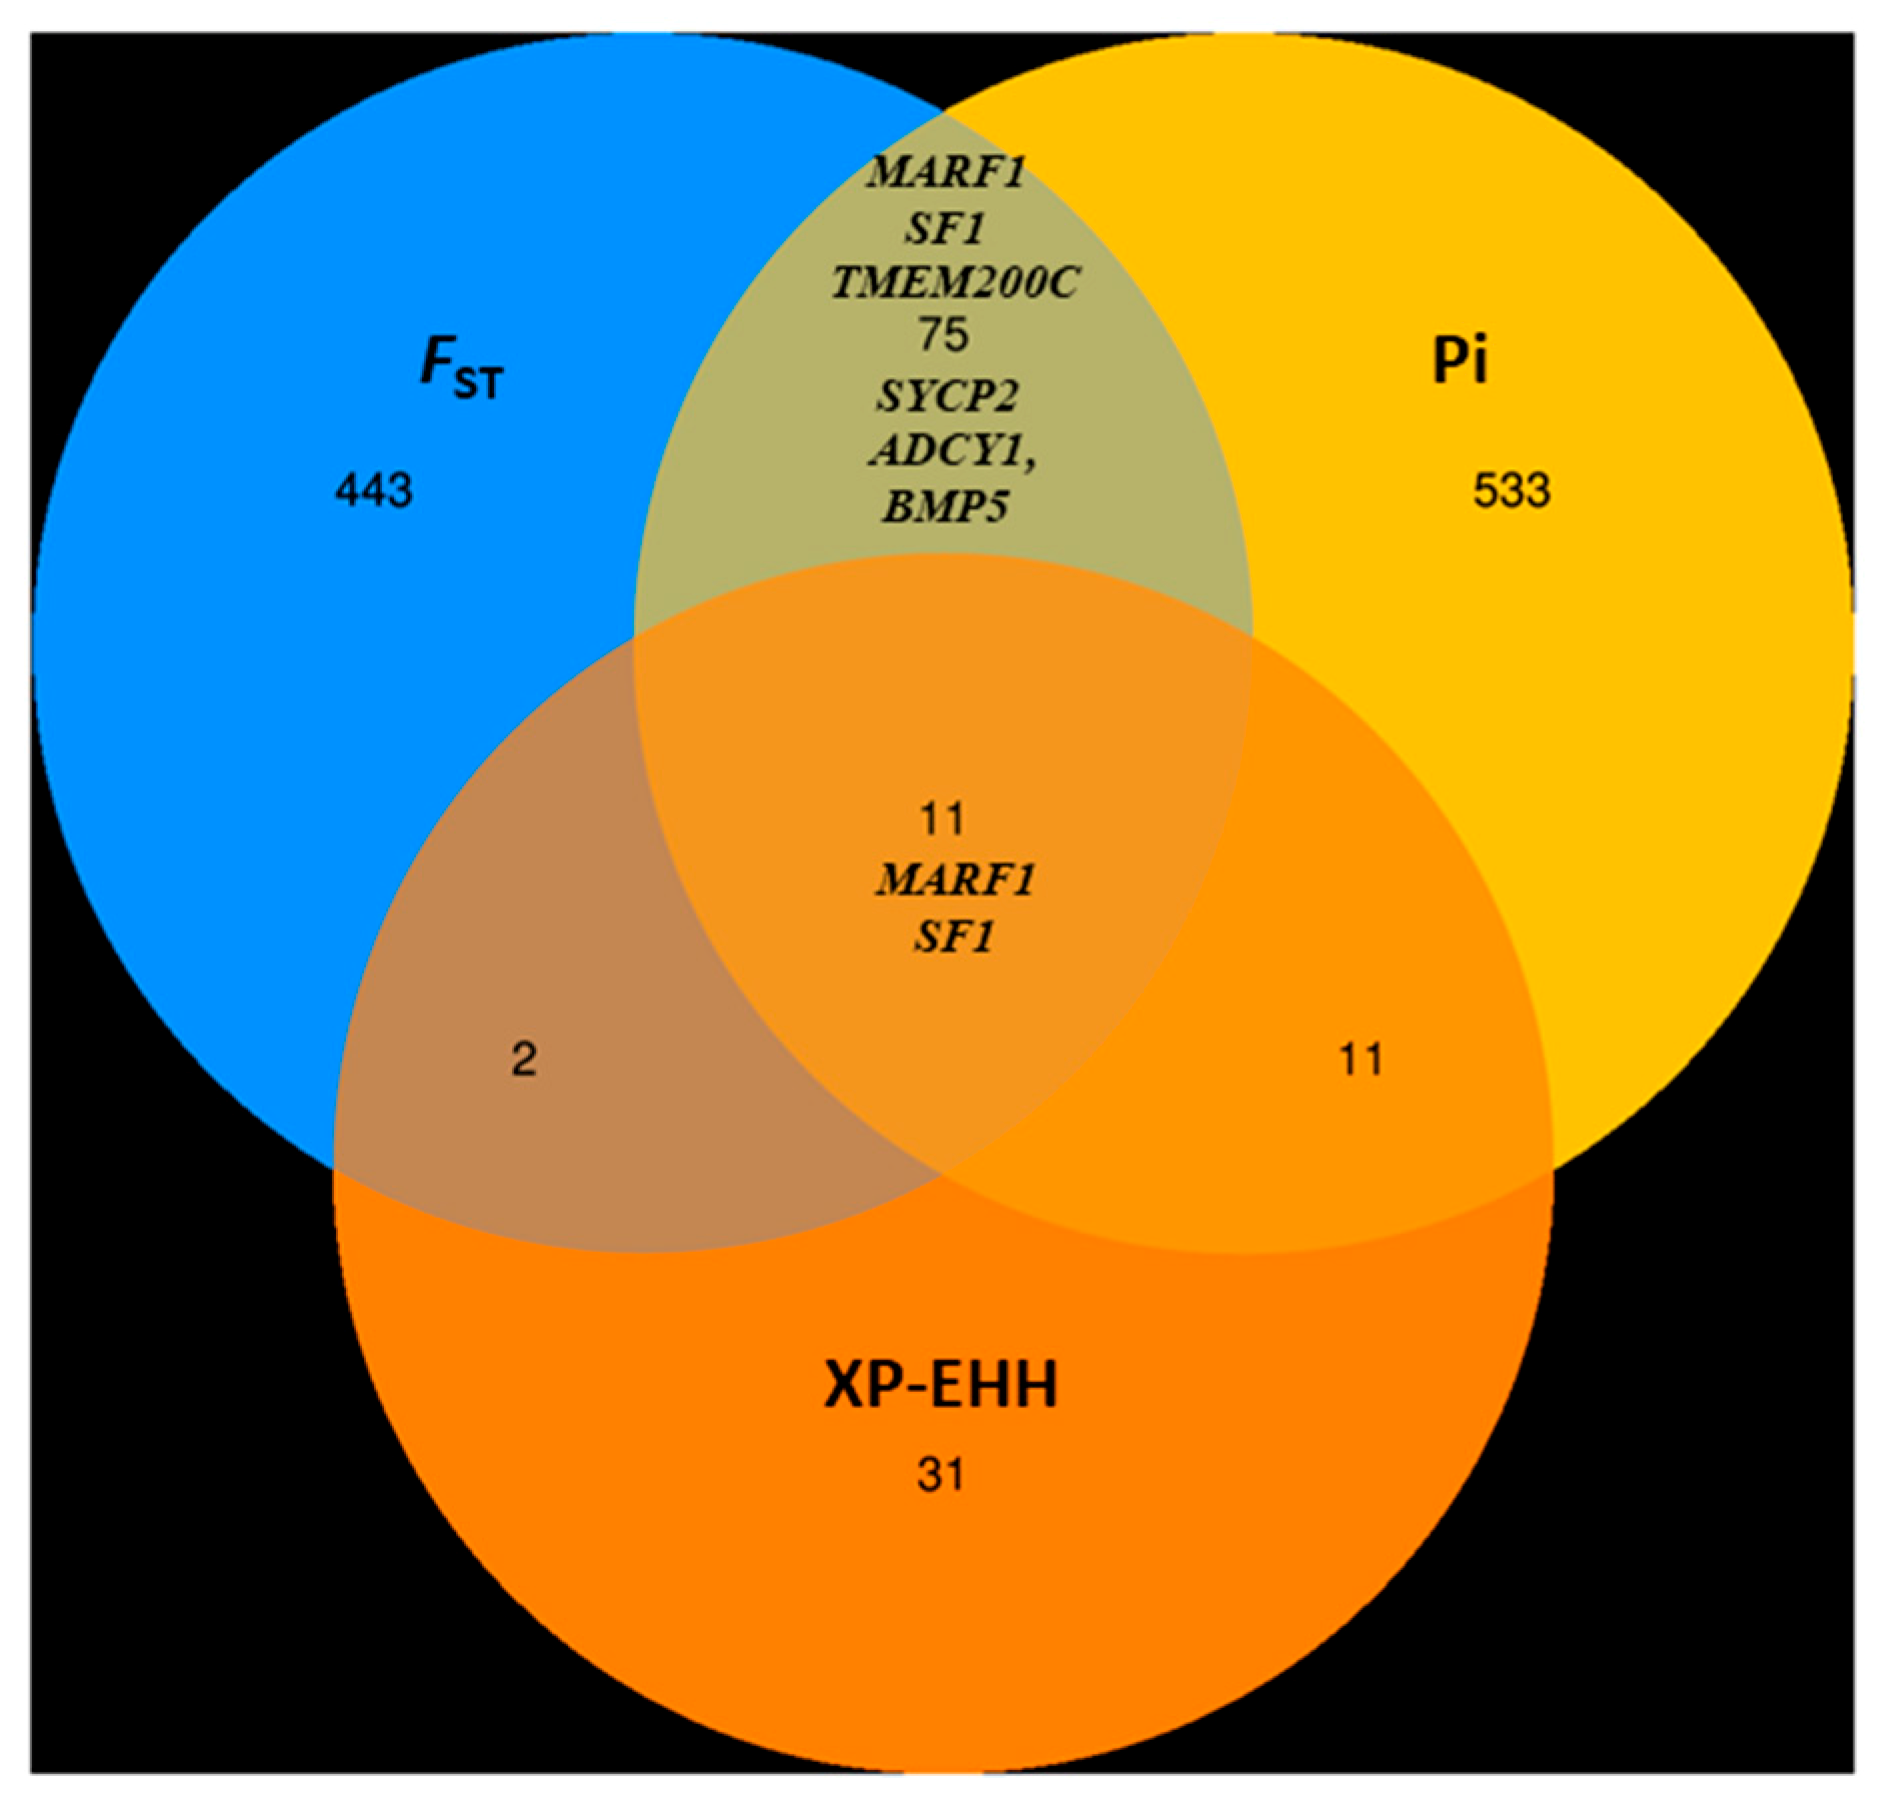
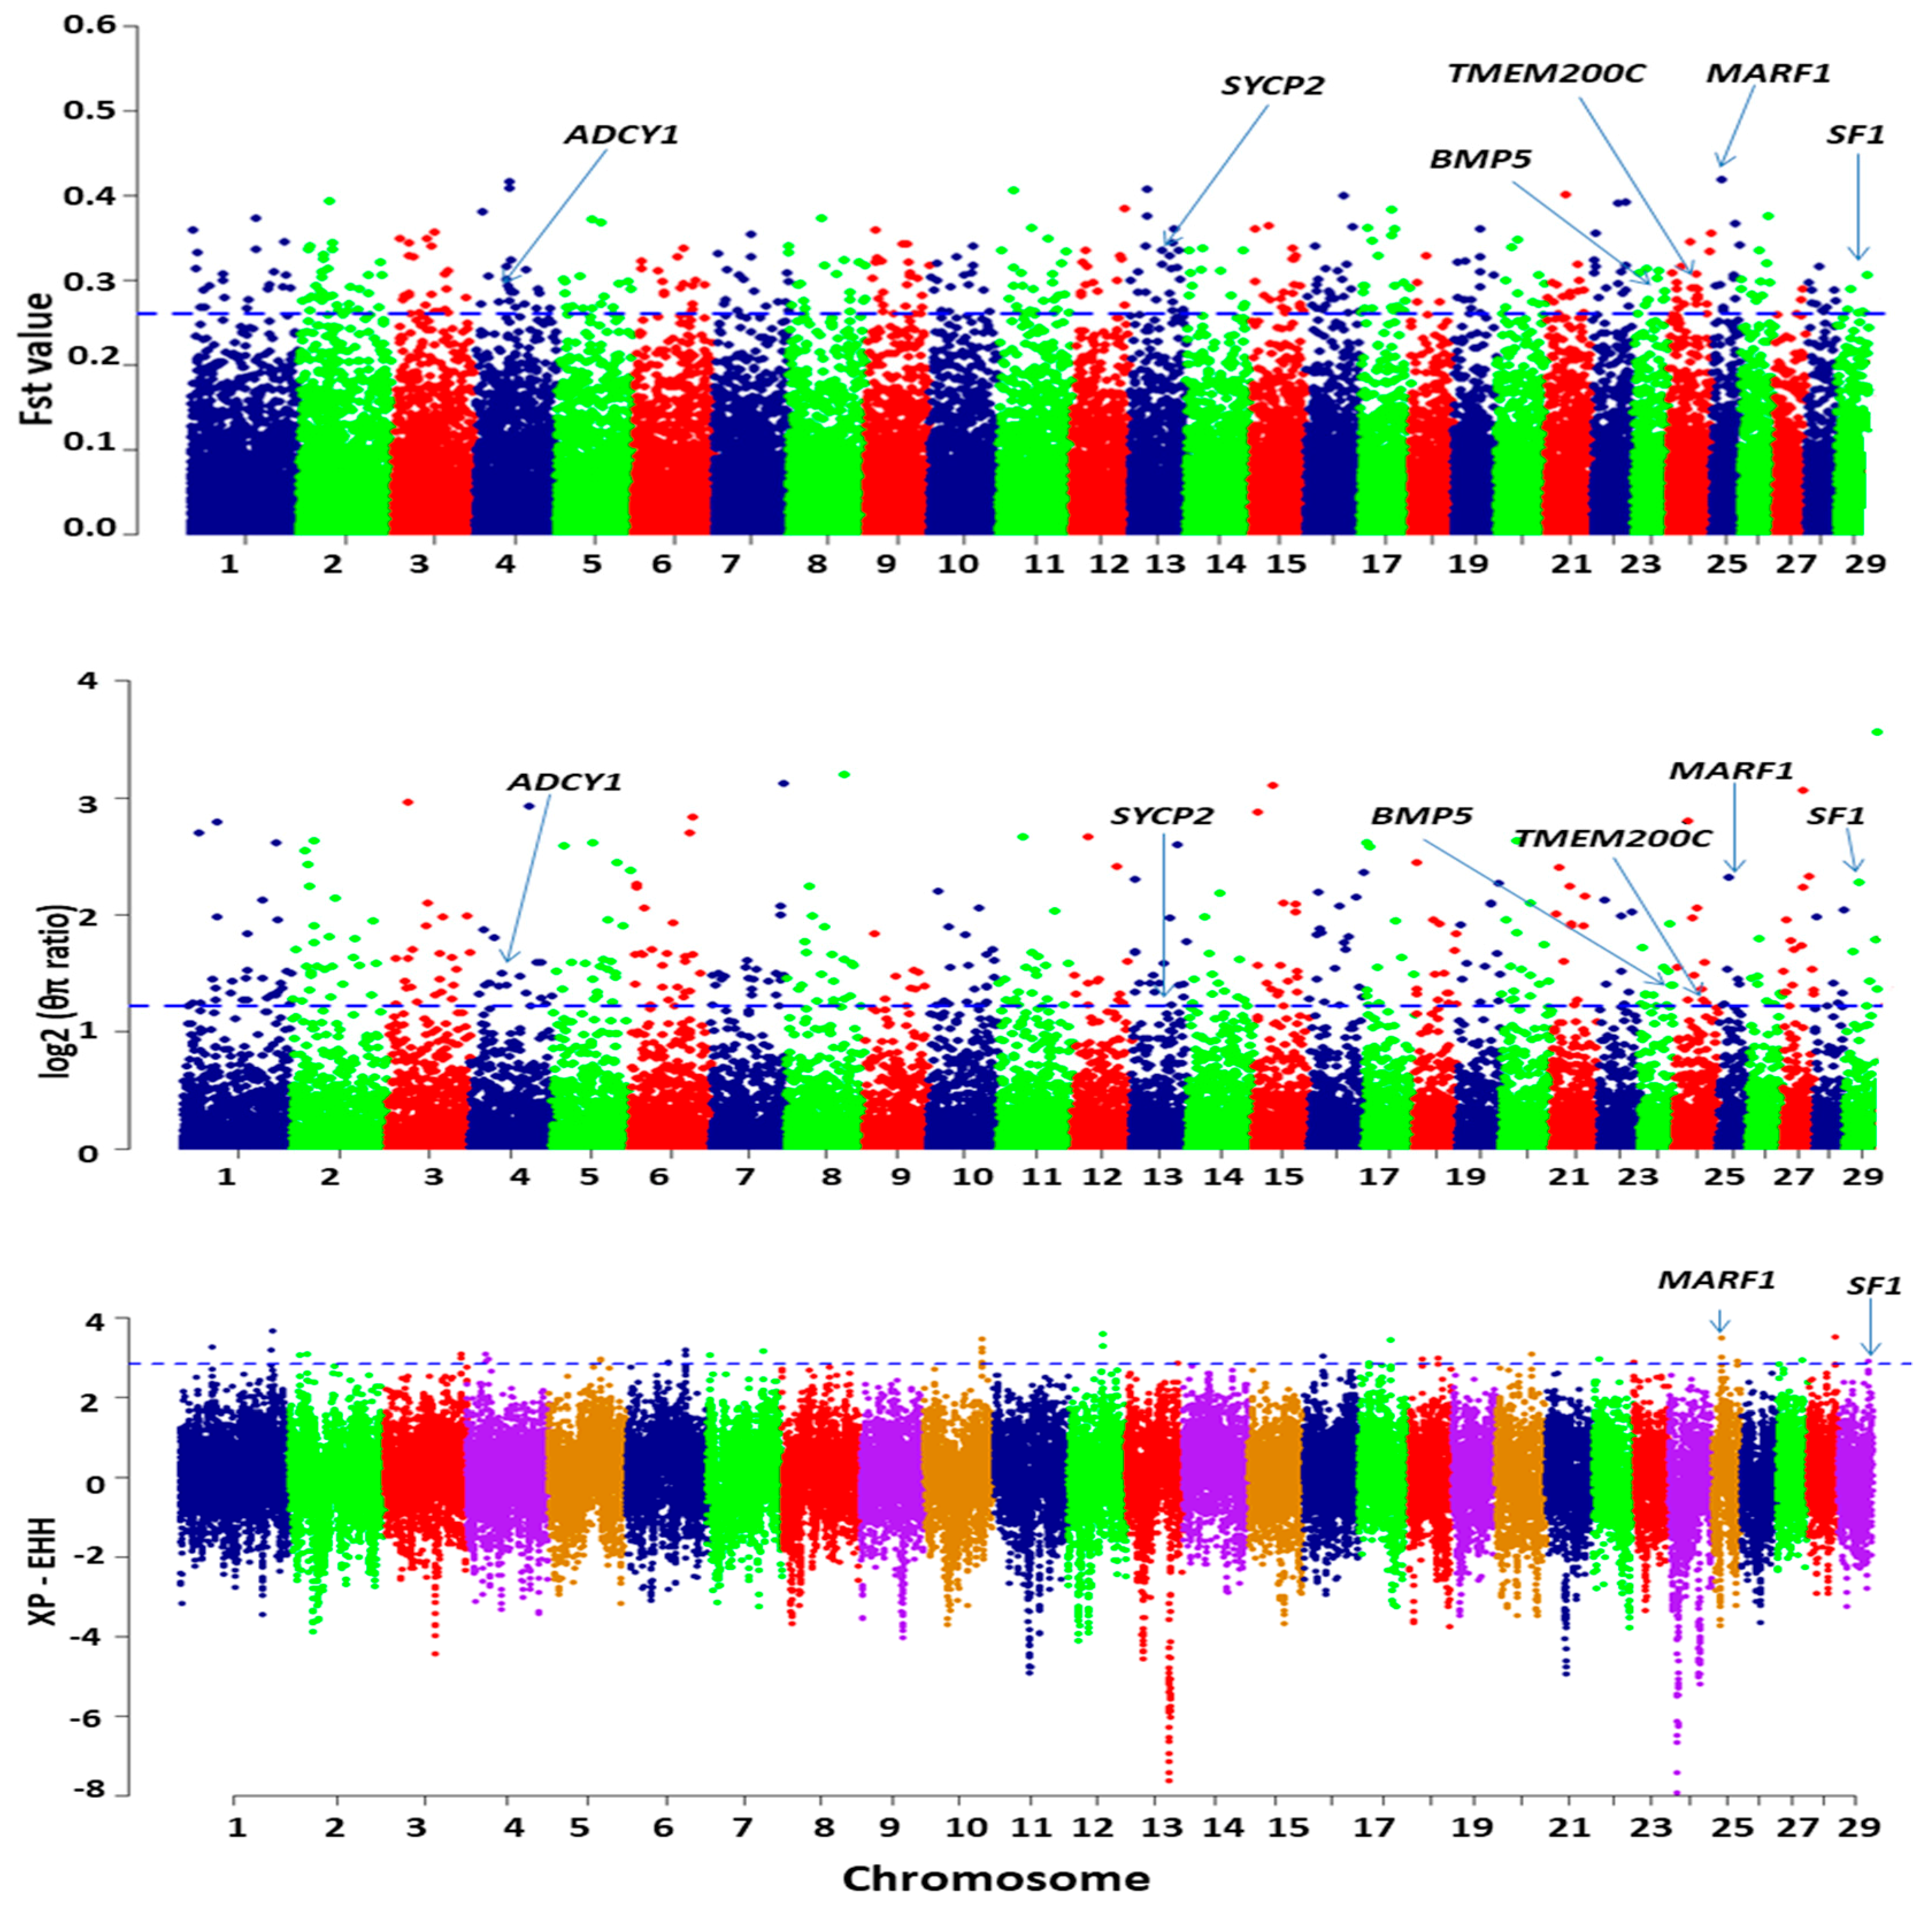
3.6.2. Genome-Wide Selective Sweep Analysis in High-Fecundity Goat Breeds (High vs. Low)
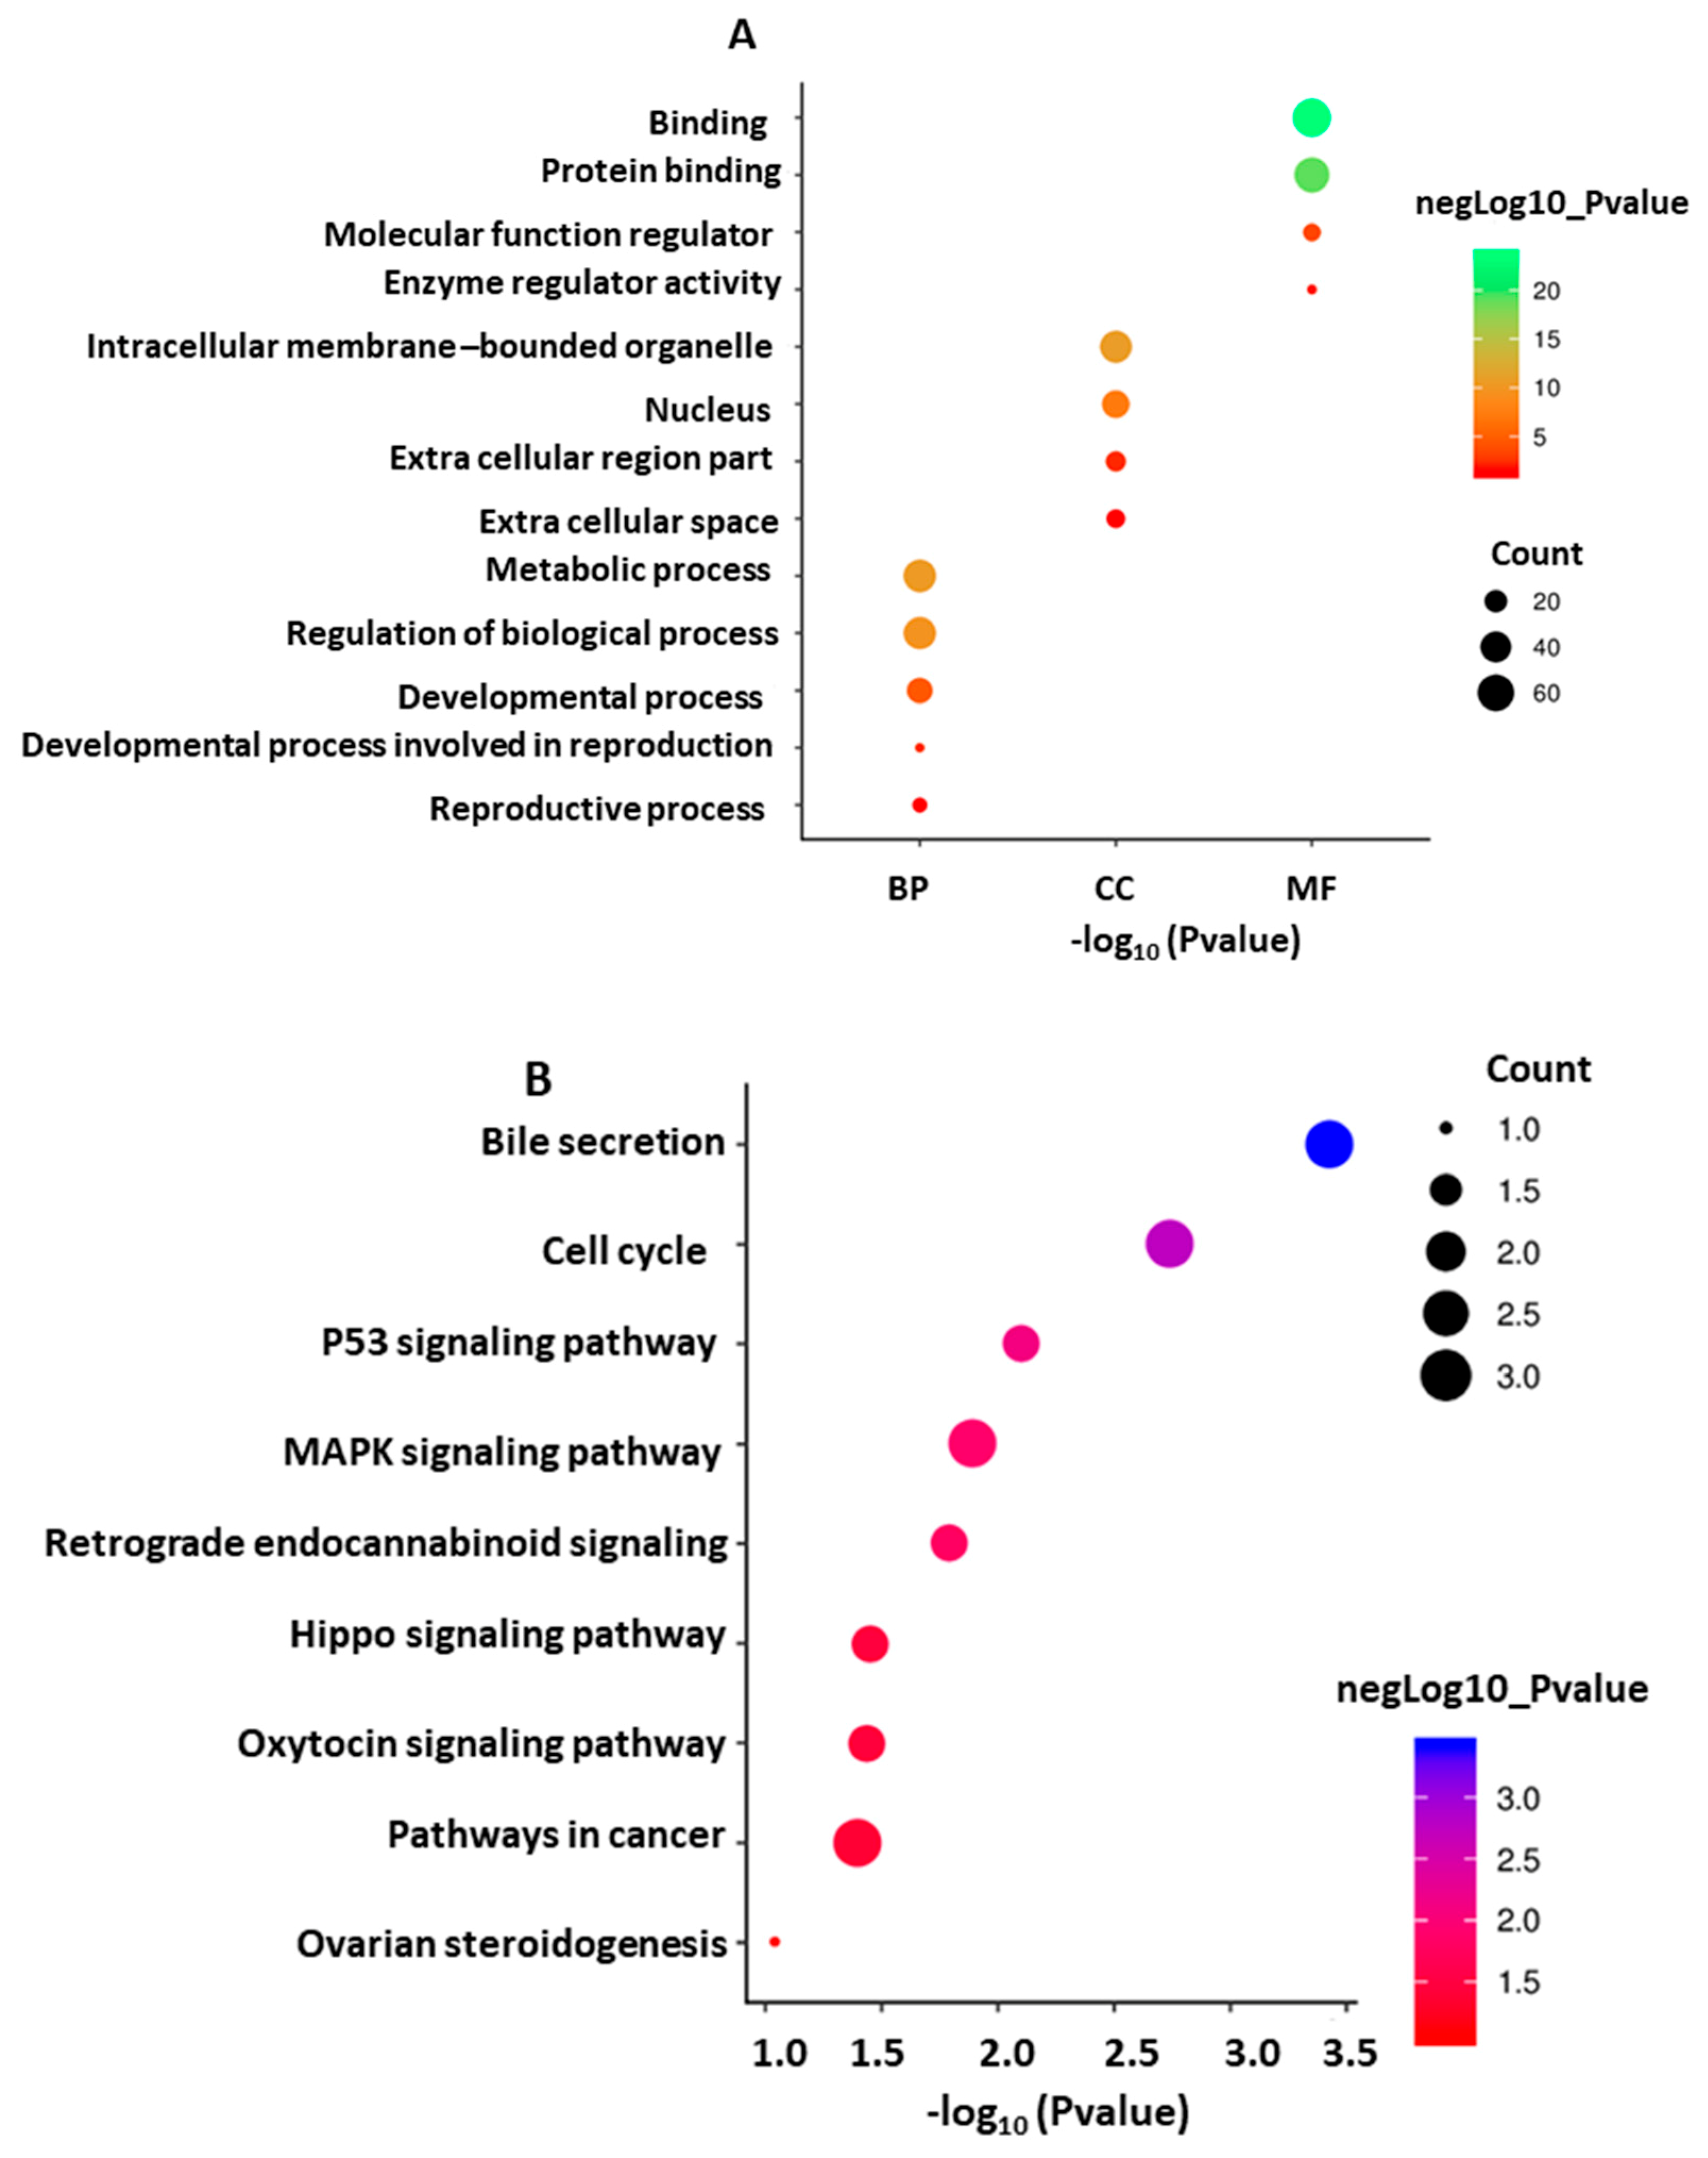
3.6.3. GO Annotation and KEGG Pathway of the Target Genes
4. Discussion
4.1. Candidate Genes in the ROH Regions
4.2. Signature of Selection
5. Conclusions
Supplementary Materials
Author Contributions
Funding
Acknowledgments
Conflicts of Interest
References
- Liu, G.; Zhao, Q.; Lu, J.; Sun, F.; Han, X.H.; Zhao, J.; Feng, H.; Wang, K.; Liu, C. Insights into the genetic diversity of indigenous goats and their conservation priorities. Asian Australas. J. Anim. Sci. 2019, 32, 1501–1510. [Google Scholar] [CrossRef] [PubMed]
- Brito, L.F.; Kijas, J.W.; Ventura, R.V.; Sargolzaei, M.; Porto-Neto, L.R.; Cánovas, A.; Feng, Z.; Jafarikia, M.; Schenkel, F.S. Genetic diversity and signatures of selection in various goat breeds revealed by genome-wide SNP markers. BMC Genom. 2017, 18, 229. [Google Scholar] [CrossRef] [PubMed]
- de Cara, M.Á.R.; Villanueva, B.; Toro, M.Á.; Fernández, J. Using genomic tools to maintain diversity and fitness in conservation programmes. Mol. Ecol. 2013, 22, 6091–6099. [Google Scholar] [CrossRef] [PubMed]
- Bosse, M.; Megens, H.-J.; Madsen, O.; Crooijmans, R.P.; Ryder, O.A.; Austerlitz, F.; Groenen, M.A.; De Cara, M. Ángeles R. Using genome-wide measures of coancestry to maintain diversity and fitness in endangered and domestic pig populations. Genome Res. 2015, 25, 970–981. [Google Scholar] [CrossRef]
- Ferenčaković, M.; Hamzić, E.; Gredler, B.; Solberg, T.R.; Klemetsdal, G.; Curik, I.; Sölkner, J. Estimates of autozygosity derived from runs of homozygosity: Empirical evidence from selected cattle populations. J. Anim. Breed. Genet. 2013, 130, 286–293. [Google Scholar] [CrossRef]
- Peripolli, E.; Munari, D.P.; Silva MV, G.B.; Lima AL, F.; Irgang, R.; Baldi, F. Runs of homozygosity: Current knowledge and applications in livestock. Anim. Genet. 2017, 48, 255–271. [Google Scholar] [CrossRef]
- Pemberton, T.J.; Absher, D.; Feldman, M.W.; Myers, R.M.; Rosenberg, N.A.; Li, J.Z. Genomic Patterns of Homozygosity in Worldwide Human Populations. Am. J. Hum. Genet. 2012, 91, 275–292. [Google Scholar] [CrossRef]
- Szmatoła, T.; Gurgul, A.; Ropka-Molik, K.; Jasielczuk, I.; Ząbek, T.; Bugno-Poniewierska, M. Characteristics of runs of homozygosity in selected cattle breeds maintained in Poland. Livest. Sci. 2016, 188, 72–80. [Google Scholar] [CrossRef]
- Bertrand, A.R.; Kadri, N.K.; Flori, L.; Gautier, M.; Druet, T. RZooRoH: An R package to characterize individual genomic autozygosity and identify homozygous-by-descent segments. Methods Ecol. Evol. 2019, 10, 860–866. [Google Scholar] [CrossRef]
- Wright, S. Size of population and breeding structure in relation to evolution. Science 1938, 87, 430–431. [Google Scholar]
- Liu, S.; He, S.; Chen, L.; Li, W.; Di, J.; Liu, M. Estimates of linkage disequilibrium and effective population sizes in Chinese Merino (Xinjiang type) sheep by genome-wide SNPs. Genes Genom. 2017, 39, 733–745. [Google Scholar] [CrossRef] [PubMed]
- Shin, D.-H.; Cho, K.-H.; Park, K.-D.; Lee, H.-J.; Kim, H. Accurate Estimation of Effective Population Size in the Korean Dairy Cattle Based on Linkage Disequilibrium Corrected by Genomic Relationship Matrix. Asian-Australasian J. Anim. Sci. 2013, 26, 1672–1679. [Google Scholar] [CrossRef] [PubMed][Green Version]
- Nicoloso, L.; Bomba, L.; Colli, L.; Negrini, R.; Milanesi, M.; Mazza, R.; Sechi, T.; Frattini, S.; Talenti, A.; Coizet, B.; et al. Genetic diversity of Italian goat breeds assessed with a medium-density SNP chip. Genet. Sel. Evol. 2015, 47, 62. [Google Scholar] [CrossRef] [PubMed]
- Tao, F.; Li, Z.Z.-X. DNA polymorphism of introns 1 and 2 of Prolactin Receptor Gene and its association with litter size in goats. Anim. Sci. Pap. Rep. 2011, 29, 343–350. [Google Scholar]
- Guan, D.; Luo, N.; Tan, X.; Zhao, Z.; Huang, Y.; Na, R.; Zhang, J.; Zhao, Y. Scanning of selection signature provides a glimpse into important economic traits in goats (Capra hircus). Sci. Rep. 2016, 6, 36372. [Google Scholar] [CrossRef] [PubMed]
- Wei, C.; Lu, J.; Xu, L.; Liu, G.; Wang, Z.; Zhao, F.; Zhang, L.; Han, X.; Du, L.; Liu, C. Genetic Structure of Chinese Indigenous Goats and the Special Geographical Structure in the Southwest China as a Geographic Barrier Driving the Fragmentation of a Large Population. PLoS ONE 2014, 9, e94435. [Google Scholar] [CrossRef] [PubMed]
- Du, L. Animal Genetic Resources in China: Sheep and Goats; China Agricultural Publishing House: Beijing, China, 2011; pp. 235–425. [Google Scholar]
- Liu, Q.; Chen, P.; He, K.; Kilpatrick, C.W.; Liu, S.-Y.; Yu, F.-H.; Jiang, X.-L. Phylogeographic Study of Apodemus ilex (Rodentia: Muridae) in Southwest China. PLoS ONE 2012, 7, e31453. [Google Scholar] [CrossRef]
- Yuan, J.; Cheng, F.; Zhou, S. Genetic Structure of the Tree Peony (Paeonia rockii) and the Qinling Mountains as a Geographic Barrier Driving the Fragmentation of a Large Population. PLoS ONE 2012, 7, e34955. [Google Scholar] [CrossRef]
- Purcell, S.; Neale, B.; Todd-Brown, K.; Thomas, L.; Ferreira, M.A.R.; Bender, D.; Maller, J.; Sklar, P.; De Bakker, P.I.W.; Daly, M.J.; et al. PLINK: A Tool Set for Whole-Genome Association and Population-Based Linkage Analyses. Am. J. Hum. Genet. 2007, 81, 559–575. [Google Scholar] [CrossRef]
- Chang, C.C.; Chow, C.C.; Tellier, L.C.; Vattikuti, S.; Purcell, S.M.; Lee, J.J. Second-generation PLINK: Rising to the challenge of larger and richer datasets. GigaScience 2015, 4, 7. [Google Scholar] [CrossRef]
- Kumar, C.; Song, S.; Dewani, P.; Kumar, M.; Parkash, O.; Ma, Y.; Malhi, K.K.; Yang, N.; Mwacharo, J.M.; He, X.; et al. Population structure, genetic diversity and selection signatures within seven indigenous Pakistani goat populations. Anim. Genet. 2018, 49, 592–604. [Google Scholar] [CrossRef] [PubMed]
- Al-Mamun, H.A.; Clark, S.A.; Kwan, P.; Gondro, C. Genome-wide linkage disequilibrium and genetic diversity in five populations of Australian domestic sheep. Genet. Sel. Evol. 2015, 47, 90. [Google Scholar] [CrossRef]
- McQuillan, R.; Leutenegger, A.-L.; Abdel-Rahman, R.; Franklin, C.S.; Pericic, M.; Barac-Lauc, L.; Smolej-Narancic, N.; Janicijevic, B.; Polašek, O.; Tenesa, A.; et al. Runs of Homozygosity in European Populations. Am. J. Hum. Genet. 2008, 83, 359–372. [Google Scholar] [CrossRef] [PubMed]
- NCBI. Gene Information for Ars1 Gcf Gz. 2019. Available online: https://www.ncbi.nlm.nih.gov/genome/?term=goat/GCF_001704415.1_ARS1_genomic_gff.gz (accessed on 10 October 2019).
- Solé, M.; Gori, A.-S.; Faux, P.; Bertrand, A.; Farnir, F.; Gautier, M.; Druet, T. Age-based partitioning of individual genomic inbreeding levels in Belgian Blue cattle. Genet. Sel. Evol. 2017, 49, 92. [Google Scholar] [CrossRef] [PubMed]
- Barbato, M.; Orozco-Terwengel, P.; Tapio, M.; Bruford, M.W. SNeP: A tool to estimate trends in recent effective population size trajectories using genome-wide SNP data. Front. Genet. 2015, 6, 109. [Google Scholar] [CrossRef]
- Sved, J. Linkage disequilibrium and homozygosity of chromosome segments in finite populations. Theor. Popul. Biol. 1971, 2, 125–141. [Google Scholar] [CrossRef]
- Excoffier, L.; Lischer, H.E.L. Arlequin suite ver 3.5: A new series of programs to perform population genetics analyses under Linux and Windows. Mol. Ecol. Resour. 2010, 10, 564–567. [Google Scholar] [CrossRef]
- Zheng, X.; Levine, D.; Shen, J.; Gogarten, S.M.; Laurie, C.; Weir, B.S. A high-performance computing toolset for relatedness and principal component analysis of SNP data. Bioinformatics 2012, 28, 3326–3328. [Google Scholar] [CrossRef]
- Tamura, K.; Peterson, D.; Peterson, N.; Stecher, G.; Nei, M.; Kumar, S. MEGA5: Molecular Evolutionary Genetics Analysis Using Maximum Likelihood, Evolutionary Distance, and Maximum Parsimony Methods. Mol. Biol. Evol. 2011, 28, 2731–2739. [Google Scholar] [CrossRef]
- Alexander, D.H.; Novembre, J.; Lange, K. Fast model-based estimation of ancestry in unrelated individuals. Genome Res. 2009, 19, 1655–1664. [Google Scholar] [CrossRef]
- Weir, B.S.; Cockerham, C.C. Estimating F-Statistics for the Analysis of Population Structure. Evolution 1984, 38, 1358–1370. [Google Scholar] [PubMed]
- Guo, J.; Tao, H.; Li, P.; Li, L.; Zhong, T.; Wang, L.; Ma, J.; Chen, X.; Song, T.; Zhang, H. Whole-genome sequencing reveals selection signatures associated with important traits in six goat breeds. Sci. Rep. 2018, 8, 10405. [Google Scholar] [CrossRef] [PubMed]
- Purfield, D.C.; Berry, D.P.; McParland, S.; Bradley, D.G. Runs of homozygosity and population history in cattle. BMC Genet. 2012, 13, 70. [Google Scholar] [CrossRef] [PubMed]
- Kijas, J.W.; Townley, D.; Dalrymple, B.P.; Heaton, M.P.; Maddox, J.F.; McGrath, A.; Wilson, P.; Ingersoll, R.G.; McCulloch, R.; McWilliam, S.; et al. A Genome Wide Survey of SNP Variation Reveals the Genetic Structure of Sheep Breeds. PLoS ONE 2009, 4, e4668. [Google Scholar] [CrossRef] [PubMed]
- Mastrangelo, S.; Tolone, M.; Sardina, M.T.; Sottile, G.; Sutera, A.M.; Di Gerlando, R.; Portolano, B. Genome-wide scan for runs of homozygosity identifies potential candidate genes associated with local adaptation in Valle del Belice sheep. Genet. Sel. Evol. 2017, 49, 84. [Google Scholar] [CrossRef] [PubMed]
- Manunza, A.; Noce, A.; Serradilla, J.M.; Goyache, F.; Martínez, A.; Capote, J.; Delgado, J.V.; Jordana, J.; Muñoz, E.; Molina, A.; et al. A genome-wide perspective about the diversity and demographic history of seven Spanish goat breeds. Genet. Sel. Evol. 2016, 48, 52. [Google Scholar] [CrossRef]
- Szpiech, Z.A.; Xu, J.; Pemberton, T.J.; Peng, W.; Zöllner, S.; Rosenberg, N.A.; Li, J.Z. Long Runs of Homozygosity Are Enriched for Deleterious Variation. Am. J. Hum. Genet. 2013, 93, 90–102. [Google Scholar] [CrossRef]
- Druet, T.; Gautier, M. A model-based approach to characterize individual inbreeding at both global and local genomic scales. Mol. Ecol. 2017, 26, 5820–5841. [Google Scholar] [CrossRef]
- Makina, S.O.; Taylor, J.F.; Van Marle-Koster, E.; Muchadeyi, F.C.; Makgahlela, M.L.; MacNeil, M.D.; Maiwashe, A. Extent of Linkage Disequilibrium and Effective Population Size in Four South African Sanga Cattle Breeds. Front. Genet. 2015, 6, 24. [Google Scholar] [CrossRef]
- Daetwyler, H.D.; Pong-Wong, R.; Villanueva, B.; Woolliams, J.A. The Impact of Genetic Architecture on Genome-Wide Evaluation Methods. Genetics 2010, 185, 1021–1031. [Google Scholar] [CrossRef]
- Brito, L.F.; Jafarikia, M.; Grossi, D.A.; Kijas, J.W.; Porto-Neto, L.R.; Ventura, R.V.; Salgorzaei, M.; Schenkel, F.S. Characterization of linkage disequilibrium, consistency of gametic phase and admixture in Australian and Canadian goats. BMC Genet. 2015, 16, 67. [Google Scholar] [CrossRef] [PubMed]
- Visser, C.; Lashmar, S.F.; Van Marle-Köster, E.; Poli, M.A.; Allain, D. Genetic Diversity and Population Structure in South African, French and Argentinian Angora Goats from Genome-Wide SNP Data. PLoS ONE 2016, 11, e0154353. [Google Scholar] [CrossRef] [PubMed]
- Edea, Z.; Dessie, T.; Dadi, H.; Do, K.-T.; Kim, K.-S. Genetic Diversity and Population Structure of Ethiopian Sheep Populations Revealed by High-Density SNP Markers. Front. Genet. 2017, 8, 218. [Google Scholar] [CrossRef] [PubMed]
- Wang, X.; Yang, Q.; Wang, K.; Yan, H.; Pan, C.; Chen, H.; Liu, J.; Zhu, H.; Qu, L.; Lan, X. Two strongly linked single nucleotide polymorphisms (Q320P and V397I) in GDF9 gene are associated with litter size in cashmere goats. Theriogenology 2019, 125, 115–121. [Google Scholar] [CrossRef]
- Settle, S.; Marker, P.; Gurley, K.; Sinha, A.; Thacker, A.; Wang, Y.; Higgins, K.; Cunha, G.; Kingsley, D.M. The BMP Family Member Gdf7 Is Required for Seminal Vesicle Growth, Branching Morphogenesis, and Cytodifferentiation. Dev. Biol. 2001, 234, 138–150. [Google Scholar] [CrossRef][Green Version]
- Hou, J.; An, X.; Li, G.; Wang, Y.; Song, Y.; Cao, B. Exploring polymorphisms and their effects on reproductive traits of the INHA and INHβA genes in three goat breeds. Anim. Sci. J. 2012, 83, 273–278. [Google Scholar] [CrossRef] [PubMed]
- Ran, X.-Q.; Pan, H.; Huang, S.-H.; Liu, C.; Niu, X.; Li, S.; Wang, J.-F. Copy number variations of MTHFSD gene across pig breeds and its association with litter size traits in Chinese indigenous Xiang pig. J. Anim. Physiol. Anim. Nutr. 2018, 102, 1320–1327. [Google Scholar] [CrossRef]
- Su, Y.-Q.; Sugiura, K.; Sun, F.; Pendola, J.K.; Cox, G.A.; Handel, M.A.; Schimenti, J.C.; Eppig, J.J. MARF1 regulates essential oogenic processes in mice. Science 2012, 335, 1496–1499. [Google Scholar] [CrossRef]
- Zhou, J.; Stein, P.; Leu, N.A.; Chmátal, L.; Xue, J.; Ma, J.; Huang, X.; Lampson, M.A.; Schultz, R.M.; Wang, P.J. Accelerated reproductive aging in females lacking a novel centromere protein SYCP2L. Hum. Mol. Genet. 2015, 24, 6505–6514. [Google Scholar] [CrossRef]
- Moioli, B.; Steri, R.; Marchitelli, C.; Catillo, G.; Buttazzoni, L. Genetic parameters and genome-wide associations of twinning rate in a local breed, the Maremmana cattle. Animal 2017, 11, 1660–1666. [Google Scholar] [CrossRef]
- Barrionuevo, F.J.; Burgos, M.; Scherer, G.; Jiménez, R. Genes promoting and disturbing testis development. Histol. Histopathol. 2012, 27, 1361–1383. [Google Scholar] [PubMed]
- Xu, Y.; Faulkner, L.D.; Hill, J.W. Cross-Talk between Metabolism and Reproduction: The Role of POMC and SF1 Neurons. Front. Endocrinol. 2012, 2, 98. [Google Scholar] [CrossRef] [PubMed]
- Sun, M.-H.; Zheng, J.; Xie, F.-Y.; Shen, W.; Yin, S.; Ma, J.-Y. Cumulus Cells Block Oocyte Meiotic Resumption via Gap Junctions in Cumulus Oocyte Complexes Subjected to DNA Double-Strand Breaks. PLoS ONE 2015, 10, e0143223. [Google Scholar] [CrossRef] [PubMed]
- Xu, S.-S.; Gao, L.; Xie, X.-L.; Ren, Y.-L.; Shen, Z.-Q.; Wang, F.; Shen, M.; Eyϸórsdóttir, E.; Hallsson, J.H.; Kiseleva, T.; et al. Genome-Wide Association Analyses Highlight the Potential for Different Genetic Mechanisms for Litter Size Among Sheep Breeds. Front. Genet. 2018, 9, 118. [Google Scholar] [CrossRef] [PubMed]
- Pierre, A.; Pisselet, C.; Dupont, J.; Bontoux, M.; Monget, P. Bone Morphogenetic Protein 5 Expression in the Rat Ovary: Biological Effects on Granulosa Cell Proliferation and Steroidogenesis1. Biol. Reprod. 2005, 73, 1102–1108. [Google Scholar] [CrossRef] [PubMed]
- Fan, H.Y.; Liu, Z.; Mullany, L.K.; Richards, J.S. Consequences of RAS and MAPK activation in the ovary: The good, the bad and the ugly. Mol. Cell. Endocrinol. 2012, 356, 74–79. [Google Scholar] [CrossRef] [PubMed]
- Shkolnik, K.; Tadmor, A.; Ben-Dor, S.; Nevo, N.; Galiani, D.; Dekel, N. Reactive oxygen species are indispensable in ovulation. Proc. Natl. Acad. Sci. USA 2011, 108, 1462–1467. [Google Scholar] [CrossRef]


| Parameters | Goat 50K |
|---|---|
| Total number of SNPs | 51,474 |
| SNP Call frequency (call rate) (<0.95) | 1338 |
| Minor allele frequency (<0.05) | 2296 |
| Hardy-Weinberg equilibrium (p < 1 × 10⁻⁵) | 1814 |
| SNPs removed from sex chromosome | 715 |
| Total SNPs removed | 6163 |
| Total SNPs remained | 45,311 |
| Breed | SNP No. | Average Length (Mb) | Average Number | FROH | R (FROH, FHOM) | ||||
|---|---|---|---|---|---|---|---|---|---|
| Mean ± SE | Range | Mean ± SE | Range | Mean ± SE | Range | Mean ± SE | |||
| GF | 15−1195 | 3.29 ± 0.001 | 1.00−64.21 | 142.29 ± 2.41 | 53−244 | 0.19 ± 0.005 | 0.05−0.48 | 0.057 ± 0.007 | 0.97 |
| JG | 15−1192 | 2.5 ± 0.002 | 1.00−61.64 | 35.50 ± 0.23 | 13−76 | 0.03 ± 0.009 | 0.006−0.24 | −0.002 ± 0.001 | 0.89 |
| LN | 15−1066 | 2.99 ± 0.000 | 1.00−55.87 | 130.26 ± 0.21 | 91−162 | 0.162 ± 0.0004 | 0.105−0.234 | −0.034 ± 0.001 | 0.96 |
| LP | 15−1304 | 1.95 ± 0.001 | 1.00−67.54 | 129 ± 0.82 | 67−154 | 0.105 ± 0.002 | 0.03−0.29 | 0.010 ± 0.003 | 0.95 |
| NJ | 15−580 | 2.59 ± 0.001 | 1.16−30.61 | 69.79 ± 0.63 | 26−86 | 0.06 ± 0.0009 | 0.013−0.117 | −0.020 ± 0.001 | 0.98 |
| QG | 15−1158 | 2.34 ± 0.006 | 1.00−61.65 | 26.83 ± 0.45 | 11−61 | 0.026 ± 0.001 | 0.006−0.225 | −0.008 ± 0.001 | 0.99 |
| Breed | FROH (0–3) | FROH (3–5) | FROH (5–10) | FROH (10–20) | FROH (20–30) | FROH (>30) | Mean |
|---|---|---|---|---|---|---|---|
| GF | 0.060167 | 0.013693 | 0.015554 | 0.024719 | 0.019603 | 0.026762 | 0.0267 |
| JG | 0.013824 | 0.002124 | 0.003958 | 0.004607 | 0.003361 | 0.002482 | 0.0050 |
| LN | 0.053225 | 0.018406 | 0.024548 | 0.02398 | 0.009217 | 0.004083 | 0.0222 |
| LP | 0.055294 | 0.003027 | 0.004658 | 0.009596 | 0.006219 | 0.007642 | 0.0144 |
| NJ | 0.030963 | 0.006652 | 0.006211 | 0.005015 | 0.002545 | 0.000437 | 0.0086 |
| QG | 0.010724 | 0.001535 | 0.002563 | 0.001888 | 0.002893 | 0.001974 | 0.0035 |
| Breed | GF | JG | LN | LP | NJ | QG |
|---|---|---|---|---|---|---|
| GF | 0.06847 | 0.17687 | 0.17422 | 0.11081 | 0.08963 | |
| JG | 0.06618 | 0.11153 | 0.11506 | 0.04969 | 0.02867 | |
| LN | 0.16211 | 0.10554 | 0.20055 | 0.06391 | 0.08185 | |
| LP | 0.15989 | 0.10869 | 0.18172 | 0.13337 | 0.10824 | |
| NJ | 0.10489 | 0.04848 | 0.06191 | 0.12486 | 0.02116 | |
| QG | 0.08573 | 0.02826 | 0.07859 | 0.10259 | 0.02094 |
| Chromosome | Position | FST | ZFST | π | XP-EHH | Gene Name |
|---|---|---|---|---|---|---|
| 25 | 13,838,569 | 0.419 | 6.129 | 5.002 | 3.486 | Meiosis arrest female 1 (MARF1) |
| 29 | 43,352,393 | 0.305 | 4.262 | 3.450 | 2.903 | Steroidogenic factor-1 (SF1) |
| 24 | 39,657,370 | 0.306 | 4.281 | 2.409 | Transmembrane Protein 200C (TMEM200C) | |
| 13 | 55,939,729 | 0.329 | 4.647 | 2.346 | Synaptonemal Complex Protein 2 (SYCP2) | |
| 4 | 43,874,883 | 0.301 | 4.193 | 2.829 | Adenylate cyclase 1 (ADCY1) | |
| 23 | 44,074,688 | 0.286 | 3.946 | 2.635 | Bone Morphogenetic Protein 5 (BMP5) |
| Breed | CHR | Start (bp) | End (bp) | Gene Symbol | Distance between ROH Region and Gene ** | Function |
|---|---|---|---|---|---|---|
| GF | 7 | 63,446,436 | 66,314,871 | GDF9 * | 2.57 Mb | Reproduction |
| GF | 11 | 76,923,989 | 77,967,512 | GDF7 * | 0.98 Mb | Reproduction |
| GF | 2 | 27,707,065 | 29,287,557 | INHA * | 0.60 Mb | Reproduction |
| LP | 18 | 13,400,847 | 14,834,169 | MTHFSD * | 0.35 Mb | Reproduction |
| LP | 25 | 13,070,993 | 14,141,921 | MARF1 * | 0.82Mb | Reproduction |
| GF | 13 | 53,460,986 | 56,246,114 | SYCP2 * | 2.48 Mb | Reproduction |
| JG | 24 | 40,941,530 | 42,250,672 | TMEM200C | 1.30 Mb | Reproduction |
| LP | 4 | 41,890,323 | 42,021,443 | ADCY1 | 2.01 Mb | Reproduction |
© 2019 by the authors. Licensee MDPI, Basel, Switzerland. This article is an open access article distributed under the terms and conditions of the Creative Commons Attribution (CC BY) license (http://creativecommons.org/licenses/by/4.0/).
Share and Cite
Islam, R.; Li, Y.; Liu, X.; Berihulay, H.; Abied, A.; Gebreselassie, G.; Ma, Q.; Ma, Y. Genome-Wide Runs of Homozygosity, Effective Population Size, and Detection of Positive Selection Signatures in Six Chinese Goat Breeds. Genes 2019, 10, 938. https://doi.org/10.3390/genes10110938
Islam R, Li Y, Liu X, Berihulay H, Abied A, Gebreselassie G, Ma Q, Ma Y. Genome-Wide Runs of Homozygosity, Effective Population Size, and Detection of Positive Selection Signatures in Six Chinese Goat Breeds. Genes. 2019; 10(11):938. https://doi.org/10.3390/genes10110938
Chicago/Turabian StyleIslam, Rabiul, Yefang Li, Xuexue Liu, Haile Berihulay, Adam Abied, Gebremedhin Gebreselassie, Qing Ma, and Yuehui Ma. 2019. "Genome-Wide Runs of Homozygosity, Effective Population Size, and Detection of Positive Selection Signatures in Six Chinese Goat Breeds" Genes 10, no. 11: 938. https://doi.org/10.3390/genes10110938
APA StyleIslam, R., Li, Y., Liu, X., Berihulay, H., Abied, A., Gebreselassie, G., Ma, Q., & Ma, Y. (2019). Genome-Wide Runs of Homozygosity, Effective Population Size, and Detection of Positive Selection Signatures in Six Chinese Goat Breeds. Genes, 10(11), 938. https://doi.org/10.3390/genes10110938