Article

Developmental and Molecular Changes Underlying the Vernalization-Induced Transition to Flowering in Aquilegia coerulea (James)

1
Department of Biological Sciences, California State Polytechnic University Pomona, CA 91768, USA
2
Plant Science Department, California State Polytechnic University Pomona, CA 91768, USA
3
Department of Plants, Soils and Climate / Center for Integrated BioSystems, Utah State University, Logan UT 84322, USA
4
Bioinformatics Facility, Center for Integrated BioSystems, Utah State University, Logan UT 84322, USA
5
Department of Organismic and Evolutionary Biology, Harvard University, Cambridge MA 02138, USA
*
Author to whom correspondence should be addressed.
Genes 2019, 10(10), 734; https://doi.org/10.3390/genes10100734
Submission received: 12 August 2019 / Revised: 5 September 2019 / Accepted: 18 September 2019 / Published: 22 September 2019
(This article belongs to the Section Plant Genetics and Genomics)

Abstract

:
Reproductive success in plants is dependent on many factors but the precise timing of flowering is certainly among the most crucial. Perennial plants often have a vernalization or over-wintering requirement in order to successfully flower in the spring. The shoot apical meristem undergoes drastic developmental and molecular changes as it transitions into inflorescence meristem (IM) identity, which then gives rise to floral meristems (FMs). In this study, we have examined the developmental and gene expression changes underlying the transition from the vegetative to reproductive phases in the basal eudicot Aquilegia coerulea, which has evolved a vernalization response independently relative to other established model systems. Results from both our histology and scanning electron studies demonstrate that developmental changes in the meristem occur gradually during the third and fourth weeks of vernalization. Based on RNAseq data and cluster analysis, several known flowering time loci, including AqFT and AqFL1, exhibit dramatic changes in expression during the fourth week. Further consideration of candidate gene homologs as well as unexpected loci of interest creates a framework in which we can begin to explore the genetic basis of the flowering time transition in Aquilegia.

1. Introduction

Flowers are a synapomorphy of the angiosperms that have been a driving force in their rapid diversification into ~350,000+ species over the last ~140 million years [1]. For the reproductive success of plants, accurately timing the transitioning from the vegetative state to flowering is critical. Flowering at a time when the season favors both pollination and seed dispersal is key for successful outcrossing and reproductive success [2]. The careful orchestration and integration of exogenous and endogenous signals requires this process to be highly regulated at the genetic level [3]. Besides the maturity of the plant, the effects of the photoperiod, temperature, and hormones play important roles in the transition to flowering. In the context of temperature, vernalization or exposure to the prolonged cold is necessary for plants such as winter annuals to flower [4]. Genetic mechanisms are wired in such a way that plants can distinguish between proper vernalization in contrast to short cold snaps. This is very important for the plants because premature flowering in the winter season itself can take a toll on reproductive success or other terms of fitness. Appropriate vernalization triggers genetic and developmental changes in the shoot apical meristem (SAM) resulting in its transition to inflorescence meristem (IM) identity, which then gives rise to either terminal or lateral flower meristems (FMs).
The genetic mechanisms underlying vernalization have been studied in several plant models, although the core eudicot Arabidopsis thaliana remains the best understood at the molecular level. Flowering in A. thaliana is controlled by multiple exogenous and endogenous pathways that integrate both biotic and abiotic signals [5]. Our understanding of the vernalization pathway has been facilitated by the fact that not all A. thaliana accessions require vernalization [6]. Much of this variation is due to the natural segregation of non-functional alleles of the MADS-box transcription factor FLOWERING LOCUS C (FLC), which acts as a flowering repressor that keeps plants in a vegetative state in the absence of vernalization [7,8]. Prior to vernalization, FLC is highly expressed in vegetative tissues, leaves, and both the root and shoot meristems, but, as vernalization proceeds, FLC expression continuously decreases [8,9]. FLC remains down-regulated following vernalization thanks to epigenetic silencing, but its expression is reactivated in seeds, which allows the next generation to re-establish the vernalization requirement [9,10]. Down-regulation of FLC relieves the repression of the floral promoter FLOWERING LOCUS T (FT), which results in the further induction of a broad suite of flowering-associated genes, including SUPPRESSOR OF CONSTANS 1 (SOC1) and AGL24 [11,12]. These loci promote the transition of the SAM to IM identity, which, in turn, leads to the activation of FM identity. This pathway is best represented by the transcription factors LEAFY (LFY) and APETALA1 (AP1), which are directly activated by FT and also provides positive feedback for each other [13] As noted above, several accessions of Arabidopsis do not require vernalization, and these are associated with nonfunctional alleles of FLC and another locus, FRIGIDA (FRI), which upregulates FLC before vernalization [14]. While this FLC-dependent vernalization response is clearly conserved across the Brassicaceae [15], it appears that different genetic programs are responsible for vernalization in models such as wheat [16] or beet [17]. Yet, they all converge on homologs of FT as the primary activator of flowering.
To broaden the understanding of flowering time genetics in taxa requiring vernalization, we have used Aquilegia coerulea as our model system in this study. The genus Aquilegia is a basal eudicot with ~70 species that have acquired diverse habitats from Eurasia to North America [18]. It has been best studied for its interesting floral morphology, which includes spurred petals—a key innovation related to the radiation of the genus—as well as petaloid sepals, and the novel staminodes [19,20,21]. The A. coerulea genome has been sequenced and functional genetic studies using virus-induced gene silencing has significantly elucidated the developmental genetic basis of these floral traits [22,23,24]. A. coerulea is also a promising model for the investigation of flowering time, particularly vernalization [20] (Figure 1). Previous studies of the control of flowering time in the species A. formosa found that it does not have a photoperiod response but strongly responds to cold treatment [25]. Homologs of the loci associated with IM and FM identity in A. thaliana were expressed in patterns consistent with potentially conserved functions, but most of the flowering time-related genes had divergent gene expression patterns and no homolog of FLC has been identified in the genome [25].
We had two main aims for this study. First, we sought to understand how the developmental transitions in the meristem from SAM to IM and then to FM occur over the course of vernalization, which has never been directly examined in A. coerulea ‘Origami’, which is the main functional model in Aquilegia. The second aim was to develop a transcriptomic resource that provides a more global picture of the reproductive transition and can help us expand the current candidate gene list for functional testing in the future. We are particularly interested in identifying other potential repressors of FT that could control transition to flowering in the absence of FLC. Adding Aquilegia to our repertoire of flowering time models will help us more broadly to understand how these genetic pathways have evolved in plants outside core eudicots and grasses. The current study has uncovered the exact timing of the floral transition in ‘Origami’ and highlighted potential floral repressors, including paralogs of FT and AGL24.

2. Materials and Methods

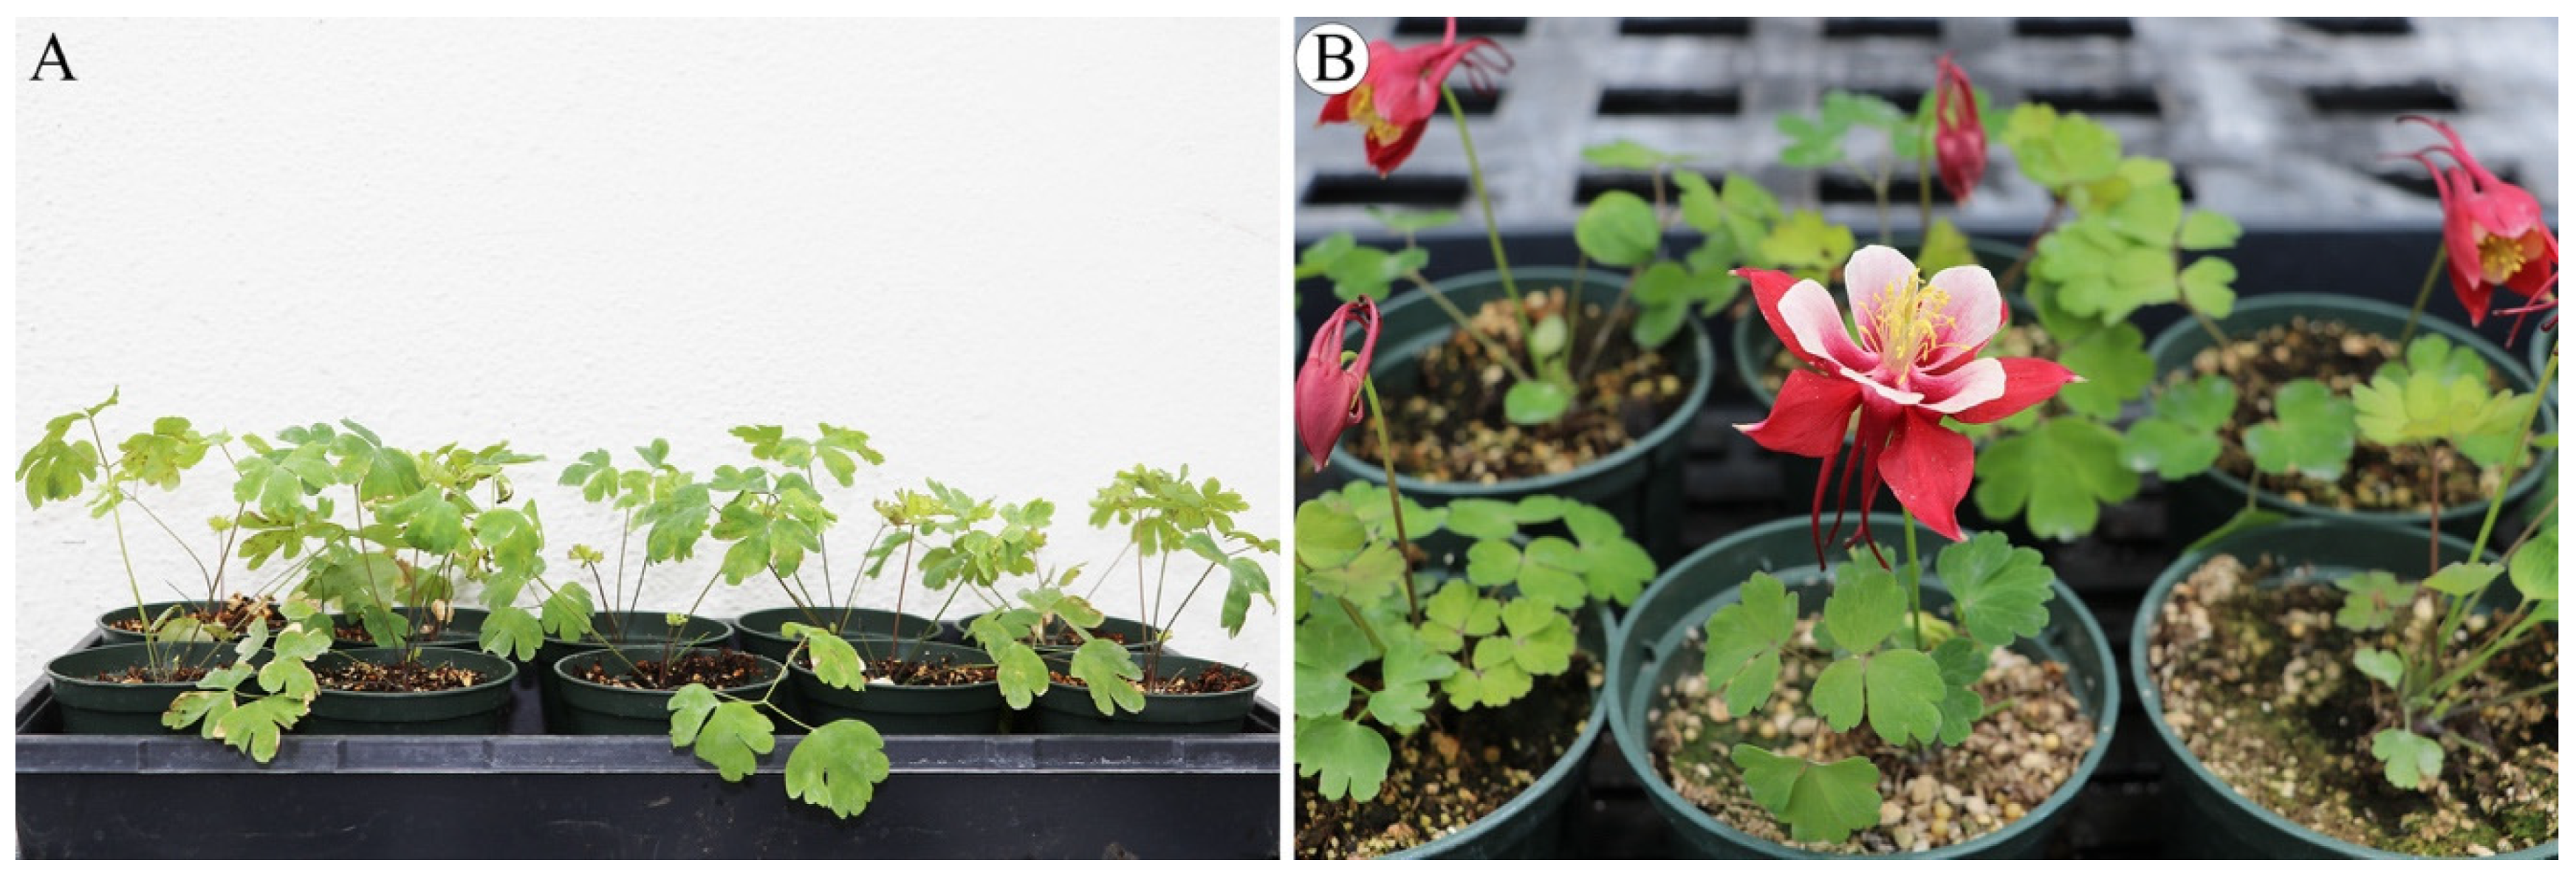
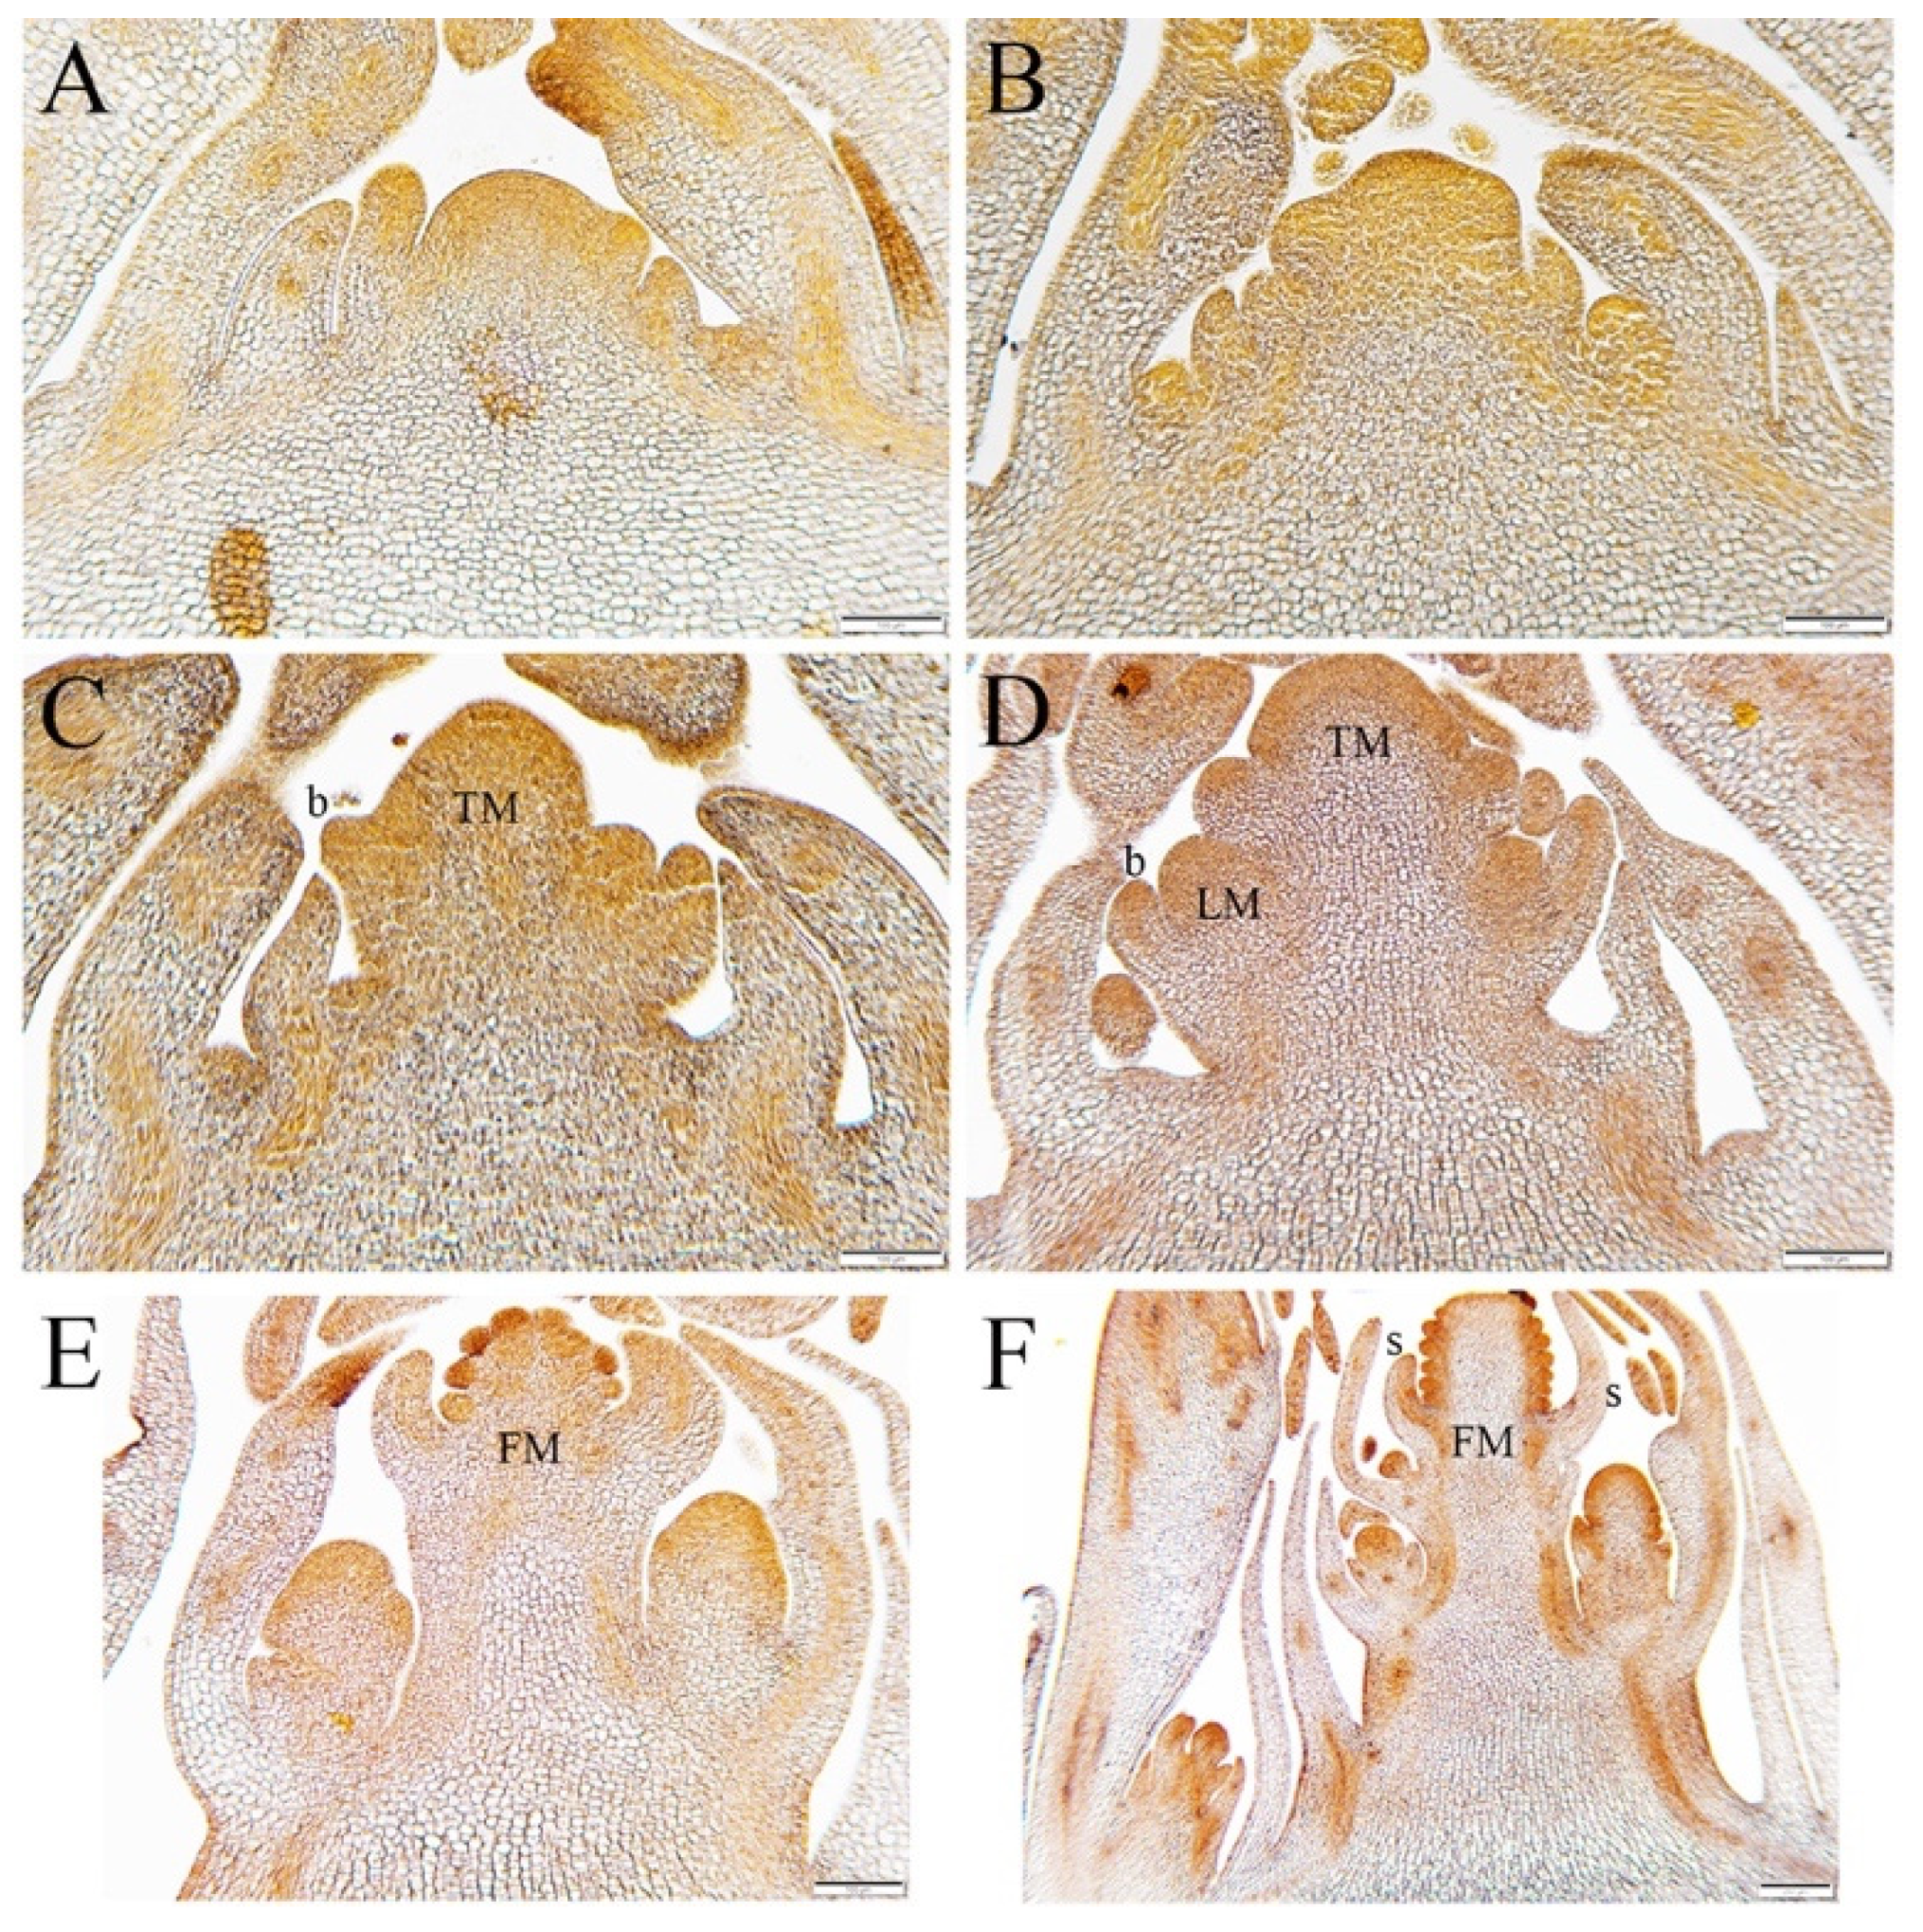
2.1. Plant Growth and Histology

Seeds for Aquilegia coerulea ‘Origami Red and White’ were obtained from Swallowtail Seeds (Santa Rosa, CA, USA). A. coerulea plants were grown to an eight-leaf stage in the Cal Poly Pomona greenhouse. Plants were vernalized at 6 °C for 4 weeks (Percival E41VL, Perry, IA, USA). For each time point (pre-vernalization, weeks 1, 2, 3, 4, and post vernalization weeks 5, 6, 7, and 8), apical meristems were dissected and fixed in formalin-propionic acid-alcohol (FPA). Following this, the meristems were processed through a dehydration series of increasing ethanol solutions (70%, 90%, 95%, 100% w/safranin, and 100%). Following dehydration, the meristems were transferred into xylene followed by paraffin oil and, lastly, two changes in pure paraffin embedding wax. The tissues were carefully oriented and embedded in paraffin wax using a histo-embedder (Leica EG1160, Wetzlar, Germany). Meristem samples were sectioned to 8 µm using a microtome (Leica RM 2135, Germany). The slides were then stained using the Sharman stain series [26]. Slides were observed using a Laborlux D compound microscope (Leitz, Wetzlar, Germany). Images were captured using the Olympus DP73 microscope camera attachment (Leitz, Wetzlar, Germany).

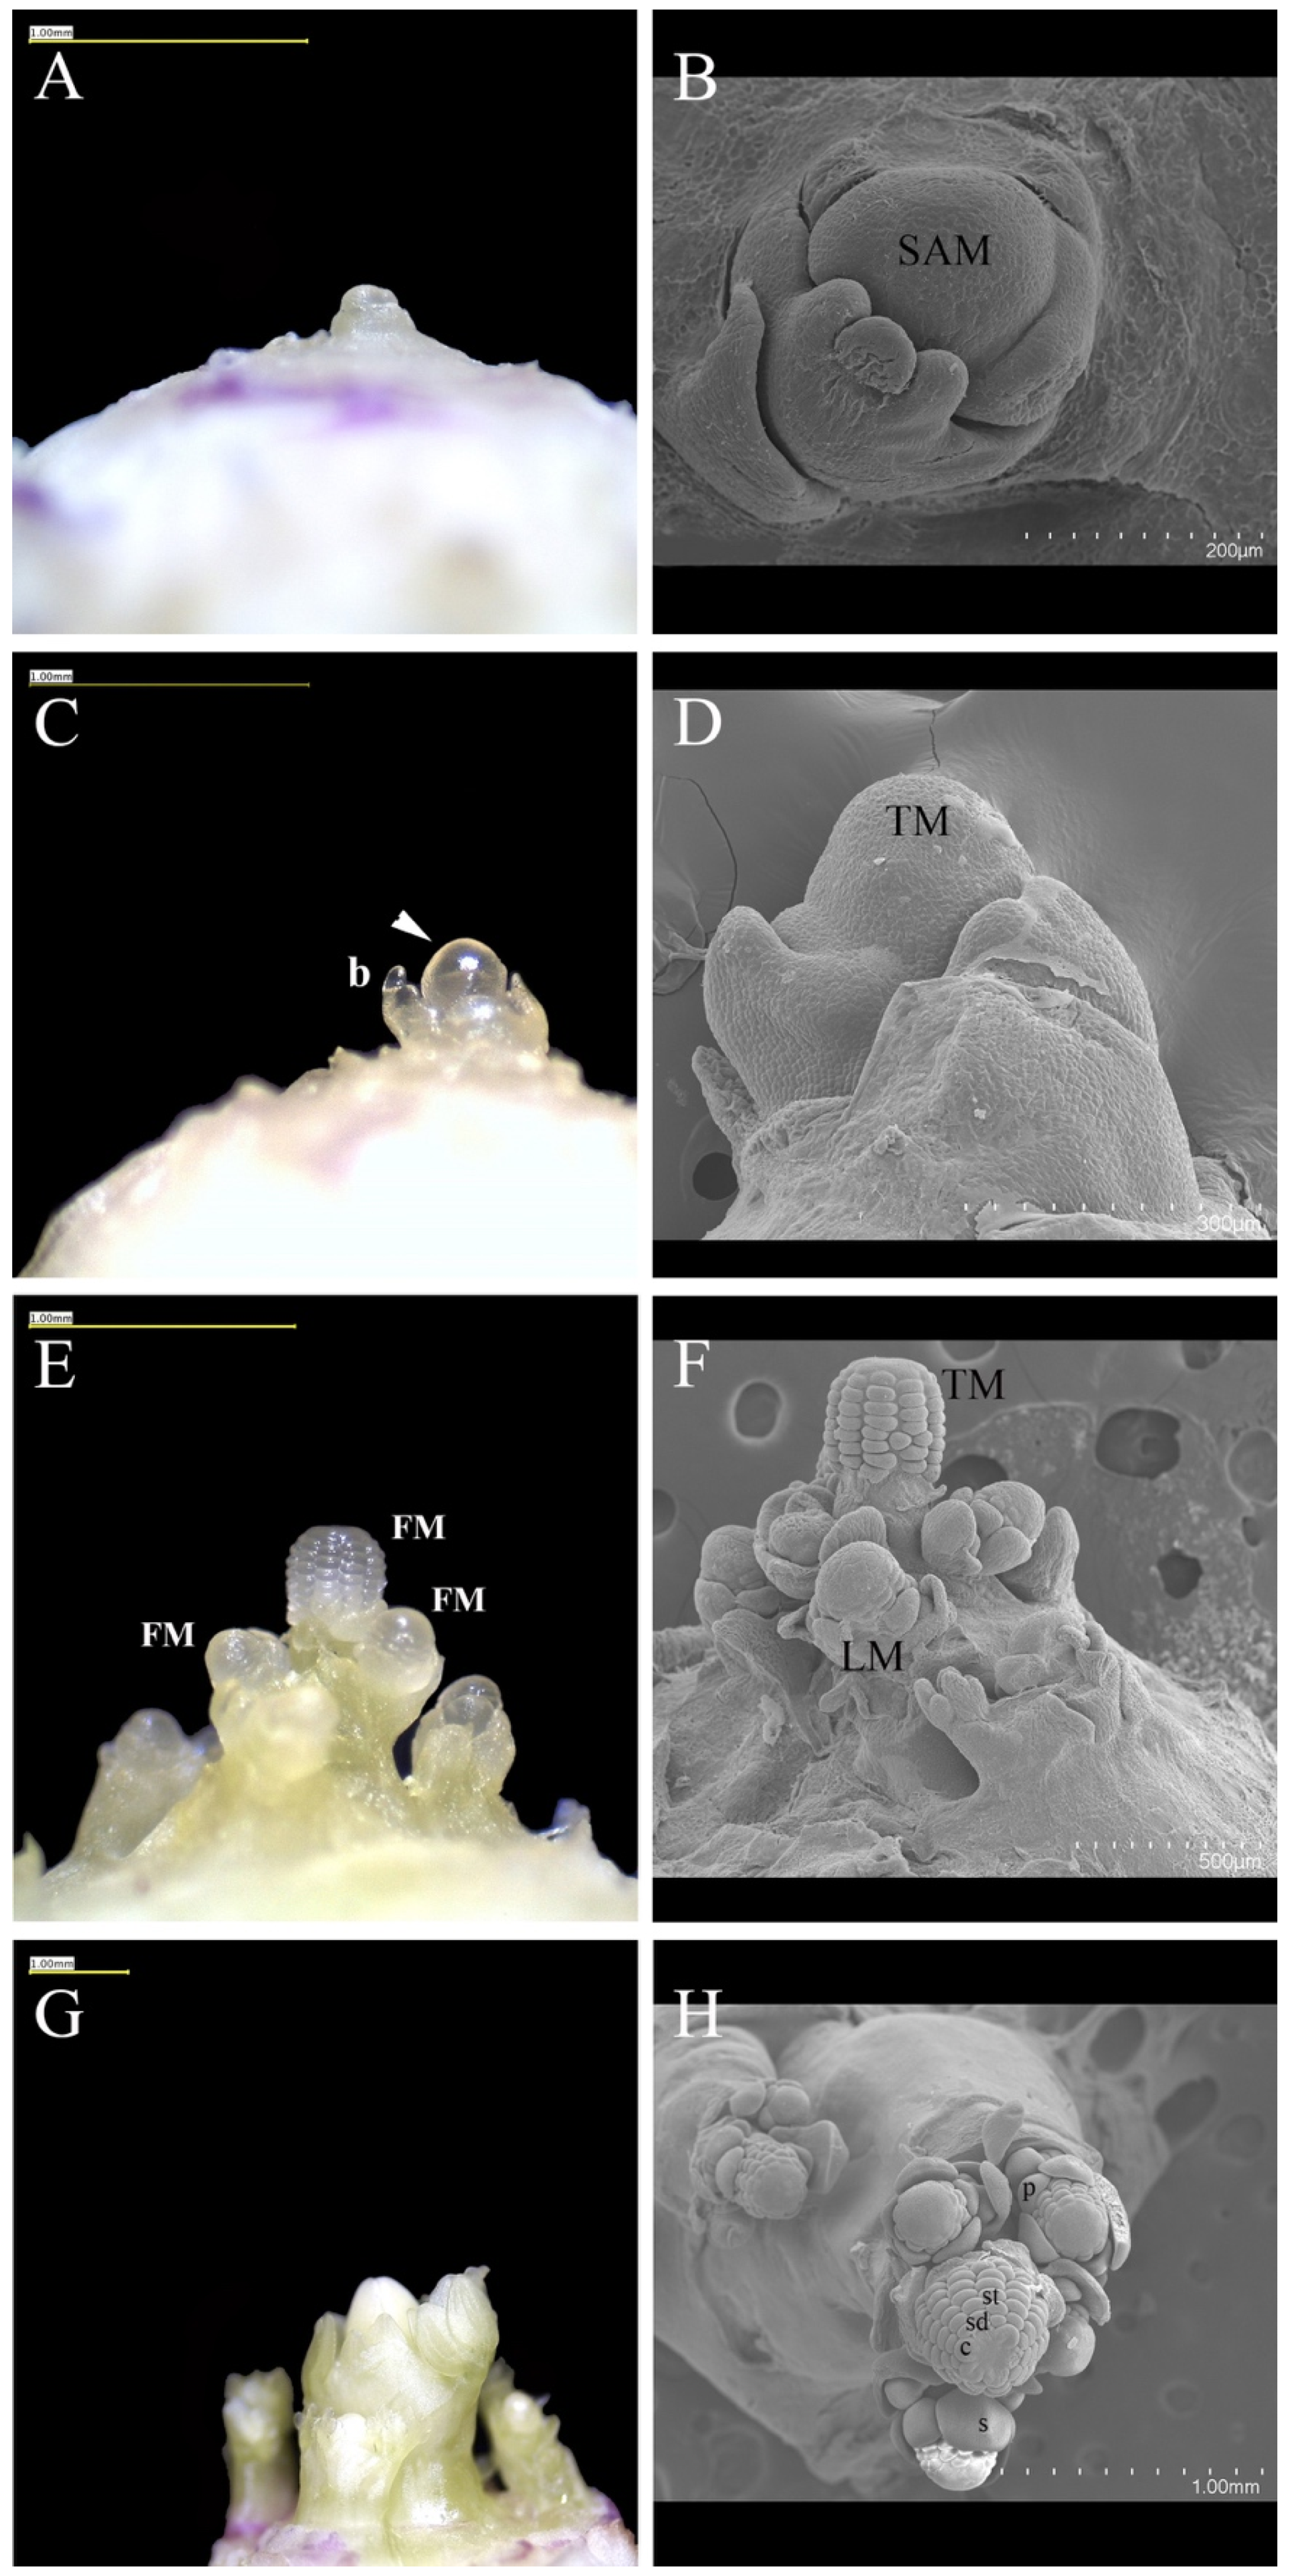
2.2. Scanning Electron Micrography

For each time point described above, meristems were dissected and fixed in formalin-acetic acid-alcohol (FAA). The meristems were dehydrated in increasing ethanol concentrations (70%, 90%, 95%, and 100%). The samples were dried using a critical point dryer (Polaron E3000, Hertfordshire, England). Following this, the samples were sputter coated using the 108 Auto Sputter Coater (Ted Pella, INC., Redding, CA, USA) with a gold target. The gold coated meristems were imaged using scanning electron micrography (SEM) (Hitachi SU3500, Hitachi High Technologies America, Inc., Pleasanton, CA, USA)

2.3. Sample Preparation for RNA-seq

RNA was extracted from dissected meristems for four data points, W0, W4, W6, and WB (early inflorescences) using the RNAeasy kit (Qiagen, Germantown, MD, USA). Each biological replicate for all timepoints (W0, W4, W6, and WB) is an apical meristem sample from one plant. The RNA samples were checked for quality using nanodrop one (Thermo Scientific, Madison, WI, USA), qubit (Thermo Scientific), and bioanalyzer (Agilent Technologies, Palo Alto, CA, USA)

2.4. RNA-seq Library Preparation and Sequencing

The RNA libraries were prepared using NEB Next Ultra II Directional RNA Library Prep Kit at University of California Riverside (UCR) genomics core. The RNA libraries were analyzed by the bioanalyzer. Low quality libraries were removed from the samples. At least three biological replicates for each data point were sequenced. A total of 17 libraries (3 each for W0 and W6, 6 for W4, and 5 for WB Table S1) were pooled and sequenced using a 1 × 75 × 6 cycle NextSeq v2 high output run. A sample tree was created using Spearman correlation. Biological replicates from the same time points clustered together and all time points had their own branch, which confirms the reproducibility of our results (Figure S1). The raw reads data was deposited to the NCBI’s Sequence Read Archive (SRA) accession # SRP218030, and BioProject # PRJNA559688.

2.5. Reference-Based Transcriptome Analysis

Reference-based transcriptome analysis was performed using our in-house R pipeline. The data analysis was conducted by implementing practices and methodology reviewed by Conesa et al. 2016 [27]. Raw reads were cleaned by removing the adapter, poly-N, and low-quality reads. Further analysis was performed on cleaned high quality reads. Aquilegia coerulea v3.1 genome was downloaded from Phytozome (https://phytozome.jgi.doe.gov/pz/portal.html) used as a reference to map the individual reads using HISAT2, which is a fast and sensitive alignment tool for mapping next-generation sequencing reads [28]. The read count was performed in a non-strand-specific way for exonic gene areas while ignoring overlaps between different genes. Subsequently, the expression count values were normalized by reads per kilobase per million mapped reads (RPKM). For each sample, reads overlapping with regions of interest were counted using the overlap function in R [29]. Sample-wise Spearman correlation coefficients from the transformed expression values were calculated using DESeq2 [30] and hierarchical clustering was performed with the hclust function in R (in stats package) and the results were plotted as a dendrogram.

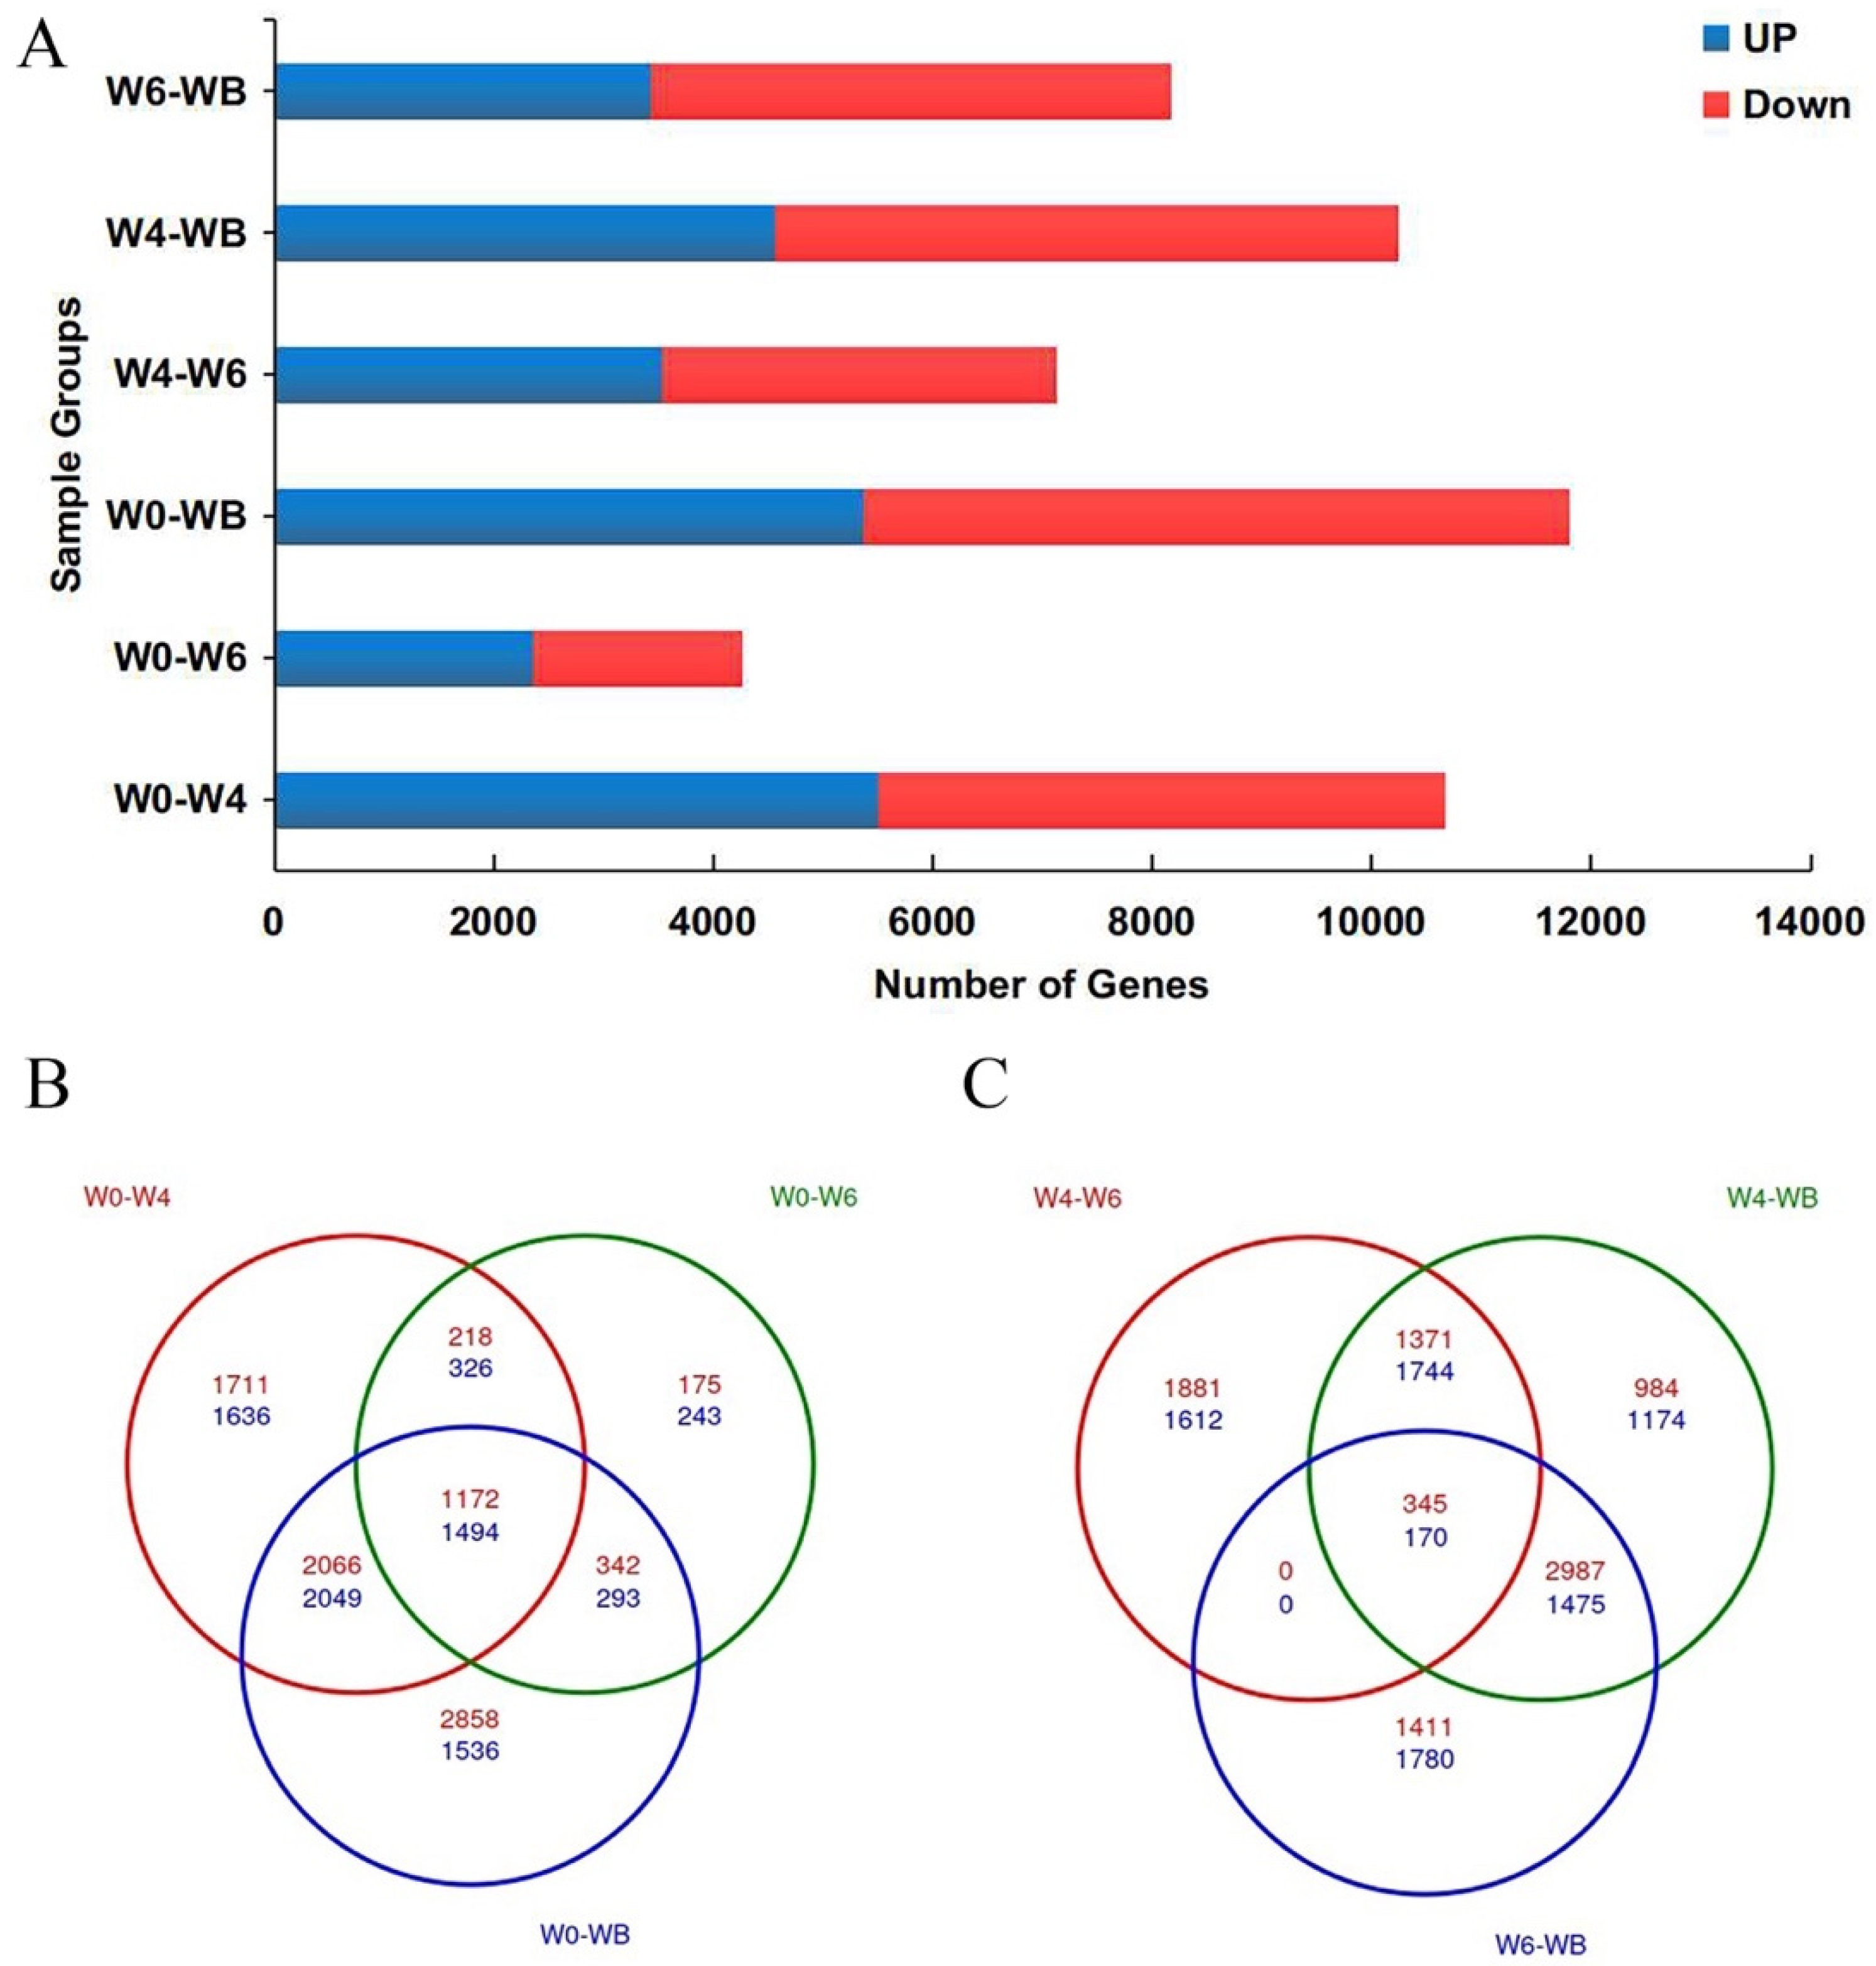
2.6. Differentially Expressed Genes and Functional Enrichment Analysis

The glm method of edgeR package was used for differential gene expression (DEG) analysis [31] and significant DEGs were filtered with a false discovery rate (FDR) of ≤0.05. A K-means clustering algorithm [32] was used to cluster transcripts showing differential co-expression at the sample level. The GO annotation of the reference-based transcriptome was performed using Blast2GO program [33]. The clusterProfiler was used for GO and KEGG enrichment analysis [34]. Over-represented GO terms were identified using a hypergeometric test with a significance threshold of 0.05 after Benjamini and Hochberg FDR correction [35].

3. Results and Discussions

3.1. Vernalization-Induced Developmental Changes in the Aquilegia SAM

We conducted morphological studies at the macroscopic and microscopic level to analyze changes in the SAM over the course of the floral transition. Aquilegia is a rosette-forming perennial herb and, throughout development, the SAM is protected by sheathing leaf bases of the rosette leaves [19,36]. The SAM of 5–7 plants were dissected each week of the treatment and prepared for histological analysis (Figure 2) and SEM (Figure 3). Nine time points were sampled: pre-vernalization (week 0 or W0), each of the four weeks during vernalization (weeks 1–4 or W1–W4), and each of the four weeks post-vernalization (weeks 5–8 or W5–W8). Observations of the dissected shoot apex at week 0 revealed a vegetative SAM surrounded by spirally arranged compound leaves (Figure 2A and Figure 3A,B). This morphology was conserved through the first and second weeks of vernalization at 6 °C.
Morphological changes begin to be observed during the third week of vernalization (Figure 2B). At the end of week 3, the elongated SAM appears to be producing more lateral organs with active axillary meristems, which suggests a transition to the IM identity. At week 4, the terminal meristem continues to elongate, internodes appear to be forming, and lateral organs are less complex than the vegetative leaves, which are all consistent with the differentiation of the early inflorescence (Figure 2C and Figure 3C,D). After the first week post-vernalization (W5), the meristems showed the further differentiation of the inflorescence axis with discrete axillary meristems subtended by bracts (Figure 2D). After the second week of post-vernalization (W6), the terminal meristem has converted to floral identity and has initiated sepals, petals, and outer stamens (Figure 2E and Figure 3E,F). Initiation of floral organ primordia can also be seen in some lateral meristems (Figure 3F).
At W8, the fourth week of post-vernalization, we observe a fully developed primary inflorescence containing the terminal and the developing lateral floral meristems (Figure 2F and Figure 3G,H). Soon after, these plants bolted and the inflorescences emerged from the rosettes (Figure 1B). At this time point, shoot apices of non-vernalized control plants kept at 24 °C were dissected for comparison with their vernalized siblings. Observation under the dissecting microscope showed no IM development.
This study in A. coerulea ‘Origami’ demonstrates that developmental changes in the SAM occur when the plant has been vernalized for 3 weeks, with more dramatic changes observed at week 4. This is a much shorter vernalization requirement compared to other previously studied North American species A. formosa. Most likely, this reduced requirement is the product of horticultural selection and hybridization in the generation of the ‘Origami’ lines, but it does provide a potential tool for future dissection of genetic differences between ‘Origami’ and species with longer vernalization requirements. In addition, it gives us a framework on which to base our developmental transcriptomic study.

3.2. Transcriptome Sequencing

We dissected apical meristems from plants at weeks 0, 4, 6, and B, with at least 3 biological replicates of each time point (Supplementary Table S1). Over 300 million reads were mapped to Aquilegia’s genome, with 89.5% successfully mapping and carried further for analysis of differential gene expression. We performed pairwise comparisons between W0–W4, W0–W6, W0–WB, W4–W6, W4–WB, W6, and WB (Figure 4A). The numbers of up-regulated and down-regulated genes in each pairwise comparison are listed in Supplementary Table S2. As expected, the W0–WB pairwise comparison of vegetative and fully elaborated inflorescences shows the greatest change in gene expression with 5372 up-regulated and 6432 down-regulated loci. However, even in the W0–W4 pairwise comparison, we observed a large number of differentially expressed genes, which suggested that, although the meristem is only slightly changed morphologically, the molecular program promoting flowering has been initiated. This is also very well shown by the Venn diagrams, where the specific vs. commonly up-regulated and down-regulated DEG’s in different pairwise comparisons are parsed out. In the first Venn diagram, we analyzed specific and commonly up-regulated genes between W0–W4, W0–W6, and W0–WB (Figure 4B) and, in the second, we analyzed W4–W6, W4–WB, and W6–WB (Figure 4C). Commonly up-regulated and down-regulated genes in the first comparison is 1172 and 1494, respectively, and, in the second, 345 and 170, respectively. Thus, the Venn diagram analysis agrees with the developmental results clearly showing the major change in gene expression is between W0–W4 (Figure 4B).

3.3. GO Enrichment and KEGG Analysis

To understand the functional classification of the DEGs in all of the pairwise comparisons, we assigned them GO terms. This classified the DEGs into three GO categories: biological process, molecular function, and cellular component. The most enriched GO terms are listed in Table 1, and the top 15 GO terms in each pairwise comparison are shown in Supplementary Figures S2–S4. Overall, these terms are consistent with the fact that these tissues are meristematic or early differentiating primordia with strong signals of transcriptional regulation, active metabolism, and protein processing. Involvement of DEGs in biological pathways was examined by performing KEGG analysis using Arabidopsis thaliana as the reference. We have used scatter plots to show the significant KEGG enrichment in all pairwise comparisons (Supplementary Figure S5). The enriched pathways are very consistent with the GO results.

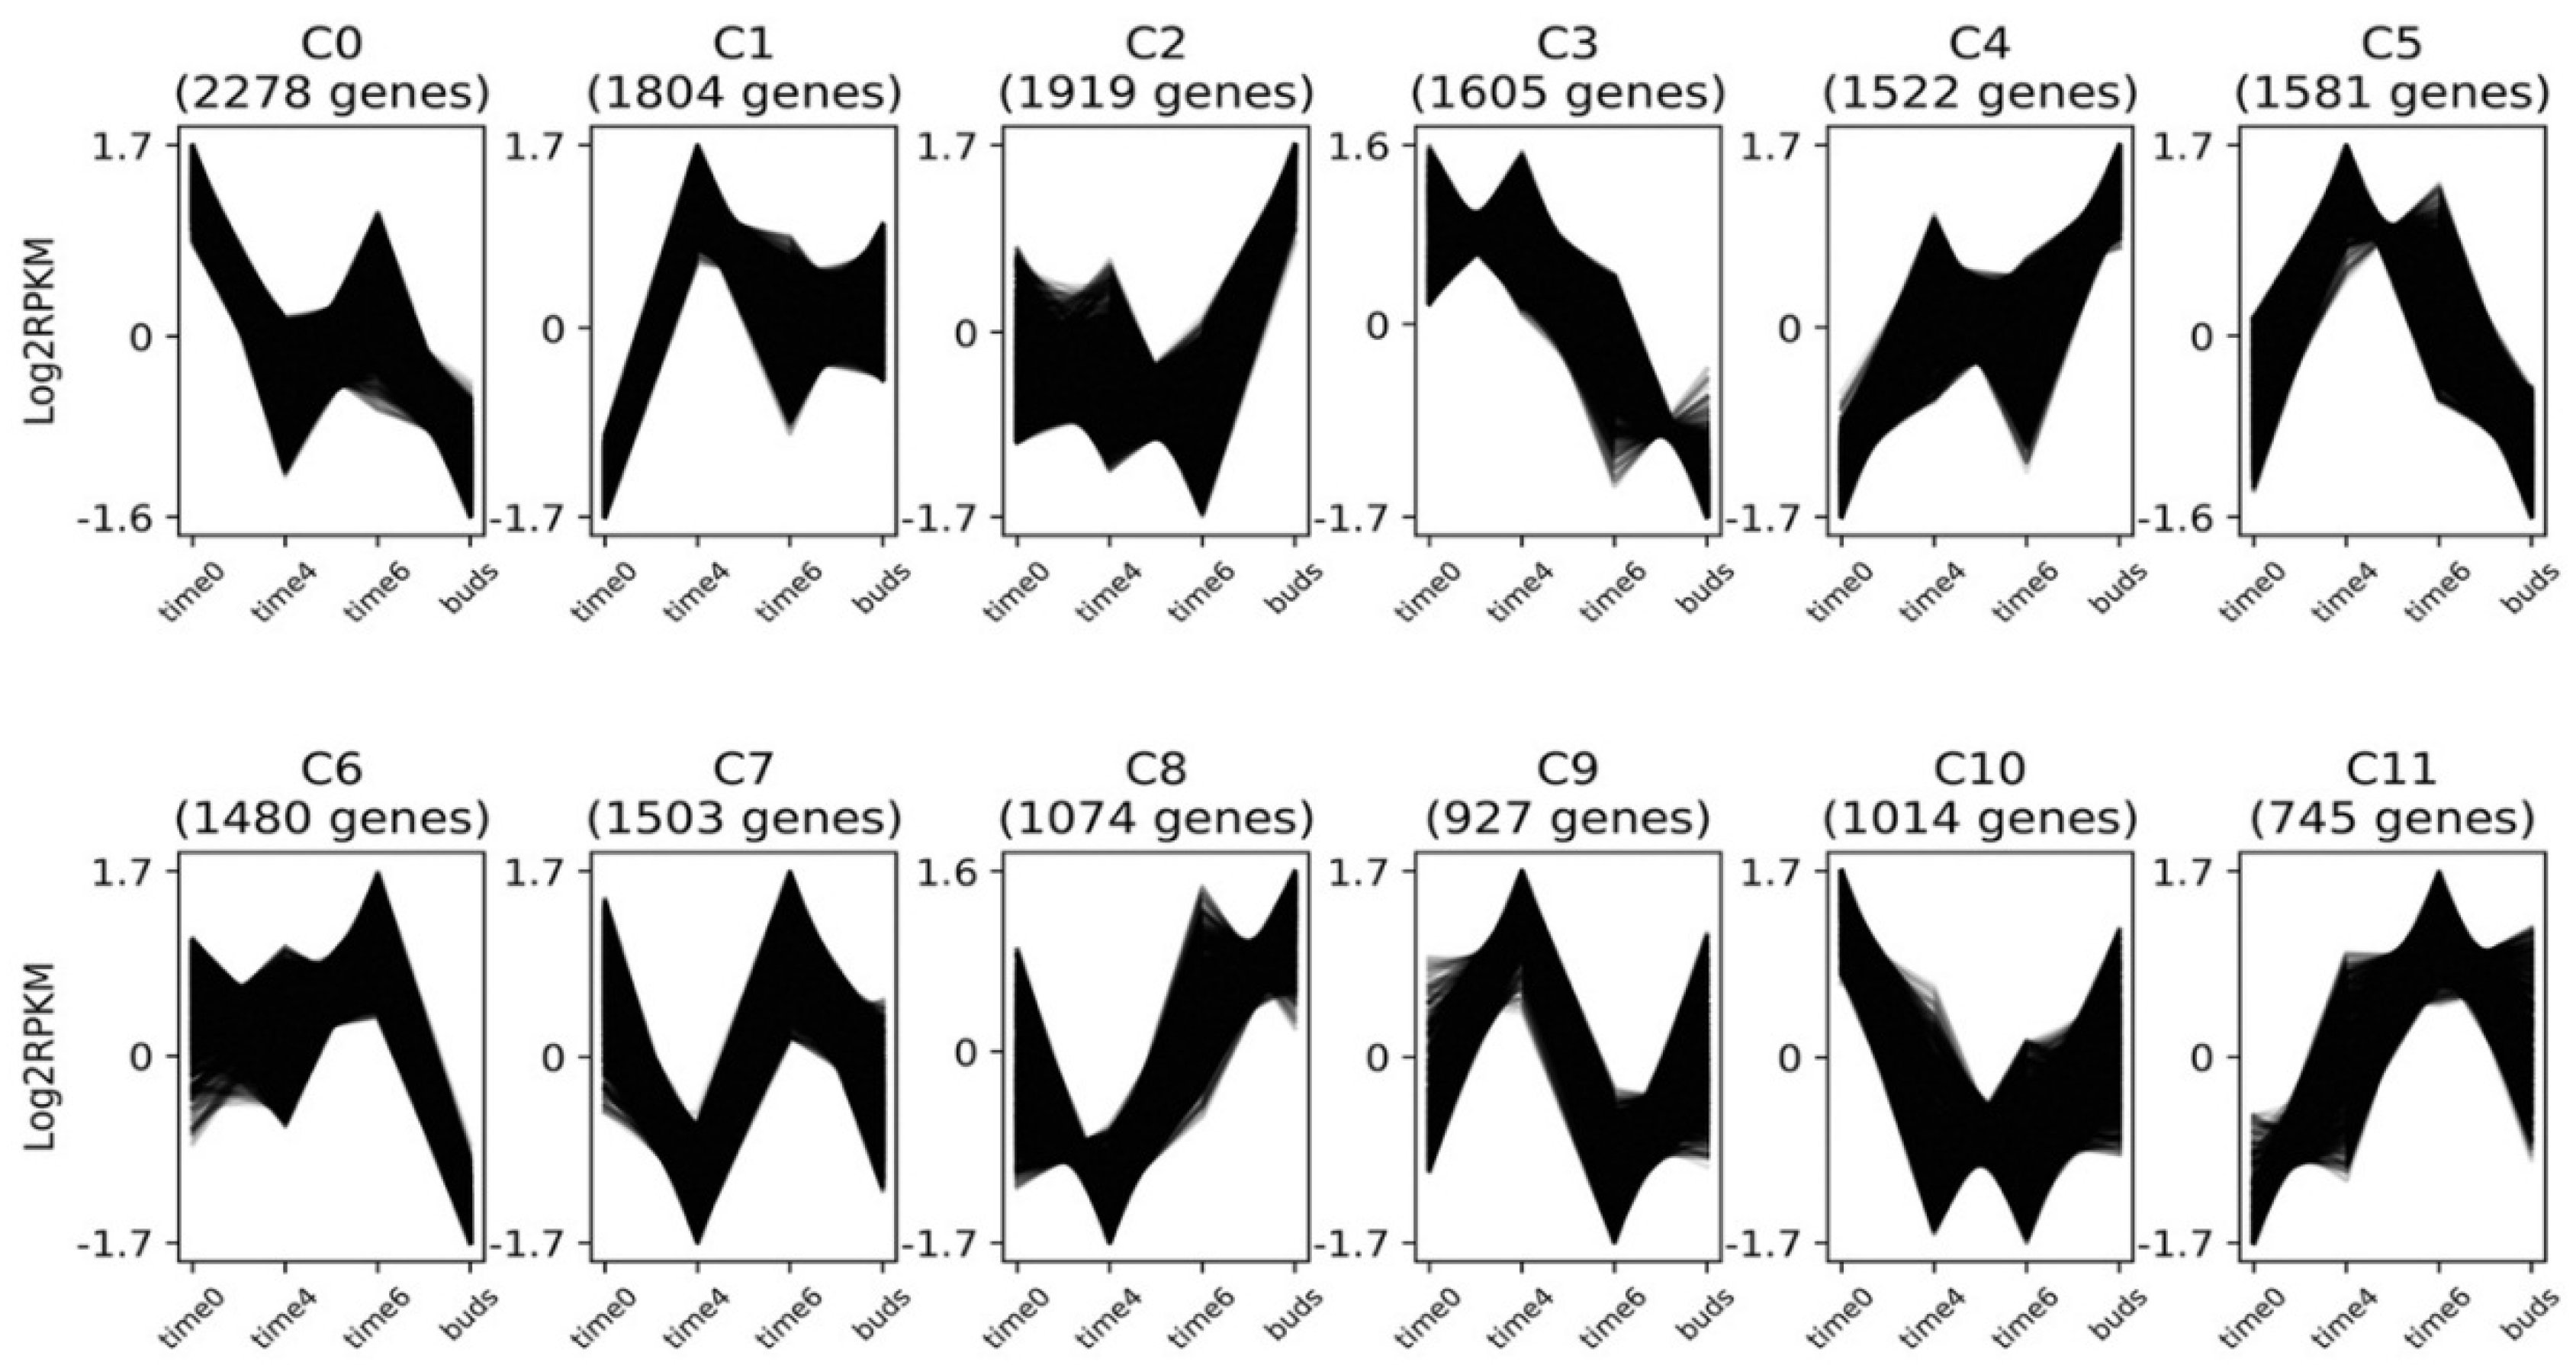
3.4. Gene Expression Clusters

Clust was used to generate 12 clusters, C0–C11, which shows co-expression of DEGs (Figure 5). The number of genes in each cluster range from 745 in Cluster 11 to 2278 in Cluster 0. We have analyzed the results by dividing them into two categories: (1) Flowering time genes (Table 2) and (2) MADS-box genes (Table 3). Heat maps generated for both the categories show their expression patterns across different data points in all biological replicates (Figure 6). We did not average the RPKM values for all biological replicates from one time point. Instead, we showed the expression pattern on the individual 17 samples to reflect the consistency and reproducibility of our results.

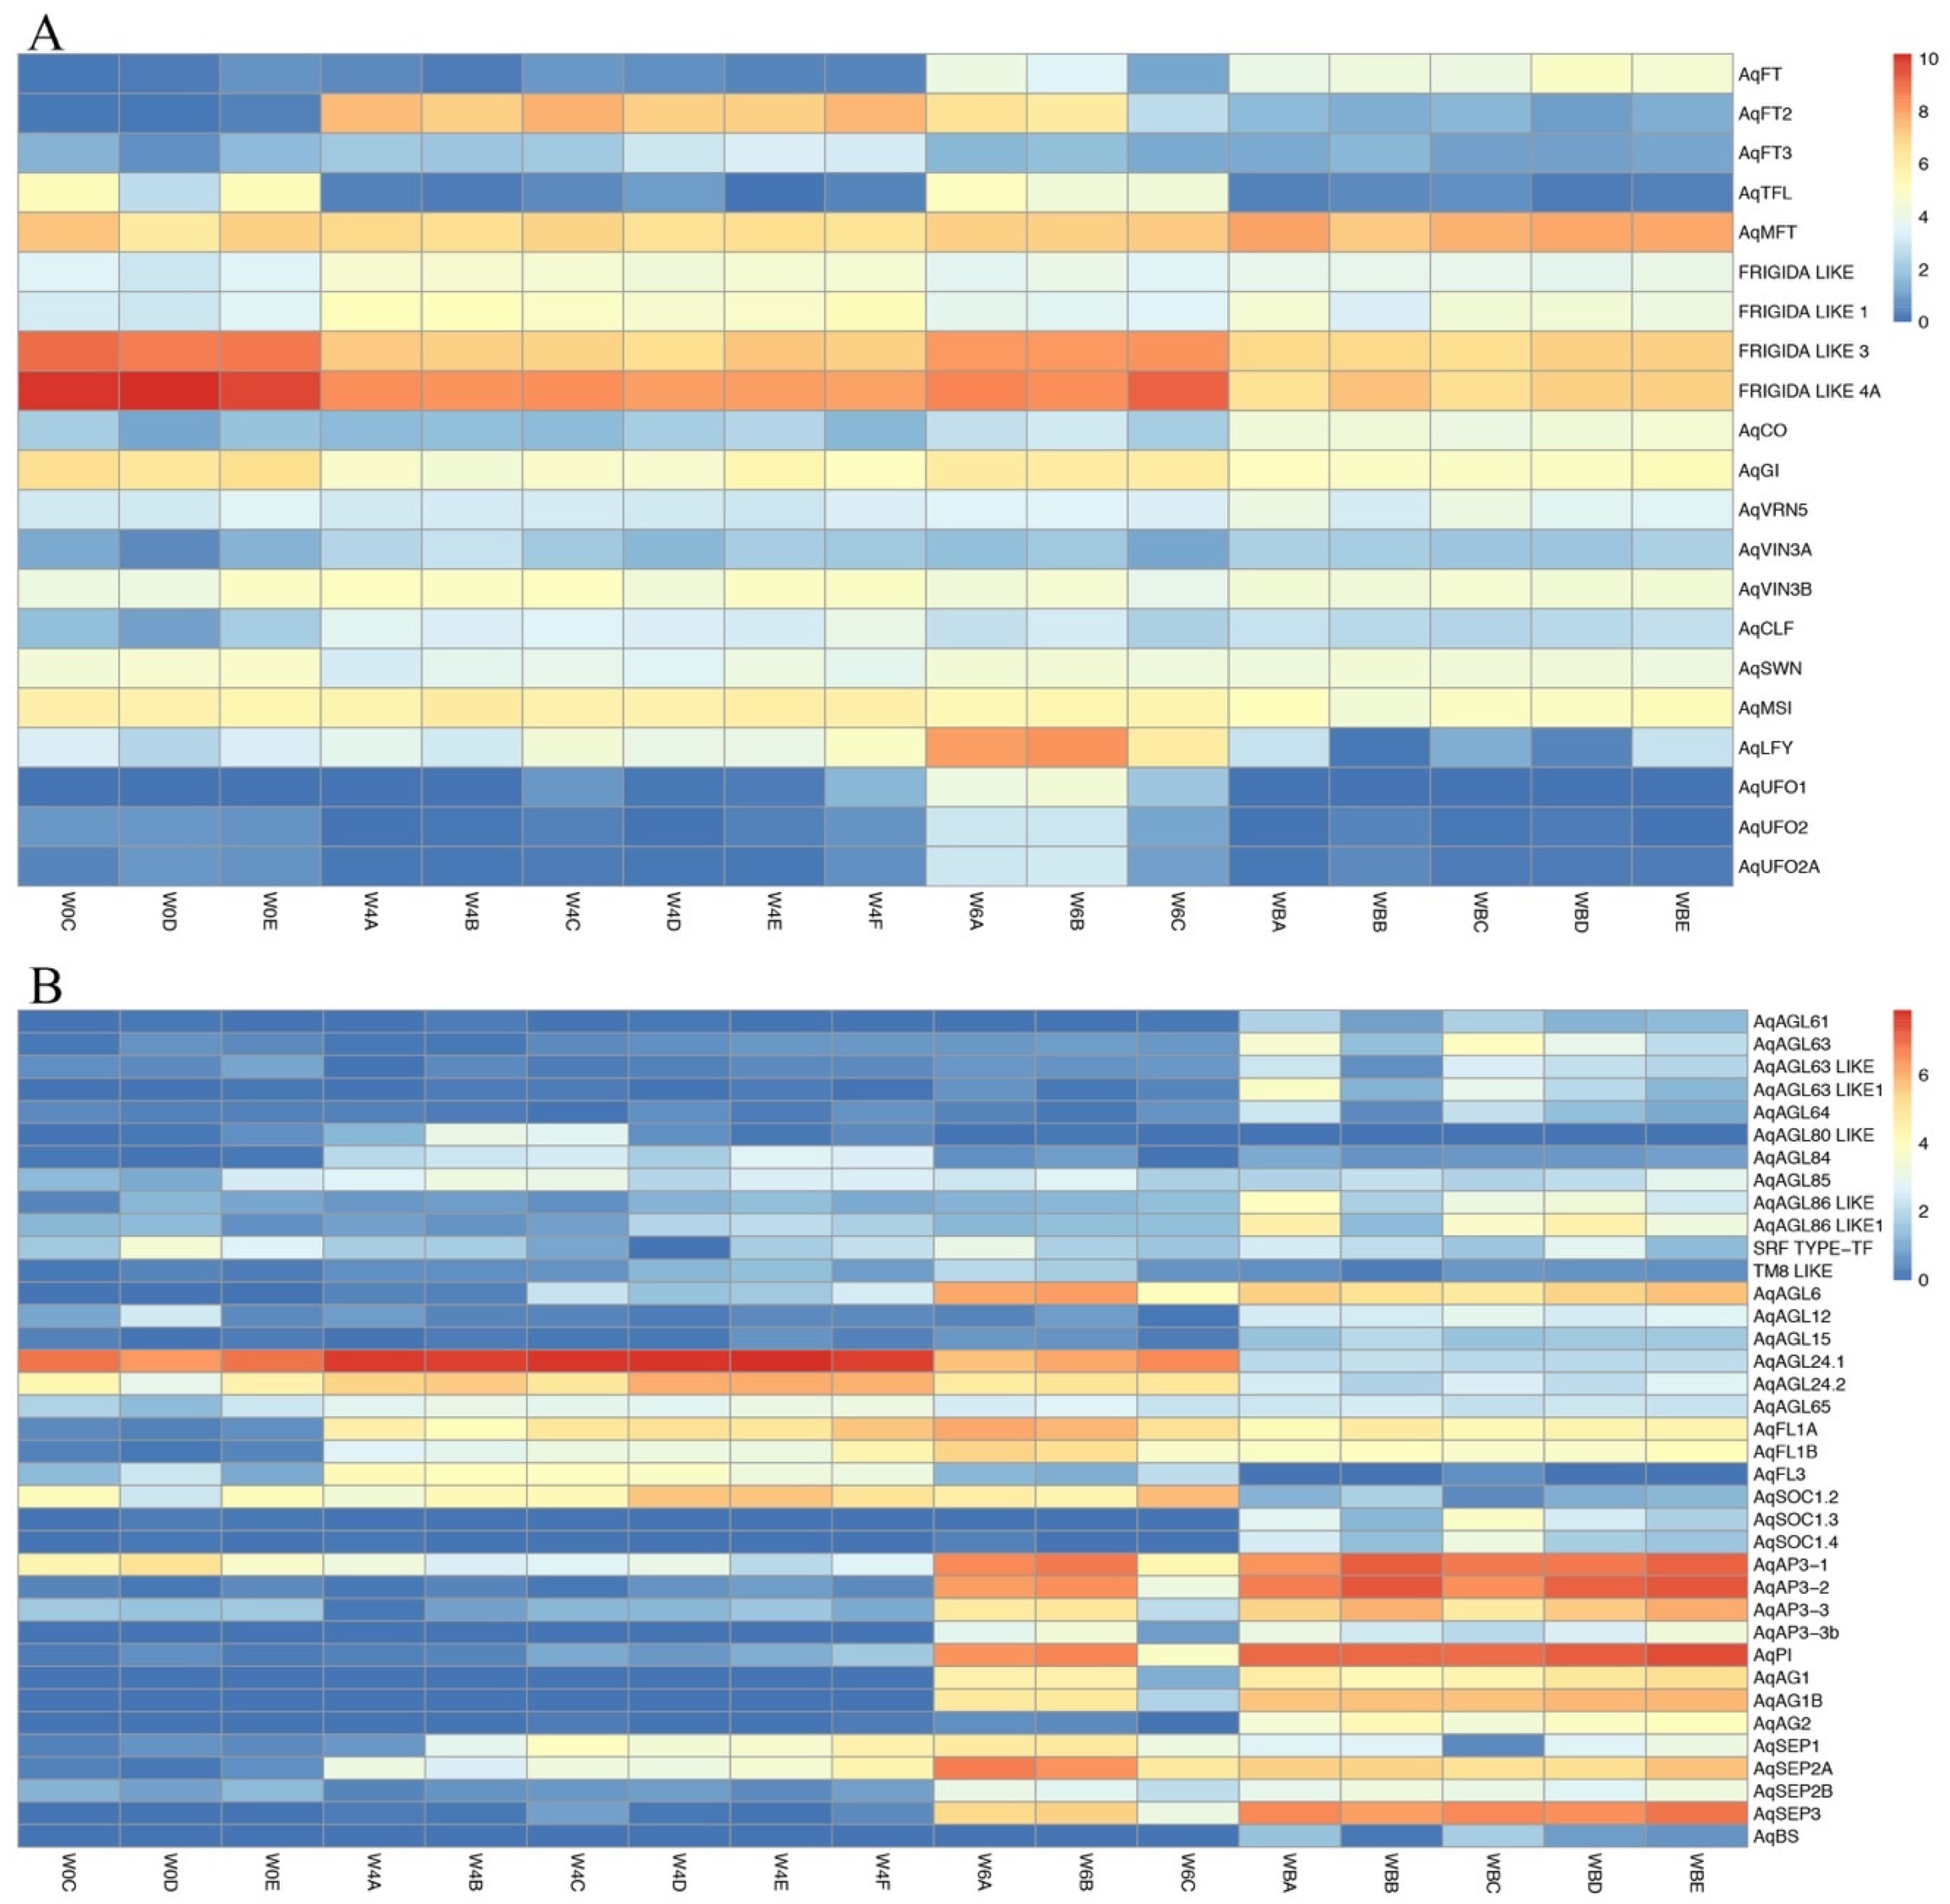
3.4.1. Flowering Time Genes

The phosphatidylethanolamine-binding proteins (PEBPs) are known to play an important function in flowering time and inflorescence development. The family has three major clades [37,38], FT-like, TERMINAL FLOWER, or TFL-like, and MOTHER OF FT or MFT-like, all of which have homologs in Aquilegia. While FT induces flowering, TFL is known to delay flowering and promote indeterminacy in racemose inflorescences [39]. One Aquilegia FT homolog has been previously identified [25], AqFT (Aqcoe2G432300), but since the genome sequence has been completed (http://www.phytozome.net/), we have been able to identify two additional FT homologs: AqFT2 (Aqcoe4G263600) and AqFT3 (Aqcoe4G257600). The three paralogs of AqFT are in different clusters. AqFT is in C8 and shows strong up-regulation well after the floral transition in W6-WB. AqFT2 is placed in C5 and shows the strongest expression coinciding with the floral transition itself. AqFT3 is in C3 and appears to be expressed at low levels overall but does decrease following the floral transition. The other members of the PEBP family, AqTFL and AqMFT, fall into clusters 0 and 8, respectively. These diverse expression patterns indicate that the loci may have evolved different functional roles. By comparison, in sugar beet, two FT homologs have opposite functions such that BvFT2 is a floral promoter and BvFT1 is a floral repressor [17]. Similarly in Nicotiana tabacum NtFT1, NtFT2, and NtFT3 are floral repressors while NtFL4 is a floral promotor [38]. Exploration of the functions of the three Aquilegia paralogs may require the use of transgenics, but can also be performed in the context of natural variation that exists among species.
Another important flowering time gene is FRIGIDA. In Arabidopsis FRIGIDA is known for promoting FLC, which, in turn, keeps FT in a repressed state [40]. The FRIGIDA ortholog in Aquilegia, AqFRI, is rather ubiquitously expressed and does not fall in any cluster. We identified four other members of FRI family in Aquilegia, termed AqFRI-like, AqFRI-like1, AqFRI-like3, and AqFRI-like4A. The former two fall in cluster C9 and the latter two fall in cluster C0, which have largely opposing expression profiles. In Arabidopsis, FRIGIDA-like 1 (FRL1), and FRIGIDA-like 2 (FRL2) have been shown to promote the winter annual habit in cooperation with FRIGIDA [41]. However, these functions converge on the regulation of FLC, which is absent from the Aquilegia genome. It remains possible that the more general biochemical function of FRI-like proteins, which is acting as a scaffold in the formation of transcriptional activation complexes [42], could be targeting other loci in Aquilegia.
The GIGANTEA and CONSTANS homologs are mostly known for promoting flowering in the context of the photoperiod pathway in Arabidopsis. A study that examined the physical interaction of the GI protein with the FT promoter suggested that GI alone or in a complex binds to the FT promoter to regulate FT expression in a CO-independent manner. This binding of GI to FT can possibly regulate the access of floral repressors such as SVP to the FT promoter [43]. The transcript level of AqGI is high in W0 and then decreases slightly in W4 followed by increased expression at W6, which places it in cluster C0. In Aquilegia, there are three FT homologs and they all have different expression profiles. It remains to be determined how AqGI is interacting with each of the AqFT paralogs to regulate flowering time. In this study, we see that AqCO spikes only at the WB stage, as shown in cluster C2. Analogous to the FRI-like loci described above, these genes are members of large gene families and their homologs have been shown to contribute to broad aspects of the photoperiod and circadian regulation [44,45,46]. However, it does not appear that AqCO is specifically up-regulated in response to the floral transition at W4, which could be consistent with the lack of the photoperiod response observed in other species of Aquilegia [25].
As with all major life cycle transitions, members of the Polycomb Repressor Complex 2 (PRC2) and their associated epigenetic complexes are critical to the floral transition in multiple model systems [47,48,49]. In Aquilegia, the three previously characterized PHD family members [50], AqVRN5, AqVIN3A, and AqVIN3B, fell into clusters C10, C1, and C9, respectively, while the three PRC2 members AqCLF, AqSWN, and AqMSI were found in clusters C1, C7, and C3, respectively. These patterns of differential expression suggest that epigenetic reprogramming may clear an important role in both promoting flowering and FM identity, consistent with what has been observed in Arabidopsis and other systems [51,52]. In particular, the strong induction of AqCLF coincident with W4 is intriguing given CLF’s known role in regulating floral MADS box genes [53].
Lastly, LEAFY (LFY) and UNUSUAL FLORAL ORGANS (UFO) homologs in Arabidopsis are known to be involved in the establishment of the floral meristem identity [54]. Expression of the three UFO homologs, AqUFO1 and AqUFO2 AqUFO2A, and single AqLFY homolog peak at the week 6 stage. AqLFY, AqUFO2, and AqUFO2A are co-expressed in cluster C6 while AqUF01 is in C11. These patterns are consistent with more detailed studies that have found expression to be limited to the earliest stages of floral development [Sharma et al. 2019, in press].

3.4.2. MADS-Box Genes

The MADS-box gene family is pan-eukaryotic but is very well-studied in plants, where members are critically involved in many aspects of development, particularly flowering time and floral organ identity [55,56]. MADS-box genes are broadly classified as type I and type II, but all MADS-box genes encode a highly conserved DNA-binding domain that consists of ~58–60 amino acids [57,58]. In the A. thaliana genome, there are approximately 100 annotated MADS-box genes, of which about 40 are type II. In this study, we found 43 MADS-box genes expressed in the four sampled stages (W0, W4, W6, WB), but only 37 of these were differentially expressed between stages (Figure 6B). Assigning these loci to specific gene lineages reveals that multiple MADS-box genes have duplicated paralogs [56].
Several of the type II MADS-box genes are known to influence flowering time or the early stages of inflorescence development. The most notable of these is FLC, which is absent from Aquilegia. Another floral repressor is the SHORT VEGETATIVE PHASE (SVP), but this gene lineage is specific to the core eudicots [25] and, therefore, also missing from Aquilegia. The SVP paralog AGL24, in contrast, is a promoter of flowering [12]. In Aquilegia, two representatives of this subfamily were named AqAGL24.1 and AqAGL24.2, and the latter was found to be strongly expressed in IMs [25]. In the current dataset, we again see different expression profiles between paralogs, with AqAGL24.1 most strongly expressed in the earliest stages of the floral transition while AqAGL24.2 appears to be shifted later. This is consistent with the published in situ data for AqAGL24.2, which was strongly expressed in IMs, but functional studies are necessary to understand whether the paralogs are redundant or possibly even opposing in function. Previous studies in Aquilegia identified additional potential IM identity loci, which are homologs of the AP1/FUL gene lineage [36]. AqFL1A/B are expressed in axillary meristems and, when they are silenced, plants produce less complex inflorescences, which suggests that they cannot maintain IM identity [36]. In our analysis, we see a very low expression of both genes in the W0 vegetative meristem, but expression is very strong at stages W4 and W6 when IMs form.
Collectively, homologs of the floral organ identity genes are up-regulated at stages W6 or WB, consistent with their previously characterized expression patterns [23,24,25,59]. One interesting difference is that the putative stamen and carpel identity genes AqAG1 and AqAG2 are in different clusters (Table 3), with AqAG2 coming up later than AqAG1, which is in line with its stronger expression in the late arising carpels [24,59,60]. The so-called E class genes, which act as transcriptional activators in conjunction with the other floral organ identity genes, are represented by four homologs in Aquilegia: AqSEP1, the tandem duplicates AqSEP2A and AqSEP2B, and AqSEP3 [56]. AqSEP1 and AqSEP2A are activated immediately after vernalization in W4 whereas the AqSEP2B and AqSEP3 are expressed at W6, which potentially reflects some differentiation among their functions. AqAGL6 is closely related to the SEP lineage [61,62] and its homolog in Nigella has been shown to primarily control sepal identity [63]. AqAGL6 expression peaks at W6 and persists into W8, which suggests potential redundancy with the SEP homologs in floral organ identity, but requires further study.
Expression of the detected type I MADS-box genes, which commonly function in gametophyte development [64,65], is generally induced following vernalization. However, the tissues sampled are not late enough to include gametophytic tissues. Therefore, these detected loci are interesting candidates for alternative functions in earlier stages of floral development.

4. Conclusions

This study has demonstrated that Aquilegia coerulea ‘Origami’ initiates detectable developmental changes in the SAM by the third week into vernalization and four weeks of treatment are sufficient to promote the full floral transition. This is considerably shorter than the previously studied A. formosa and A. vulgaris, which have longer requirements of five to six weeks [25,50]. Using this developmental information as a guide for transcriptomics has provided a dataset that can now be mined for promising candidate genes that may act as either floral repressors or activators. Our preliminary analysis of the results already reveals several potential floral repressors, including paralogs of FT and AGL24. By combining this resource with QTL analyses of species with differing requirements for vernalization such as A. formosa and ‘Origami’, we can explore the genetic basis of vernalization in this distinct evolutionary lineage that achieves the response without previously characterized loci such as FLC. Our ability to ultimately manipulate this trait in diverse plant lineages depends on our understanding of the many independent derivations of the vernalization response.

Supplementary Materials

The Supplementary Material for this article are available online at https://www.mdpi.com/2073-4425/10/10/734/s1. Figure S1: The clustering of all 17 samples at four timepoints done using the Spearman correlation. All biological replicates for one time point cluster as a separate group, Figure S2: Top 15 GO terms in Biological Process category in all pairwise comparison, Figure S3: Top 15 GO terms in Molecular Function category in all pairwise comparison, Figure S4: Top 15 GO terms in Cellular Component category in all pairwise comparison, Figure S5: Scatter plot of KEGG pathway enrichment in all pairwise comparisons. Table S1: The alignment statistics result for all samples. Table S2: Number of genes up and down regulated in different pairwise comparisons.

Author Contributions

B.S., E.M.K. and V.J.M. conceptualized the study. Histology, SEM and RNA extraction were done by T.A.B. and B.S. The bioinformatics work was conducted by R.K., N.D., R.B.L. and U.R.S. The data was analyzed by B.S. with suggestions from E.M.K. and R.K. and inputs from all co-authors. B.S. wrote the manuscript with inputs from E.M.K., and edits from R.K.

Funding

The California State University Agricultural Research Institute Grant number 18-04-257 to PI- B.S. and CO-PI- V.J.M supported this project. The California State University Pomona start-up funds to B.S. also supported this research. NIH RISE R25GM113748 funded student co-authors T.A.B. and U.R.S. and T.A.B. received additional funding from the MENTORES (Mentoring, Educating, Networking, and Thematic Opportunities for Research in Engineering and Science) project, funded by a Title V grant, Promoting Post-baccalaureate Opportunities for Hispanic Americans (PPOHA) | U.S. Department of Education, Washington, D.C. PR/Award Number: P031M140025. The content is solely the responsibility of the authors and does not necessarily represent the official views of the Department of Education.

Acknowledgments

We thank Travis Columbus, Loraine Washburn, and Rancho Santa Ana Botanical Garden for the use of anatomy and microscopy equipment. We also thank Glenn Hicks and Holly Clark at University of California, Riverside for their assistance with RNA-library preparation and sequencing. Lastly, we thank the anonymous reviewers for comments on the manuscript.

Conflicts of Interest

The authors declare no conflict of interest.

References

  1. Chanderbali, A.S.; Berger, B.A.; Howarth, D.G.; Soltis, D.E.; Soltis, P.S. Evolution of floral diversity: Genomics, genes and gamma. Philos. Trans. R. Soc. B Biol. Sci. 2017, 372, 20150509. [Google Scholar] [CrossRef] [PubMed]
  2. Kim, D.-H.; Doyle, M.R.; Sung, S.; Amasino, R.M. Vernalization: Winter and the Timing of Flowering in Plants. Annu. Rev. Cell Dev. Biol. 2009, 25, 277–299. [Google Scholar] [CrossRef] [PubMed] [Green Version]
  3. Simpson, G.G. Arabidopsis, the Rosetta Stone of Flowering Time? Science 2002, 296, 285–289. [Google Scholar] [CrossRef] [PubMed]
  4. Chouard, P. Vernalization and its Relations to Dormancy. Annu. Rev. Plant Physiol. 1960, 11, 191–238. [Google Scholar] [CrossRef]
  5. Boss, P.K. Multiple Pathways in the Decision to Flower: Enabling, Promoting, and Resetting. Plant Cell 2004, 16, S18–S31. [Google Scholar] [CrossRef] [PubMed] [Green Version]
  6. Michaels, S.D.; Amasino, R.M. Memories of winter: Vernalization and the competence to flower. Plant Cell Environ. 2000, 23, 1145–1153. [Google Scholar] [CrossRef]
  7. Michaels, S.D.; Amasino, R.M. FLOWERING LOCUS C Encodes a Novel MADS Domain Protein That Acts as a Repressor of Flowering. Plant Cell 1999, 11, 949–956. [Google Scholar] [CrossRef]
  8. Sheldon, C.C.; Rouse, D.T.; Finnegan, E.J.; Peacock, W.J.; Dennis, E.S. The molecular basis of vernalization: The central role of FLOWERING LOCUS C (FLC). Proc. Natl. Acad. Sci. USA 2000, 97, 3753–3758. [Google Scholar] [CrossRef]
  9. Sheldon, C.C.; Hills, M.J.; Lister, C.; Dean, C.; Dennis, E.S.; Peacock, W.J. Resetting of FLOWERING LOCUS C expression after epigenetic repression by vernalization. Proc. Natl. Acad. Sci. USA 2008, 105, 2214–2219. [Google Scholar] [CrossRef]
  10. Sheldon, C.C.; Conn, A.B.; Dennis, E.S.; Peacock, W.J. Different Regulatory Regions Are Required for the Vernalization-Induced Repression of FLOWERING LOCUS C and for the Epigenetic Maintenance of Repression. Plant Cell 2002, 14, 2527–2537. [Google Scholar] [CrossRef]
  11. Yu, H.; Xu, Y.; Tan, E.L.; Kumar, P.P. AGAMOUS-LIKE 24, a dosage-dependent mediator of the flowering signals. Proc. Natl. Acad. Sci. USA 2002, 99, 16336–16341. [Google Scholar] [CrossRef] [PubMed] [Green Version]
  12. Michaels, S.D.; Ditta, G.; Gustafson-Brown, C.; Pelaz, S.; Yanofsky, M.; Amasino, R.M. AGL24 acts as a promoter of flowering in Arabidopsis and is positively regulated by vernalization. Plant J. Cell Mol. Biol. 2003, 33, 867–874. [Google Scholar] [CrossRef] [PubMed]
  13. Goslin, K.; Zheng, B.; Serrano-Mislata, A.; Rae, L.; Ryan, P.T.; Kwaśniewska, K.; Thomson, B.; Ó’Maoiléidigh, D.S.; Madueño, F.; Wellmer, F.; et al. Transcription Factor Interplay between LEAFY and APETALA1/CAULIFLOWER during Floral Initiation. Plant Physiol. 2017, 174, 1097–1109. [Google Scholar] [CrossRef] [PubMed] [Green Version]
  14. Gazzani, S.; Gendall, A.R.; Lister, C.; Dean, C. Analysis of the Molecular Basis of Flowering Time Variation in Arabidopsis Accessions. Plant Physiol. 2003, 132, 1107–1114. [Google Scholar] [CrossRef] [PubMed] [Green Version]
  15. Bouché, F.; Woods, D.P.; Amasino, R.M. Winter Memory throughout the Plant Kingdom: Different Paths to Flowering. Plant Physiol. 2017, 173, 27–35. [Google Scholar] [CrossRef]
  16. Yan, L. The Wheat VRN2 Gene Is a Flowering Repressor Down-Regulated by Vernalization. Science 2004, 303, 1640–1644. [Google Scholar] [CrossRef]
  17. Pin, P.A.; Benlloch, R.; Bonnet, D.; Wremerth-Weich, E.; Kraft, T.; Gielen, J.J.L.; Nilsson, O. An Antagonistic Pair of FT Homologs Mediates the Control of Flowering Time in Sugar Beet. Science 2010, 330, 1397–1400. [Google Scholar] [CrossRef]
  18. Hodges, S.A.; Arnold, M.L. Columbines: A geographically widespread species flock. Proc. Natl. Acad. Sci. USA 1994, 91, 5129–5132. [Google Scholar] [CrossRef]
  19. Kramer, E.M. Aquilegia: A New Model for Plant Development, Ecology, and Evolution. Annu. Rev. Plant Biol. 2009, 60, 261–277. [Google Scholar] [CrossRef]
  20. Kramer, E.M.; Hodges, S.A. Aquilegia as a model system for the evolution and ecology of petals. Philos. Trans. R. Soc. B Biol. Sci. 2010, 365, 477–490. [Google Scholar] [CrossRef]
  21. Filiault, D.L.; Ballerini, E.S.; Mandáková, T.; Aköz, G.; Derieg, N.J.; Schmutz, J.; Jenkins, J.; Grimwood, J.; Shu, S.; Hayes, R.D.; et al. The Aquilegia genome provides insight into adaptive radiation and reveals an extraordinarily polymorphic chromosome with a unique history. eLife 2018, 7, e36426. [Google Scholar] [CrossRef] [PubMed]
  22. Gould, B.; Kramer, E.M. Virus-induced gene silencing as a tool for functional analyses in the emerging model plant Aquilegia (columbine, Ranunculaceae). Plant Methods 2007, 3, 6. [Google Scholar] [CrossRef] [PubMed]
  23. Sharma, B.; Guo, C.; Kong, H.; Kramer, E.M. Petal-specific subfunctionalization of an APETALA3 paralog in the Ranunculales and its implications for petal evolution. New Phytol. 2011, 191, 870–883. [Google Scholar] [CrossRef] [PubMed]
  24. Sharma, B.; Kramer, E. Sub- and neo-functionalization of APETALA3 paralogs have contributed to the evolution of novel floral organ identity in Aquilegia (columbine, Ranunculaceae). New Phytol. 2013, 197, 949–957. [Google Scholar] [CrossRef] [PubMed]
  25. Ballerini, E.S.; Kramer, E.M. Environmental and molecular analysis of the floral transition in the lower eudicot Aquilegia formosa. EvoDevo 2011, 2, 4. [Google Scholar] [CrossRef] [PubMed]
  26. Sharman, B.C. Tannic Acid and Iron Alum with Safranin and Orange G in Studies of the Shoot Apex. Stain Technol. 1943, 18, 105–111. [Google Scholar] [CrossRef]
  27. Conesa, A.; Madrigal, P.; Tarazona, S.; Gomez-Cabrero, D.; Cervera, A.; McPherson, A.; Szcześniak, M.W.; Gaffney, D.J.; Elo, L.L.; Zhang, X.; et al. A survey of best practices for RNA-seq data analysis. Genome Biol. 2016, 17, 13. [Google Scholar] [CrossRef]
  28. Kim, D.; Langmead, B.; Salzberg, S.L. HISAT: A fast spliced aligner with low memory requirements. Nat. Methods 2015, 12, 357. [Google Scholar] [CrossRef]
  29. Lawrence, M.; Huber, W.; Pagès, H.; Aboyoun, P.; Carlson, M.; Gentleman, R.; Morgan, M.T.; Carey, V.J. Software for Computing and Annotating Genomic Ranges. PLoS Comput. Biol. 2013, 9, e1003118. [Google Scholar] [CrossRef]
  30. Love, M.I.; Huber, W.; Anders, S. Moderated estimation of fold change and dispersion for RNA-seq data with DESeq2. Genome Biol. 2014, 15, 550. [Google Scholar] [CrossRef] [Green Version]
  31. Robinson, M.D.; McCarthy, D.J.; Smyth, G.K. edgeR: A Bioconductor package for differential expression analysis of digital gene expression data. Bioinformatics 2010, 26, 139–140. [Google Scholar] [CrossRef]
  32. Abu-Jamous, B.; Kelly, S. Clust: Automatic extraction of optimal co-expressed gene clusters from gene expression data. Genome Biol. 2018, 19, 172. [Google Scholar] [CrossRef]
  33. Conesa, A.; Götz, S. Blast2GO: A Comprehensive Suite for Functional Analysis in Plant Genomics. Int. J. Plant Genomics 2008, 2008, 1–12. [Google Scholar] [CrossRef]
  34. Yu, G.; Wang, L.-G.; Han, Y.; He, Q.-Y. clusterProfiler: An R Package for Comparing Biological Themes Among Gene Clusters. OMICS J. Integr. Biol. 2012, 16, 284–287. [Google Scholar] [CrossRef]
  35. Benjamini, Y.; Hochberg, Y. Controlling the False Discovery Rate: A Practical and Powerful Approach to Multiple Testing. J. R. Stat. Soc. Ser. B Methodol. 1995, 57, 289–300. [Google Scholar] [CrossRef]
  36. Pabón-Mora, N.; Sharma, B.; Holappa, L.D.; Kramer, E.M.; Litt, A. The Aquilegia FRUITFULL-like genes play key roles in leaf morphogenesis and inflorescence development. Plant J. 2013, 74, 197–212. [Google Scholar] [CrossRef]
  37. Karlgren, A.; Gyllenstrand, N.; Källman, T.; Sundström, J.F.; Moore, D.; Lascoux, M.; Lagercrantz, U. Evolution of the PEBP Gene Family in Plants: Functional Diversification in Seed Plant Evolution. Plant Physiol. 2011, 156, 1967–1977. [Google Scholar] [CrossRef] [Green Version]
  38. Harig, L.; Beinecke, F.A.; Oltmanns, J.; Muth, J.; Müller, O.; Rüping, B.; Twyman, R.M.; Fischer, R.; Prüfer, D.; Noll, G.A. Proteins from the FLOWERING LOCUS T-like subclade of the PEBP family act antagonistically to regulate floral initiation in tobacco. Plant J. 2012, 72, 908–921. [Google Scholar] [CrossRef]
  39. Alvarez, J.; Guli, C.L.; Yu, X.-H.; Smyth, D.R. terminal flower: A gene affecting inflorescence development in Arabidopsis thaliana. Plant J. 1992, 2, 103–116. [Google Scholar] [CrossRef]
  40. Johanson, U. Molecular Analysis of FRIGIDA, a Major Determinant of Natural Variation in Arabidopsis Flowering Time. Science 2000, 290, 344–347. [Google Scholar] [CrossRef]
  41. Michaels, S.D.; Bezerra, I.C.; Amasino, R.M. FRIGIDA-related genes are required for the winter-annual habit in Arabidopsis. Proc. Natl. Acad. Sci. USA 2004, 101, 3281–3285. [Google Scholar] [CrossRef]
  42. Choi, K.; Kim, J.; Hwang, H.-J.; Kim, S.; Park, C.; Kim, S.Y.; Lee, I. The FRIGIDA Complex Activates. Transcription of FLC, a Strong Flowering Repressor in Arabidopsis, by Recruiting Chromatin Modification Factors. Plant Cell 2011, 23, 289–303. [Google Scholar] [CrossRef]
  43. Sawa, M.; Kay, S.A. GIGANTEA directly activates Flowering Locus T in Arabidopsis thaliana. Proc. Natl. Acad. Sci. USA 2011, 108, 11698–11703. [Google Scholar] [CrossRef]
  44. Suárez-López, P.; Wheatley, K.; Robson, F.; Onouchi, H.; Valverde, F.; Coupland, G. CONSTANS mediates between the circadian clock and the control of flowering in Arabidopsis. Nature 2001, 410, 1116–1120. [Google Scholar] [CrossRef]
  45. Yanovsky, M.J.; Kay, S.A. Molecular basis of seasonal time measurement in Arabidopsis. Nature 2002, 419, 308–312. [Google Scholar] [CrossRef]
  46. Mizoguchi, T.; Wright, L.; Fujiwara, S.; Cremer, F.; Lee, K.; Onouchi, H.; Mouradov, A.; Fowler, S.; Kamada, H.; Putterill, J.; et al. Distinct Roles of GIGANTEA in Promoting Flowering and Regulating Circadian Rhythms in Arabidopsis. Plant Cell 2005, 17, 2255–2270. [Google Scholar] [CrossRef]
  47. Hennig, L.; Derkacheva, M. Diversity of Polycomb group complexes in plants: Same rules, different players? Trends Genet. 2009, 25, 414–423. [Google Scholar] [CrossRef]
  48. Köhler, C.; Hennig, L. Regulation of cell identity by plant Polycomb and trithorax group proteins. Curr. Opin. Genet. Dev. 2010, 20, 541–547. [Google Scholar] [CrossRef]
  49. Gleason, E.J.; Kramer, E.M. Conserved roles for Polycomb Repressive Complex 2 in the regulation of lateral organ development in Aquilegia × coerulea ‘Origami’. BMC Plant Biol. 2013, 13, 185. [Google Scholar] [CrossRef]
  50. Gleason, E.J.; Kramer, E.M. Characterization of Aquilegia Polycomb Repressive Complex 2 homologs reveals absence of imprinting. Gene 2012, 507, 54–60. [Google Scholar] [CrossRef]
  51. Goodrich, J.; Puangsomlee, P.; Martin, M.; Long, D.; Meyerowitz, E.M.; Coupland, G. A Polycomb-group gene regulates homeotic gene expression in Arabidopsis. Nature 1997, 386, 44–51. [Google Scholar] [CrossRef]
  52. Jiang, D.; Wang, Y.; Wang, Y.; He, Y. Repression of FLOWERING LOCUS C and FLOWERING LOCUS T by the Arabidopsis Polycomb Repressive Complex 2 Components. PLoS ONE 2008, 3, e3404. [Google Scholar] [CrossRef]
  53. Lopez-Vernaza, M.; Yang, S.; Müller, R.; Thorpe, F.; de Leau, E.; Goodrich, J. Antagonistic Roles of SEPALLATA3, FT and FLC Genes as Targets of the Polycomb Group Gene CURLY LEAF. PLoS ONE 2012, 7, e30715. [Google Scholar] [CrossRef]
  54. Levin, J.Z.; Meyerowitz, E.M. UFO: An Arabidopsis gene involved in both floral meristem and floral organ development. Plant Cell 1995, 7, 529–548. [Google Scholar]
  55. Gramzow, L.; Theissen, G. A hitchhiker’s guide to the MADS world of plants. Genome Biol. 2010, 11, 214. [Google Scholar] [CrossRef]
  56. Sharma, B.; Kramer, E.M. The MADS-Box Gene Family of the Basal Eudicot and Hybrid Aquilegia coerulea ‘Origami’ (Ranunculaceae). Ann. Mo. Bot. Gard. 2014, 99, 313–322. [Google Scholar] [CrossRef]
  57. Shore, P.; Sharrocks, A.D. The MADS-Box Family of Transcription Factors. Eur. J. Biochem. 1995, 229, 1–13. [Google Scholar] [CrossRef]
  58. Purugganan, M.D.; Rounsley, S.D.; Schmidt, R.J.; Yanofsky, M.F. Molecular evolution of flower development: Diversification of the plant MADS-box regulatory gene family. Genetics 1995, 140, 345–356. [Google Scholar]
  59. Kramer, E.M.; Holappa, L.; Gould, B.; Jaramillo, M.A.; Setnikov, D.; Santiago, P.M. Elaboration of B Gene Function to Include the Identity of Novel Floral Organs in the Lower Eudicot Aquilegia. Plant Cell 2007, 19, 750–766. [Google Scholar] [CrossRef]
  60. Sharma, B.; Kramer, E.M. Aquilegia B gene homologs promote petaloidy of the sepals and maintenance of the C domain boundary. EvoDevo 2017, 8, 22. [Google Scholar] [CrossRef]
  61. Zahn, L.M.; Kong, H.; Leebens-Mack, J.H.; Kim, S.; Soltis, P.S.; Landherr, L.L.; Soltis, D.E.; dePamphilis, C.W.; Ma, H. The Evolution of the SEPALLATA Subfamily of MADS-Box Genes: A Preangiosperm Origin with Multiple Duplications Throughout Angiosperm History. Genetics 2005, 169, 2209–2223. [Google Scholar] [CrossRef]
  62. Rijpkema, A.S.; Zethof, J.; Gerats, T.; Vandenbussche, M. The petunia AGL6 gene has a SEPALLATA-like function in floral patterning. Plant J. 2009, 60, 1–9. [Google Scholar] [CrossRef]
  63. Wang, P.; Liao, H.; Zhang, W.; Yu, X.; Zhang, R.; Shan, H.; Duan, X.; Yao, X.; Kong, H. Flexibility in the structure of spiral flowers and its underlying mechanisms. Nat. Plants 2016, 2, 15188. [Google Scholar] [CrossRef]
  64. Bemer, M.; Wolters-Arts, M.; Grossniklaus, U.; Angenent, G.C. The MADS Domain Protein DIANA Acts Together with AGAMOUS-LIKE80 to Specify the Central Cell in Arabidopsis Ovules. Plant Cell 2008, 20, 2088–2101. [Google Scholar] [CrossRef]
  65. Steffen, J.G.; Kang, I.-H.; Portereiko, M.F.; Lloyd, A.; Drews, G.N. AGL61 Interacts with AGL80 and Is Required for Central Cell Development in Arabidopsis. Plant Physiol. 2008, 148, 259–268. [Google Scholar] [CrossRef] [Green Version]
Figure 1. Aquilegia coerulea ‘Origami’ plants. (A) Vegetative phase, pre-vernalization. (B) Flowering phase, post-vernalization.
Genes 10 00734 g001
Figure 2. Developmental changes in meristem over the course of vernalization and post-vernalization. (A) Pre-vernalization W0. The SAM is vegetative. (B) W3 during vernalization. The apex is beginning to elongate. (C) Apex on the last day of vernalization (week 4). Elongation is continuing, the apical meristem is beginning to resemble a FM. (D) One-week post-vernalization. Inflorescence growth has progressed with the formation of new axillary meristems. (E) Two weeks post-vernalization, W6. Floral organ primordia can be seen in the terminal bud, which has clearly transitioned to the FM identity. (F) Four-weeks post vernalization, W8. A fully differentiated inflorescence with axillary meristems that are beginning to transition to the FM identity. Size bars A–E = 100 mm F = 200 mm. The symbol b = bract, s = sepal, TM = terminal meristem, LM = lateral meristem and, FM = floral meristem, organ primordia.
Genes 10 00734 g002
Figure 3. Changes in the apex observed through the stereoscope, A, C, E, G, and SEM, B, D, F, H, over the course of vernalization. (A,B) W0, SAM is vegetative. (C,D) W4 terminal meristem with subtending bracts. (E,F) W6 differentiating inflorescence. Floral organ primordia are visible in the terminal bud and several axillary meristems. (G,H) W8. The floral buds are fully formed and the compact inflorescence is prepared to bolt. The meristem remains vegetative. Size bars A, C, E, G, and H = 1.00 mm, B = 200 mm, D = 300 mm, and F = 500 mm. The symbol b = bract, s = sepal, p = petal, st = stamen, sd = staminodium, c = carpel, SAM = shoot apical meristem, FM = floral meristem, TM = terminal meristem, and LM = lateral meristem.
Genes 10 00734 g003
Figure 4. (A) Bar graph shows the number of genes up-regulated and down-regulated in different pairwise comparisons. (B) A three-way Venn diagram of DEGs in W0–W4, W0–W6, and W0–WB pairwise comparisons. (C) A three-way Venn diagram of DEGs in in W4–W6, W4–WB, and W6–WB pairwise comparisons.
Genes 10 00734 g004
Figure 5. Clusters of co-expressed DEGs, C0–C11, at 4 time points W0 = time 0, W4 = time 4, W6 = time 6, and WB = buds.
Genes 10 00734 g005
Figure 6. Heat map based of log 2 RPKM values. All the biological replicates used for each data-point are shown here. (A) Flowering time genes. (B) MADS-box genes.
Genes 10 00734 g006
Table 1. Top GO terms in the three categories: Biological Process (BP), Molecular Function (MF), and Cellular Components (CC) in all pairwise comparisons.
Pairwise ComparisonsGO CategoryGO TermDescription
W0-W4 upBPGO:0070647Protein modification by small protein conjugation or removal
W0-W6 upBPGO:0010033Response to organic substance
W0-WB upBPGO:0070647Protein modification by small protein conjugation or removal
W4-W6 upBPGO:0055086Nucleobase-containing small molecule metabolic process
W4-WB upBPGO:0034660ncRNA metabolic process
W6-WB upBPGO:0048856Anatomical structure development
W0-W4 downBPGO:0055086Nucleobase-containing small molecule metabolic process
W0-W6 downBPGO:0006091Generation of precursor metabolites and energy
W0-WB downBPGO:0006091Generation of precursor metabolites and energy
W4-W6 downBPGO:0006091Generation of precursor metabolites and energy
W4-WB downBPGO:0006812Cation transport
W6-WB downBPGO:0006091Generation of precursor metabolites and energy
W0-W4 upMFGO:0003700DNA-binding transcription factor activity
W0-W6 upMFGO:0003700DNA-binding transcription factor activity
W0-WB upMFGO:0003700DNA-binding transcription factor activity
W4-W6 upMFGO:0005198Structural molecule activity
W4-WB upMFGO:0005198Structural molecule activity
W6-WB upMFGO:0003700DNA-binding transcription factor activity
W0-W4 downMFGO:0005198Structural molecule activity
W0-W6 downMFGO:0005198Structural molecule activity
W0-WB downMFGO:0005198Structural molecule activity
W4-W6 downMFGO:0003700DNA-binding transcription factor activity
W4-WB downMFGO:0015075Ion transmembrane transporter activity
W6-WB downMFGO:0015075Ion transmembrane transporter activity
W0-W4 upCCGO:0031974Membrane-enclosed lumen
GO:0043233Organelle lumen
GO:0070013Intracellular organelle lumen
W0-W6 upCCGO:0005829Cytosol
W0-WB upCCGO:0031974Membrane-enclosed lumen
GO:0043233Organelle lumen
GO:0070013Intracellular organelle lumen
W4-W6 upCCGO:0005840Ribosome
W4-WB upCCGO:0005840Ribosome
W6-WB upCCGO:0031974Membrane-enclosed lumen
GO:0043233Organelle lumen
GO:0070013Intracellular organelle lumen
W0-W4 downCCGO:0005840Ribosome
W0-W6 downCCGO:0005840Ribosome
W0-WB downCCGO:0098796Membrane protein complex
W4-W6 downCCGO:0009579Thylakoid
GO:0044434Chloroplast part
GO:0044435Plastid part
W4-WB downCCGO:0044435Plastid part
W6-WB downCCGO:0098796Membrane protein complex
Table 2. Cluster number of flowering time genes.
Flowering Time GenesCluster Number
AqTFLC0
FRIGIDA LIKE 3C0
FRIGIDA LIKE 4AC0
AqGIC0
AqVIN3AC1
AqCLFC1
AqCOC2
AqFT3C3
AqMSIC3
AqFT2C5
AqLFYC6
AqUFO2C6
AqUFO2AC6
AqSWNC7
AqFTC8
AqMFTC8
FRIGIDA LIKEC9
FRIGIDA LIKE 1C9
AqVIN3BC9
AqVRN5C10
AqUFO1C11
Table 3. Cluster number of MADS-box genes.
MADS-Box TFsCluster Number
AqAGL61C2
AqAGL63C2
AaAGL63 LIKEC2
AqAGL64C2
AqAGL86 LIKEC2
AqAGL86 LIKE AC2
AqAGl12C2
AqSOC1.3C2
AqSOC 1.4C2
AqAG1C2
AqBSC2
AqAGL24.1C3
AqAGL80 LIKEC3
AqAG2C4
AqAGL84C5
AqAGL85C5
AqAGL24.2C5
AqAGL65C5
TM8 LIKEC6
AqSOC1.2C6
AqAGL15C8
AqAP3-1C8
AqAP3-2C8
AqAP3-3C8
AqAG1BC8
AqSEP2BC8
AqSEP3C8
AqAGL63 LIKE AC8
AqFL3C9
SRF TYPE-TFC10
AqAGL6C11
AqFL1AC11
AqFL1BC11
AqAP3-3bC11
AqPIC11
AqSEP1C11
AqSEP2AC11

