1. Introduction
Metabolic rewiring is the main hallmark of several types of cancer. Cancer cells rewire their metabolic program to meet the energetic requirements sustaining proliferation, survival, and invasion. The comprehension of the pathway triggering metabolic changes, that sustain the high energetic and anabolic requirements of the malignant phenotype, might greatly improve the understanding of tumor biology and the development of targeted therapies.
In breast cancer cells, the Warburg effect is a common feature, shared by all breast cancer subtypes [
1]. The switch toward aerobic glycolysis accounts for the production of biohazard products as Glyoxal and Methylglyoxal (MGO) able to react with peculiar amino acids, including arginines and lysines. The reaction goes through the formation of Maillard adducts that are finally transformed into advanced glycation end products (AGEs). Histone proteins are the main target of this reaction because of the reactive amino acids forming the histone tails and due to the high diffusibility of MGO.
Histones are the main component of nucleosome, the molecular structure in which DNA is packaged in the nucleus. DNA is wrapped on histones core and the structure is stabilized by histone linker H1. Histones tails are rich in lysine and arginine, they protrude away from the nucleosome core and might undergo several post-translational modifications (PTMs), e.g., phosphorylation acetylation and methylation. PTMs are key factors in tuning the accessibility of chromatin to transcription factors.
The plethora of histones PTMs represents the “Histone Code”, the “handbook” that cells use to correctly replicate a propagate. Alterations on Histone Code was related with several types of tumors, including breast cancer [
2].
The formation of histones AGEs represents, for living cells, a catastrophic event as they induce the destruction of histone code triggering senescence. It was reported that cancer cells overexpress DJ-1 a deglycases able to remove AGEs from histones proteins and preserve cell survival [
3,
4].
DJ-1, a 20 kDa protein with a well-conserved sequence [
5], is a multifunctional protein. It acts as redox-regulate chaperone, cysteine protease, regulator of RNA-binding protein, and transcriptional coactivator [
5,
6,
7,
8] acting on several biological processes, including antioxidant stress function and mitochondrial regulation [
9,
10,
11]. DJ-1 is overexpressed in several tumor types, including breast cancer [
4]. In cancer cells, DJ-1 is required for maintenance of the transformed phenotype, being implicated in growth, survival, and chemoresistance [
12].
In this work, we applied a previously developed proteomic strategy [
13] to map AGEs formation on histone in breast cancer cells and to detect a novel phosphorylation on DJ-1 protein accountable for the modulation of its glyoxalase activity. “Proteomics approaches are unrivaled by other technologies, as enables not only the identification and quantification of proteins, but also the determination of their modifications, localization, interactions, and ultimately, their function” [
14].
We introduce a new order of complexity for DJ-1 protein function, providing evidence that the glyoxalase activity, determinant to counteract aging triggered by AGE formation on histone proteins, may be modulated by mitogenic pathway. We show that the novel phosphorylation on DJ-1 may neutralize the impairment of AGEs formations on histones, leading to the inactivation of senescence programs. Exploiting the potential of this PTM in tumor biology may, therefore, represents a useful tool to direct cancer cells survival.
2. Materials and Methods
2.1. Cells Culture
MCF7 (HTB-22 from ATCC, Manassas, VA, USA), a model of human sporadic breast cancer cell line, luminal A, were grown in Dulbecco’s modified Eagle’s medium (DMEM) (Sigma Aldrich, Saint Louis, MO, USA, implemented with 100 mg/mL streptomycin and 100 U/mL penicillin (Sigma Aldrich) and 10% (w/v) fetal bovine serum (FBS) (Sigma Aldrich). MCF10 are a model of immortalized mammary epithelial cells (CRL-10317 from ATCC, Manassas, VA, USA). Cells were grown in MEGM, Mammary Epithelial Cell Growth Medium (Lonza, Walkersville, MD, USA), implemented with 20 ng/mL epidermal growth factor (Lonza),10 μg/mL insulin (Lonza), 0.5 μg/mL hydrocortisone (Lonza), and 100 ng/mL cholera toxin (Sigma Aldrich). The HCC1937 (CRL-2336 from ATCC, Manassas, VA, USA) are a model for hereditary breast cancer cell line that has a homozygous mutation for the BRCA1 5382C terminal; The HCC193 are a model of triple negative breast cancer. The culture medium for HCC1937 was Roswell Park Memorial Institute (RPMI) (ATCC, Manassas, VA, USA) implemented with 20% (w/v) fetal bovine serum (FBS) (Sigma Aldrich), 100 mg/mL streptomycin, and 100 U/mL penicillin (Sigma Aldrich).
2.2. Cells Treatments
2.2.1. H2O2 Treatment
Cells were seeded until they reached 60% of confluence. Cells were serum-starved for 24 h and subsequently treated with 250 μM H2O2 (Sigma Aldrich) in complete medium for 24 h.
2.2.2. LY294002 Treatment
Cells were seeded until they reached 60% of confluence. Cells were serum-starved for 24 h and subsequently treated with 30 μM LY294002 in complete medium for 24 h.
2.2.3. H2O2 and LY294002 Co-Treatment
Cells were seeded until they reached 60% of confluence. Cells were serum-starved for 24 h. Complete medium, containing 30 μM LY294002, was added to the cell plate. Following cells were treated with 250 μM H2O2 (Sigma Aldrich) for 24 h.
2.3. Whole Protein Extraction
Cells were washed with PBS and incubated on ice for 30 min, using lysis buffer containing 15 mM Tris pH 7.5, 25 mM KCl, 120 mM NaCl, and 0.5% Triton X-100 and supplemented with protease and phosphatase inhibitor cocktail (Halt Protease Inhibitor Cocktail/Halt Phosphatase Inhibitor Cocktail, Thermo Fisher Scientific Waltham, MA, USA). Cell lysate was sonicated at 4 °C for 10″ three times. Afterward, it was centrifugated at 15,000×
g for 30 min. The resulting supernatant was accurately transferred to a new tube. The protein concentration was measured by the Bradford method (Bio-Rad, Hercules, CA, USA) [
15]. Proteins extracts were stored at −80 °C until use.
2.4. Isolation of Nuclear Fractions
Cells were incubated with lysis buffer containing 10 mM Tris-Cl pH 8.0, 1 mM KCl, 1.5 mM MgCl2, and 1 mM DTT, supplemented with protease and phosphatase inhibitor cocktail. The mixture was incubated for 30 min on rotator at 4 °C.
Nuclei were pelleted at 10,000×
g for 10 min at 4 °C. Protein assay was done using the Bradford Protein Assay (Bio-Rad, Hercules, CA, USA)) according to the manufacturer’s instructions with bovin serum albumin (BSA) as standards [
15].
Western blot against Vimentin (5741, Cell signaling, 1:1000) and Histone H3 (1:1000; 9715; Cell Signaling; Danvers, MA, USA) were used to ensure that nuclear extracts were not contaminated by cytoplasmic fraction.
2.5. Two-Dimensional Polyacrylamide Gel Electrophoresis (2DE) Analysis
To perform a 2DE, 130μg of cell proteins extract were solubilized using isoelectrofocusing buffer (IEF). The buffer contains 4% CHAPS, 8 M urea, 0.1 M dithiothreitol (DTT), 0.8% pH 3–10 nonlinear (NL) carrier ampholyte buffer. IEF was performed at 70,000 Vh, on the IPGphor II apparatus (GE Healthcare, Chicago, IL, USA), using nonlinear Immobline Dry Strips (GE Healthcare), pH 3–10, 24 cm long. After this first dimension, the strips were equilibrated with SDS equilibration buffer containing DTT 10 mg/mL
−1, for 15 min and then for another 15 min in SDS equilibration buffer with iodoacetamide (IAA)25 mg/mL
−1. Procedures were performed according to GE Healthcare Ettan protocol book [
16,
17]. The second dimension was carried out on 10% SDS polyacrylamide gels, until the bromophenol blue reached the bottom of the gels [
18]. The gels were fixed and stained using silver staining method, which is compatible with mass spectrometry analysis [
19].
For each sample, the analysis was carried out in triplicate. Gel images were acquired using Image Scanner II (GE Healthcare, Chicago, IL, USA) and analyzed through Image Master 2D-Platinum software 6.0 version (GE Healthcare, Chicago, IL, USA)
2.6. In-Gel Digestion
Protein spots were excised from the gel, de-stained, and trypsinized using an in-gel procedure previously reported. For proteins bands from SDS gel, before proceeding with digestion, spots were further reduced and alkylated using, respectively, DTT (10 mg/mL
−1) and IAA (25 mg/mL
−1). Tryptic peptides were purified with Pierce C18 Spin Columns (Thermo Fisher Scientific Inc.), eluted with 90 μL of 70% acetonitrile, and dehydrated in a vacuum evaporator [
20,
21,
22]. Mass analysis was carried out using Nanoscale liquid chromatography coupled with tandem mass spectrometry.
2.7. Nanoscale LC-MS/MS Analysis
Tandem Mass analysis was carried out with Easy LC 1000 nanoscale liquid chromatography (nanoLC) system (Thermo Fisher Scientific, Odense, Denmark). The chromatography was performed on a C18 silica capillary, 75 μm i.d. The tryptic peptides were injected into the analytical column at 500 nL min−1 and then eluted with a binary gradient (Phase A: 0.1% formic acid, 2% acetonitrile; phase B: 0.1% formic acid, 80% acetonitrile; the elution gradient was set up at 350 nL min−1 flow rate). For the mass detection, a quadrupole, Orbitrap mass spectrometer Q-Extactive (Thermo Fisher Scientific, Bremen, Germany) coupled with a nano electrospray (nESI) with a potential of 1800 V was used, operating in positive ion mode. MS/MS analysis was done a Data-dependent top-6 method.
The window for precursor ion isolation was set at 2.0 m/z−1 and the collision energy was normalized at 30 s. The dynamic exclusion was set at 15 s and the for-triggering MS/MS events ion threshold was 2 × 10⁴.
For data processing, the software Proteome Discoverer 1.4 (Thermo Fisher Scientific, Bremen, Germany) was used, with Sequest as a search engine, and the Human-refprot-isoforms.fasta as sequence database.
Searching parameters were: 15 ppm of MS tolerance; 0.02 Da MS/MS tolerance; fixed modification: carbamidomethylation of cysteine; variable modification: phosphorylation of serine, tyrosine, and threonine; oxidation of methionine; max. missed cleavages 2; taxonomy Human.
The identification for protein was based on two tryptic peptides hits result with medium confidence (Xcorr > 2.0 for doubly charged peptides, >2.5 for triply charged peptides, and >3.0 for peptides having a charge state >3 to considerate a peptide identification valid) [
23]. Peptides carrying MG-H1 modification were considered valid only if the score of identification was high [
23].
2.8. Western Blot Analysis
Western blot analysis was carried out with precast SDS-PAGE (Any kDTM Mini-PROTEAN Precast Protein Gels, Bio-Rad) and 15% SDS-PAGE. Gels were electrotransferred to a nitrocellulose membrane using a Transblot turbo system (Bio-Rad). Membrane blocking, before primary antibody hybridization, was performed according with antibody manufacturer instructions. Membranes were incubated with following primary antibodies overnight: Akt (1:1000; 9272; Cell Signaling; Danvers, MA, USA); Phospho-Akt (1:1000; 4060; Cell Signaling; Danvers, MA, USA); DJ-1 (1:1000; D29E5XP, Cell Signaling; Danvers, MA, USA); Phospho-Akt Substrate HRP conjugate (1:1000; 6950; Cell Signaling; Danvers, MA, USA); Anti-Methylglyoxal (1:2000; STA-011; Cell Biolabs; San Diego, CA, USA); γ-tubulin (1:1000; sc-7396; Santa Cruz; Dallas, TX, USA); H1 (1:100; ab 71594; Abcam; Cambridge, UK); H3 (1:1000; 9715; Cell Signaling; Danvers, MA, USA); H4 (1:1000; 2592; Cell Signaling; Danvers, MA, USA). Vimentin (5741, Cell signaling, 1:1000).The detection of primary antibody was performed with a horseradish peroxidase-conjugate secondary antibody: antirabbit (1:3000, 7074; Cell Signaling; Danvers, MA, USA); antimouse (1:2000, sc-7074; Santa Cruz, Dallas, TX, USA); antigoat (1:4000; sc-2354; Santa Cruz, Dallas, TX, USA).
Cell signaling antibodies were diluted in 1X TBS, 0.1% Tween-20 with 5% w/v BSA. Abcam and Santa Cruz antibodies were diluted in 1X TBS, 0.1% Tween-20 with 5% w/v nonfat dry milk according with manufacturer instructions.
Immunoblots were developed using the SuperSignal West Femto enhanced chemiluminescent substrate (Pierce, Thermo Fisher Scientific Inc., Bremen, Germany). Corresponding images were acquired by Alliance 2.7 (UVITEC, Eppendorf, Milan, Italy). Densitometric analysis was done by Alliance 1D fully automated software.
Data were examined and plotted by means of Excel spreadsheet (Microsoft, Redmond, WA, USA). They were expressed as mean ± SEM (N): SEM is the standard error of the mean and N is the number of experimental repeats.
2.9. 2D Western Blot Analysis
20 μg of proteins extract, from breast cancer cells, were diluted in Isoelectrofocusing (IEF) sample buffer, containing: 8 M urea, 0.1 M DTT, 4% CHAPS, 0.8% pH 3–10 carrier ampholyte buffer. IEF was performed on 7-cm-long Immoline DryStrips, pH 3–10 (GE Healthcare). Run was performed on the IPGphor II apparatus (GE Healthcare) until a total of 30,000 Vh was reached. After this first step, IPG strips were equilibrated with SDS equilibration solution that contains 10 mg/mL DTT, and subsequently equilibrated with SDS buffer containing 25 mg/mL IAA.
Proteins were resolved, according to the molecular weight, on 12% SDS-polyacrylamide gels (2 W/gel; 25 °C) until the dye front reached the bottom of the gels. Gels were electrotransferred to a nitrocellulose membrane by a Trans-blot turbo system (Bio-Rad). The membranes were incubated with primary antibody DJ-1 (1:1000; D29E5XP, Cell Signaling; Danvers, MA, USA) O.N. at 4 °C. The detection of primary antibody was performed with a horseradish peroxidase-conjugate secondary anti-rabbit (1:3000, 7074; Cell Signaling; Danvers, MA, USA). Blots were developed using the SuperSignal West Femto ECL substrate (Pierce, Thermo Fisher Scientific Inc., Bremen, Germany). The images of blotted proteins were acquired by Alliance 4.7 (UVITEC, Eppendorf, Milan, Italy), the intensities of blotted proteins it was determined using the densitometric software (Alliance 1D fully automated software).
Image analysis of 2D Western blot was carried out with Image Master 2D Platinum software 6.0 (GE Healthcare). Proteoform levels were quantified using the relative volume (% Vol) option of the software. Each proteoform was quantified respect the whole spot volume of each isoelectric series. This option allows the data to be independent of experimental variations between membrane caused by differences in loading. Differences between sample were expressed as fold change over the baseline. Analysis was performed using three independent experiments, respectively. All data were presented as mean ± SEM (N), where SEM represents the standard error of the mean and N indicates the number of experimental repeats. Data were plotted using Excel spreadsheet (Microsoft Corporation, Redmond, WA, USA).
2.10. Scansite Analysis
Scansite is a motif scanning program (
https://scansite4.mit.edu/4.0) [
24]. It was used to find out putative kinase substrates. The program looks for domain-binding peptides or kinase substrates, applying a position-specific scoring matrix (PSSM) originated from screening peptides libraries synthesized chemically or displayed in bacteriophages.
The search engine was used to analyze phosphorylated peptides and identify the substrates that are likely to be phosphorylated by the basophilic serine/threonine kinase Akt. Putative protein phosphorylation site was further investigated by evaluating evolutionary conservation
2.11. Immunofluorescence Microscopy Analysis
First, 55 × 105 cells were plated on glass coverslips in 6-well culture dish. When the cells reached the 50% of confluences, MitoTracker Green (Thermo Scientific) was added to the cell for 45′ at 37 °C. Cells were washed three times with pre-warmed phosphate buffer saline (PBS) and for 30 min with 4% paraformaldehyde (Sigma-Aldrich), Cells permeabilization was done with 0.3% Triton X-100 (Sigma-Aldrich) diluted in PBS for 15 min. Nonspecific-binding sites were blocked with 10% FBS (Biowest, Nauaillé, France) and 0.1% Triton X-100 in PBS for 1 h at RT. The primary antibody against DJ-1 (D29E5XP, Cell Signaling Danvers, MA, USA) was diluted 1:1000 in PBS, 3% FBS.
A solution, with secondary goat anti-rabbit Alexa-Fluor-594 (A-11012; Life Technologies) (2 μg/mL) in PBS containing 1% FBS, and DAPI (4′,6-diamidino-2-phenylindole, to stain the nuclei) was incubated for 45 min at RT. Coverslips were mounted with fluorescent mounting medium (Dako Cytomation). Images were acquired using DMi8 Leica microscope (Leica Microsystem Srl, Milan, Italy). The experiment was repeated in three independent biological replicates.
To ascertain and quantify subcellular localization of expressed DJ-1 protein, the relative staining intensities were assessed in the mitochondria and nucleus. The analysis of the images was carried out with ImageJ software (Wayne Rasband, National Institute of Mental Health, Bethesda, MD, USA). DAPI and MitoTracker staining were used to define the nuclear and mitochondria regions of interest (ROIs) that were drawn manually.
The contrast and brightness were adjusted and images were randomly selected from more 25 cells per cell line. The non-specific staining of the ROIs was manually selected from images to become background in which intensity value was subtracted from the image content. Total cell fluorescence (CTFC) was corrected and evaluated by the formula of Integrated Density: Area of selected cell * Mean fluorescence of background readings. Finally, the average ratio between the intensity of fluorescence in the mitochondria and nuclei was plotted [
25].
2.12. Histones Acid Extraction
Histone protein extraction was done in acid condition. Cells, at 80% of confluence, were washed with 500 μL of hypotonic lysis buffer (10 mM Tris-HCl pH 8.0, 1 mM KCl, 1.5 mM MgCl
2, 1 mM DTT) implemented with protease and phosphatase inhibitor cocktail (Halt Protease Inhibitor Cocktail/Halt Phosphatase Inhibitor Cocktail Thermo Fisher Scientific Inc.). Plate was scraped with 1 mL of hypotonic lysis buffer, and incubated for 30 min on rotator at 4 °C. The resulting nuclei were isolated by centrifugation at 4 °C for 10 min at 10,000×
g. Histones were extracted by incubating the pellet with 0.4 N H
2SO
4 on ice. Proteins were precipitated with trichloroacetic acid (TCA). Resulting histone pellet was washed twice with ice-cold acetone, lyophilized, and solubilized in sterile H
2O. The protein concentration was measured by the Bradford method (Bio-Rad, Hercules, CA, USA) [
15]. Histones extracts were stored at −80 °C until use.
2.13. 2D Gel Triton-Acid-Urea (TAU) Electrophoresis
2.13.1. First Dimension: Triton-Acid-Urea (TAU) Gel Electrophoresis
TAU gel was cast According to Shechter et al., protocol. Lyophilized histones (35 µg) were solubilized in acidic sample buffer (6 M Urea, 5% glacial acid acetic, 0.02%) and loaded on the gel. It was run in 5% acetic acid solution for 17 h at 25 V. Histones isoforms resolved on the gel were stained with EZBlue Gel Staining Reagent (Sigma Aldrich) [
26].
2.13.2. Second Dimension: SDS-PAGE
The histones lines were cut off from the gel and loaded on a 12% SDS polyacrylamide gels (Mini-PROTEAN® TGXTM Precast Gels, IPG Well) to resolve them by molecular weight.
The separation was run at 80 V until the dye reached the bottom of the gel. The gels were stained with staining procedure compatible with mass spectrometry: EZBlue Gel Staining Reagent (Sigma Aldrich) or silver staining. Image analysis of the gels was executed with Image Master 2D-Platinum software 6.0 (GE Healthcare). All analysis was carried out in triplicate [
19].
2.14. 2D Western Blot TAU
Equal amounts of histone extracts were separated by 2D TAU/SDS gel. In order to circumvent gel to gel variation and reliably compare samples under investigation, second dimension was done on Mini-PROTEAN® TGX™ Precast Gels, IPG Well (12%). Resulting gel was blotted to nitrocellulose membranes with a Trans-blot turbo system (Bio-Rad) using Trans-Blot® Turbo™ Mini Nitrocellulose Transfer Packs. Filters were incubated with the following antibody: DJ-1 (1:1000; Cell Signaling; Danvers, MA, USA) O.N. Equal protein loading was ensured by incubating membranes with red ponceau solution (P7170 Sigma-Aldrich).
The images of blotted proteins were acquired by Alliance 4.7 (UVITEC, Eppendorf, Milan, Italy), the intensities of blotted proteins was determined using the densitometric software Alliance 1D fully automated software. Image analysis of 2D Western blot was carried out with Image Master 2D Platinum software 6.0 (GE Healthcare) [
13].
2.15. Histones Spot Extractions
Proteins spots on 2D TAU gel was processed according with the protocol reported in
Section 2.6, “In-Gel Digestion”.
2.16. MS Data Processing and Database Searching
All acquired data, stored by raw data files, were preprocessed with Proteome Discoverer 1.4 (Thermo Fisher Scientific, Bremen, Germany). MS/MS data were sought on the Human UniProt database. To estimate the false discovery rate (FDR) of peptide identifications it was utilizing the “Target-decoy PSM validator” node in Proteome Discoverer. Searching parameters were MS error tolerance: 5 ppm; MS/MS error tolerance: 0.02 Da; enzyme specificity: trypsin; maximum number of missed cleavages: 2; taxonomy Human; fixed modifications: Carbamidomethylation (C); variable modification: Oxidation (M), Acetyl (K), Methyl (K), Dimethyl (K), Trimethyl (K), Methyl (R), Dimethyl (R), Deamidated (R), Phosphorylation (STY), and Glycation (MG-H1). The identification for protein was based on two tryptic peptides hits result with high confidence (Xcorr > 2.0 for doubly charged peptides, >2.5 for triply charged peptides, and >3.0 for peptides having a charge state >3 to considerate a peptide identification valid) [
27].
2.17. Immunoprecipitation Analysis
Next, 100 µg of proteins from whole proteins extract, was incubated overnight with Phospho-Akt Substrate Sepharose® Bead Conjugate (1:20; 9646; Cell Signaling; Danvers, MA, USA) to perform an immunoprecipitation. Beads were washed three times and were incubated at 100 °C for 5 min. The resultant immunocomplexes were resolved through precast SDS-PAGE (Any kDTM Mini-PROTEAN Precast Protein Gels, Bio-Rad); proteins were electrotransferred by a Transblot turbo system (Bio-Rad) for 30 min according to Bio-Rad protocol. Membrane was incubated with primary antibody: DJ-1 (1:1000; D29E5XP, Cell Signaling; Danvers, MA, USA). The detection of primary antibody was executed with antirabbit horseradish peroxidase conjugate secondary antibody (1:3000; Cell Signaling; Danvers; MA, USA). With SuperSignal West Femto ECL substrate (Pierce, Thermo Fisher Scientific Inc., Bremen, Germany); and images of blotted antibodies were acquired by Alliance 2.7 (UVITEC, Eppendorf, Milan, Italy). γ-Tubulin was used as loading control.
2.18. Immunoprecipitation Isolation of DJ-1 Nuclear Interactor
100 µg of nuclear extract, isolated as previously reported, were incubated with the antibody against DJ-1 (1:100; D29E5XP, Cell Signaling; Danvers, MA, USA) at 4 °C for 4 h on a rotating device. 20 µL of resuspended volume of Protein A/G PLUS-Agarose (Santa Cruz) were added to the mixture and incubated at 4 °C on a rotating device overnight. Beads were washed three times and were incubated at 100 °C for 5 min. In parallel, a Mock-IP was done using only Protein A/G PLUS-Agarose, as negative control. The resultant immunocomplexes and the input were resolved through precast SDS-PAGE (Any kDTM Mini-PROTEAN Precast Protein Gels, Bio-Rad); proteins were electrotransferred by a Transblot turbo system (Bio-Rad) for 30 min according to Bio-Rad protocol. Membrane was incubated with primary antibody: DJ-1 (1:1000; D29E5XP, Cell Signaling; Danvers, MA, USA); H3 (1:1000; 9715; Cell Signaling; Danvers, MA, USA); Histone H2B (D2H6). The detection of primary antibody was performed with a horseradish peroxidase-conjugate secondary antibody: antirabbit (1:3000, 7074; Cell Signaling; Danvers, MA, USA); antimouse (1:2000, sc-7074; Santa Cruz, Dallas, TX, USA); and antigoat (1:4000; sc-2354; Santa Cruz, Dallas, TX, USA). Antibodies were diluted according to manufacturer instructions.
Immunoblots were developed using the SuperSignal West Femto ECL substrate (Pierce, Thermo Fisher Scientific Inc., Bremen, Germany). Corresponding images were acquired by Alliance 2.7 (UVITEC, Eppendorf, Milan, Italy). Densitometric analysis was done by Alliance 1D fully automated software.
2.19. LC-MS/MS Analysis of DJ-1 Nuclear Interactors
Nuclear DJ-1 interactors were pull down according with the immunoprecipitation proteins previously reported. DJ-1 interactors were resolved by SDS-PAGE (Any kDTM Mini-PROTEAN Precast Protein Gels, Bio-Rad) and visualized using EZBlue Gel Staining Reagent (Sigma Aldrich). Gel lane referred to DJ-1-IP and Mock-IP were sliced according to molecular weight. Gel bands were processed according to the protocol reported in the
Section 2.6.
Proteins identified in the Mock-IP gel line were classified as unspecific interactors and eliminated from the list of specific DJ-1-nuclear interactors.
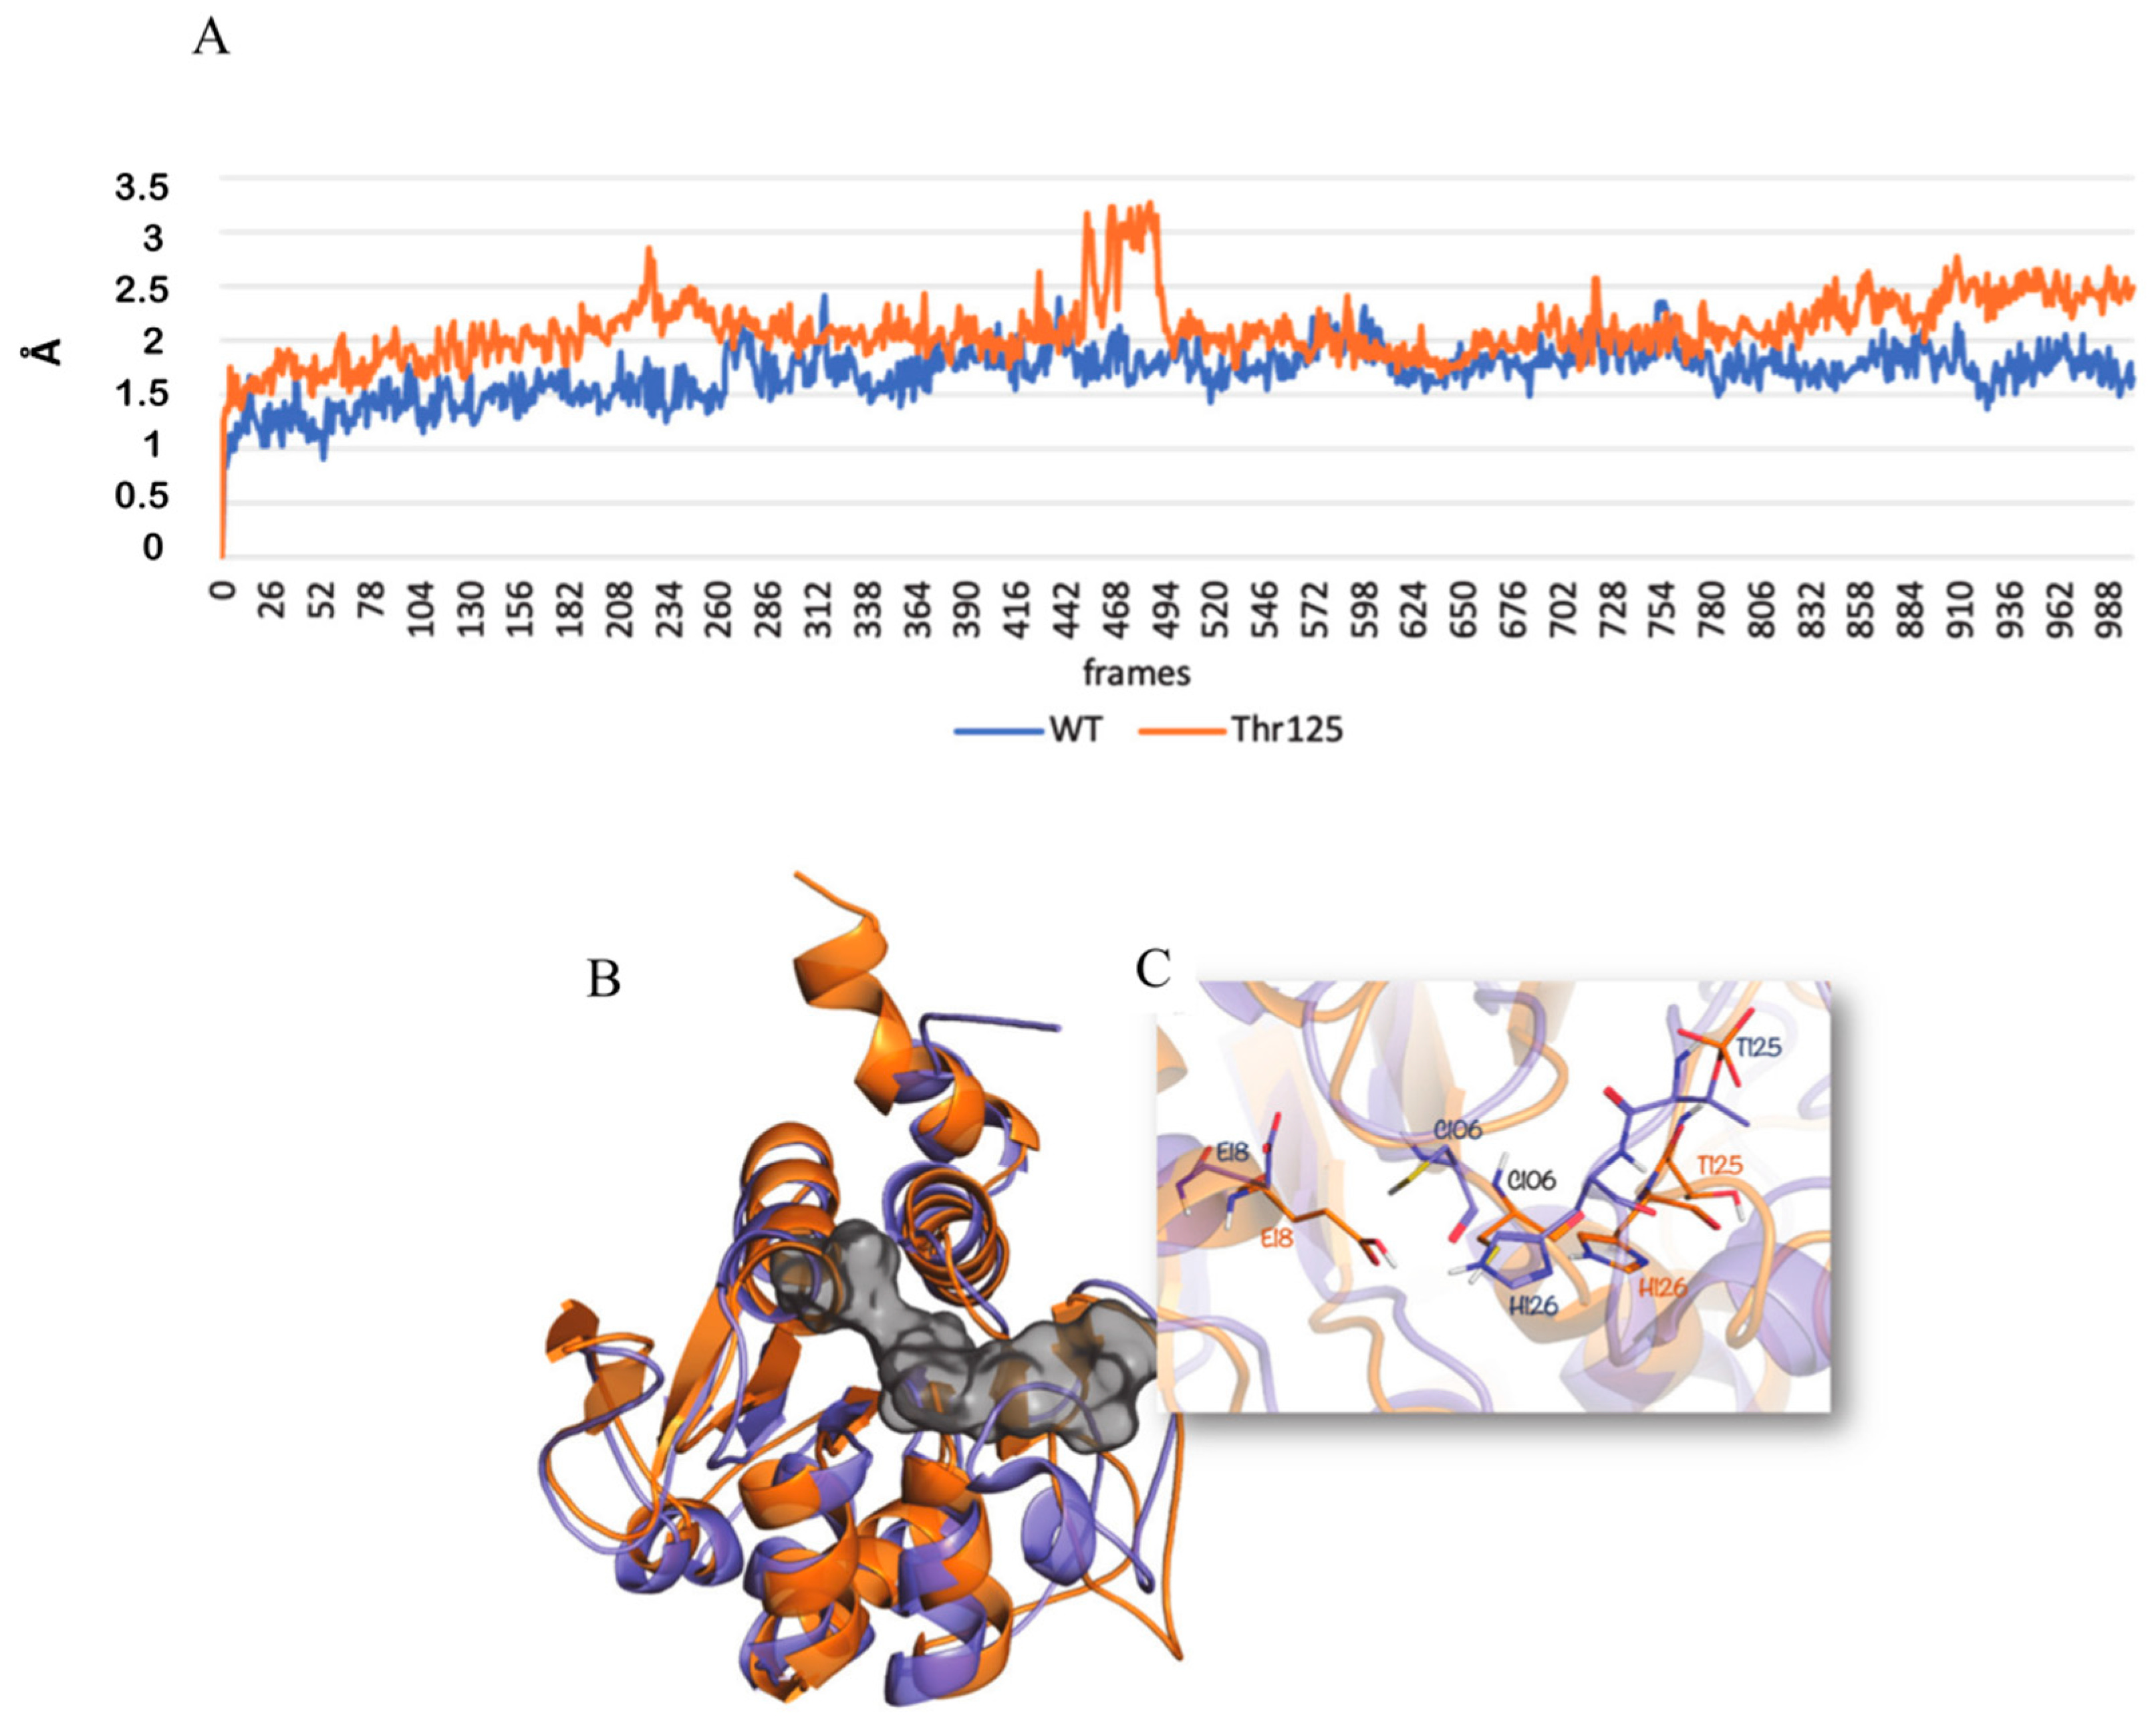
2.20. Molecular Modeling Analysis
Starting from the crystal structure of DJ-1, deposited in the Protein Data Bank with the PDB code 4RKW [
28], our molecular modeling studies were performed. By using the DJ-1 PDB model as template, we generated the DJ-1 protein phosphorylated at the position 125 by means of the Maestro tool [
29]. For our modeling studies, we used the DJ-1 non-phosphorylated and the DJ-1 phosphorylated at the position 125 models. The two receptor structures were prepared through Protein Preparation Wizard implemented in Maestro, using OLPS-2005 as force-field [
30]. Residual crystallographic buffer components were removed, missing side chains were built using the Prime module, hydrogen atoms were added, and side chains protonation states at pH 7.4 were assigned [
31,
32].
After the preparation, both the models were submitted to 200 ns of Molecular Dynamics simulations (MDs) using Desmond-v5.3 at 300 K temperature and ensemble NPT class [
33,
34]. The systems were immersed in an orthorhombic box of TIP3P water molecules, extending at least 10 Å from the protein, and counter ions were added to neutralize the system charge.
The resulting trajectories were clustered with respect to Root Mean Square Deviation (RMSD), in order to explore all the collection structures obtained, getting ten representative structures (five for the non-phosphorylated DJ-1 protein and five for the phosphorylated DJ-1 protein). Then, by using the Prime calculate Energy tool [
32], we selected, for the further analysis, the
lowest-energy structure, respectively, for the non-phosphorylated and the phosphorylated protein.
2.21. Evaluation of Extracellular Acidification Rates
Extracellular acidification rate (ECAR) measurements were performed using the XFp Extracellular Flux analyzer (Seahorse Bioscience, North Billerica, MA, USA). The analysis was done using the Seahorse XF Cell Energy Phenotype Test kit according with manufacturer instruction. Briefly, cells were plated into XFp polystyrene cell culture plates (Seahorse Bioscience, North Billerica). MCF7 and HCC1937 cells were seeded at 30,000/well (XFp plate). The cells were incubated for 24 h in a humidified 37 °C incubator with DMEM medium or RMPI1640, respectively. Each experiment was done in triplicate according with manufacturer protocol.
4. Discussion
In this work, we aimed to elucidate the strategies that breast cancer cells exploit to overcome the formation of AGE on histones following the metabolic rewiring toward aerobic glycolysis. Cancer cells largely rely on glycolysis to produce energy needed for cellular economy even during normoxia conditions. ‘Warburg effect’ is the main hallmark of cancer cells. The increased glycolytic flux induces carbonyl stress, through the overproduction of harmful metabolites as MGO. MGO is able to bypass nuclear membrane and reacts with amino groups of lysine and arginine of histone tails leading to the formation of advanced glycation end products (AGEs). This reaction underlies the loss of “Histone Code” [
51].
Here, the formation of AGEs on histones was investigated applying a powerful proteomic approach. The methods, previously reported by us for the global analysis of histones posttranslational modification [
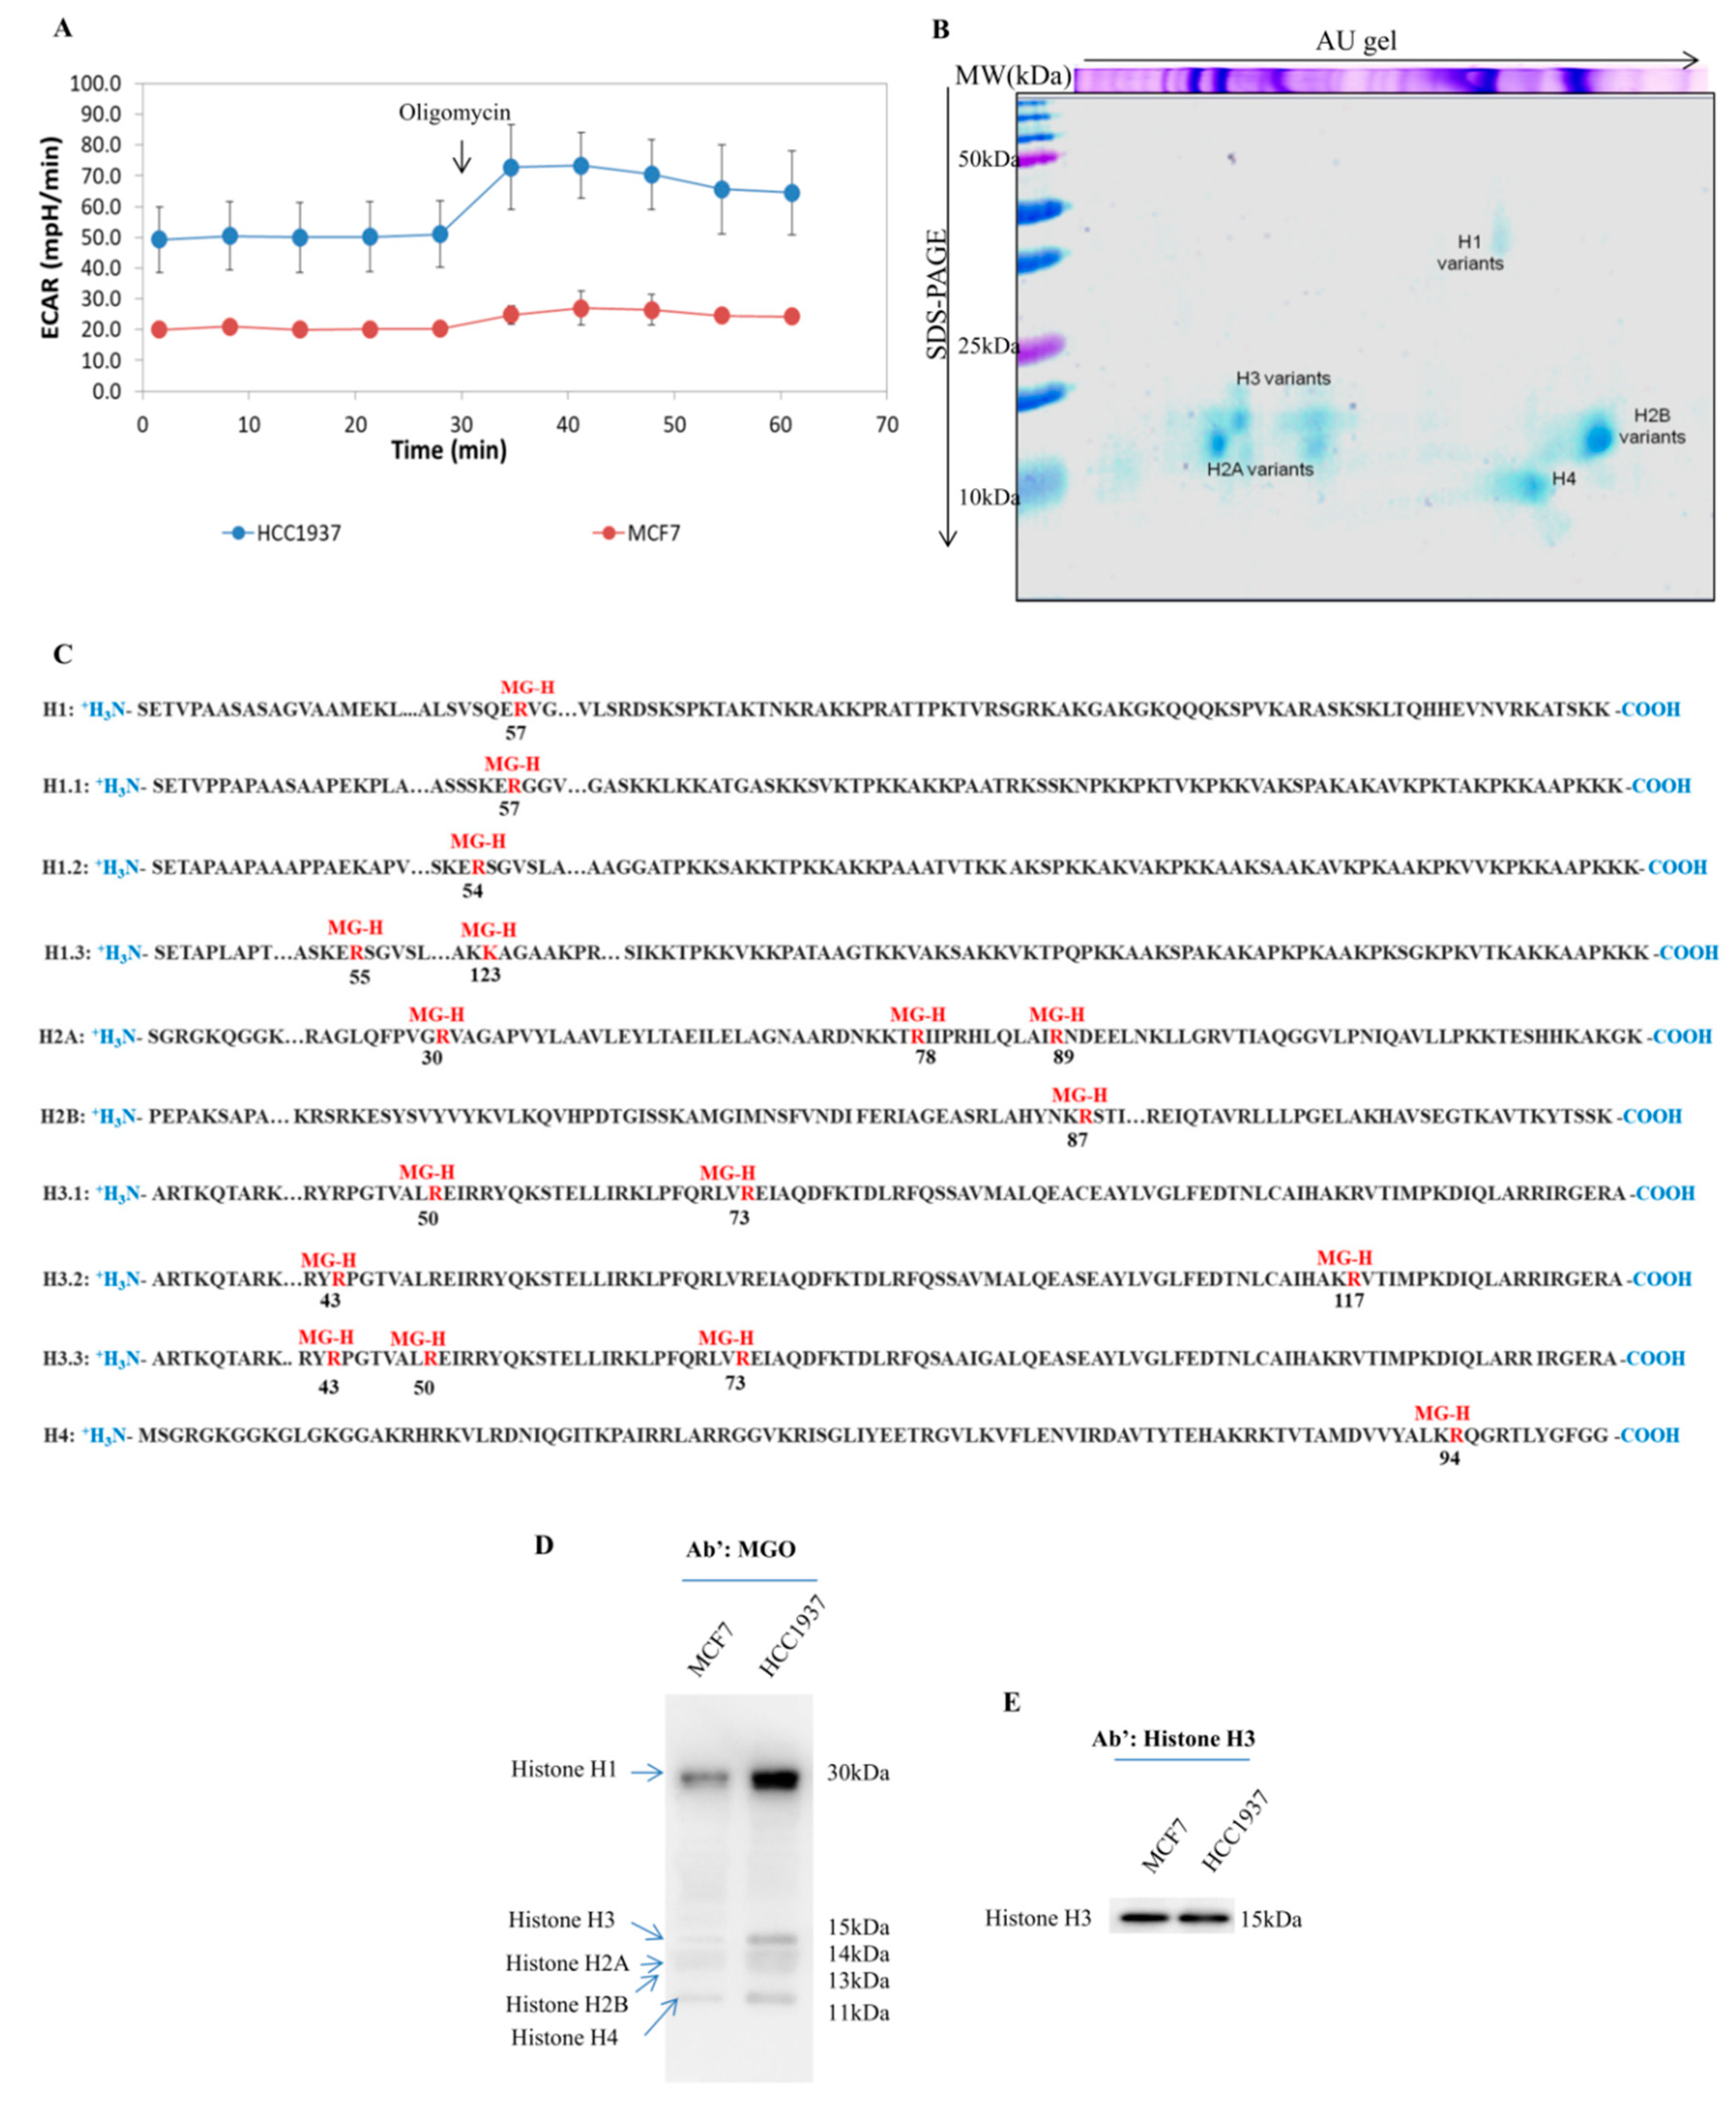
13], enables us to resolve all histones isoforms in a single 2D map, allowing us to investigate all histones PTMs, even those less represented. The strategies allow us to disclose several AGEs modification on histone proteins, including, for the first time to our knowledge, those on histone H1.
Recently, some authors investigated the formation of AGE on histones addressing the issue in several cellular models, including breast cancer, but mostly forcing MGO concentrations and/or the Glycolytic flux [
38,
51].
As the AGEs formation is a non-enzymatic reaction, induced variations of glycolytic flux and/or increase of MGO may significantly affect the magnitude of results obtained, making them not immediately related to what really happens in breast cancers cells.
Although the findings reported represent an excellent starting point for our work, we chose of not interfere with the delicate metabolism balance of our cellular models, keeping “endogenous conditions”. Our strategies allow us to identify several MGO adducts on histones proteins, firstly the formation of MGO adducts on the histones H1. This novel modification, detected on arginine 57, was never reported by others. The histone H1, also known as the linker histone, has the function to strongly compact the nucleosomes, acting as strategic planners of chromatin structure [
52].
Several finding reports that histone H1 is a key factor both in chromatin condensation and decondensation, the presence of a bulky modification, as MGO, on R57 should be relevant for H1 activity due to its close proximity to R54, a residue crucial for chromatin disassembly [
53].
The overall analysis of sites undergoing glycation reveals that all them have been related to the crosstalk between phosphorylation and acetylation. It enforces the hypothesis that AGEs formation might act in the deconstruction of histone code either directly modifying sites undergoing PTMs, either inducing steric impediments when modifying sites close to critical amino acids.
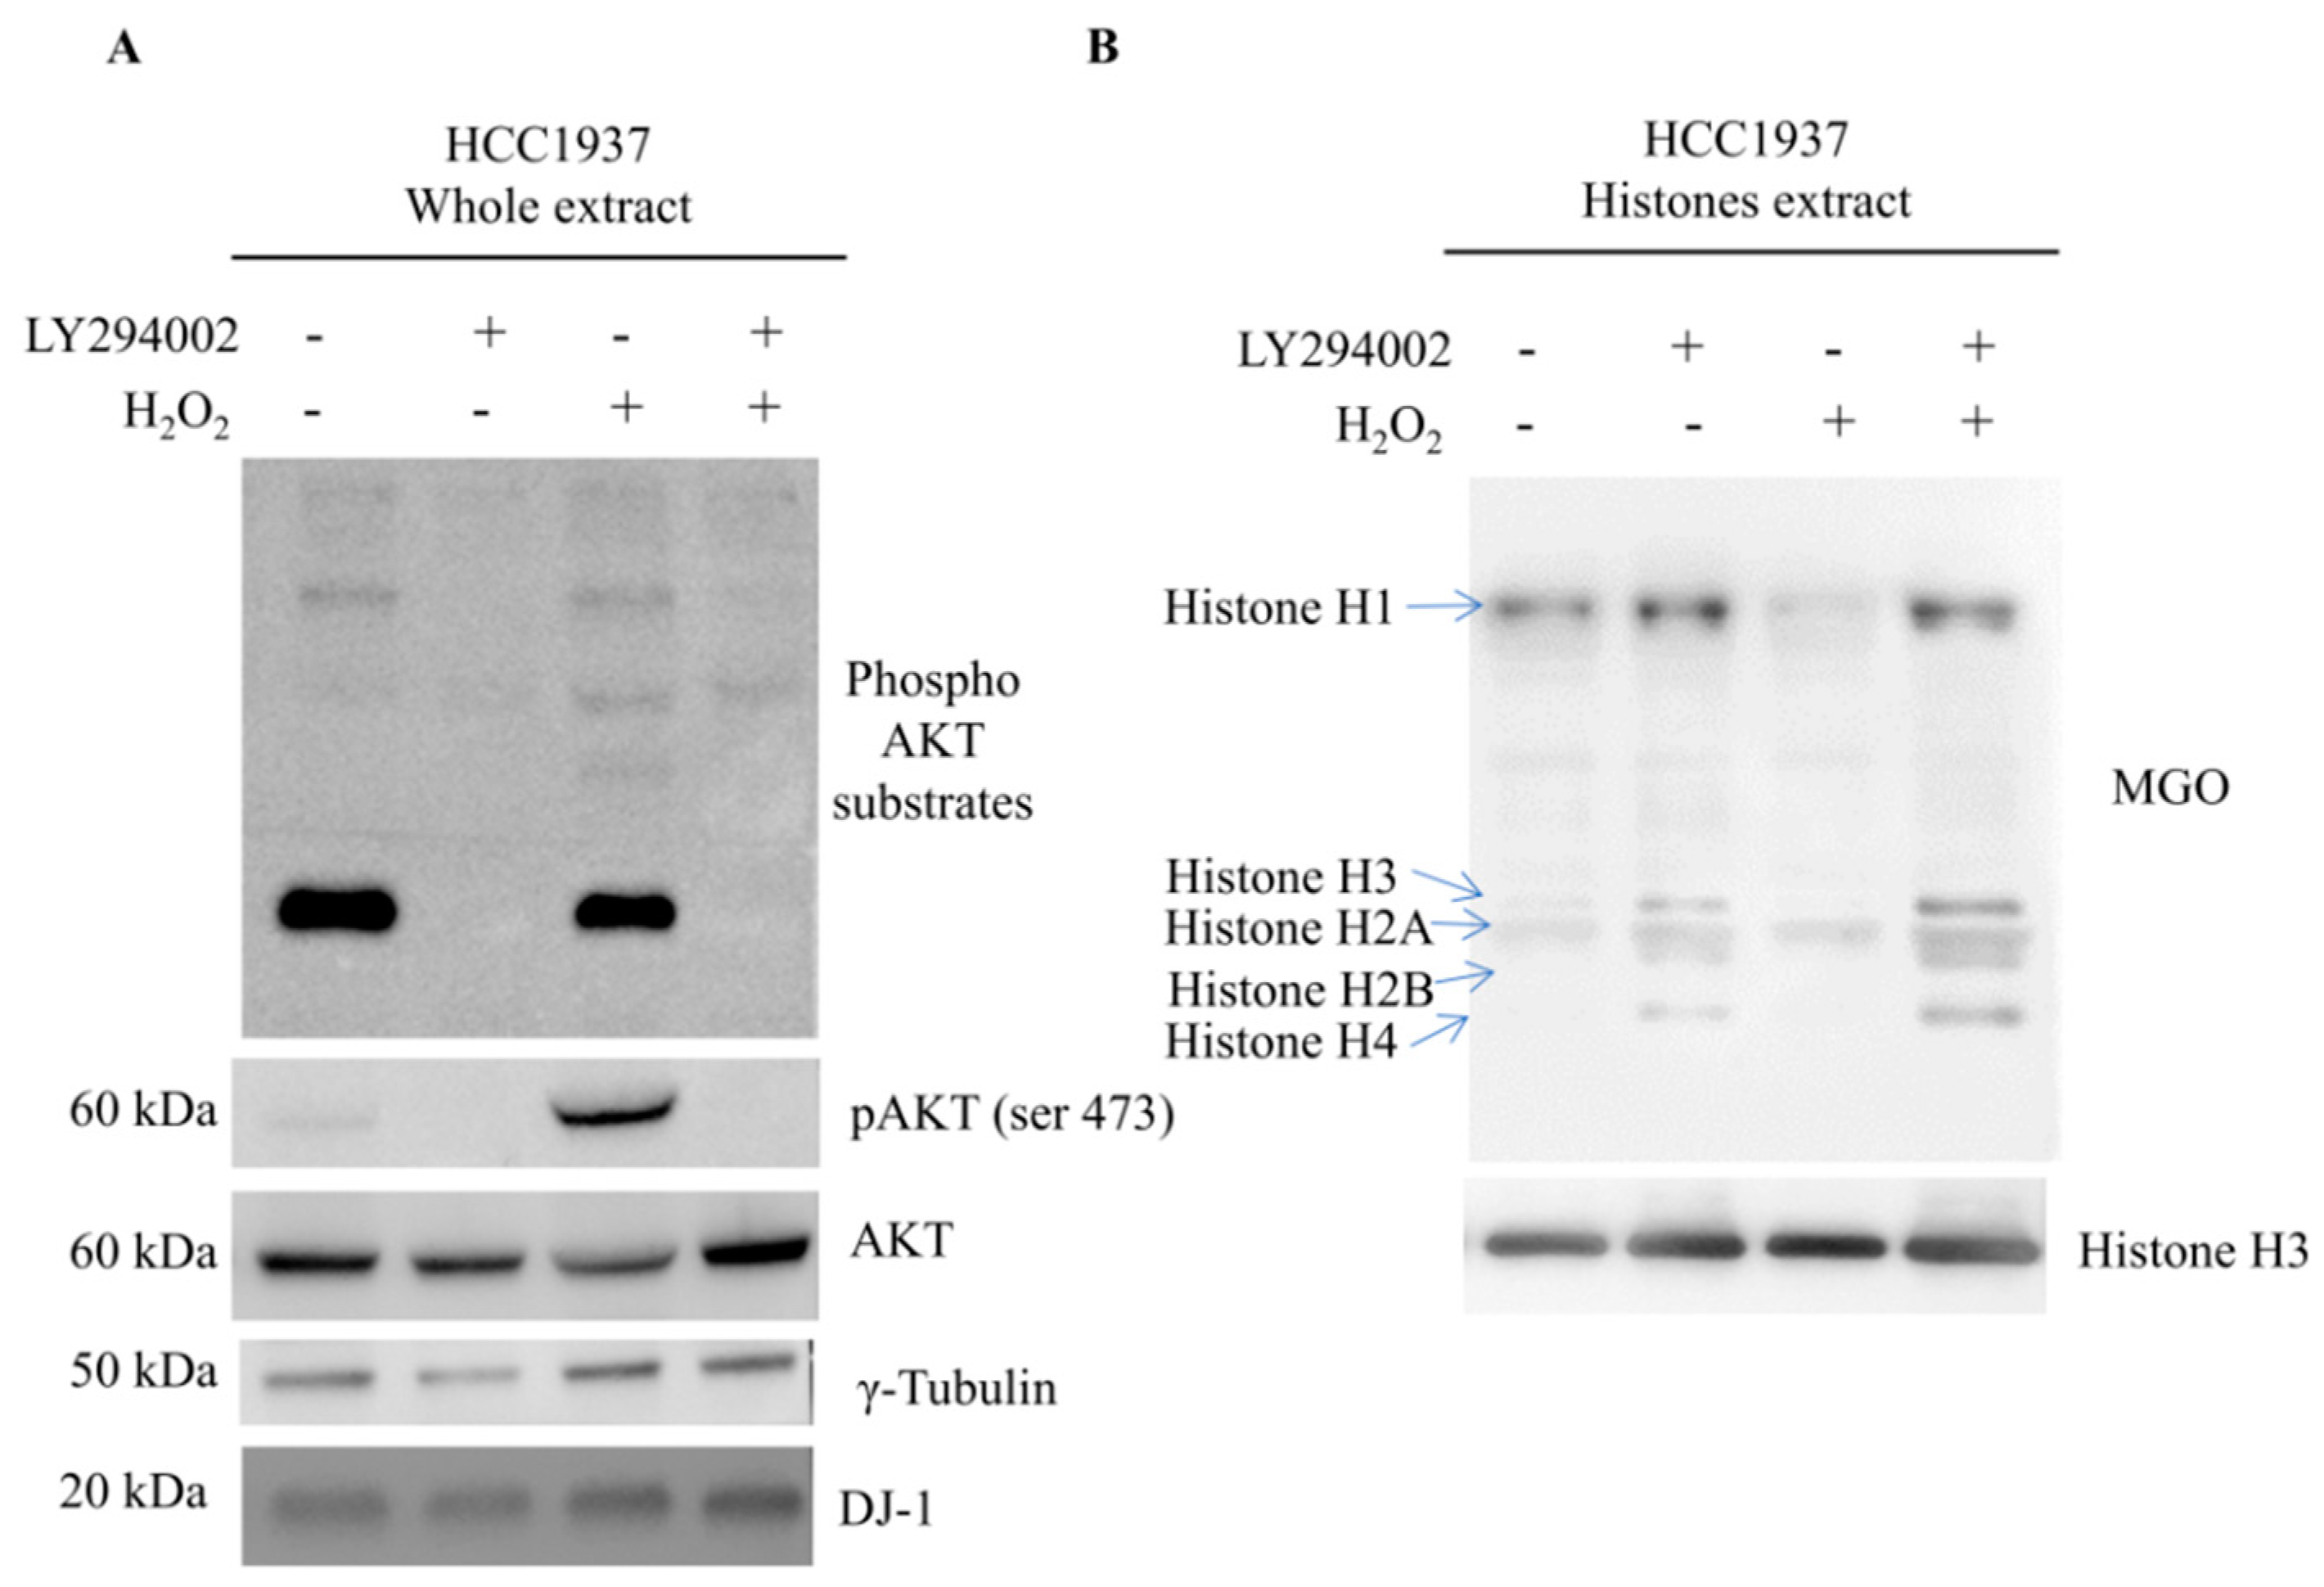
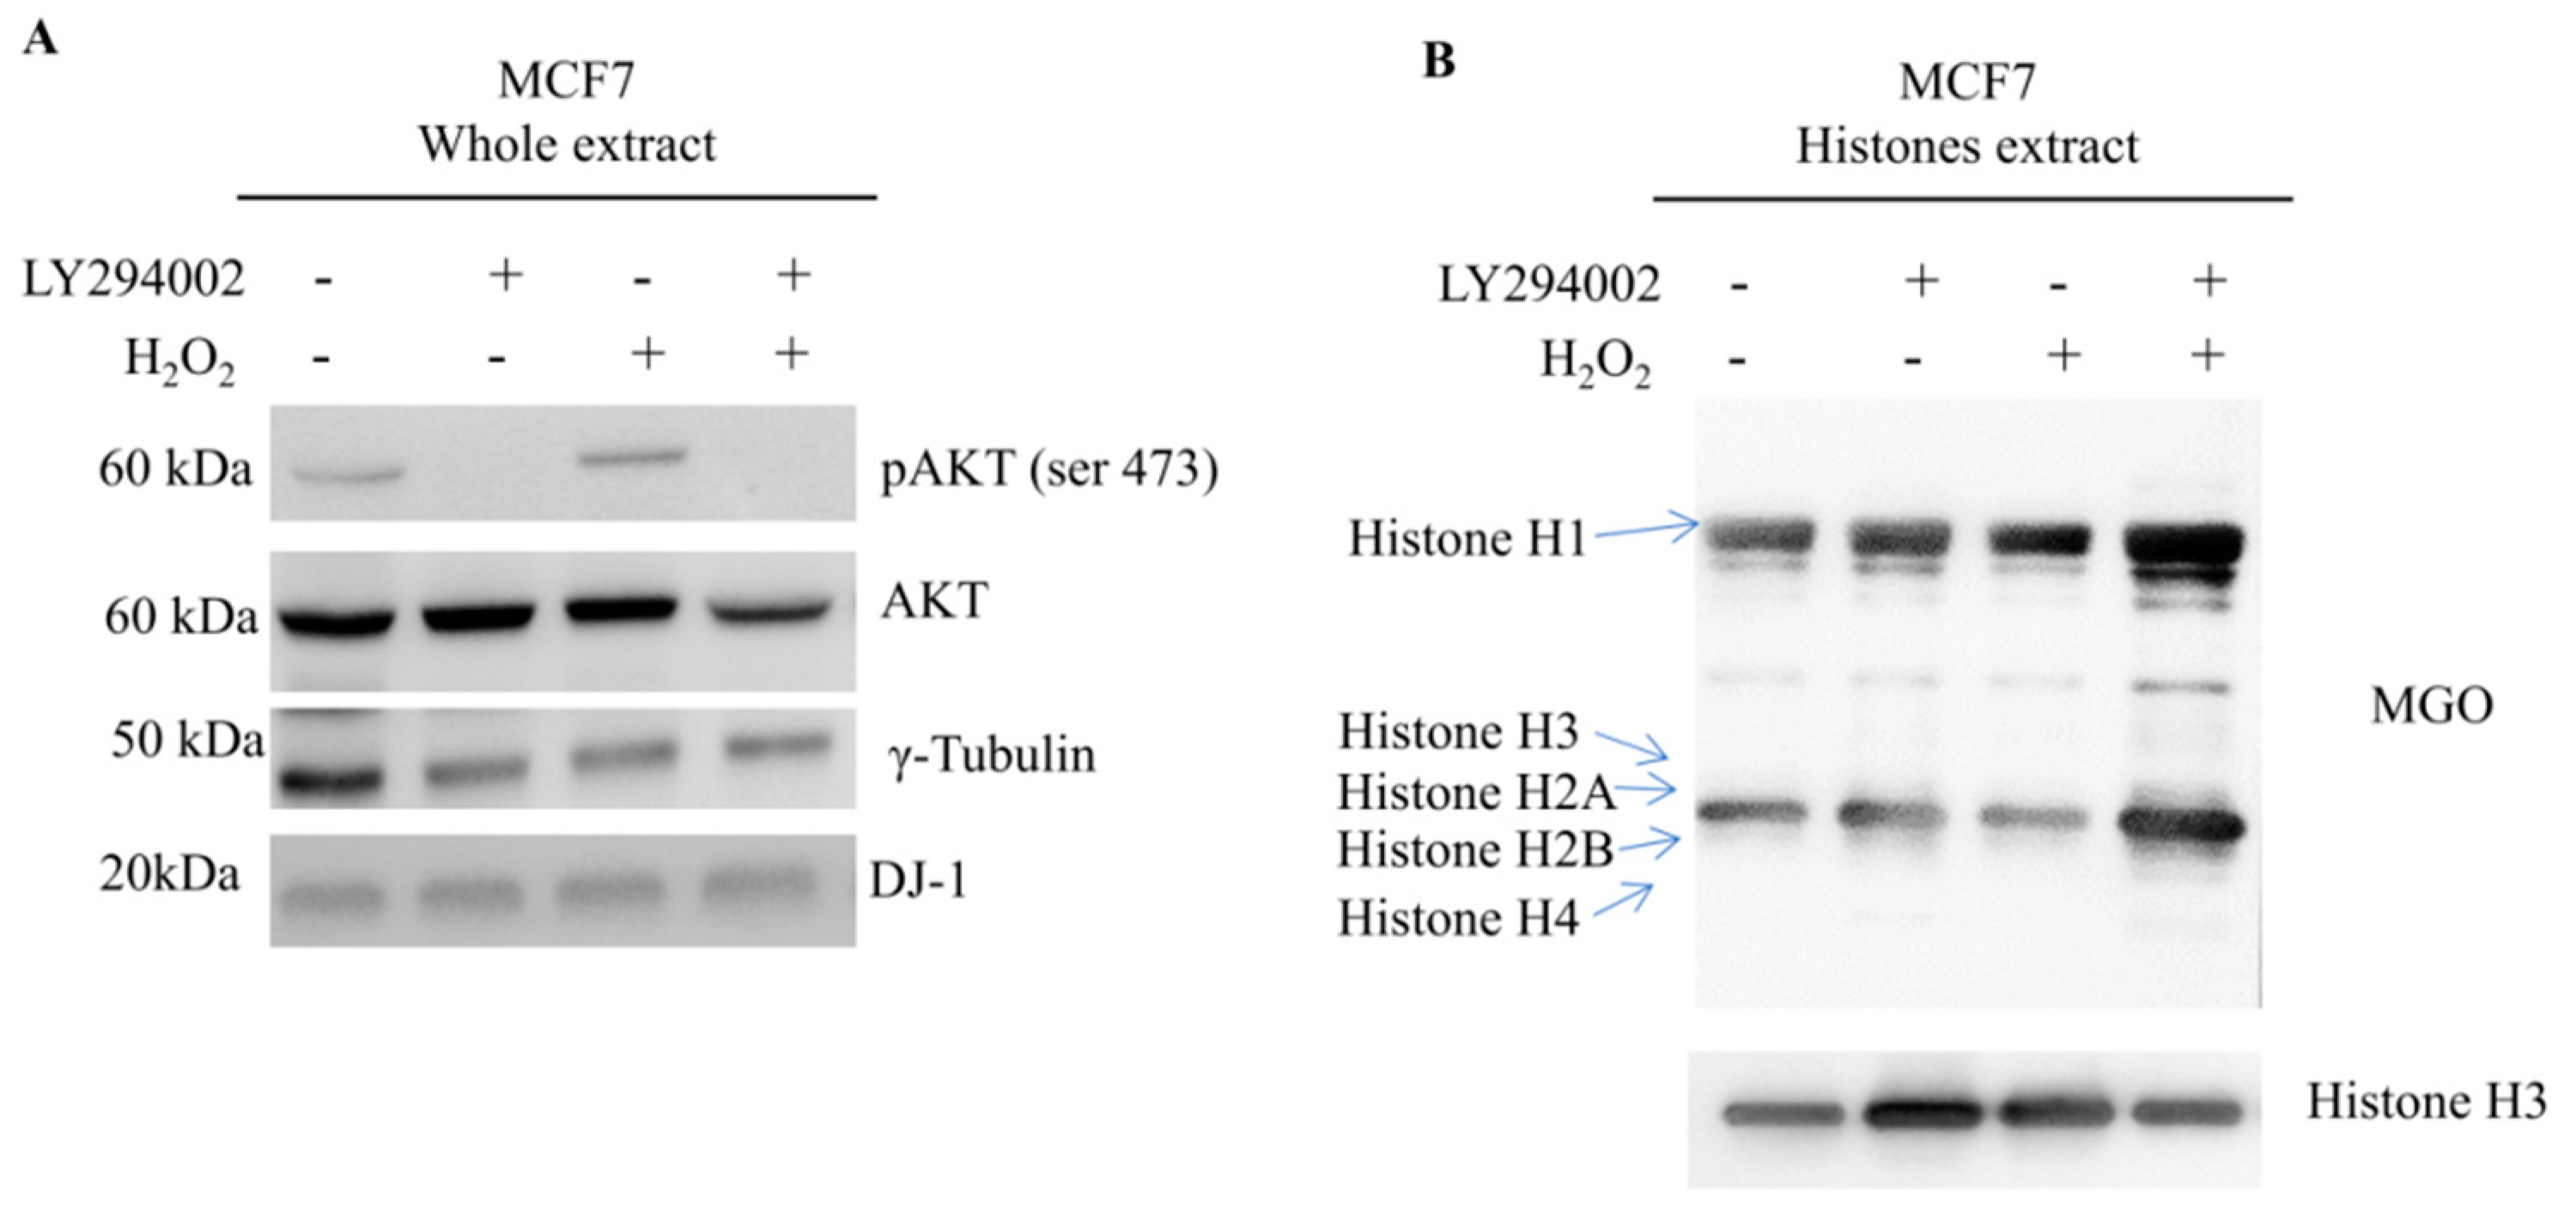
Mass spectrometry analysis of different breast cancer cell lines enabled the identification of several histone sites undergoing MGO adducts but without any specificity in terms of residues involved. However, by Western blot, quantitative differences became clear, being the amount of AGEs significantly higher in HCC1937 cells, a model of triple negative breast cancer (TNBC), therefore, with a direct correlation with glycolytic flux extent.
Several findings report DJ-1 as the main glyoxalase responsible for AGEs removal from histones, but they lack clarification of how this novel function integrates with the well-known DJ-1 antioxidant activity.
DJ-1 is functionally elusive, and it adds up protection of both normal and cancer cells from oxidative stress acting in the cytoplasm with the efficient removal of AGEs in the nucleus.
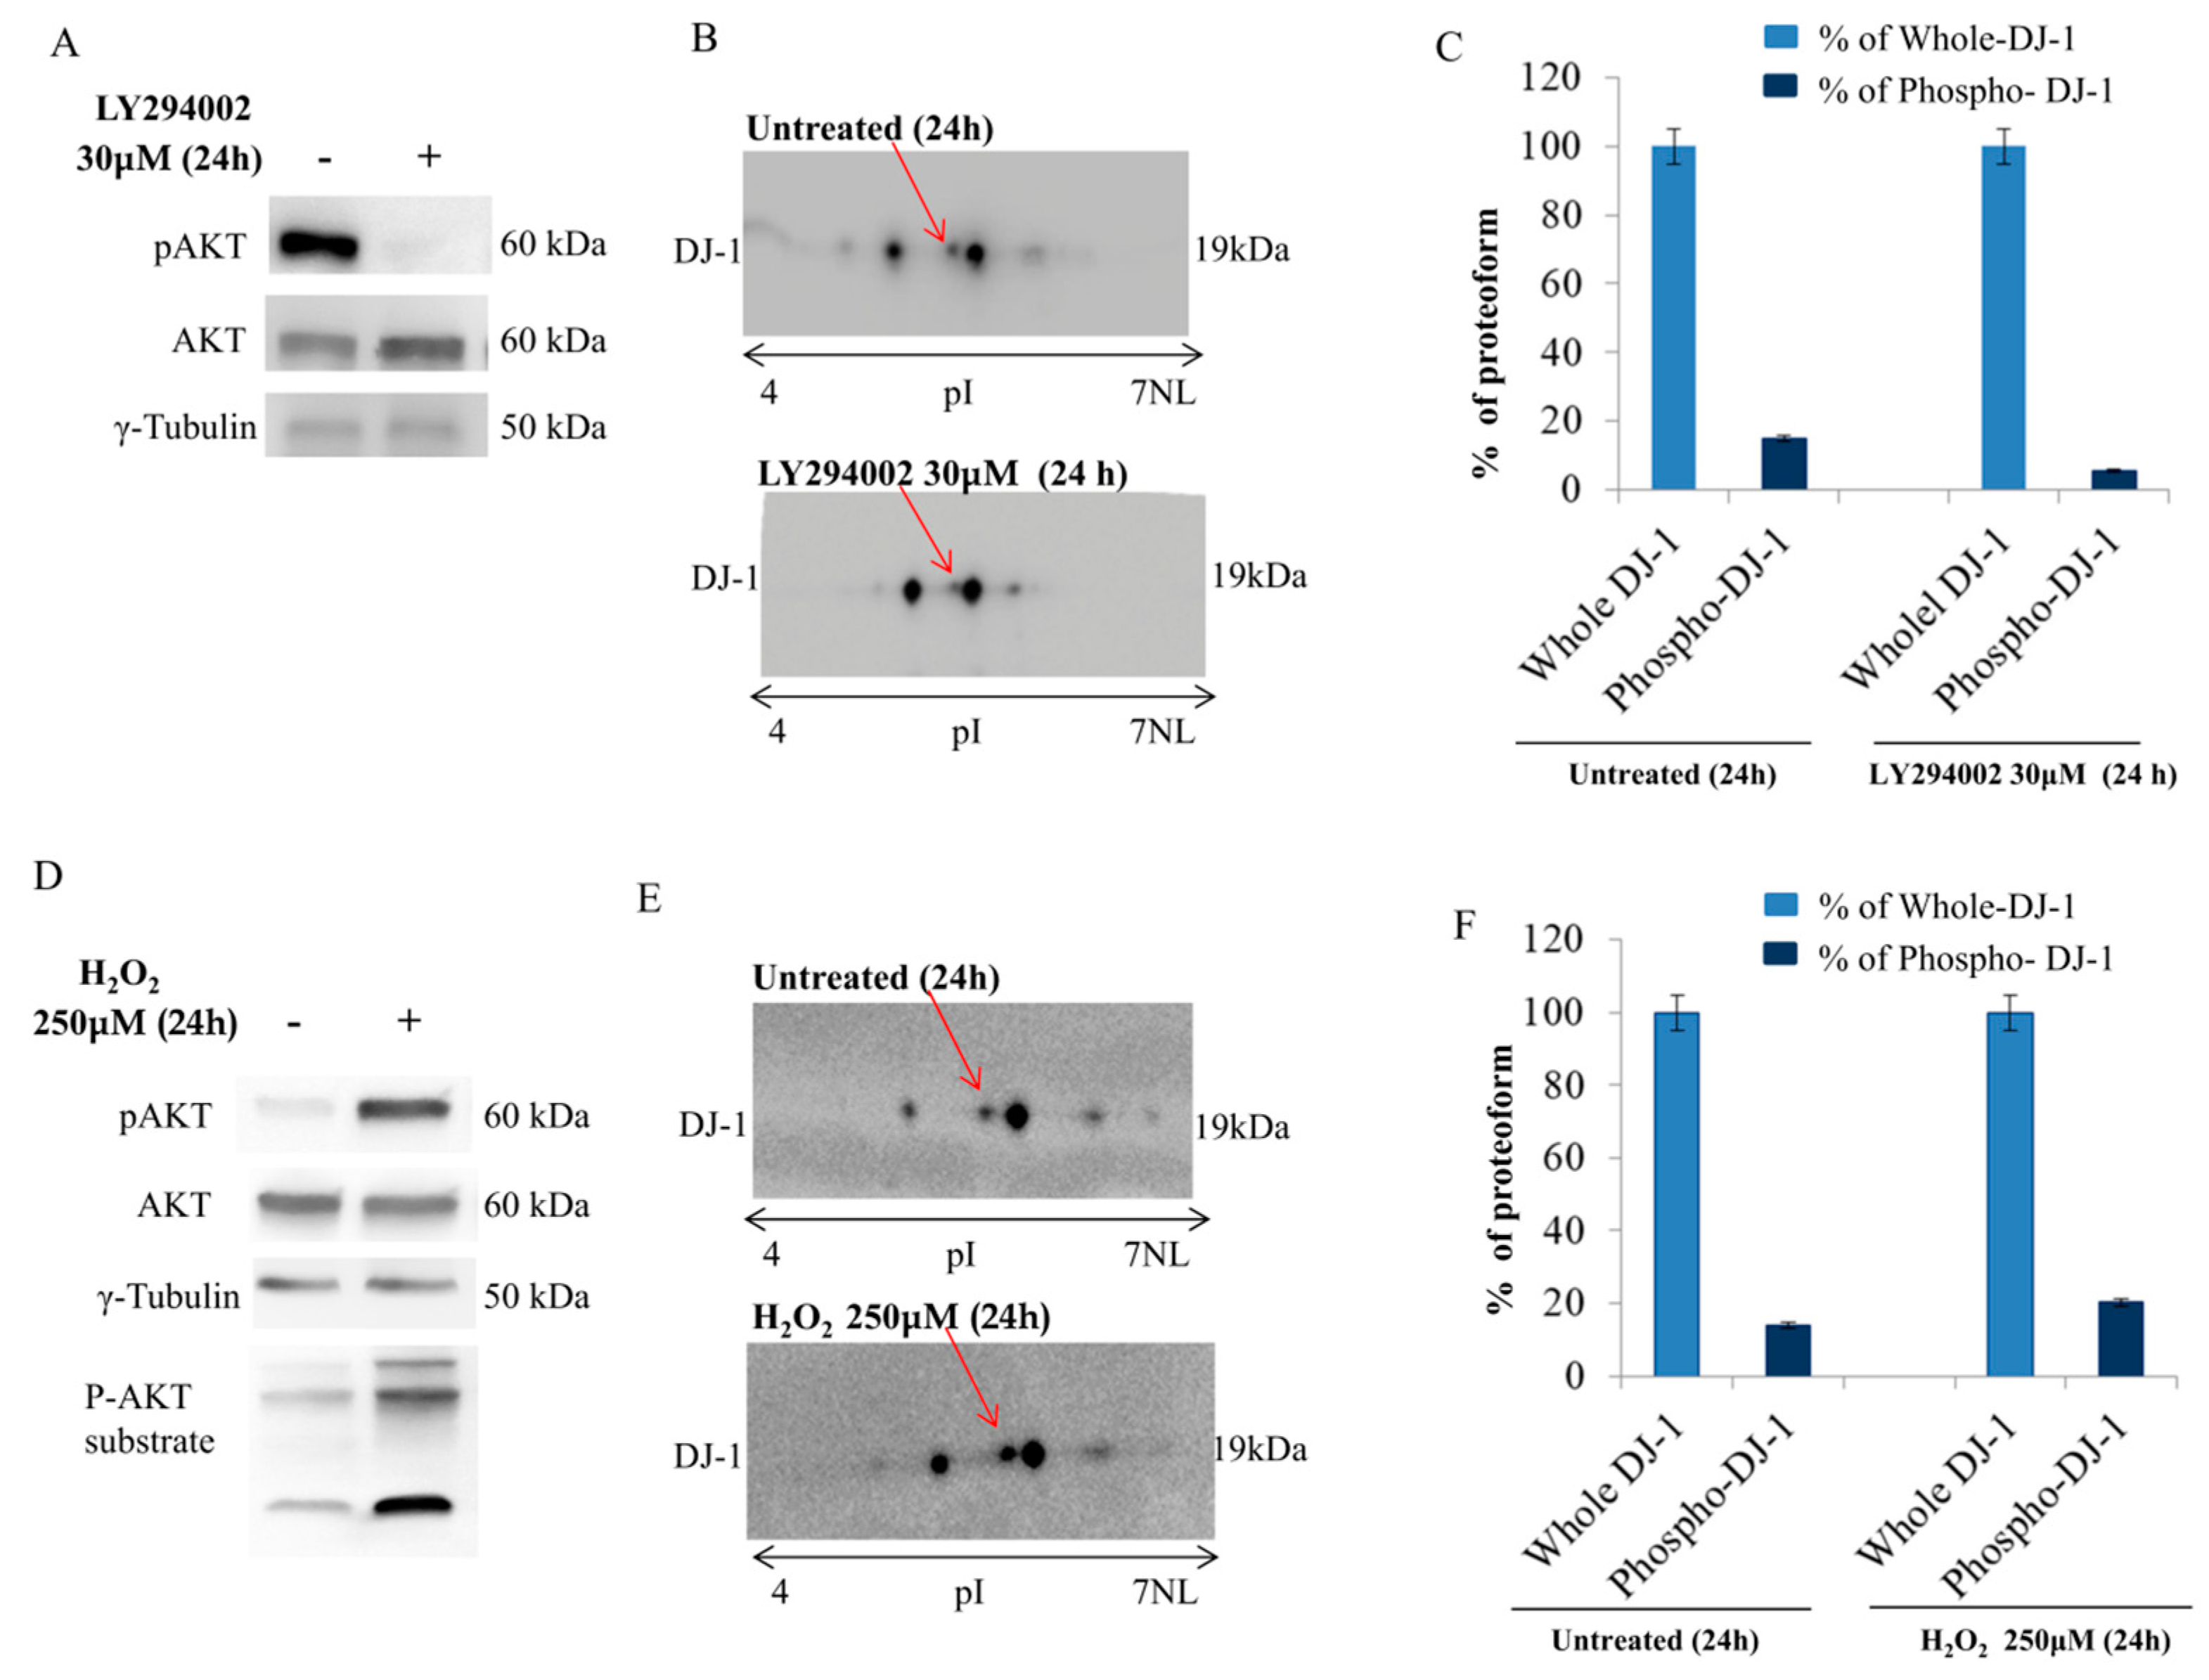
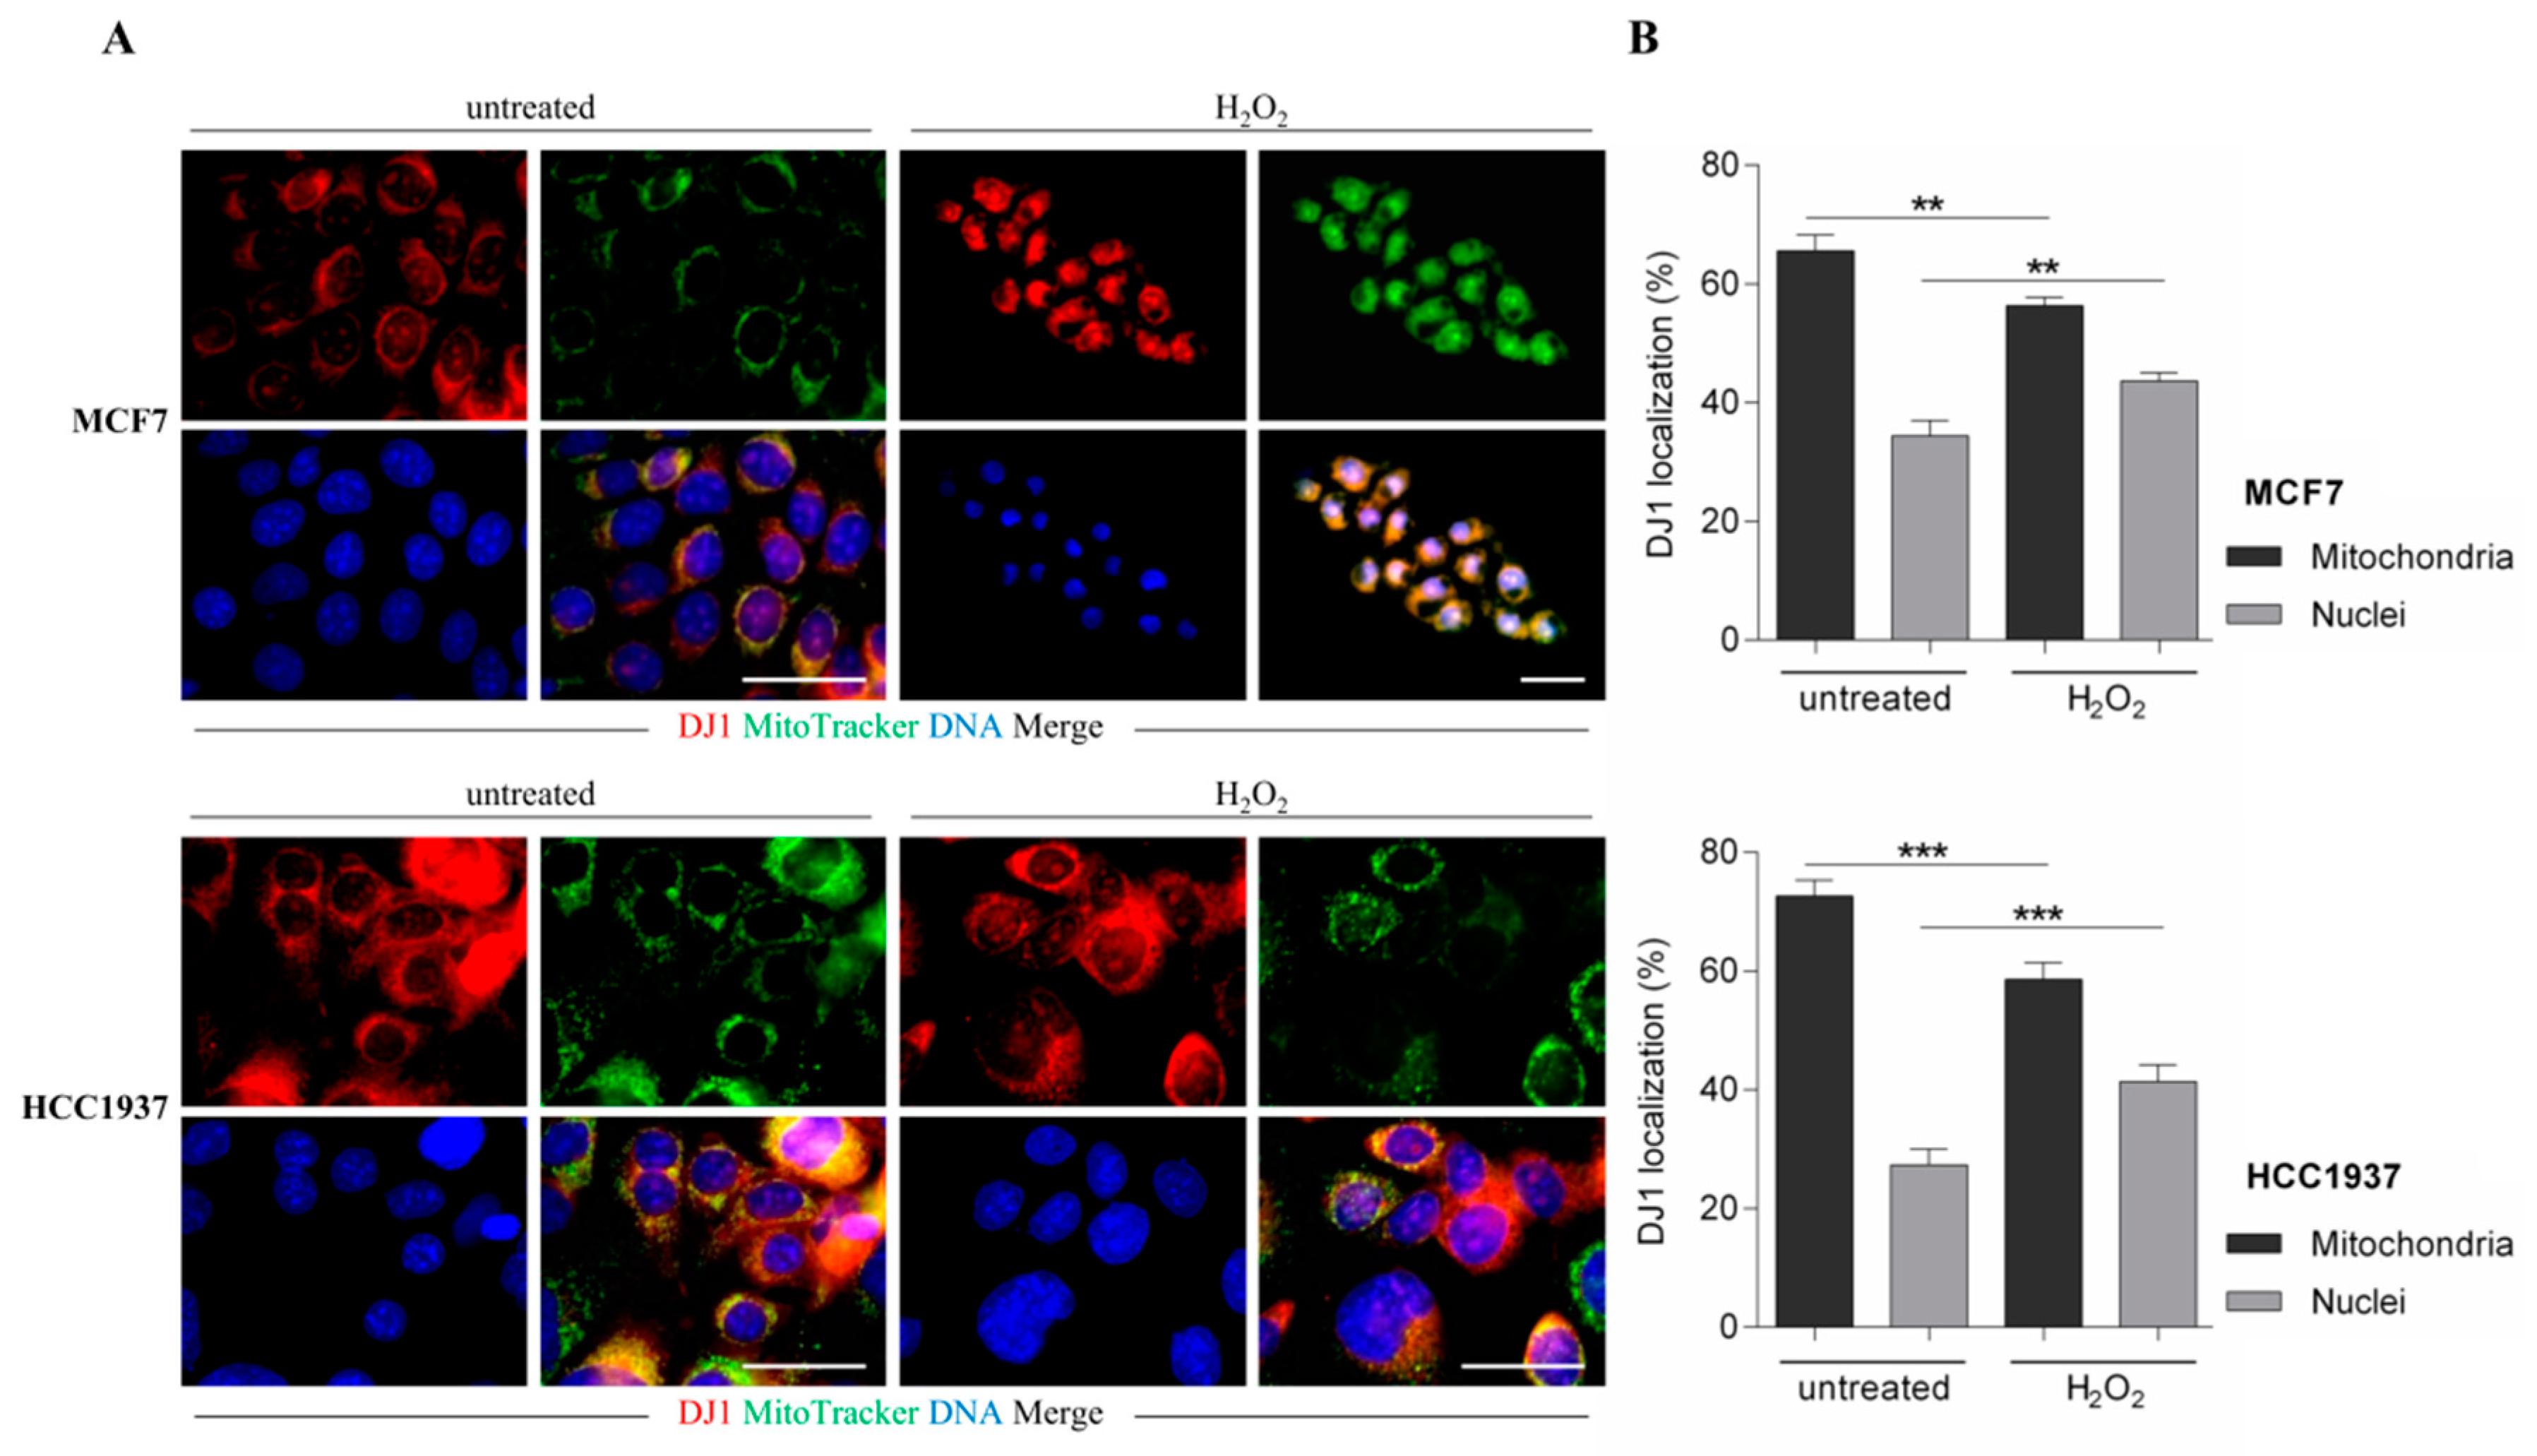
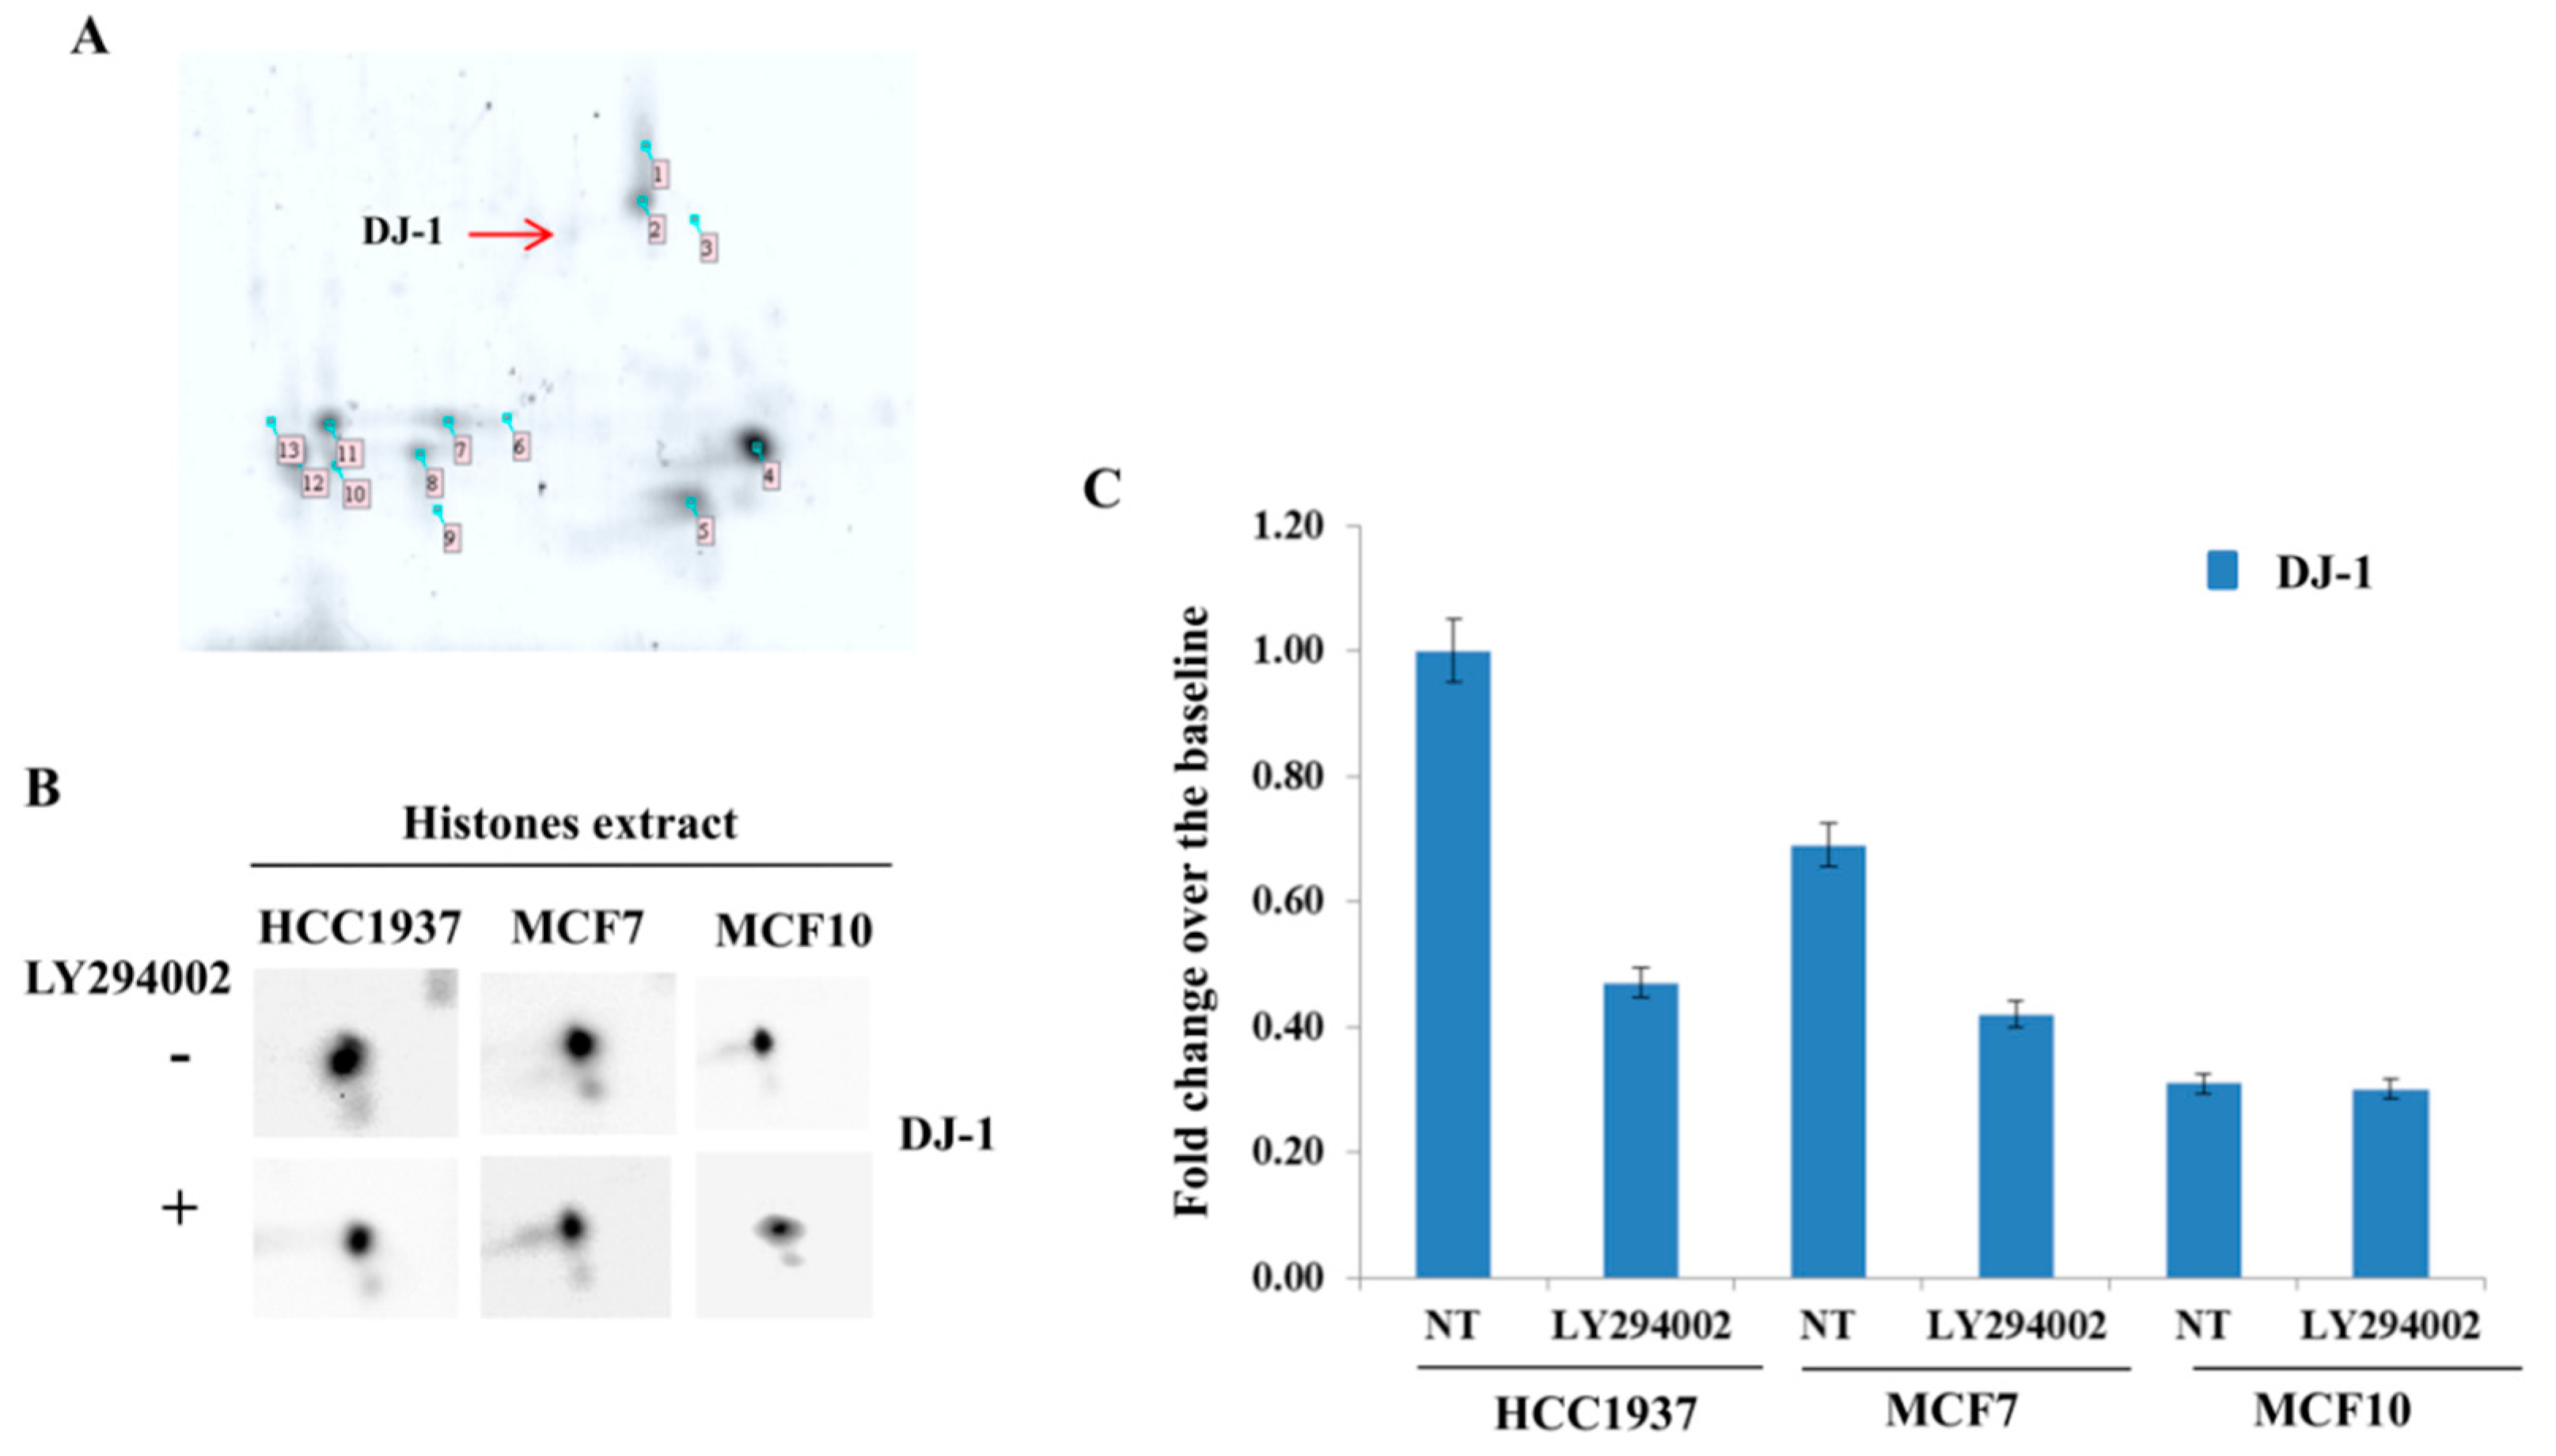
We provided here evidence of multiple DJ-1 proteoforms accountable for its different functions. We disclosed a novel proteoform that, according to our result, might be specifically capable of nuclear localization and AGEs removal from histones. Coupling 2D gel with mass spectrometry, we identified a novel phosphorylation on DJ-1 (threonine 125) in which expression level correlates with activation of a mitogenic pathway. The in-silico analysis of the DJ-1 sequence allows location of this phosphorylation within a consensus recognizable as putative substrates of Akt and immunoprecipitation experiments enforced the hypothesis of a DJ-1/Akt interaction. In addition, modulation of the Akt pathway correlates with DJ-1 nuclear localization and influences its proteoforms, inducing the loss and/or the gain of an acidic group in function of its inactivation or activation, respectively. In addition, a single DJ-1 proteoform seems able to interact with histones as DJ-1 associated with nucleosome appears in the 2D map as a single spot, accounting for the hypothesis that only Phospho-DJ-1 associates with histones. Once again, a modulation of the Akt pathway correlates with levels of phospho-DJ-1 associated with the nucleosome.
The novel site of phosphorylation is the threonine 125. It is adjacent to histidine 126 and then very close to the catalytic triad of the glyoxalase enzymatic site. The activity of DJ-1 glyoxalase implies three key amino acids, Glu18, Cys106, and His126, working in a catalytic pocket similarly to a cysteine protease. Taking into account literature data [
54] the antioxidant and the glyoxalase activity seems not coexisting but largely related to compartmentalization and to the cellular functional status. It is implausible that DJ-1 acts widely as a glyoxalase since it should have a constitutive pro-survival role, indiscriminately working as a cysteine protease in every one cellular compartment.
Much more likely, phosphorylation on thr125 might account for nuclear localization and activation of DJ-1 glyoxalase by inducing a molecular rearrangement of the active site. On the catalytic site, thr125 phosphorylation elicits a conformational change that destabilizes the enzymatic pocket and increases the reactivity of the molecules. Data we presented here, although not conclusive, strongly enforce that hypothesis. The enhancement of enzymatic activity is supported by the finding that in cells showing high levels of Phospho-DJ-1, a decrease of MGO adducts on histones isoforms has been detected, as well. Indeed, AGEs on histones isoforms, increase after Akt inhibition by LY294002 treatment. It means that the inhibition of the Akt does not allow the activation of DJ-1 glyoxalase, very likely because of lack of threonine phosphorylation.
Our data propose a model in which DJ-1 might have a dual role. It is ubiquitously expressed and acts as a redox-sensitive chaperone and as a sensor for oxidative stress. Upon activation of the Akt pathway, it undergoes phosphorylation, translocates into the nucleus where DJ-1 is detectable only as phosphorylated proteoform, and becomes an active glyoxalase removing from histones the AGEs, formed because of augmented glycolytic flux. This mechanism preserving histones code favors malignant cells integrity and sustains survival.
5. Conclusions
This work provides new insights into DJ-1 proteoforms and how they might act within the program that cancer cells execute to escape aging and preserve survival.
The formations of AGEs products on histones proteins are associated with degenerative pathologies mostly by the deconstruction of histones code that leads to early aging and, ultimately, cells death.
The switching of cancer cells to glycolysis increasing MGO concentrations and then AGEs should be a pro-death event. However, in cancer cells, especially breast cancer cells, rewiring their metabolism increases aggressiveness and improves their capability to survive in very hard conditions.
In this scenario, the elucidation of mechanism that allows cancer cells to counteract AGEs formation, primarily the deglycating activity of DJ-1, might be determinant for defining novel therapeutical approaches. Considering the central role that DJ-1 fulfills, as antioxidant agents, ubiquitously expressed, its direct inhibition might result in a backfire. The mapping of DJ-1 proteoforms and their functional characterization is crucial for the definition of novel molecular targets. Our work gives a substantial contribution to the hypothesis of precisely target deglycase activity of DJ-1 preserving its antioxidant activity.
Overall, we depicted a strategy that cancer cells elicit to overcome aging and preserve their immortality, disclosing a novel therapeutic target and pointing out to the notion that the modulation of specific DJ-1 function might produce substantial anticancer effects.
