Toxicoproteomic Profiling of hPXR Transgenic Mice Treated with Rifampicin and Isoniazid

 , and
, and 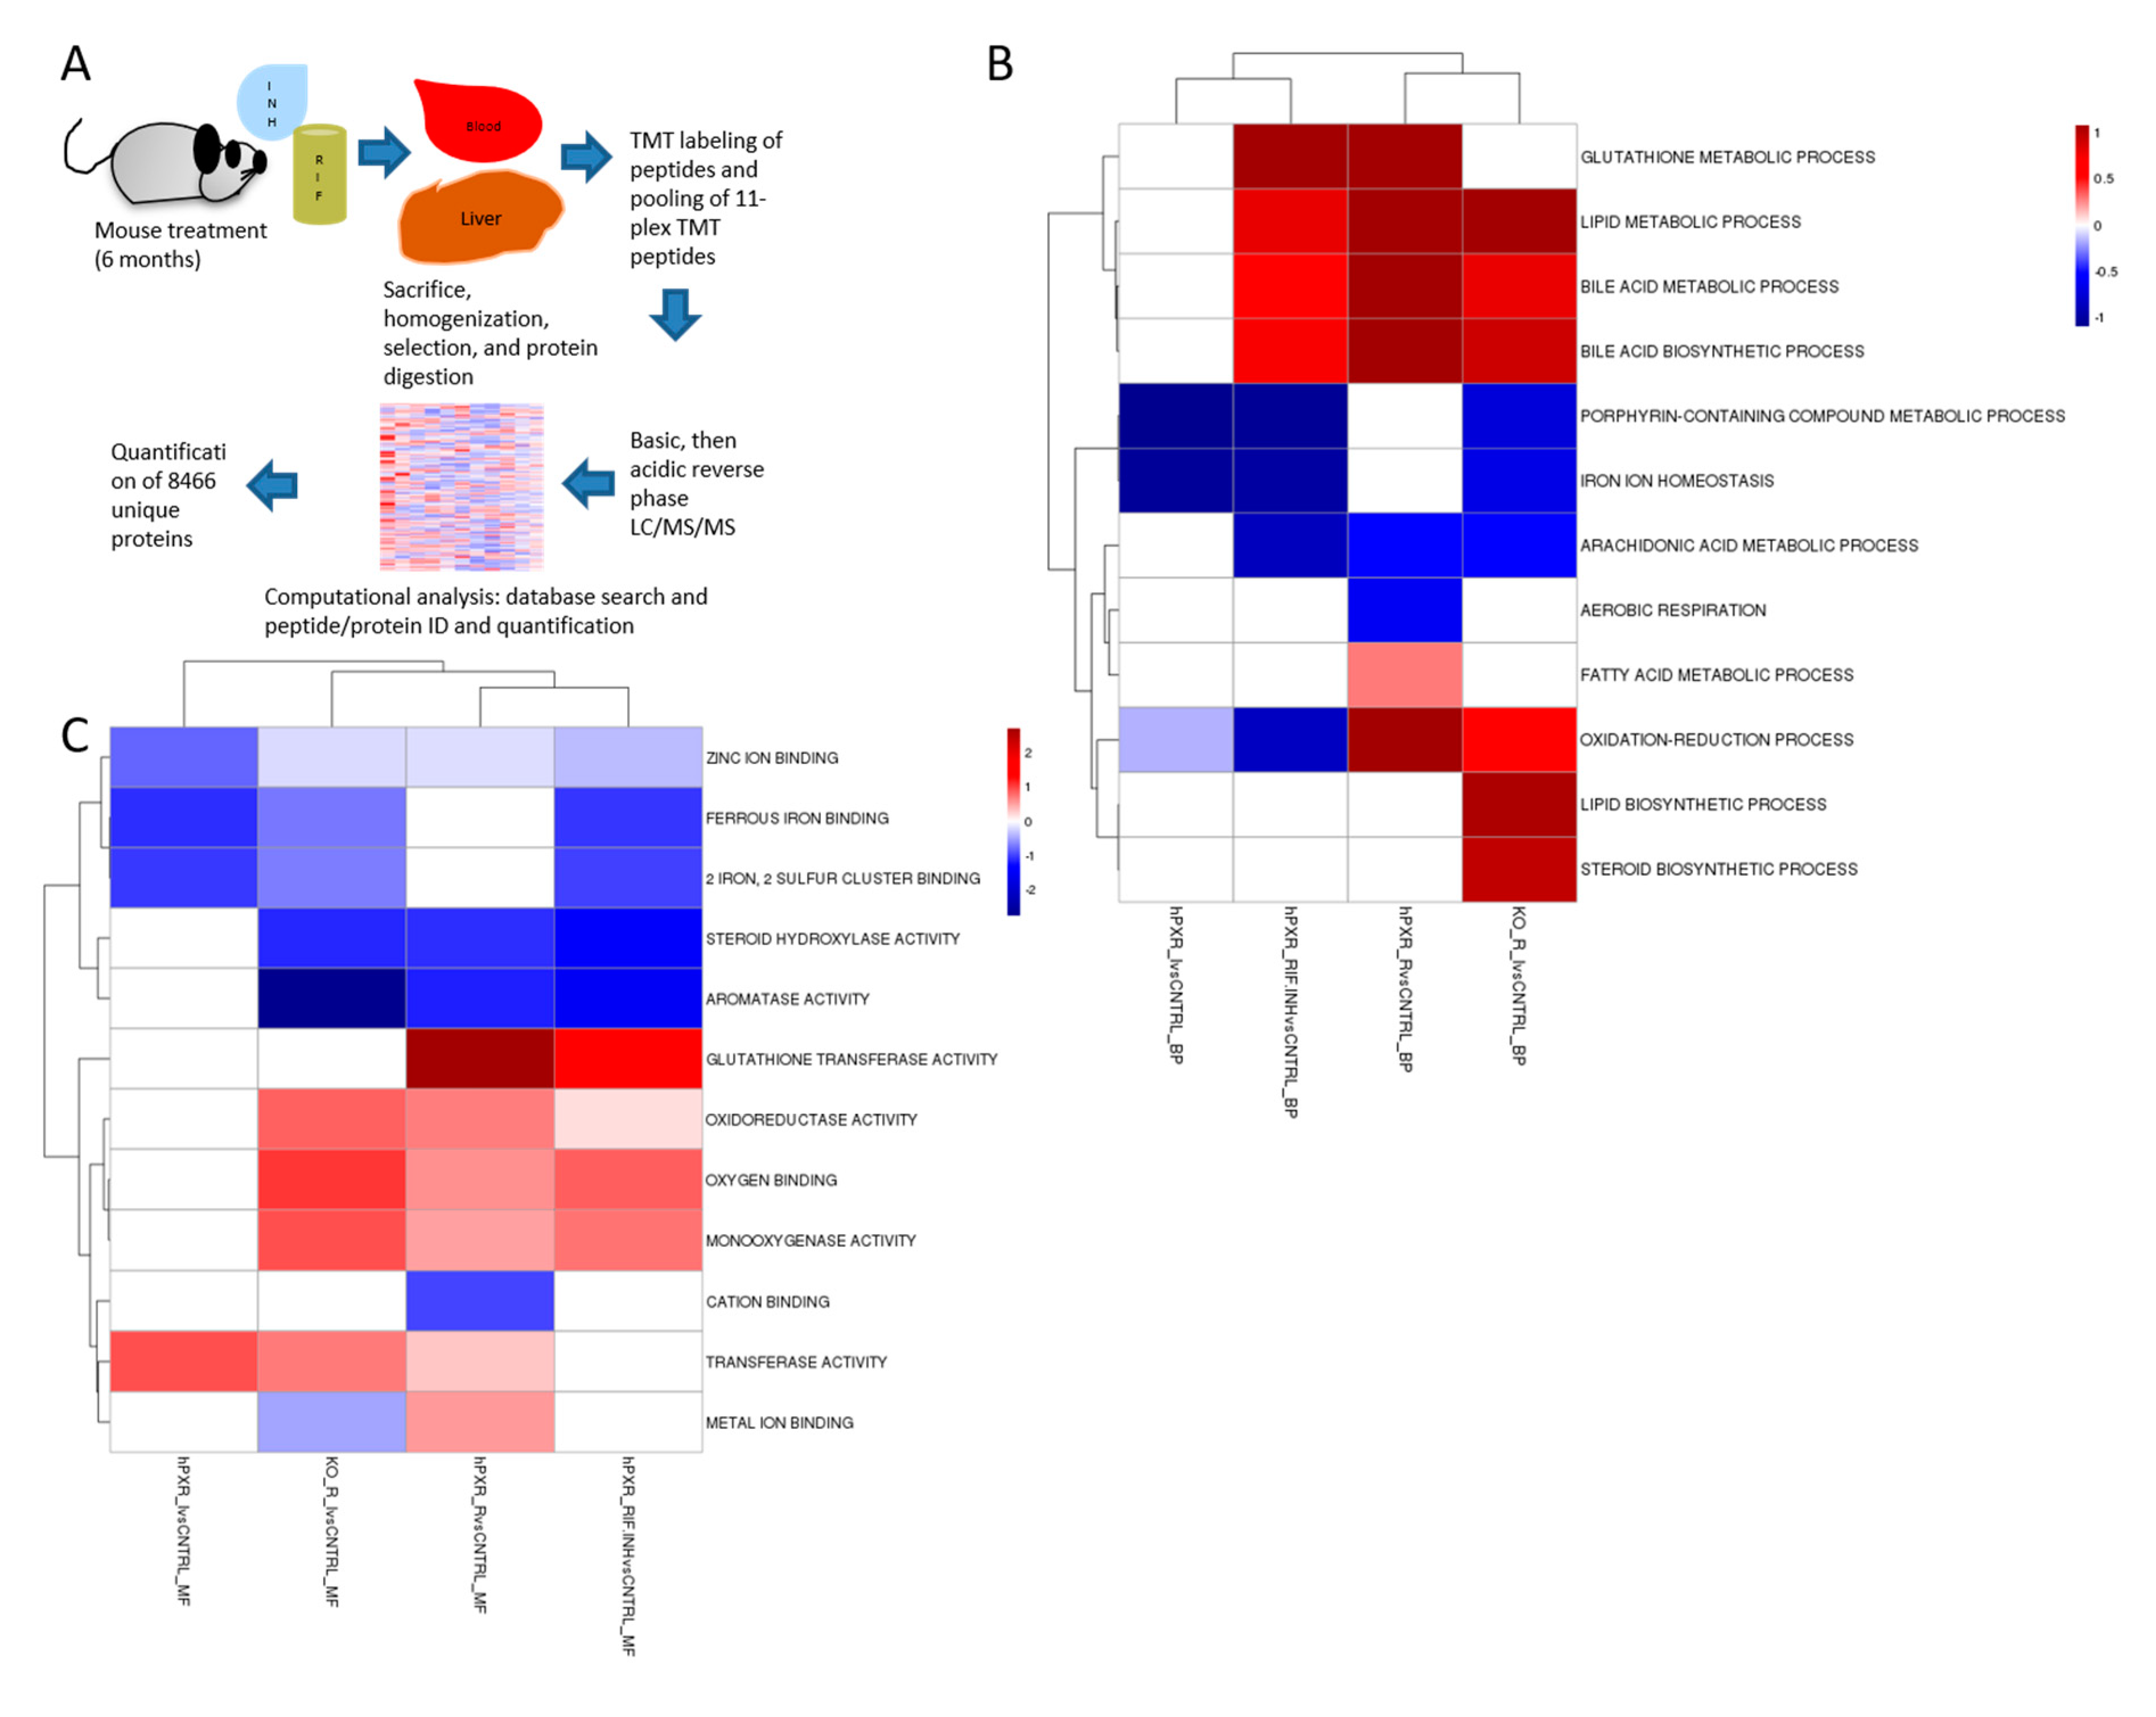
Abstract
1. Introduction
2. Materials and Methods
2.1. Reagents
2.2. Antibodies
2.3. Mice
2.4. Immunoblot Analysis
2.5. Proteomic Profiling
2.6. Statistical Analysis
3. Results
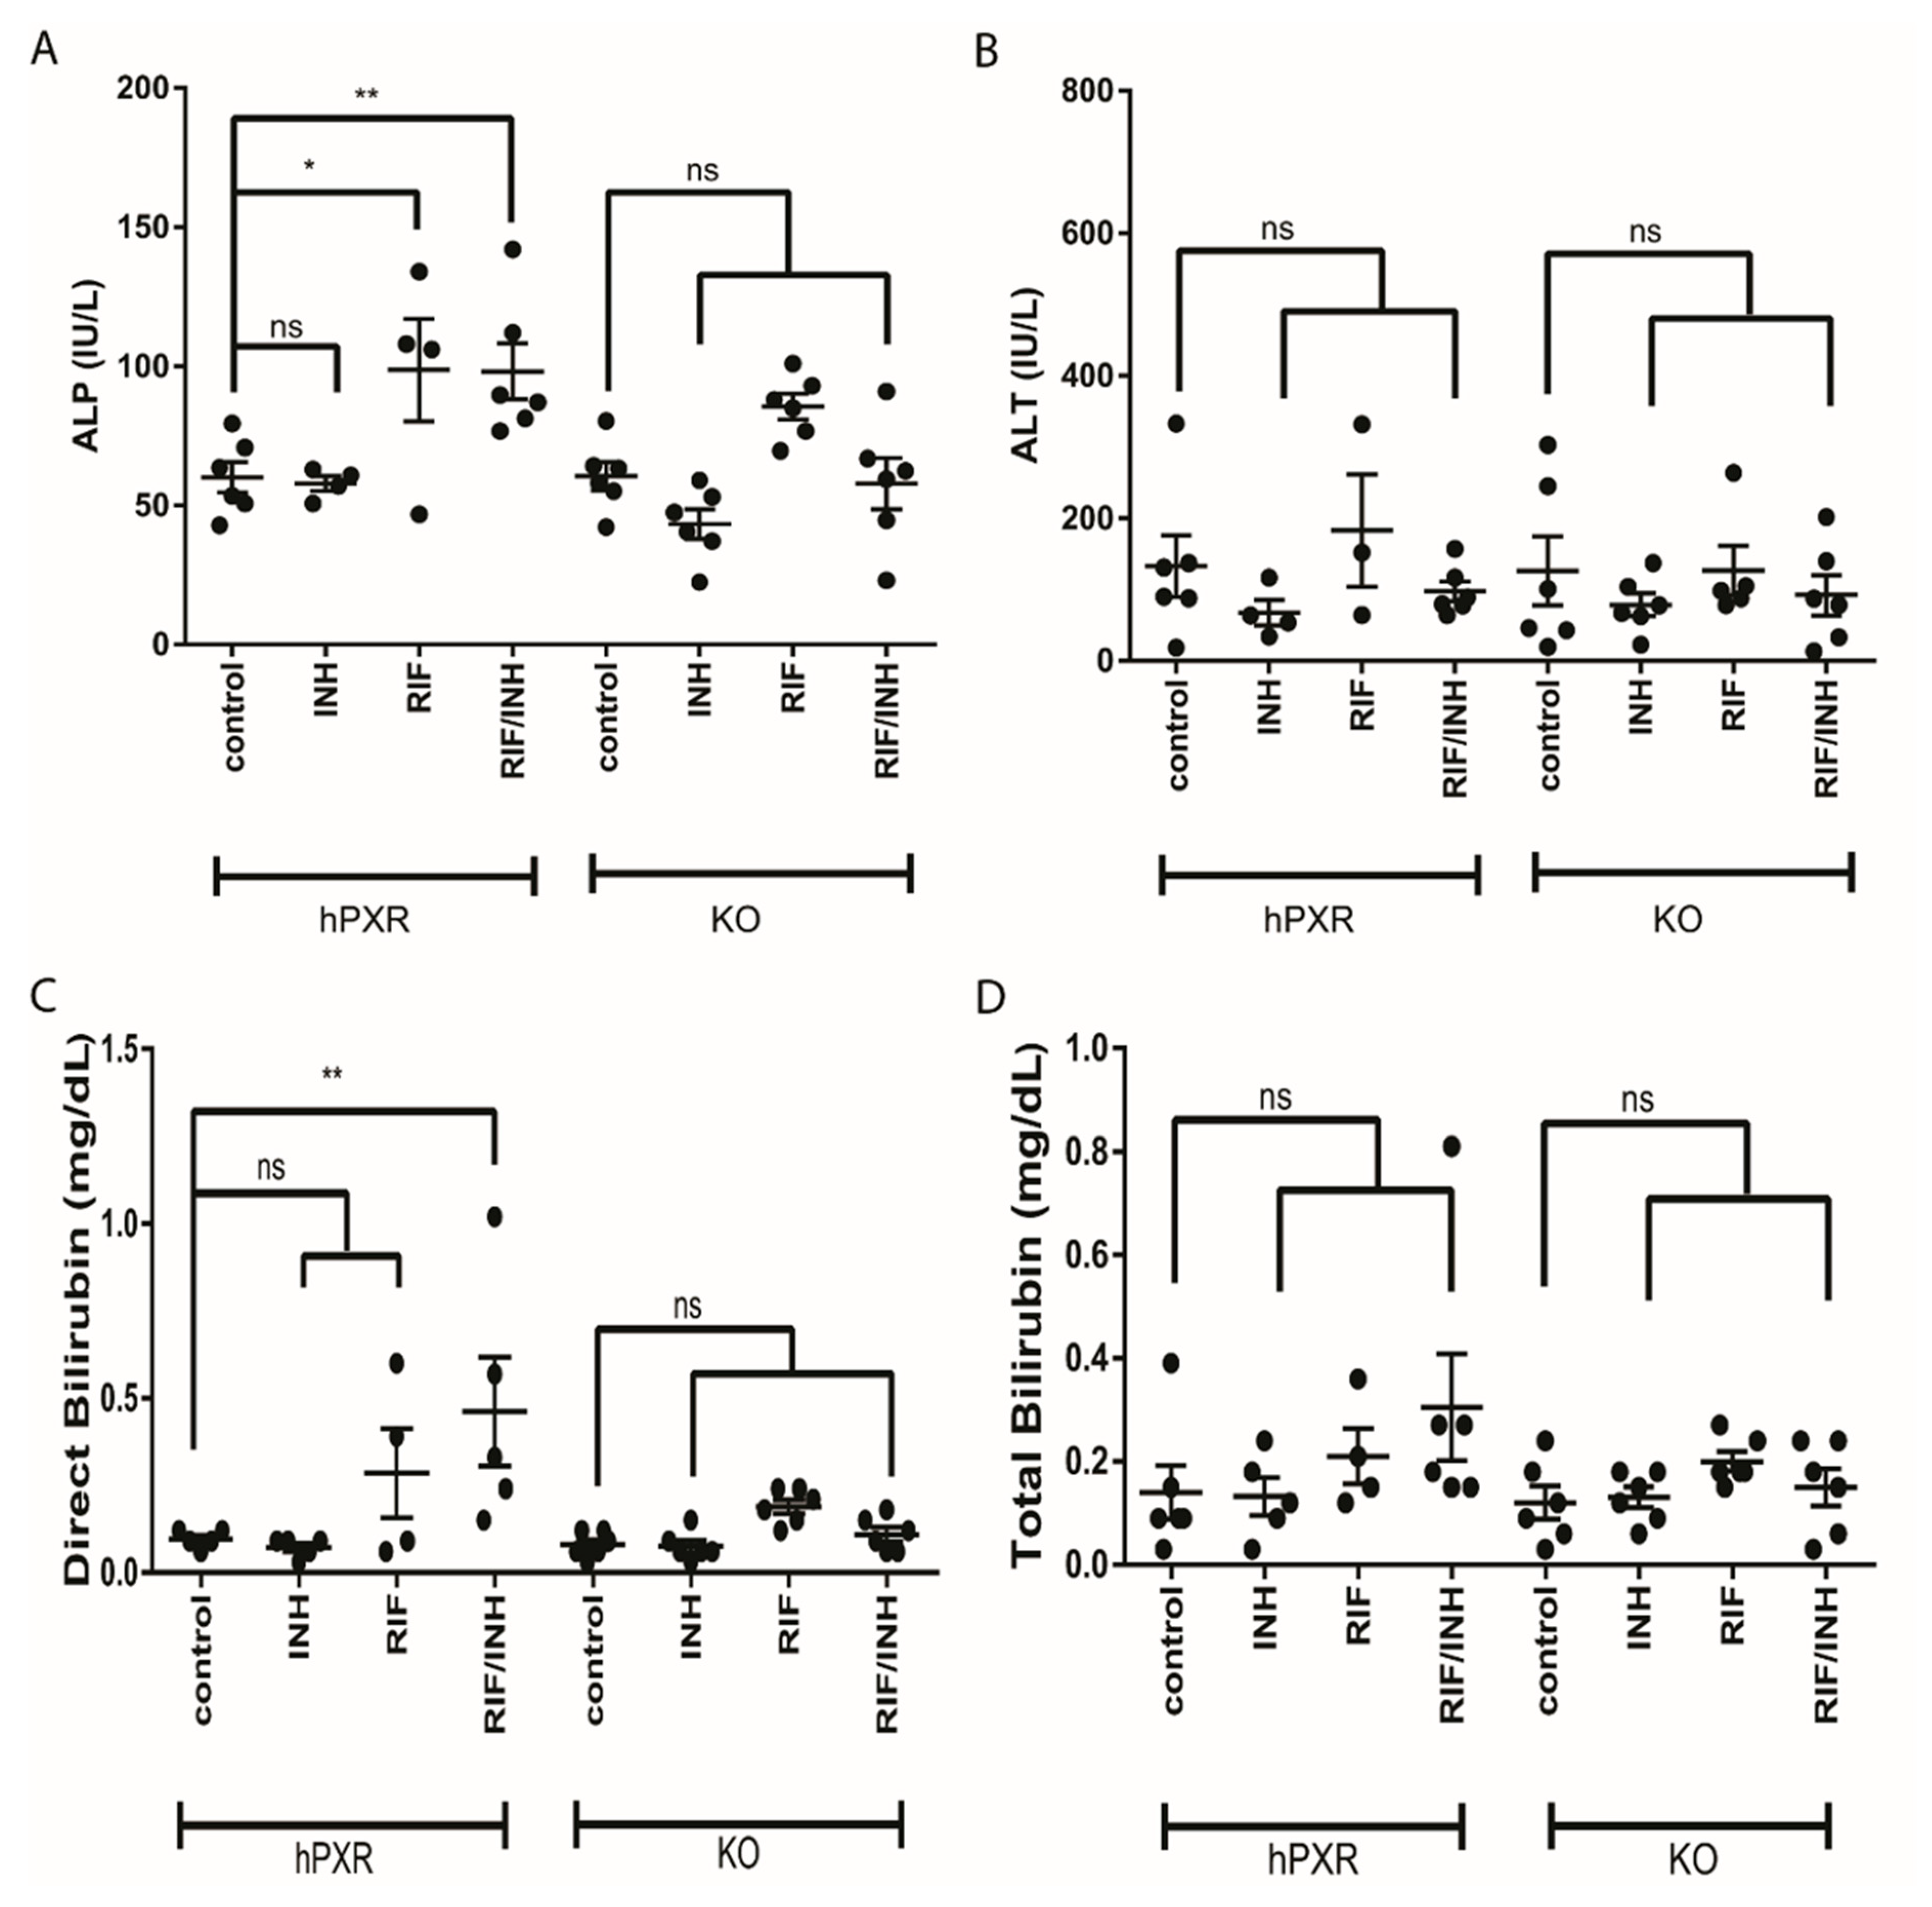
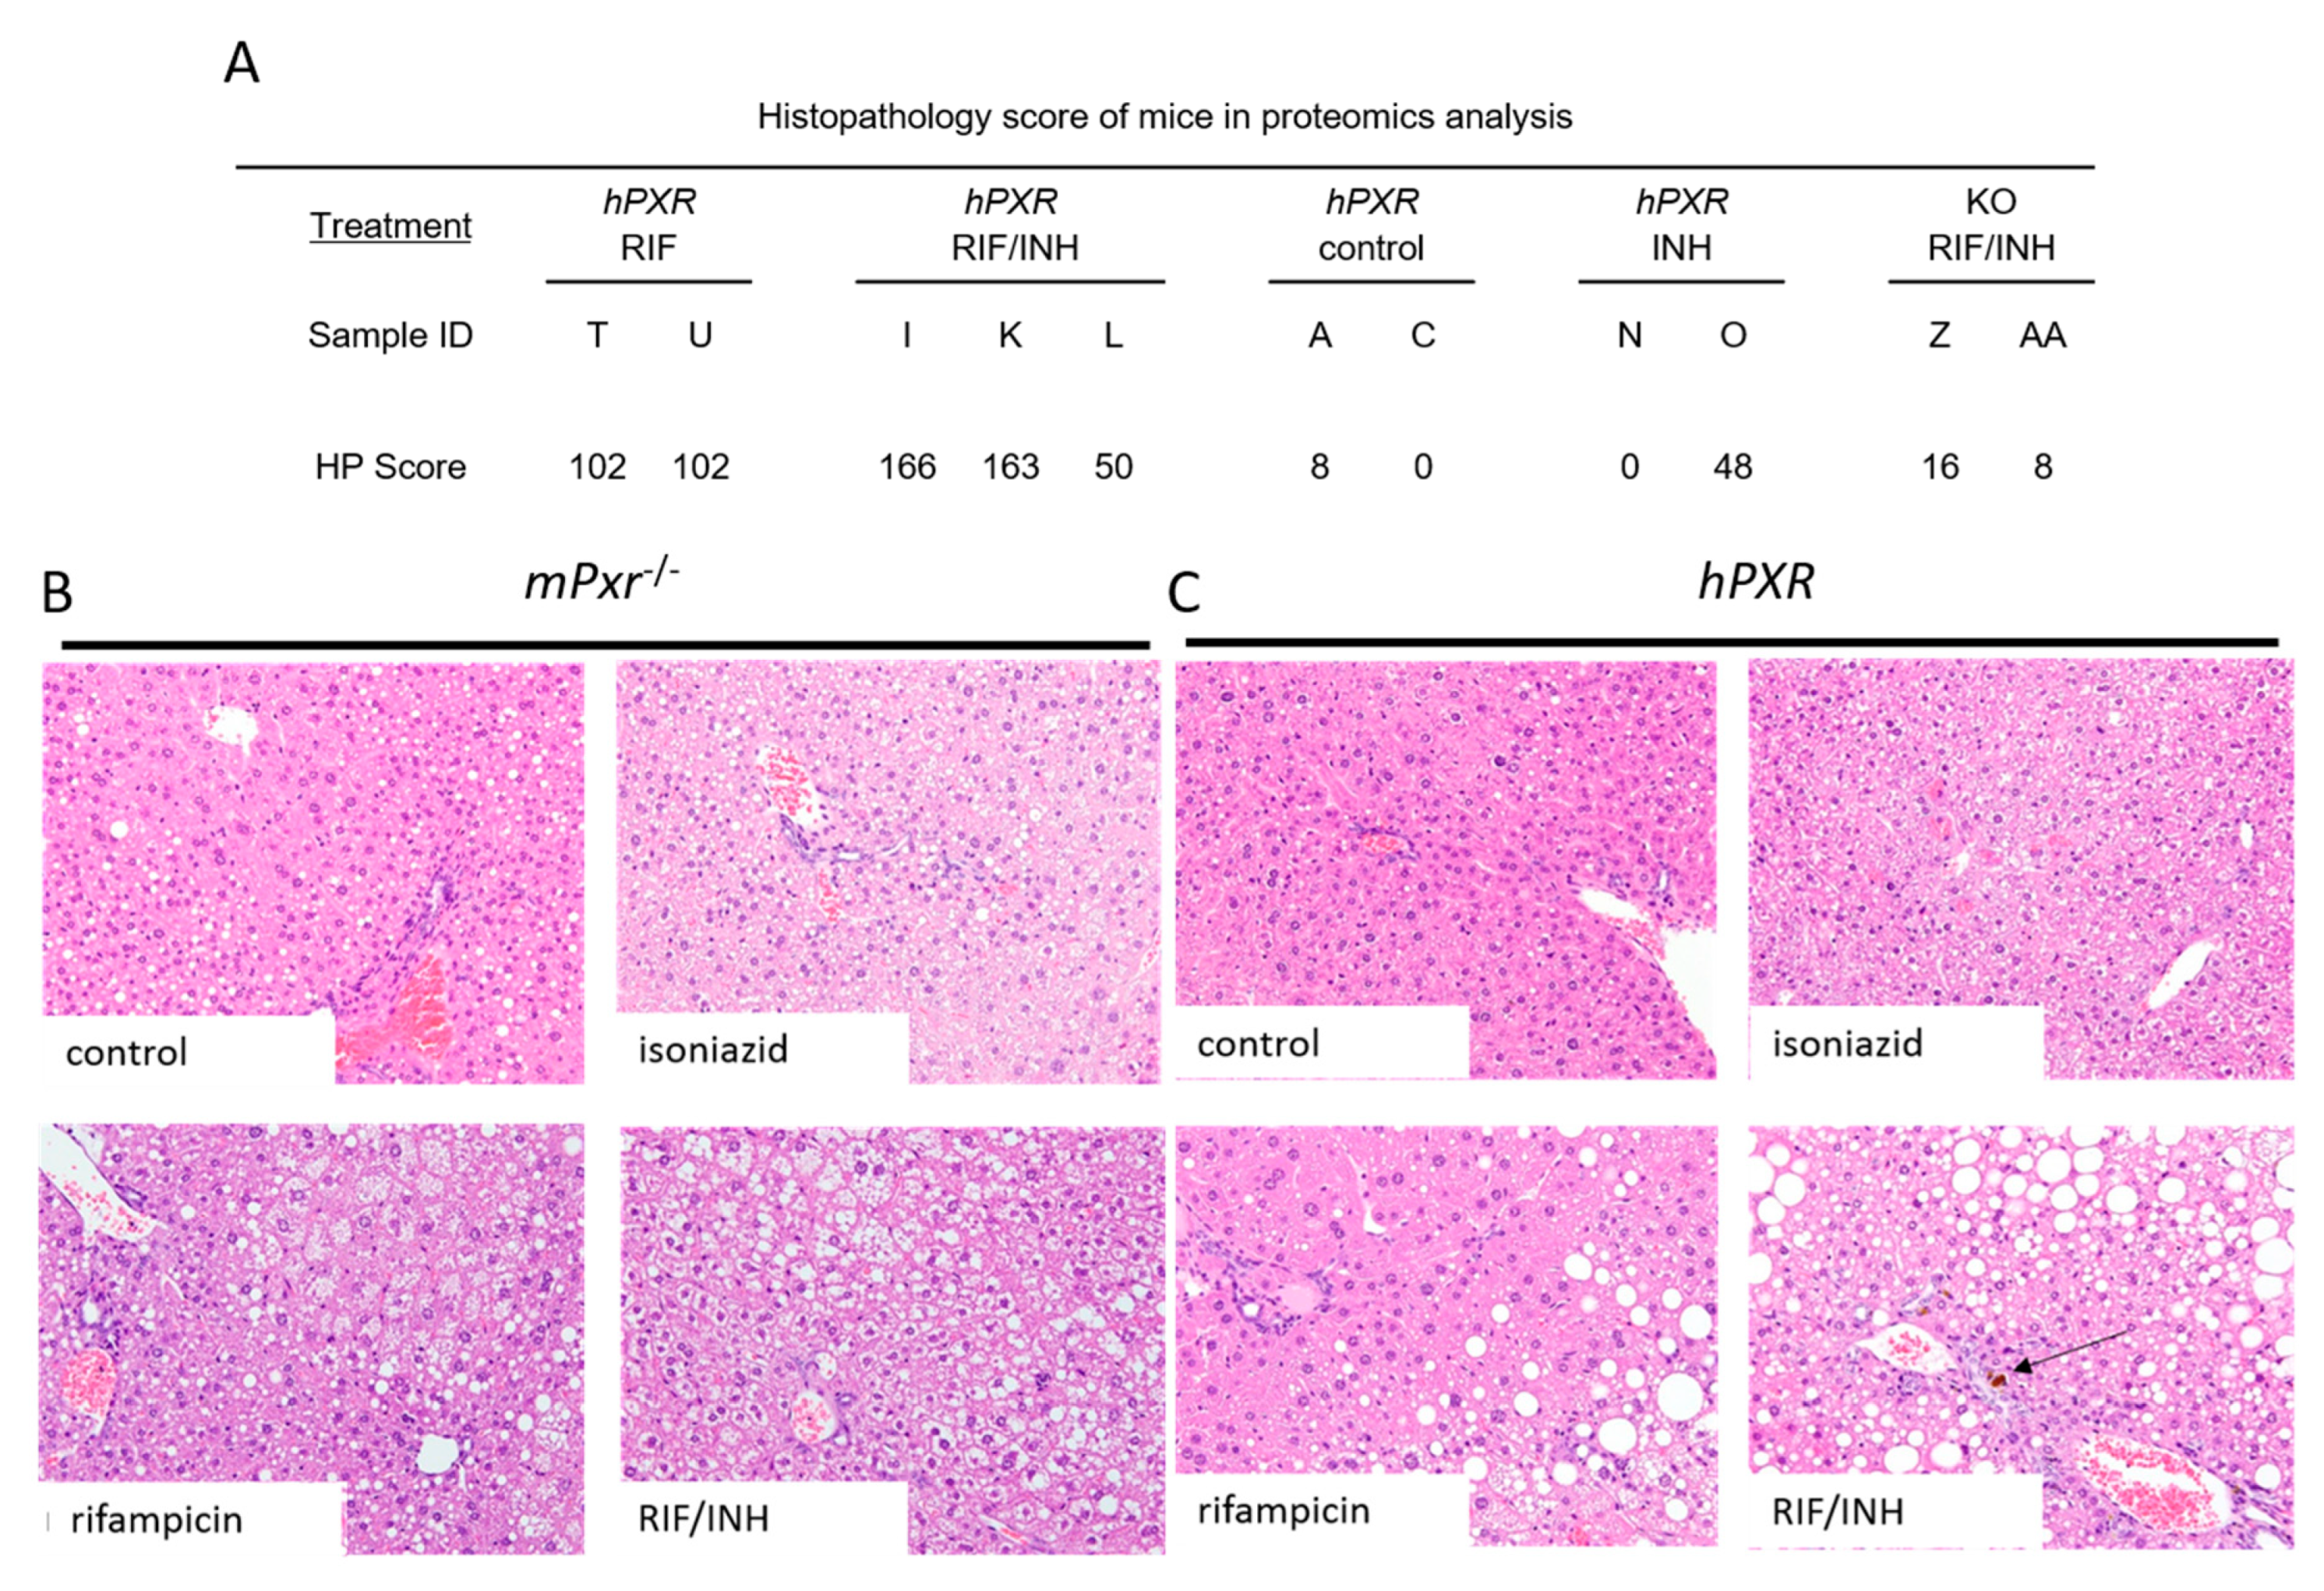
3.1. Hepatopathic Changes
3.2. Quantitative Analysis of the Liver Proteome
3.2.1. Heme Biosynthesis and Degradation
3.2.2. CYP Induction
3.2.3. Oxidative Stress, Wound Healing, and Inflammation
3.2.4. [Fe–S] Cluster-Containing Proteins
3.2.5. [Fe–S] Cluster Assembly Machinery
3.2.6. Vitamin B6 Metabolism
3.2.7. Homocysteine Metabolism
3.2.8. Tryptophan Metabolism
4. Discussion
5. Conclusions
Supplementary Materials
Author Contributions
Funding
Acknowledgments
Conflicts of Interest
References
- Murray, C.J.L.; Ortblad, K.F.; Guinovart, C.; Lim, S.S.; Wolock, T.M.; Roberts, D.A.; Dansereau, E.A.; Graetz, N.; Barber, R.M.; Brown, J.C.; et al. Global, regional, and national incidence and mortality for HIV, tuberculosis, and malaria during 1990–2013: A systematic analysis for the Global Burden of Disease Study 2013. Lancet 2014, 384, 1005–1070. [Google Scholar] [CrossRef]
- Singla, N.; Gupta, D.; Birbian, N.; Singh, J. Association of NAT2, GST and CYP2E1 polymorphisms and anti-tuberculosis drug-induced hepatotoxicity. Tuberculosis 2014, 94, 293–298. [Google Scholar] [CrossRef]
- Tostmann, A.; Boeree, M.; Peters, W.H.; Roelofs, H.M.; Aarnoutse, R.; Van Der Ven, A.J.; Dekhuijzen, P.R. Isoniazid and its toxic metabolite hydrazine induce in vitro pyrazinamide toxicity. Int. J. Antimicrob. Agents 2008, 31, 577–580. [Google Scholar] [CrossRef] [PubMed]
- Sharifzadeh, M.; Rasoulinejad, M.; Valipour, F.; Nouraie, M.; Vaziri, S. Evaluation of patient-related factors associated with causality, preventability, predictability and severity of hepatotoxicity during antituberculosis [correction of antituberclosis] treatment. Pharmacol Res. 2005, 51, 353–358. [Google Scholar] [CrossRef] [PubMed]
- Golla, R.; Mukherjee, A.; Gone, R.K.; Singh, H.; Pannu, A.K.; Suri, V.; Bhalla, A. Acute Intermittent Porphyria & Anti-tuberculosis Therapy. Qjm Int. J. Med. 2019. [Google Scholar] [CrossRef]
- Treece, G.L.; Magnussen, C.R.; Patterson, J.R.; Tschudy, D.P. Exacerbation of porphyria during treatment of pulmonary tuberculosis. Am. Rev. Respir. Dis. 1976, 113, 233–237. [Google Scholar]
- Kassa, E.; Enawgaw, B.; Gelaw, A.; Gelaw, B. Effect of anti-tuberculosis drugs on hematological profiles of tuberculosis patients attending at University of Gondar Hospital, Northwest Ethiopia. Bmc Hematol. 2016, 16, 1–11. [Google Scholar] [CrossRef] [PubMed]
- Demiroglu, H.; Dündar, S. Vitamin B6 responsive sideroblastic anaemia in a patient with tuberculosis. Br. J. Clin. Pr. 1997, 51, 51–52. [Google Scholar]
- Fratz-Berilla, E.J.; Breydo, L.; Gouya, L.; Puy, H.; Uversky, V.N.; Ferreira, G.C. Isoniazid inhibits human erythroid 5-aminolevulinate synthase: Molecular mechanism and tolerance study with four X-linked protoporphyria patients. Biochim. Et Biophys. Acta (Bba) - Mol. Basis Dis. 2017, 1863, 428–439. [Google Scholar] [CrossRef]
- Piso, R.J.; Kriz, K.; Desax, M.-C. Severe isoniazid related sideroblastic anemia. Hematol. Rep. 2011, 3, 2. [Google Scholar] [CrossRef]
- White, N. Venous thrombosis and rifampicin. Lancet 1989, 334, 434–435. [Google Scholar] [CrossRef]
- Chaudhary, A.; Desai, U.; Joshi, J.M. Venous thromboembolism due to hyperhomocysteinaemia and tuberculosis. Natl. Medj. India 2017, 30, 139–141. [Google Scholar]
- Sheu, J.-J.; Chiou, H.; Kang, J.-H.; Chen, Y.-H.; Lin, H.-C. Tuberculosis and the Risk of Ischemic Stroke: A 3-Year Follow-Up Study. Stroke 2010, 41, 244–249. [Google Scholar] [CrossRef] [PubMed]
- Aita, J.F.; Calame, T.R. Peripheral neuropathy secondary to isoniazid-induced pyridoxine deficiency. Md. State Medj. 1972, 21, 68–70. [Google Scholar]
- Carlson, H.B.; Anthony, E.M.; Russell, W.F.; Middlebrook, G. Prophylaxis of Isoniazid Neuropathy with Pyridoxine. New Engl. J. Med. 1956, 255, 118–122. [Google Scholar] [CrossRef]
- Mahashur, A.A. Isoniazid induced peripheral neuropathy. J. Assoc. Physicians India 1992, 40, 651–652. [Google Scholar] [PubMed]
- Millar, J.W. Rifampicin-induced porphyria cutanea tarda. Br. J. Dis. Chest 1980, 74, 405–408. [Google Scholar] [CrossRef]
- Kipsang, J.K.; Choge, J.K.; Marinda, P.; Khayeka-Wandabwa, C. Pellagra in isoniazid preventive and antiretroviral therapy. IDCases 2019, 17, e00550. [Google Scholar] [CrossRef]
- Bilgili, S.G.; Bilgili, S.G.; Calka, O.; Altun, F. Isoniazid-induced pellagra. Cutan. Ocul. Toxicol. 2011, 30, 317–319. [Google Scholar] [CrossRef]
- Ishii, N.; Nishihara, Y. Pellagra encephalopathy among tuberculous patients: Its relation to isoniazid therapy. J. Neurol. Neurosurg. Psychiatry 1985, 48, 628–634. [Google Scholar] [CrossRef]
- Sevigny, S.J.D.J.; White, S.L.; Halsey, M.L.; Johnston, F.A. Effect of Isoniazid on the Loss of Pyridoxal Phosphate from, and its Distribution in, the Body of the Rat. J. Nutr. 1966, 88, 45–50. [Google Scholar] [CrossRef] [PubMed]
- Cilliers, K.; Labadarios, D.; Schaaf, H.S.; Willemse, M.; Maritz, J.; Werely, C.; Hussey, G.; Donald, P.R. Pyridoxal-5-phosphate plasma concentrations in children receiving tuberculosis chemotherapy including isoniazid. Acta Paediatr. 2010, 99, 705–710. [Google Scholar] [CrossRef] [PubMed]
- Wang, Y.-M.; Chai, S.C.; Brewer, C.T.; Chen, T. Pregnane X receptor and drug-induced liver injury. Expert Opin. Drug Metab. Toxicol. 2014, 10, 1521–1532. [Google Scholar] [CrossRef] [PubMed]
- Brewer, C.T.; Chen, T. PXR variants: The impact on drug metabolism and therapeutic responses. Acta Pharm. Sin. B 2016, 6, 441–449. [Google Scholar] [CrossRef] [PubMed]
- Brewer, C.; Chen, T. Hepatotoxicity of Herbal Supplements Mediated by Modulation of Cytochrome P450. Int. J. Mol. Sci. 2017, 18, 2353. [Google Scholar] [CrossRef] [PubMed]
- Brewer, C.T.; Low, J.; Chen, T. High-Throughput Imaging of PPIX Using Confocal Microscopy. Breast Cancer 2019, 1966, 137–149. [Google Scholar] [CrossRef]
- Brewer, C.T.; Yang, L.; Edwards, A.; Lu, Y.; Low, J.; Wu, J.; Lee, R.E.; Chen, T. The Isoniazid Metabolites Hydrazine and Pyridoxal Isonicotinoyl Hydrazone Modulate Heme Biosynthesis. Toxicol. Sci. 2018, 168, 209–224. [Google Scholar] [CrossRef]
- Xie, W.; Barwick, J.L.; Downes, M.; Blumberg, B.; Simon, C.M.; Nelson, M.C.; Neuschwander-Tetri, B.A.; Brunt, E.M.; Guzelian, P.S.; Evans, R.M. Humanized xenobiotic response in mice expressing nuclear receptor SXR. Nature 2000, 406, 435–439. [Google Scholar] [CrossRef]
- Beaune, P.; Kremers, P.; Letawe-Goujon, F.; Gielen, J.E. Monoclonal antibodies against human liver cytochrome P-450. Biochem. Pharmacol. 1985, 34, 3547–3552. [Google Scholar] [CrossRef]
- Schuetz, E.G.; Schinkel, A.H.; Relling, M.V.; Schuetz, J.D. P-glycoprotein: A major determinant of rifampicin-inducible expression of cytochrome P4503A in mice and humans. Proc. Natl. Acad. Sci. USA 1996, 93, 4001–4005. [Google Scholar] [CrossRef]
- Wang, Y.-M.; Lin, W.; Chai, S.C.; Wu, J.; Ong, S.S.; Schuetz, E.G.; Chen, T. Piperine activates human pregnane X receptor to induce the expression of cytochrome P450 3A4 and multidrug resistance protein 1. Toxicol. Appl. Pharmacol. 2013, 272, 96–107. [Google Scholar] [CrossRef] [PubMed]
- Pagala, V.R.; High, A.A.; Wang, X.; Tan, H.; Kodali, K.; Mishra, A.; Kavdia, K.; Xu, Y.; Wu, Z.; Peng, J. Quantitative Protein Analysis by Mass Spectrometry. Adv. Struct. Saf. Stud. 2015, 1278, 281–305. [Google Scholar] [CrossRef]
- Lin, W.; Wang, Y.-M.; Chai, S.C.; Lv, L.; Zheng, J.; Wu, J.; Zhang, Q.; Wang, Y.-D.; Griffin, P.R.; Chen, T. SPA70 is a potent antagonist of human pregnane X receptor. Nat. Commun. 2017, 8, 741. [Google Scholar] [CrossRef] [PubMed]
- Bai, B.; Tan, H.; Pagala, V.R.; High, A.A.; Ichhaporia, V.; Hendershot, L.; Peng, J. Deep Profiling of Proteome and Phosphoproteome by Isobaric Labeling, Extensive Liquid Chromatography and Mass Spectrometry. Methods Enzymol. 2016, 585, 377–395. [Google Scholar] [CrossRef]
- Wang, X.; Li, Y.; Wu, Z.; Wang, H.; Tan, H.; Peng, J. JUMP: A tag-based database search tool for peptide identification with high sensitivity and accuracy. Mol. Cell. Proteom. 2014, 13, 3663–3673. [Google Scholar] [CrossRef]
- Niu, M.; Cho, J.-H.; Kodali, K.; Pagala, V.; High, A.A.; Wang, H.; Wu, Z.; Li, Y.; Bi, W.; Zhang, H.; et al. Extensive Peptide Fractionation and y1 Ion-Based Interference Detection Method for Enabling Accurate Quantification by Isobaric Labeling and Mass Spectrometry. Anal. Chem. 2017, 89, 2956–2963. [Google Scholar] [CrossRef]
- Bai, B.; Wang, X.; Li, Y.; Chen, P.-C.; Yu, K.; Dey, K.K.; Yarbro, J.M.; Han, X.; Lutz, B.M.; Rao, S.; et al. Deep Multilayer Brain Proteomics Identifies Molecular Networks in Alzheimer’s Disease Progression. Neuron 2020, 106, 700. [Google Scholar] [CrossRef]
- Perez-Riverol, Y.; Csordas, A.; Bai, J.; Bernal-Llinares, M.; Hewapathirana, S.; Kundu, D.J.; Inuganti, A.; Griss, J.; Mayer, G.; Eisenacher, M.; et al. The PRIDE database and related tools and resources in 2019: Improving support for quantification data. Nucleic Acids Res. 2018, 47, D442–D450. [Google Scholar] [CrossRef]
- Li, F.; Lu, J.; Cheng, J.; Wang, L.; Matsubara, T.; Csanaky, I.L.; Klaassen, C.D.; Gonzalez, F.J.; Ma, X. Human PXR modulates hepatotoxicity associated with rifampicin and isoniazid co-therapy. Nat. Med. 2013, 19, 418–420. [Google Scholar] [CrossRef]
- Sachar, M.; Li, F.; Liu, K.; Wang, P.; Lu, J.; Ma, X. Chronic Treatment with Isoniazid Causes Protoporphyrin IX Accumulation in Mouse Liver. Chem. Res. Toxicol. 2016, 29, 1293–1297. [Google Scholar] [CrossRef]
- Muruganandan, S.; Sinal, C. Mice as Clinically Relevant Models for the Study of Cytochrome P450-dependent Metabolism. Clin. Pharmacol. Ther. 2008, 83, 818–828. [Google Scholar] [CrossRef] [PubMed]
- Yamada, S.; Tang, M.; Richardson, K. Genetic variations of NAT2 and CYP2E1 and isoniazid hepatotoxicity in a diverse population. Pharmacogenomics 2009, 10, 1433–1445. [Google Scholar] [CrossRef] [PubMed]
- Gogtay, N.; Kapileshwar, S.R.; Shah, S.U.; Bendkhale, S.R.; Ramakrishna, S.; Sridharan, K.; Thelma, B.K.; Thatte, U.M.; Kshirsagar, N.A. Evaluation of cytochrome P4502E1 polymorphisms in healthy adult Western Indians and patients with antituberculous drug-induced hepatotoxicity. Indianj. Pharmacol. 2016, 48, 42–46. [Google Scholar] [CrossRef] [PubMed]
- Butov, D.; Antonenko, P.; Kresyun, V.; Antonenko, K.; Butova, T. Association between effectiveness of tuberculosis treatment and cytochrome P-4502E1 polymorphism of the patients. Int. J. Mycobacteriology 2017, 6, 396. [Google Scholar] [CrossRef]
- Lian, Y.; Zhao, J.; Wang, Y.-M.; Zhao, J.; Peng, S.-Q. Metallothionein protects against isoniazid-induced liver injury through the inhibition of CYP2E1-dependent oxidative and nitrosative impairment in mice. Food Chem. Toxicol. 2017, 102, 32–38. [Google Scholar] [CrossRef]
- Cheng, J.; Krausz, K.W.; Li, F.; Ma, X.; Gonzalez, F.J. CYP2E1-dependent elevation of serum cholesterol, triglycerides, and hepatic bile acids by isoniazid. Toxicol. Appl. Pharmacol. 2013, 266, 245–253. [Google Scholar] [CrossRef]
- Gupta, V.H.; Singh, M.; Amarapurkar, D.N.; Sasi, P.; Joshi, J.M.; Baijal, R.; Kumar, H.R.P.; Amarapurkar, A.D.; Joshi, K.; Wangikar, P.P. Association of GST null genotypes with anti-tuberculosis drug induced hepatotoxicity in Western Indian population. Ann. Hepatol. 2013, 12, 959–965. [Google Scholar] [CrossRef]
- Li, C.; Long, J.; Hu, X.; Zhou, Y. GSTM1 and GSTT1 genetic polymorphisms and risk of anti-tuberculosis drug-induced hepatotoxicity: An updated meta-analysis. Eur. J. Clin. Microbiol. Infect. Dis. 2013, 32, 859–868. [Google Scholar] [CrossRef]
- Hwang, J.H.; Kim, Y.-H.; Noh, J.-R.; Gang, G.-T.; Kim, K.-S.; Chung, H.K.; Tadi, S.; Yim, Y.-H.; Shong, M.; Lee, C.-H. The protective role of NAD(P)H:quinone oxidoreductase 1 on acetaminophen-induced liver injury is associated with prevention of adenosine triphosphate depletion and improvement of mitochondrial dysfunction. Arch. Toxicol. 2014, 89, 2159–2166. [Google Scholar] [CrossRef]
- Hashimoto, K.; Kim, H.; Oishi, H.; Chen, M.; Iskender, I.; Sakamoto, J.; Ohsumi, A.; Guan, Z.; Hwang, D.; Waddell, T.K.; et al. Annexin V homodimer protects against ischemia reperfusion–induced acute lung injury in lung transplantation. J. Thorac. Cardiovasc. Surg. 2016, 151, 861–869. [Google Scholar] [CrossRef]
- Zakrzewicz, A.; Atanasova, S.; Padberg, W.; Grau, V. Monocytic Tissue Transglutaminase in a Rat Model for Reversible Acute Rejection and Chronic Renal Allograft Injury. Mediat. Inflamm. 2015, 2015, 1–13. [Google Scholar] [CrossRef]
- Thankam, F.G.; Chandra, I.; Diaz, C.; Dilisio, M.F.; Fleegel, J.; Gross, R.M.; Agrawal, D.K. Matrix regeneration proteins in the hypoxia-triggered exosomes of shoulder tenocytes and adipose-derived mesenchymal stem cells. Mol. Cell. Biochem. 2019, 465, 75–87. [Google Scholar] [CrossRef] [PubMed]
- Sheftel, A.D.; Stehling, O.; Pierik, A.J.; Elsässer, H.-P.; Mühlenhoff, U.; Webert, H.; Hobler, A.; Hannemann, F.; Bernhardt, R.; Lill, R. Humans possess two mitochondrial ferredoxins, Fdx1 and Fdx2, with distinct roles in steroidogenesis, heme, and Fe/S cluster biosynthesis. Proc. Natl. Acad. Sci. USA 2010, 107, 11775–11780. [Google Scholar] [CrossRef] [PubMed]
- Sun, F.; Huo, X.; Zhai, Y.; Wang, A.; Xu, J.; Su, D.; Bartlam, M.; Rao, Z. Crystal Structure of Mitochondrial Respiratory Membrane Protein Complex II. Cell 2005, 121, 1043–1057. [Google Scholar] [CrossRef] [PubMed]
- Coelho, C.; Foti, A.; Hartmann, T.; Santos-Silva, T.; Leimkühler, S.; Romao, M. Structural insights into xenobiotic and inhibitor binding to human aldehyde oxidase. Nat. Methods 2015, 11, 779–783. [Google Scholar] [CrossRef]
- Nishino, T.; Okamoto, K. The role of the [2Fe–2S] cluster centers in xanthine oxidoreductase. J. Inorg. Biochem. 2000, 82, 43–49. [Google Scholar] [CrossRef]
- Crouse, B.R.; Sellers, V.M.; Finnegan, M.G.; Dailey, H.A.; Johnson, M.K. Site-Directed Mutagenesis and Spectroscopic Characterization of Human Ferrochelatase: Identification of Residues Coordinating the [2Fe-2S] Cluster†. Biochemistry 1996, 35, 16222–16229. [Google Scholar] [CrossRef]
- Loeffen, J.; Smeitink, J.; Triepels, R.; Smeets, R.; Schuelke, M.; Sengers, R.; Trijbels, F.; Hamel, B.; Mullaart, R.; Heuvel, L.V.D. The First Nuclear-Encoded Complex I Mutation in a Patient with Leigh Syndrome. Am. J. Hum. Genet. 1998, 63, 1598–1608. [Google Scholar] [CrossRef]
- Jang, Y.M.; Kim, D.W.; Kang, T.-C.; Won, M.H.; Baek, N.-I.; Moon, B.J.; Choi, S.Y.; Kwon, O.-S. Human Pyridoxal Phosphatase. J. Boil. Chem. 2003, 278, 50040–50046. [Google Scholar] [CrossRef]
- Ren, M.-Y.; Zhang, C.-S.; Zhang, X.-J.; Zhong, J.-Q. Acute Myocardial Infarction in a Young Man with Hyperhomocysteinemia and Pulmonary Tuberculosis. Intern. Med. 2016, 55, 153–159. [Google Scholar] [CrossRef][Green Version]
- Wald, D.S.; Law, M.; Morris, J.K. Homocysteine and cardiovascular disease: Evidence on causality from a meta-analysis. BMJ 2002, 325, 1202. [Google Scholar] [CrossRef] [PubMed]
- Watanabè, M.; Osada, J.; Aratani, Y.; Kluckman, K.; Reddick, R.; Malinow, M.R.; Maeda, N. Mice deficient in cystathionine beta-synthase: Animal models for mild and severe homocyst(e)inemia. Proc. Natl. Acad. Sci. USA 1995, 92, 1585–1589. [Google Scholar] [CrossRef] [PubMed]
- Smolin, L.A.; Benevenga, N.J. Accumulation of homocyst(e)ine in vitamin B-6 deficiency: A model for the study of cystathionine beta-synthase deficiency. J. Nutr. 1982, 112, 1264–1272. [Google Scholar] [CrossRef] [PubMed]
- Chen, X.; Xu, J.; Zhang, C.; Yu, T.; Wang, H.; Zhao, M.; Duan, Z.-H.; Zhang, Y.; Xu, J.-M.; Xu, D.-X. The protective effects of ursodeoxycholic acid on isoniazid plus rifampicin induced liver injury in mice. Eur. J. Pharmacol. 2011, 659, 53–60. [Google Scholar] [CrossRef] [PubMed]
- Guo, H.-L.; Hassan, H.M.; Ding, P.-P.; Wang, S.; Chen, X.; Wang, T.; Sun, L.-X.; Zhang, L.; Jiang, Z. Pyrazinamide-induced hepatotoxicity is alleviated by 4-PBA via inhibition of the PERK-eIF2α-ATF4-CHOP pathway. Toxicology 2017, 378, 65–75. [Google Scholar] [CrossRef]
- Kim, J.-H.; Nam, W.S.; Kim, S.J.; Kwon, O.K.; Seung, E.J.; Jo, J.J.; Shresha, R.; Lee, T.H.; Jeon, T.W.; Ki, S.H.; et al. Mechanism Investigation of Rifampicin-Induced Liver Injury Using Comparative Toxicoproteomics in Mice. Int. J. Mol. Sci. 2017, 18, 1417. [Google Scholar] [CrossRef]
- Roy, B.; Chowdhury, A.; Kundu, S.; Santra, A.; Dey, B.; Chakraborty, M.; Majumder, P.P. Increased risk of antituberculosis drug-induced hepatotoxicity in individuals with glutathione S-transferase M1 ’null’ mutation. J. Gastroenterol. Hepatol. 2001, 16, 1033–1037. [Google Scholar] [CrossRef]
- Huang, Y.-S.; Su, W.-J.; Huang, Y.-H.; Chen, C.-Y.; Chang, F.-Y.; Lin, H.; Lee, S.-D. Genetic polymorphisms of manganese superoxide dismutase, NAD(P)H:quinone oxidoreductase, glutathione S-transferase M1 and T1, and the susceptibility to drug-induced liver injury. J. Hepatol. 2007, 47, 128–134. [Google Scholar] [CrossRef]
- Lucena, M.I.; Andrade, R.J.; Martínez, C.; Ulzurrun, E.; Garcia-Martin, E.; Borraz, Y.; Fernandez, M.C.; Romero-Gomez, M.; Castiella, A.; Planas, R.; et al. GlutathioneS-transferase m1 and t1 null genotypes increase susceptibility to idiosyncratic drug-induced liver injury. Hepatology 2008, 48, 588–596. [Google Scholar] [CrossRef]
- Bing, C.; Xiaomeia, C.; Jinhenga, L. Gene dose effect of NAT2 variants on the pharmacokinetics of isoniazid and acetylisoniazid in healthy Chinese subjects. Drug Metab. Drug Interact. 2011, 26, 113–118. [Google Scholar] [CrossRef]
- Monteiro, T.P.; El-Jaick, K.; Jeovanio-Silva, A.L.; Brasil, P.E.A.A.D.; Costa, M.J.M.; Rolla, V.C.; De Castro, L. The roles of GSTM1 and GSTT1 null genotypes and other predictors in anti-tuberculosis drug-induced liver injury. J. Clin. Pharm. Ther. 2012, 37, 712–718. [Google Scholar] [CrossRef]
- Tang, N.; Deng, R.; Wang, Y.; Lin, M.; Li, H.; Qiu, Y.; Hong, M.; Zhou, G. GSTM1 and GSTT1 null polymorphisms and susceptibility to anti-tuberculosis drug-induced liver injury: A meta-analysis [Review article]. Int. J. Tuberc. Lung Dis. 2013, 17, 17–25. [Google Scholar] [CrossRef] [PubMed]
- Aleksunes, L.M.; Klaassen, C.D. Coordinated regulation of hepatic phase I and II drug-metabolizing genes and transporters using AhR-, CAR-, PXR-, PPARα-, and Nrf2-null mice. Drug Metab. Dispos. 2012, 40, 1366–1379. [Google Scholar] [CrossRef]
- Scriver, C.R.; Hutchison, J.H. The vitamin B6 deficiency syndrome in human infancy: Biochemical and clinical observations. Pediatrics 1963, 31, 240–250. [Google Scholar]
- Vilter, R.W.; Mueller, J.F.; Glazer, H.S.; Jarrold, T.; Abraham, J.; Thompson, C.; Hawkins, V.R. The effect of vitamin B6 deficiency induced by desoxypyridoxine in human beings. J. Lab. Clin. Med. 1953, 42, 335–357. [Google Scholar] [PubMed]
- Ha, H.; Kim, K.H.; Park, J.H.; Lee, J.-K.; Heo, E.Y.; Kim, J.-S.; Kim, D.-K.; Choi, I.S.; Chung, H.S.; Lim, H.J. Thromboembolism in Mycobacterium tuberculosis Infection: Analysis and Literature Review. Infect. Chemother. 2019, 51, 142–149. [Google Scholar] [CrossRef]
- Cowie, R.; Dansey, R.; Hay, M. Deep-vein thrombosis and pulmonary tuberculosis. Lancet 1989, 334, 1397. [Google Scholar] [CrossRef]
- Kechaou, I.; Cherif, E.; Ben Hassine, L.; Khalfallah, N. Deep vein thrombosis and tuberculosis: A causative link? Bmj Case Rep. 2014, 2014. [Google Scholar] [CrossRef]
- Pondarre, C.; Campagna, D.R.; Antiochos, B.; Sikorski, L.; Mulhern, H.; Fleming, M.D. Abcb7, the gene responsible for X-linked sideroblastic anemia with ataxia, is essential for hematopoiesis. Blood 2006, 109, 3567–3569. [Google Scholar] [CrossRef]
- Cavadini, P.; Biasiotto, G.; Poli, M.; Levi, S.; Verardi, R.; Zanella, I.; Derosas, M.; Ingrassia, R.; Corrado, M.; Arosio, P. RNA silencing of the mitochondrial ABCB7 transporter in HeLa cells causes an iron-deficient phenotype with mitochondrial iron overload. Blood 2006, 109, 3552–3559. [Google Scholar] [CrossRef] [PubMed]
- Lee, S.W.; Kang, Y.A.; Yoon, Y.S.; Um, S.-W.; Lee, S.M.; Yoo, C.-G.; Kim, Y.W.; Han, S.K.; Shim, Y.-S.; Yim, J.-J. The Prevalence and Evolution of Anemia Associated with Tuberculosis. J. Korean Med. Sci. 2006, 21, 1028–1032. [Google Scholar] [CrossRef] [PubMed]
- Baynes, R.D.; Flax, H.; Bothwell, T.H.; Bezwoda, W.R.; MacPhail, A.P.; Atkinson, P.; Lewis, D. Haematological and iron-related measurements in active pulmonary tuberculosis. Scand. J. Haematol. 1986, 36, 280–287. [Google Scholar] [CrossRef] [PubMed]
- Kaeley, N.; Mukherjee, A.; Dhar, M.; Kumar, S.; Bhushan, B. Prevalence, characteristics, and predictors of tuberculosis associated anemia. J. Fam. Med. Prim. Care 2019, 8, 2445–2449. [Google Scholar] [CrossRef] [PubMed]
- Dailey, H.A.; Finnegan, M.G.; Johnson, M.K. Human ferrochelatase is an iron-sulfur protein. Biochemistry 1994, 33, 403–407. [Google Scholar] [CrossRef]
- Ferreira, G.C.; Gong, J. 5-Aminolevulinate synthase and the first step of heme biosynthesis. J. Bioenerg. Biomembr. 1995, 27, 151–159. [Google Scholar] [CrossRef]
- Day, A.L.; Parsons, B.M.; Dailey, H.A. Cloning and Characterization ofGallusandXenopusFerrochelatases: Presence of the [2Fe-2S] Cluster in Nonmammalian Ferrochelatase. Arch. Biochem. Biophys. 1998, 359, 160–169. [Google Scholar] [CrossRef]
- Sellers, V.M.; Johnson, M.K.; Dailey, H.A. Function of the [2Fe−2S] Cluster in Mammalian Ferrochelatase: A Possible Role as a Nitric Oxide Sensor†. Biochemistry 1996, 35, 2699–2704. [Google Scholar] [CrossRef]
- Kim, Y.-M.; Bergonia, H.A.; Müller, C.; Pitt, B.R.; Watkins, W.D.; Lancaster, J.R. Loss and Degradation of Enzyme-bound Heme Induced by Cellular Nitric Oxide Synthesis. J. Boil. Chem. 1995, 270, 5710–5713. [Google Scholar] [CrossRef]
- Rouault, T.A.; Klausner, R.D. Iron-sulfur clusters as biosensors of oxidants and iron. Trends Biochem. Sci. 1996, 21, 174–177. [Google Scholar] [CrossRef]
- Crooks, D.R.; Ghosh, M.C.; Haller, R.G.; Tong, W.-H.; Rouault, T.A. Posttranslational stability of the heme biosynthetic enzyme ferrochelatase is dependent on iron availability and intact iron-sulfur cluster assembly machinery. Blood 2010, 115, 860–869. [Google Scholar] [CrossRef]
- Battioni, P.; Mahy, J.-P.; Delaforge, M.; Mansuy, D. Reaction of Monosubstituted Hydrazines and Diazenes with Rat-Liver Cytochrome P450. Formation of Ferrous-Diazene and Ferric sigma-Alkyl Complexes. Jbic J. Boil. Inorg. Chem. 1983, 134, 241–248. [Google Scholar] [CrossRef] [PubMed]
- Ator, M.A.; David, S.K.; De Montellano, P.R.O. Structure and catalytic mechanism of horseradish peroxidase. Regiospecific meso alkylation of the prosthetic heme group by alkylhydrazines. J. Boil. Chem. 1987, 262, 14954–14960. [Google Scholar]
- Jenner, A.M.; Timbrell, J.A. Effect of acute and repeated exposure to low doses of hydrazine on hepatic microsomal enzymes and biochemical parameters in vivo. Arch. Toxicol. 1994, 68, 240–245. [Google Scholar] [CrossRef] [PubMed]
- Wen, X.; Wang, J.-S.; Neuvonen, P.J.; Backman, J.T. Isoniazid is a mechanism-based inhibitor of cytochrome P450 1A2, 2A6, 2C19 and 3A4 isoforms in human liver microsomes. Eur. J. Clin. Pharmacol. 2002, 57, 799–804. [Google Scholar] [CrossRef] [PubMed]
- Kolluri, S.; Sadlon, T.J.; May, B.K.; Bonkovsky, H.L. Haem repression of the housekeeping 5-aminolaevulinic acid synthase gene in the hepatoma cell line LMH. Biochem. J. 2005, 392, 173–180. [Google Scholar] [CrossRef]
- Yoshino, K.; Munakata, H.; Kuge, O.; Ito, A.; Ogishima, T. Haeme-regulated Degradation of -Aminolevulinate Synthase 1 in Rat Liver Mitochondria. J. Biochem. 2007, 142, 453–458. [Google Scholar] [CrossRef]
- Zheng, J.; Shan, Y.; Lambrecht, R.W.; Donohue, S.E.; Bonkovsky, H.L. Differential regulation of human ALAS1 mRNA and protein levels by heme and cobalt protoporphyrin. Mol. Cell. Biochem. 2008, 319, 153–161. [Google Scholar] [CrossRef]
- Gotoh, S.; Nakamura, T.; Kataoka, T.; Taketani, S. Egr-1 regulates the transcriptional repression of mouse delta-aminolevulinic acid synthase 1 by heme. Gene 2011, 472, 28–36. [Google Scholar] [CrossRef]
- Kubota, Y.; Nomura, K.; Katoh, Y.; Yamashita, R.; Kaneko, K.; Furuyama, K. Novel Mechanisms for Heme-dependent Degradation of ALAS1 Protein as a Component of Negative Feedback Regulation of Heme Biosynthesis*. J. Boil. Chem. 2016, 291, 20516–20529. [Google Scholar] [CrossRef]
- Schwarcz, R.; Stone, T.W. The kynurenine pathway and the brain: Challenges, controversies and promises. Neuropharmacol. 2017, 112, 237–247. [Google Scholar] [CrossRef]
- Goldsmith, G.A.; Sarett, H.P.; Register, U.D.; Gibbens, J. Studies of niacin requirement in man. i. experimental pellagra in subjects on corn diets low in niacin and tryptophan 1. J. Clin. Investig. 1952, 31, 533–542. [Google Scholar] [CrossRef] [PubMed]
- Griffiths, W.A.D.; Greaves, M.W.; Meara, R.H. Isoniazid-Induced Pellagra. Proc. R. Soc. Med. 1976, 69, 313–314. [Google Scholar] [CrossRef] [PubMed]


© 2020 by the authors. Licensee MDPI, Basel, Switzerland. This article is an open access article distributed under the terms and conditions of the Creative Commons Attribution (CC BY) license (http://creativecommons.org/licenses/by/4.0/).
Share and Cite
Brewer, C.T.; Kodali, K.; Wu, J.; Shaw, T.I.; Peng, J.; Chen, T. Toxicoproteomic Profiling of hPXR Transgenic Mice Treated with Rifampicin and Isoniazid. Cells 2020, 9, 1654. https://doi.org/10.3390/cells9071654
Brewer CT, Kodali K, Wu J, Shaw TI, Peng J, Chen T. Toxicoproteomic Profiling of hPXR Transgenic Mice Treated with Rifampicin and Isoniazid. Cells. 2020; 9(7):1654. https://doi.org/10.3390/cells9071654
Chicago/Turabian StyleBrewer, Christopher Trent, Kiran Kodali, Jing Wu, Timothy I. Shaw, Junmin Peng, and Taosheng Chen. 2020. "Toxicoproteomic Profiling of hPXR Transgenic Mice Treated with Rifampicin and Isoniazid" Cells 9, no. 7: 1654. https://doi.org/10.3390/cells9071654
APA StyleBrewer, C. T., Kodali, K., Wu, J., Shaw, T. I., Peng, J., & Chen, T. (2020). Toxicoproteomic Profiling of hPXR Transgenic Mice Treated with Rifampicin and Isoniazid. Cells, 9(7), 1654. https://doi.org/10.3390/cells9071654