Multilineage Differentiation for Formation of Innervated Skeletal Muscle Fibers from Healthy and Diseased Human Pluripotent Stem Cells

 ,
,  and
and 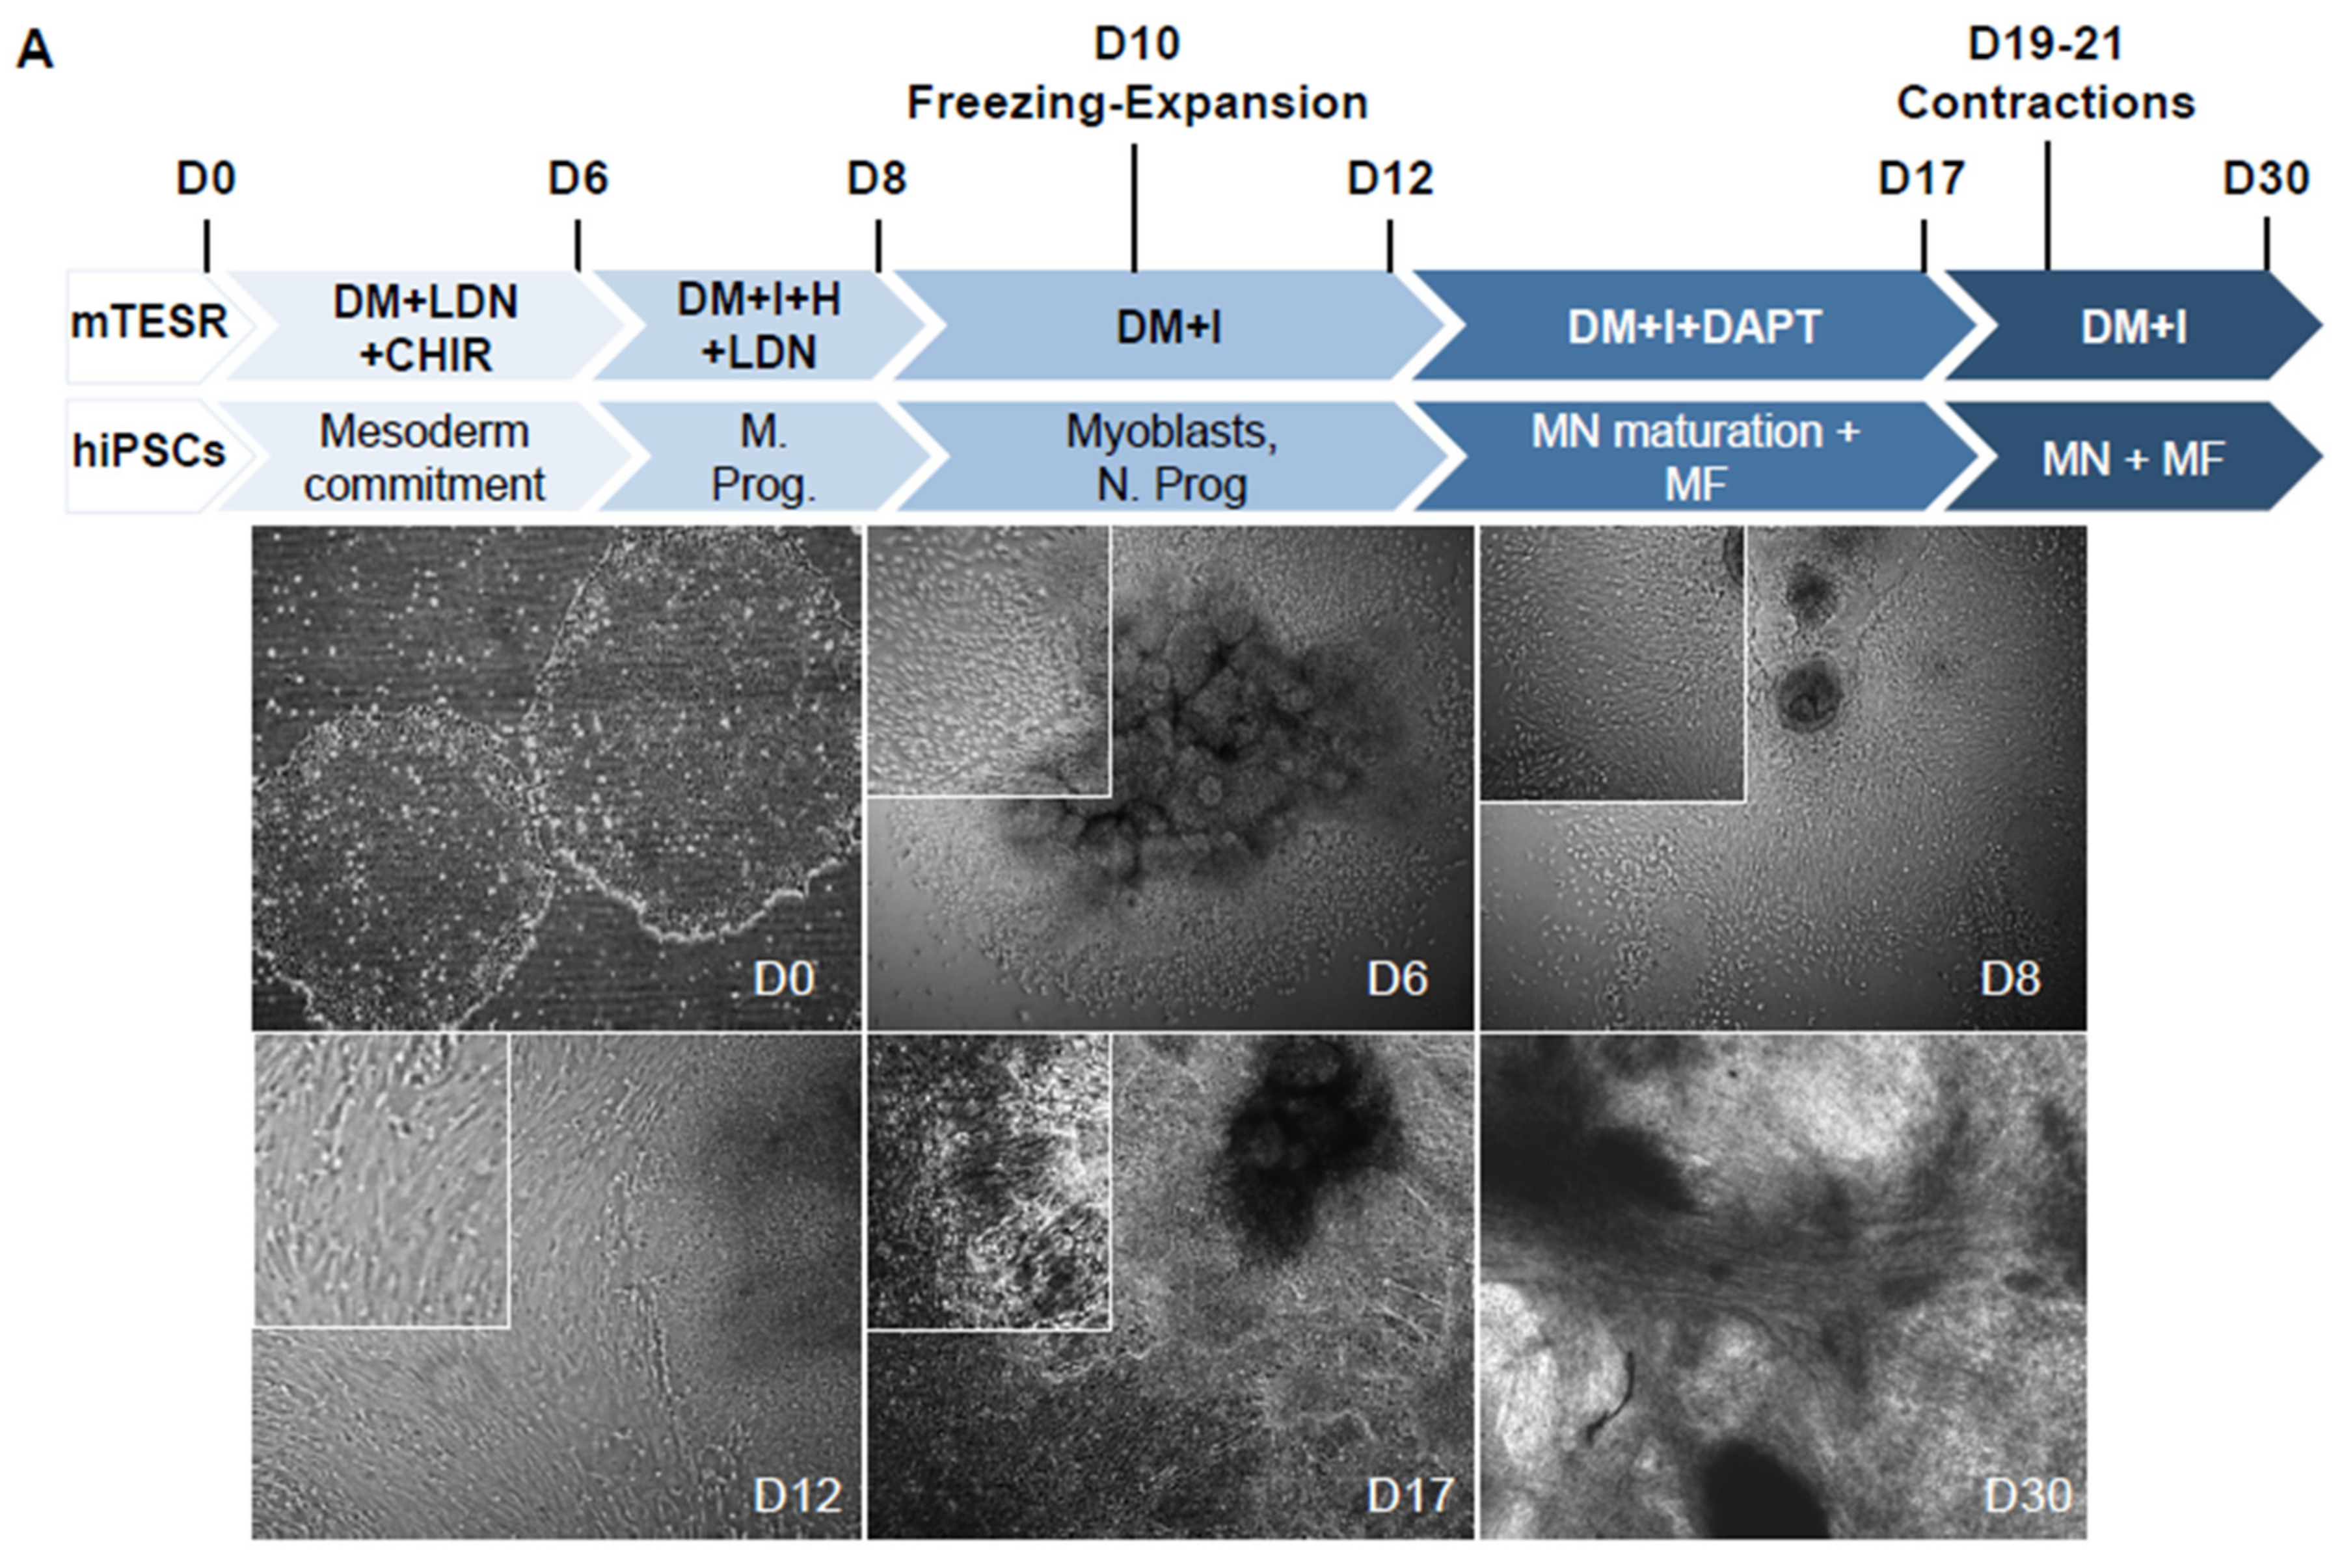
Abstract
1. Introduction
2. Results
2.1. Concomitant Induction of Myogenesis and Neurogenesis for the Production of Innervated Muscle Fibers
2.2. Modulation of Wnt, BMP and Notch Pathways Leads to the Progressive Enrichment in Skeletal Muscle Progenitors, Followed by the Formation of Myofibers with Complete Sarcomeric Differentiation and Highly Organized Myofibrillar Pattern
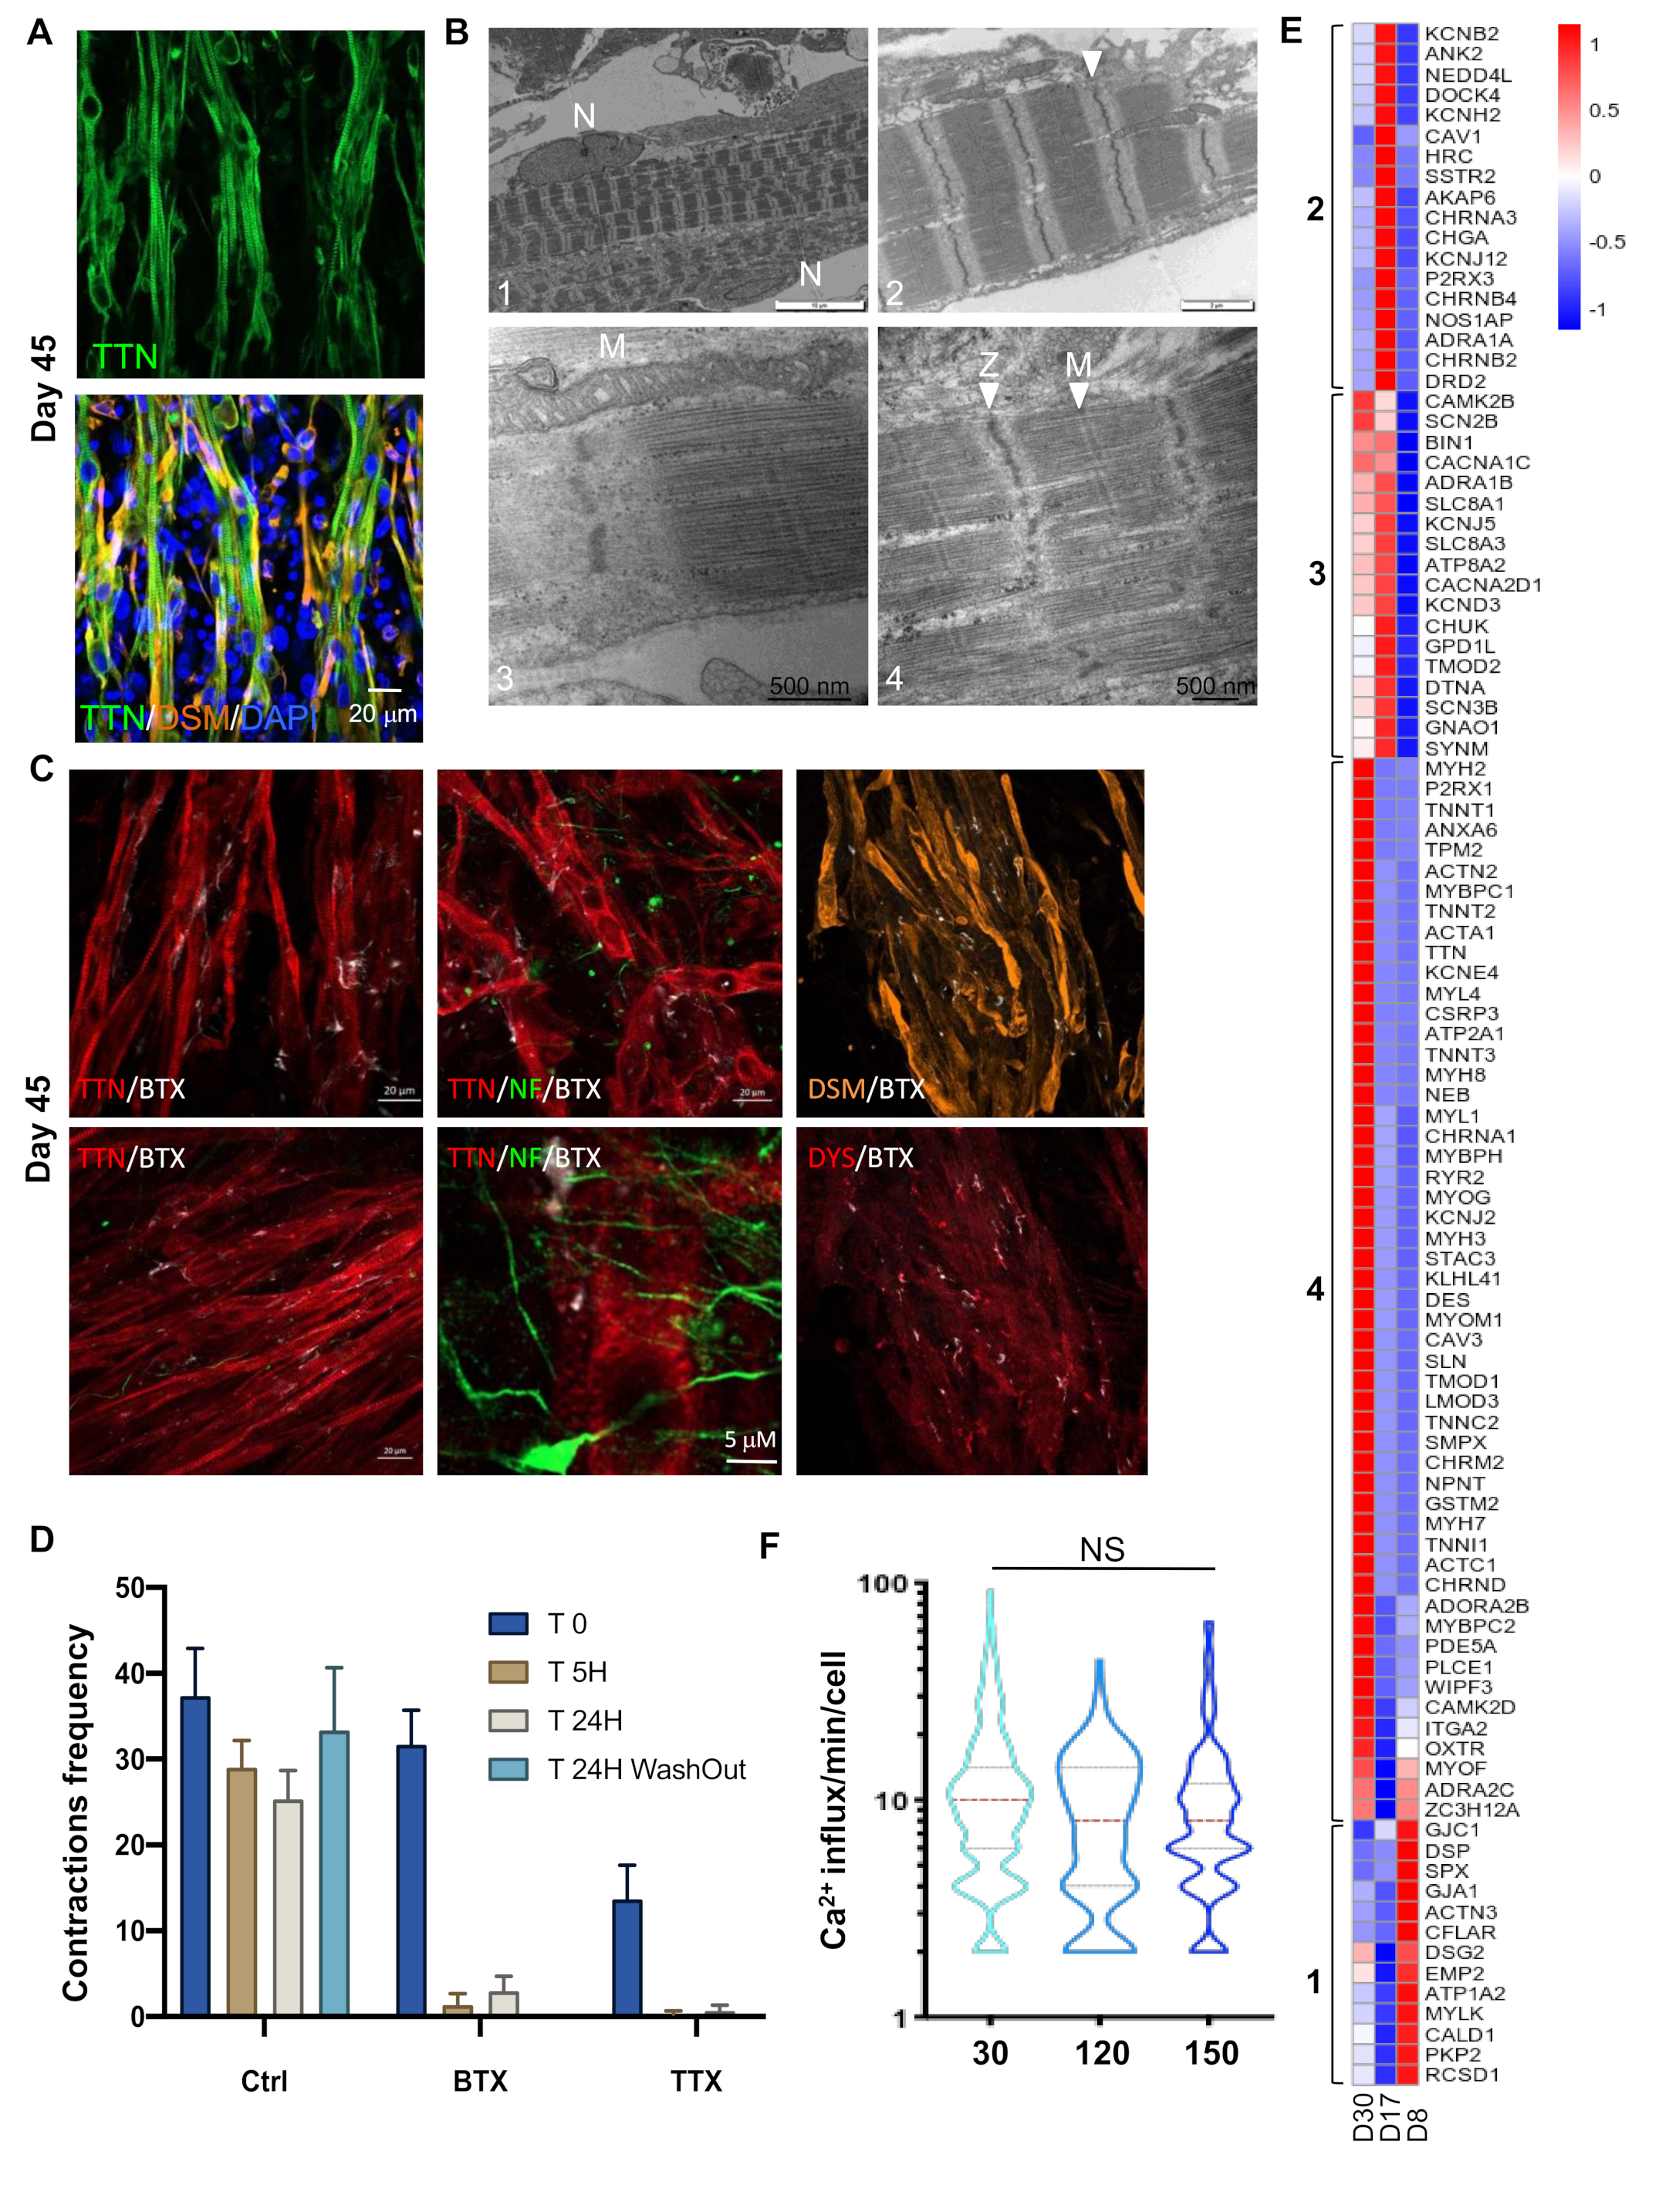
2.3. Myotubes and Motor Neurons in Close Proximity Connect with Each Other to Form Functional Neuromuscular Junctions
2.4. The Activation of Genes Required for Muscle Contraction Occurred Between D17 and D30
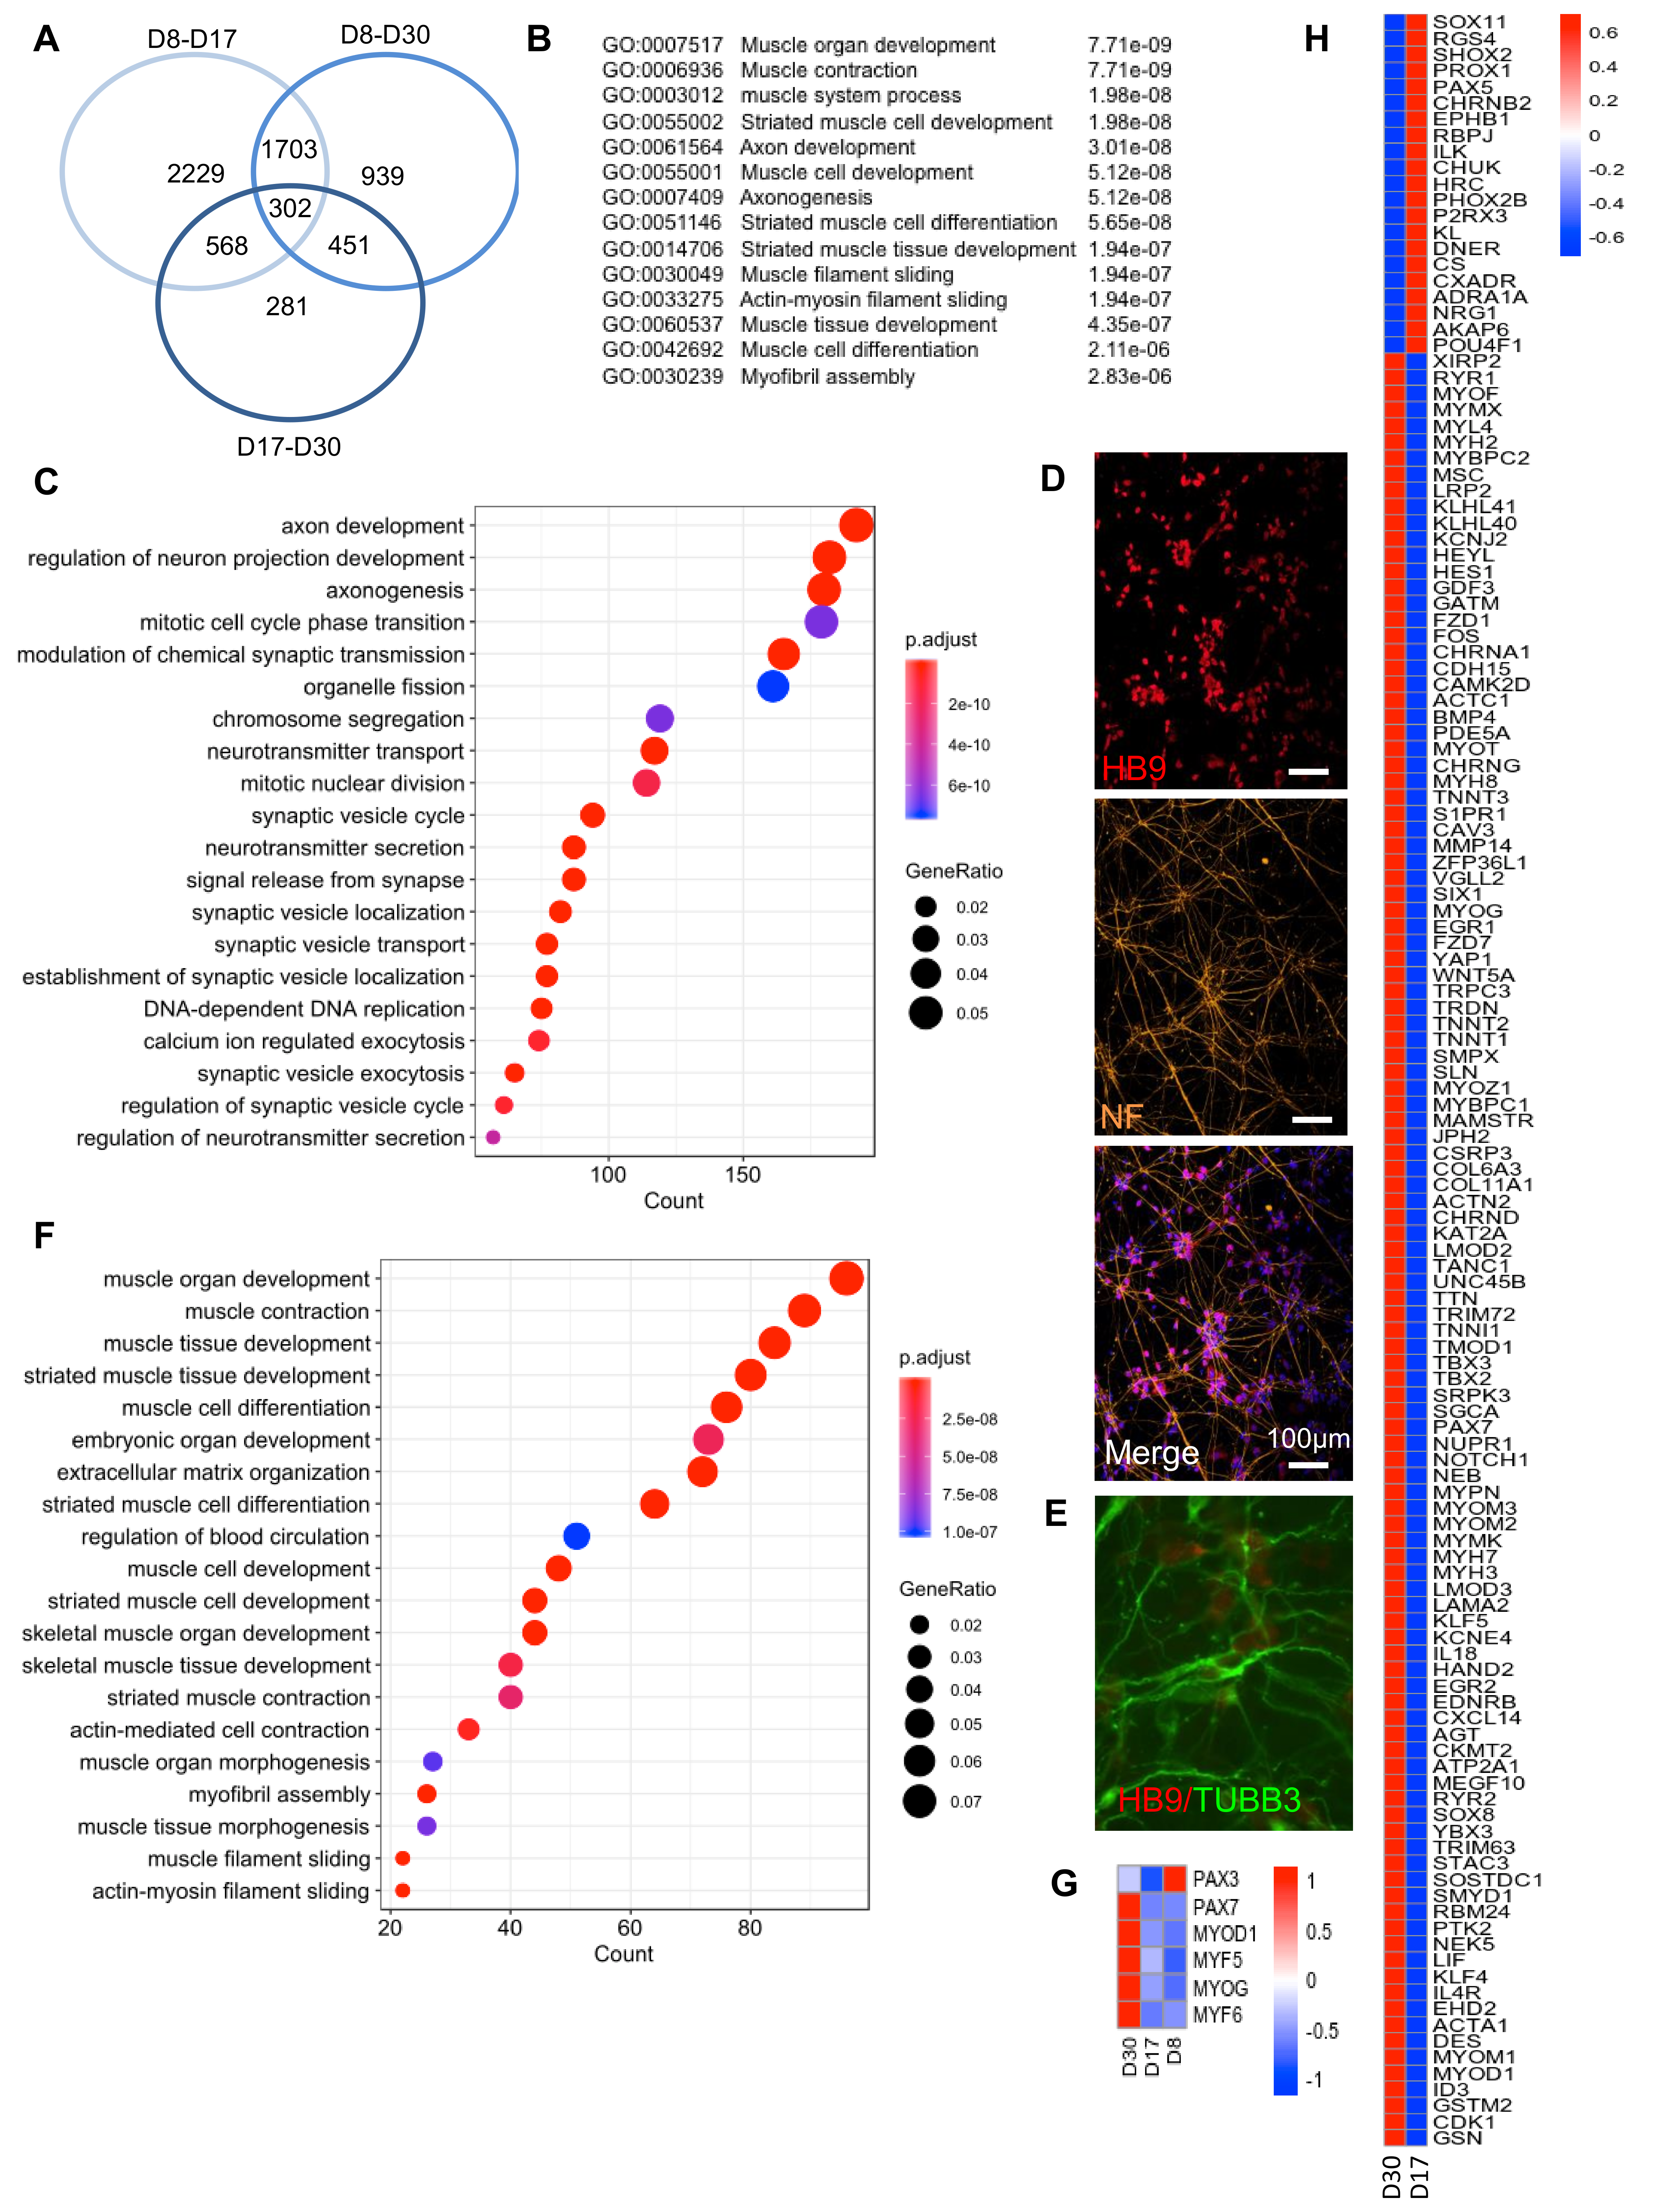
2.5. Transcriptomic Profiling Showed a Two-Phase Process with Induction of Neuronal Differentiation followed by Induction of the Myogenic Program
2.6. Myogenic and Neuronal Specification and Long-Term Persistence of PAX7+ Cells
2.7. Months-Long Persistence of Muscle and Motoneurons Signature
2.8. Response to Pharmaceutical Drugs
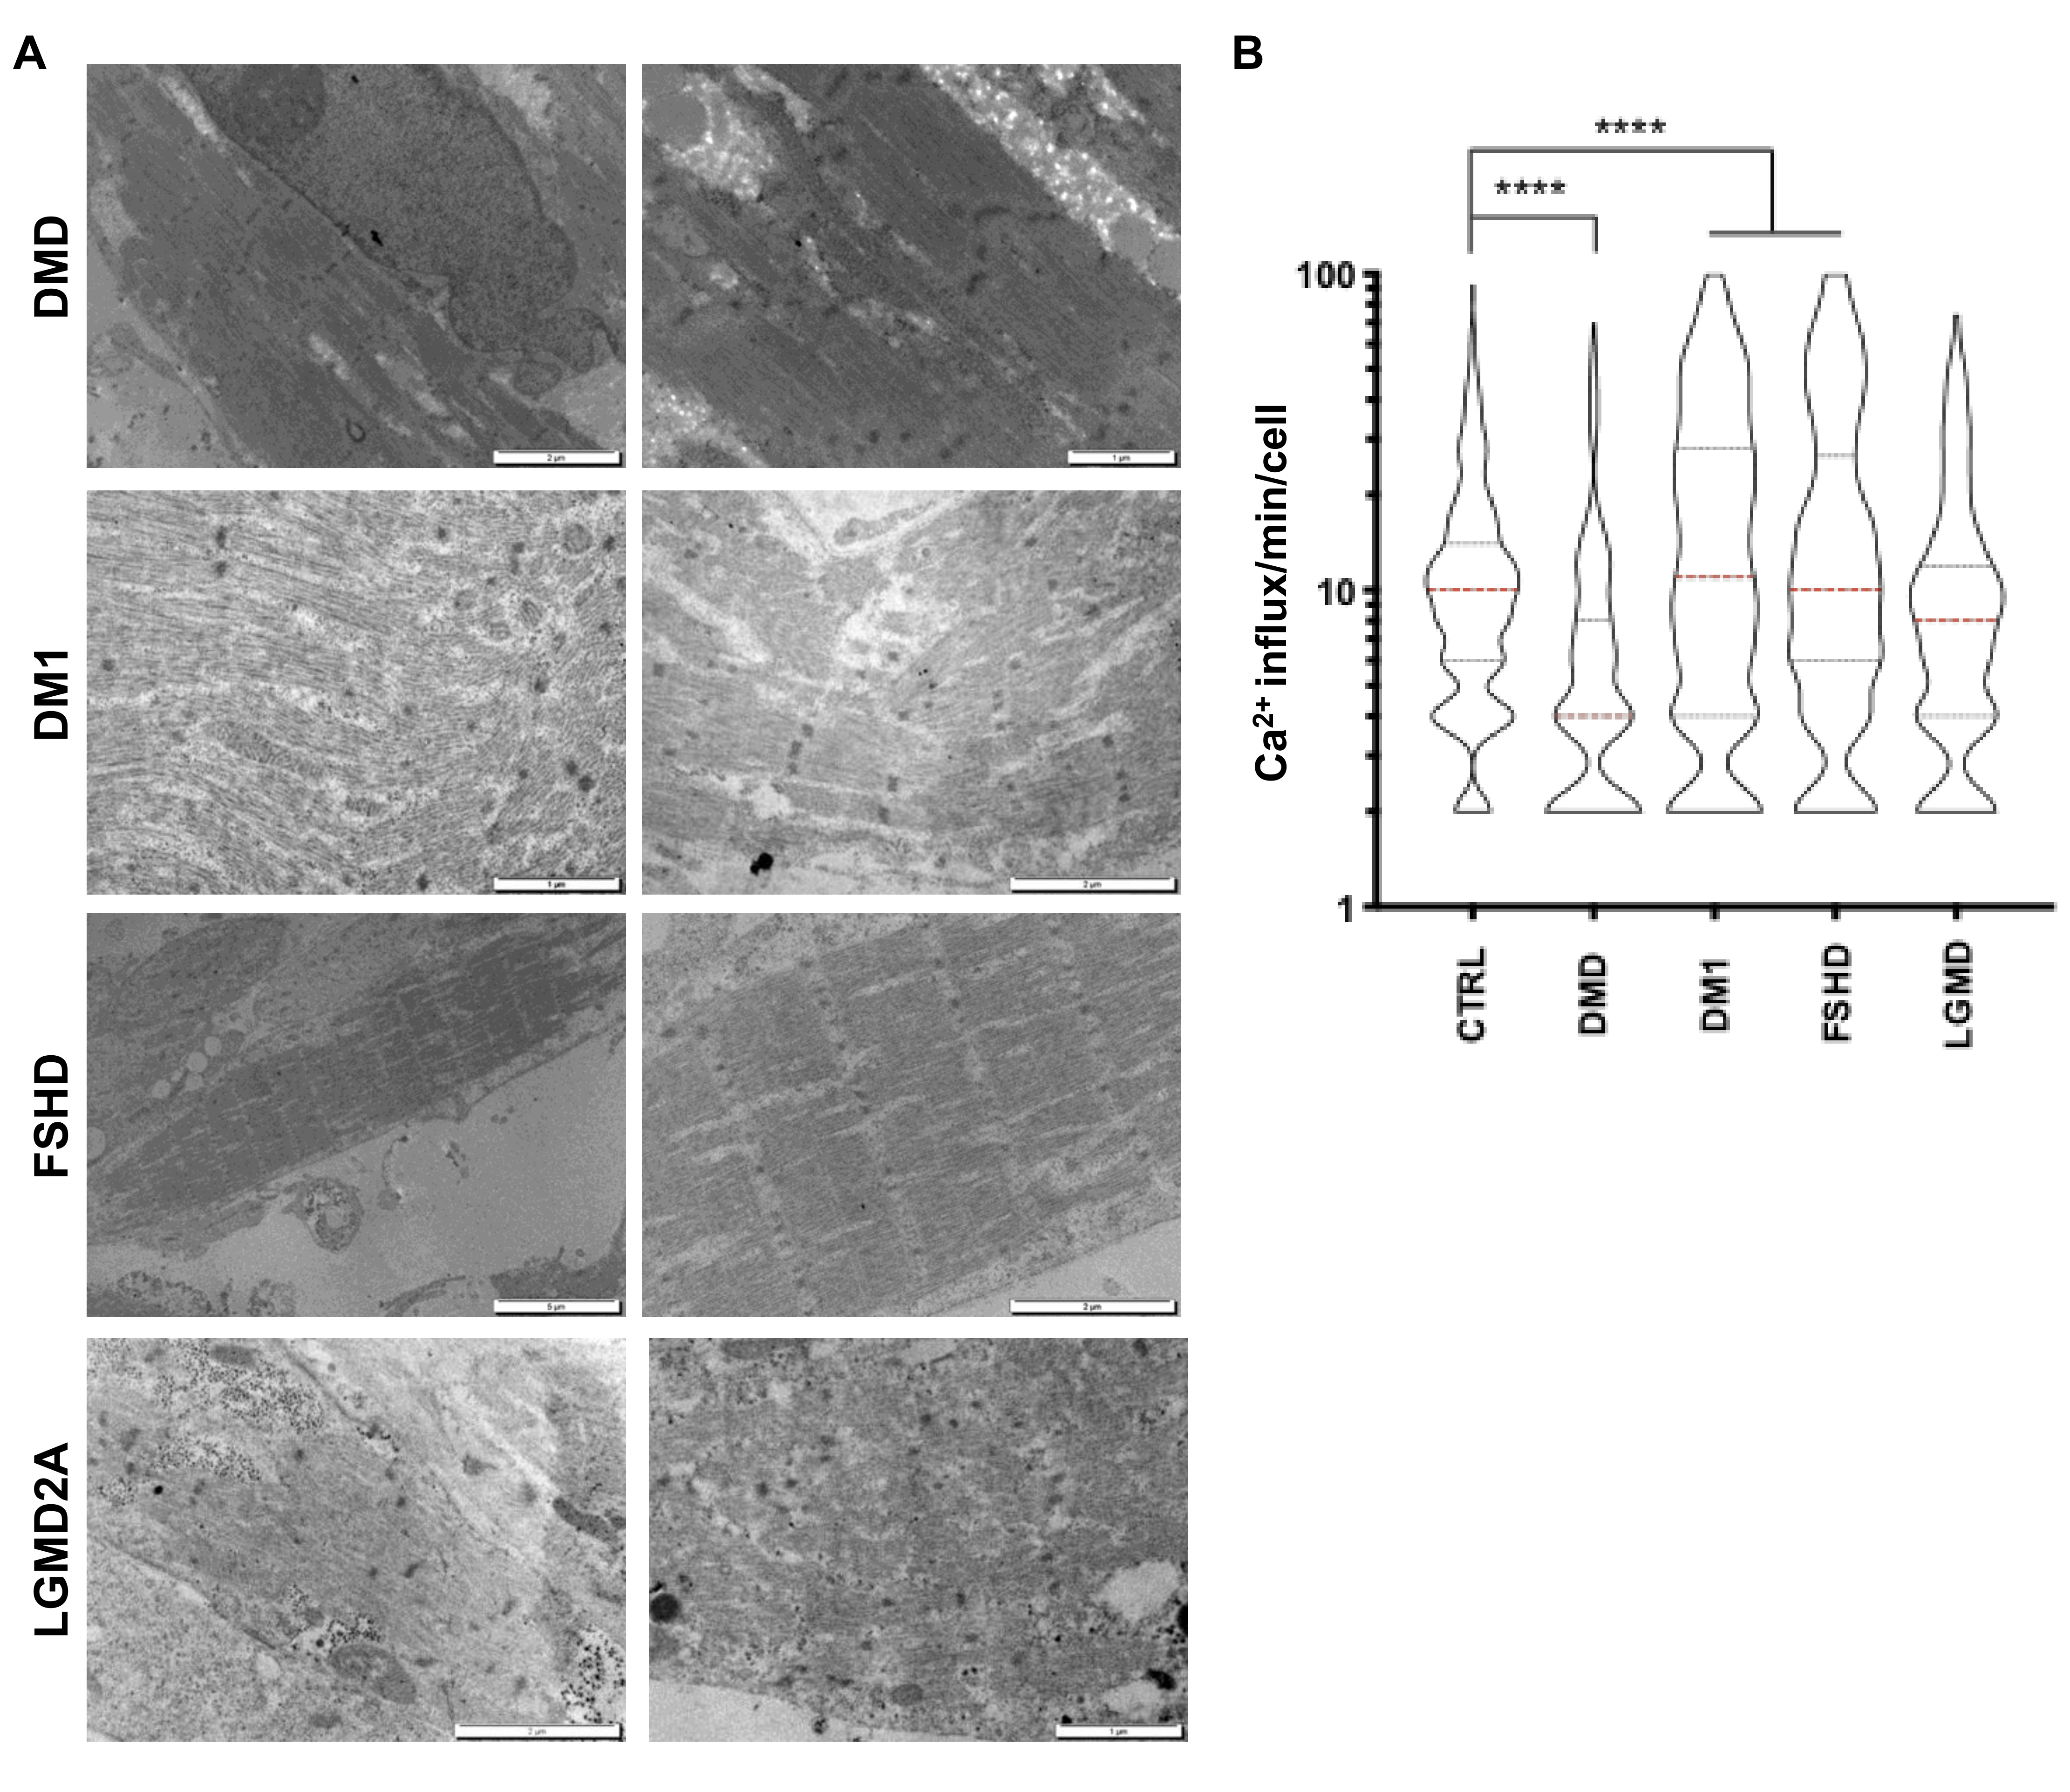
2.9. HiPSC-Derived Muscle Cells for Modeling Neuromuscular Disorders
3. Discussion
Supplementary Materials
Author Contributions
Funding
Acknowledgments
Conflicts of Interest
References
- Ortiz-Vitali, J.L.; Darabi, R. Ipscs as a platform for disease modeling, drug screening, and personalized therapy in muscular dystrophies. Cells 2019, 8, 20. [Google Scholar] [CrossRef] [PubMed]
- Darabi, R.; Gehlbach, K.; Bachoo, R.M.; Kamath, S.; Osawa, M.; Kamm, K.E.; Kyba, M.; Perlingeiro, R.C. Functional skeletal muscle regeneration from differentiating embryonic stem cells. Nat. Med. 2008, 14, 134–143. [Google Scholar] [CrossRef] [PubMed]
- Maffioletti, S.M.; Gerli, M.F.; Ragazzi, M.; Dastidar, S.; Benedetti, S.; Loperfido, M.; VandenDriessche, T.; Chuah, M.K.; Tedesco, F.S. Efficient derivation and inducible differentiation of expandable skeletal myogenic cells from human es and patient-specific ips cells. Nat. Protoc. 2015, 10, 941–958. [Google Scholar] [CrossRef] [PubMed]
- Pawlowski, M.; Ortmann, D.; Bertero, A.; Tavares, J.M.; Pedersen, R.A.; Vallier, L.; Kotter, M.R.N. Inducible and deterministic forward programming of human pluripotent stem cells into neurons, skeletal myocytes, and oligodendrocytes. Stem Cell Rep. 2017, 8, 803–812. [Google Scholar] [CrossRef] [PubMed]
- Barberi, T.; Bradbury, M.; Dincer, Z.; Panagiotakos, G.; Socci, N.D.; Studer, L. Derivation of engraftable skeletal myoblasts from human embryonic stem cells. Nat. Med. 2007, 13, 642–648. [Google Scholar] [CrossRef] [PubMed]
- Caron, L.; Kher, D.; Lee, K.L.; McKernan, R.; Dumevska, B.; Hidalgo, A.; Li, J.; Yang, H.; Main, H.; Ferri, G.; et al. A human pluripotent stem cell model of facioscapulohumeral muscular dystrophy-affected skeletal muscles. Stem Cells Transl. Med. 2016, 5, 1145–1161. [Google Scholar] [CrossRef]
- Chal, J.; Oginuma, M.; al Tanoury, Z.; Gobert, B.; Sumara, O.; Hick, A.; Bousson, F.; Zidouni, Y.; Mursch, C.; Moncuquet, P.; et al. Differentiation of pluripotent stem cells to muscle fiber to model duchenne muscular dystrophy. Nat. Biotechnol. 2015, 33, 962–969. [Google Scholar] [CrossRef]
- Xi, H.; Fujiwara, W.; Gonzalez, K.; Jan, M.; Liebscher, S.; van Handel, B.; Schenke-Layland, K.; Pyle, A.D. In vivo human somitogenesis guides somite development from hpscs. Cell Rep. 2017, 18, 1573–1585. [Google Scholar] [CrossRef]
- Hicks, M.; Pyle, A. The path from pluripotency to skeletal muscle: Developmental myogenesis guides the way. Cell Stem Cell 2015, 17, 255–257. [Google Scholar] [CrossRef][Green Version]
- Selvaraj, S.; Kyba, M.; Perlingeiro, R.C.R. Pluripotent stem cell-based therapeutics for muscular dystrophies. Trends Mol. Med. 2015, 25, 803–816. [Google Scholar] [CrossRef]
- Sakurai, H.; Okawa, Y.; Inami, Y.; Nishio, N.; Isobe, K. Paraxial mesodermal progenitors derived from mouse embryonic stem cells contribute to muscle regeneration via differentiation into muscle satellite cells. Stem Cells 2008, 26, 1865–1873. [Google Scholar] [CrossRef]
- Goudenege, S.; Lebel, C.; Huot, N.B.; Dufour, C.; Fujii, I.; Gekas, J.; Rousseau, J.; Tremblay, J.P. Myoblasts derived from normal hescs and dystrophic hipscs efficiently fuse with existing muscle fibers following transplantation. Mol. Ther. 2012, 20, 2153–2167. [Google Scholar] [CrossRef] [PubMed]
- Hosoyama, T.; McGivern, J.V.; van Dyke, J.M.; Ebert, A.D.; Suzuki, M. Derivation of myogenic progenitors directly from human pluripotent stem cells using a sphere-based culture. Stem. Cells Transl. Med. 2014, 3, 564–574. [Google Scholar] [CrossRef] [PubMed]
- Iacovino, M.; Bosnakovski, D.; Fey, H.; Rux, D.; Bajwa, G.; Mahen, E.; Mitanoska, A.; Xu, Z.; Kyba, M. Inducible cassette exchange: A rapid and efficient system enabling conditional gene expression in embryonic stem and primary cells. Stem Cells 2011, 29, 1580–1588. [Google Scholar] [CrossRef]
- Maury, Y.; Come, J.; Piskorowski, R.A.; Salah-Mohellibi, N.; Chevaleyre, V.; Peschanski, M.; Martinat, C.; Nedelec, S. Combinatorial analysis of developmental cues efficiently converts human pluripotent stem cells into multiple neuronal subtypes. Nat. Biotechnol. 2015, 33, 89–96. [Google Scholar] [CrossRef] [PubMed]
- Luduena, R.F. Are tubulin isotypes functionally significant. Mol. Biol. Cell 1993, 4, 445–457. [Google Scholar] [CrossRef] [PubMed]
- Zhang, Q.; Vashisht, A.A.; O’Rourke, J.; Corbel, S.Y.; Moran, R.; Romero, A.; Miraglia, L.; Zhang, J.; Durrant, E.; Schmedt, C.; et al. The microprotein minion controls cell fusion and muscle formation. Nat. Commun. 2017, 8, 15664. [Google Scholar] [CrossRef]
- Millay, D.P.; O’Rourke, J.R.; Sutherland, L.B.; Bezprozvannaya, S.; Shelton, J.M.; Bassel-Duby, R.; Olson, E.N. Myomaker is a membrane activator of myoblast fusion and muscle formation. Nature 2013, 499, 301–305. [Google Scholar] [CrossRef]
- Gillies, R.A.; Lieber, R.L. Structure and function of the skeletal muscle extracellular matrix. Muscle Nerve 2011, 44, 318–331. [Google Scholar] [CrossRef]
- Logigian, E.L.; Martens, W.B.; Moxley, R.T.t.; McDermott, M.P.; Dilek, N.; Wiegner, A.W.; Pearson, A.T.; Barbieri, C.A.; Annis, C.L.; Thornton, C.A.; et al. Mexiletine is an effective antimyotonia treatment in myotonic dystrophy type 1. Neurology 2010, 74, 1441–1448. [Google Scholar] [CrossRef]
- Reilich, P.; Schramm, N.; Schoser, B.; Schneiderat, P.; Strigl-Pill, N.; Muller-Hocker, J.; Kress, W.; Ferbert, A.; Rudnik-Schoneborn, S.; Noth, J.; et al. Facioscapulohumeral muscular dystrophy presenting with unusual phenotypes and atypical morphological features of vacuolar myopathy. J. Neurol. 2010, 257, 1108–1118. [Google Scholar] [CrossRef] [PubMed]
- Ludatscher, R.M.; Kerner, H.; Amikam, S.; Gellei, B. Myotonia dystrophica with heart involvement: An electron microscopic study of skeletal, cardiac, and smooth muscle. J. Clin. Pathol. 1978, 31, 1057–1064. [Google Scholar] [CrossRef] [PubMed]
- Nadaj-Pakleza, A.; Lusakowska, A.; Sulek-Piatkowska, A.; Krysa, W.; Rajkiewicz, M.; Kwiecinski, H.; Kaminska, A. Muscle pathology in myotonic dystrophy: Light and electron microscopic investigation in eighteen patients. Folia Morphol. 2011, 70, 121–129. [Google Scholar]
- Kramerova, I.; Kudryashova, E.; Tidball, J.G.; Spencer, M.J. Null mutation of calpain 3 (p94) in mice causes abnormal sarcomere formation in vivo and in vitro. Human Mol. Genet. 2004, 13, 1373–1388. [Google Scholar] [CrossRef]
- Vainzof, M.; de Paula, F.; Tsanaclis, A.M.; Zatz, M. The effect of calpain 3 deficiency on the pattern of muscle degeneration in the earliest stages of lgmd2a. J. Clin. Pathol. 2003, 56, 624–626. [Google Scholar] [CrossRef] [PubMed]
- Awaya, T.; Kato, T.; Mizuno, Y.; Chang, H.; Niwa, A.; Umeda, K.; Nakahata, T.; Heike, T. Selective development of myogenic mesenchymal cells from human embryonic and induced pluripotent stem cells. PLoS ONE 2012, 7, e51638. [Google Scholar] [CrossRef] [PubMed]
- Darabi, R.; Santos, F.N.; Perlingeiro, R.C. The therapeutic potential of embryonic and adult stem cells for skeletal muscle regeneration. Stem Cell Rev. 2008, 4, 217–225. [Google Scholar] [CrossRef]
- Darabi, R.; Santos, F.N.; Filareto, A.; Pan, W.; Koene, R.; Rudnicki, M.A.; Kyba, M.; Perlingeiro, R.C. Assessment of the myogenic stem cell compartment following transplantation of pax3/pax7-induced embryonic stem cell-derived progenitors. Stem Cells 2011, 29, 777–790. [Google Scholar] [CrossRef]
- Tedesco, F.S.; Gerli, M.F.; Perani, L.; Benedetti, S.; Ungaro, F.; Cassano, M.; Antonini, S.; Tagliafico, E.; Artusi, V.; Longa, E.; et al. Transplantation of genetically corrected human ipsc-derived progenitors in mice with limb-girdle muscular dystrophy. Sci. Transl. Med. 2012, 4, 140ra89. [Google Scholar] [CrossRef]
- Abujarour, R.; Bennett, M.; Valamehr, B.; Lee, T.T.; Robinson, M.; Robbins, D.; Le, T.; Lai, K.; Flynn, P. Myogenic differentiation of muscular dystrophy-specific induced pluripotent stem cells for use in drug discovery. Stem Cells Transl. Med. 2014, 3, 149–160. [Google Scholar] [CrossRef]
- Albini, S.; Coutinho, P.; Malecova, B.; Giordani, L.; Savchenko, A.; Forcales, S.V.; Puri, P.L. Epigenetic reprogramming of human embryonic stem cells into skeletal muscle cells and generation of contractile myospheres. Cell Rep. 2013, 3, 661–670. [Google Scholar] [CrossRef] [PubMed]
- Choi, I.Y.; Lim, H.; Estrellas, K.; Mula, J.; Cohen, T.V.; Zhang, Y.; Donnelly, C.J.; Richard, J.P.; Kim, Y.J.; Kim, H.; et al. Concordant but varied phenotypes among duchenne muscular dystrophy patient-specific myoblasts derived using a human ipsc-based model. Cell Rep. 2016, 15, 2301–2312. [Google Scholar] [CrossRef] [PubMed]
- Mayeuf-Louchart, A.; Lagha, M.; Danckaert, A.; Rocancourt, D.; Relaix, F.; Vincent, S.D.; Buckingham, M. Notch regulation of myogenic versus endothelial fates of cells that migrate from the somite to the limb. Proc. Natl. Acad. Sci. USA 2014, 111, 8844–8849. [Google Scholar] [CrossRef] [PubMed]
- Jiwlawat, S.; Lynch, E.; Glaser, J.; Smit-Oistad, I.; Jeffrey, J.; van Dyke, J.M.; Suzuki, M. Differentiation and sarcomere formation in skeletal myocytes directly prepared from human induced pluripotent stem cells using a sphere-based culture. Differ. Res. Biol. Divers. 2017, 96, 70–81. [Google Scholar] [CrossRef]
- Skoglund, G.; Laine, J.; Darabi, R.; Fournier, E.; Perlingeiro, R.; Tabti, N. Physiological and ultrastructural features of human induced pluripotent and embryonic stem cell-derived skeletal myocytes in vitro. Proc. Natl. Acad. Sci. USA 2014, 111, 8275–8280. [Google Scholar] [CrossRef]
- Hicks, M.R.; Hiserodt, J.; Paras, K.; Fujiwara, W.; Eskin, A.; Jan, M.; Xi, H.; Young, C.S.; Evseenko, D.; Nelson, S.F.; et al. Erbb3 and ngfr mark a distinct skeletal muscle progenitor cell in human development and hpscs. Nat. Cell Biol. 2018, 20, 46–57. [Google Scholar] [CrossRef]
- Yoshida, M.; Kitaoka, S.; Egawa, N.; Yamane, M.; Ikeda, R.; Tsukita, K.; Amano, N.; Watanabe, A.; Morimoto, M.; Takahashi, J.; et al. Modeling the early phenotype at the neuromuscular junction of spinal muscular atrophy using patient-derived ipscs. Stem Cell Rep. 2015, 4, 561–568. [Google Scholar] [CrossRef]
- Maffioletti, S.M.; Sarcar, S.; Henderson, A.B.H.; Mannhardt, I.; Pinton, L.; Moyle, L.A.; Steele-Stallard, H.; Cappellari, O.; Wells, K.E.; Ferrari, G.; et al. Three-dimensional human ipsc-derived artificial skeletal muscles model muscular dystrophies and enable multilineage tissue engineering. Cell Rep. 2018, 23, 899–908. [Google Scholar] [CrossRef]
- Ecob-Prince, M.S.; Jenkison, M.; Butler-Browne, G.S.; Whalen, R.G. Neonatal and adult myosin heavy chain isoforms in a nerve-muscle culture system. J. Cell Biol. 1986, 103, 995–1005. [Google Scholar] [CrossRef]
- Ecob-Prince, M.; Hill, M.; Brown, W. Myosin heavy chain expression in human muscle cocultured with mouse spinal cord. J. Neurol. Sci. 1989, 90, 167–177. [Google Scholar] [CrossRef]
- Martin, N.R.; Passey, S.L.; Player, D.J.; Mudera, V.; Baar, K.; Greensmith, L.; Lewis, M.P. Neuromuscular junction formation in tissue-engineered skeletal muscle augments contractile function and improves cytoskeletal organization. Tissue Eng. Part A 2015, 21, 2595–2604. [Google Scholar] [CrossRef] [PubMed]
- Faustino Martins, J.M.; Fischer, C.; Urzi, A.; Vidal, R.; Kunz, S.; Ruffault, P.L.; Kabuss, L.; Hube, I.; Gazzerro, E.; Birchmeier, C.; et al. Self-organizing 3d human trunk neuromuscular organoids. Cell Stem Cell 2020, 26, 172–186. [Google Scholar] [CrossRef] [PubMed]
- Hughes, C.S.; Postovit, L.M.; Lajoie, G.A. Matrigel: A complex protein mixture required for optimal growth of cell culture. Proteomics 2010, 10, 1886–1890. [Google Scholar] [CrossRef] [PubMed]


© 2020 by the authors. Licensee MDPI, Basel, Switzerland. This article is an open access article distributed under the terms and conditions of the Creative Commons Attribution (CC BY) license (http://creativecommons.org/licenses/by/4.0/).
Share and Cite
Mazaleyrat, K.; Badja, C.; Broucqsault, N.; Chevalier, R.; Laberthonnière, C.; Dion, C.; Baldasseroni, L.; El-Yazidi, C.; Thomas, M.; Bachelier, R.; et al. Multilineage Differentiation for Formation of Innervated Skeletal Muscle Fibers from Healthy and Diseased Human Pluripotent Stem Cells. Cells 2020, 9, 1531. https://doi.org/10.3390/cells9061531
Mazaleyrat K, Badja C, Broucqsault N, Chevalier R, Laberthonnière C, Dion C, Baldasseroni L, El-Yazidi C, Thomas M, Bachelier R, et al. Multilineage Differentiation for Formation of Innervated Skeletal Muscle Fibers from Healthy and Diseased Human Pluripotent Stem Cells. Cells. 2020; 9(6):1531. https://doi.org/10.3390/cells9061531
Chicago/Turabian StyleMazaleyrat, Kilian, Cherif Badja, Natacha Broucqsault, Raphaël Chevalier, Camille Laberthonnière, Camille Dion, Lyla Baldasseroni, Claire El-Yazidi, Morgane Thomas, Richard Bachelier, and et al. 2020. "Multilineage Differentiation for Formation of Innervated Skeletal Muscle Fibers from Healthy and Diseased Human Pluripotent Stem Cells" Cells 9, no. 6: 1531. https://doi.org/10.3390/cells9061531
APA StyleMazaleyrat, K., Badja, C., Broucqsault, N., Chevalier, R., Laberthonnière, C., Dion, C., Baldasseroni, L., El-Yazidi, C., Thomas, M., Bachelier, R., Altié, A., Nguyen, K., Lévy, N., Robin, J. D., & Magdinier, F. (2020). Multilineage Differentiation for Formation of Innervated Skeletal Muscle Fibers from Healthy and Diseased Human Pluripotent Stem Cells. Cells, 9(6), 1531. https://doi.org/10.3390/cells9061531