A New Pathway Promotes Adaptation of Human Glioblastoma Cells to Glucose Starvation

 ,
,  , , ,
, , ,  ,
,  and
and 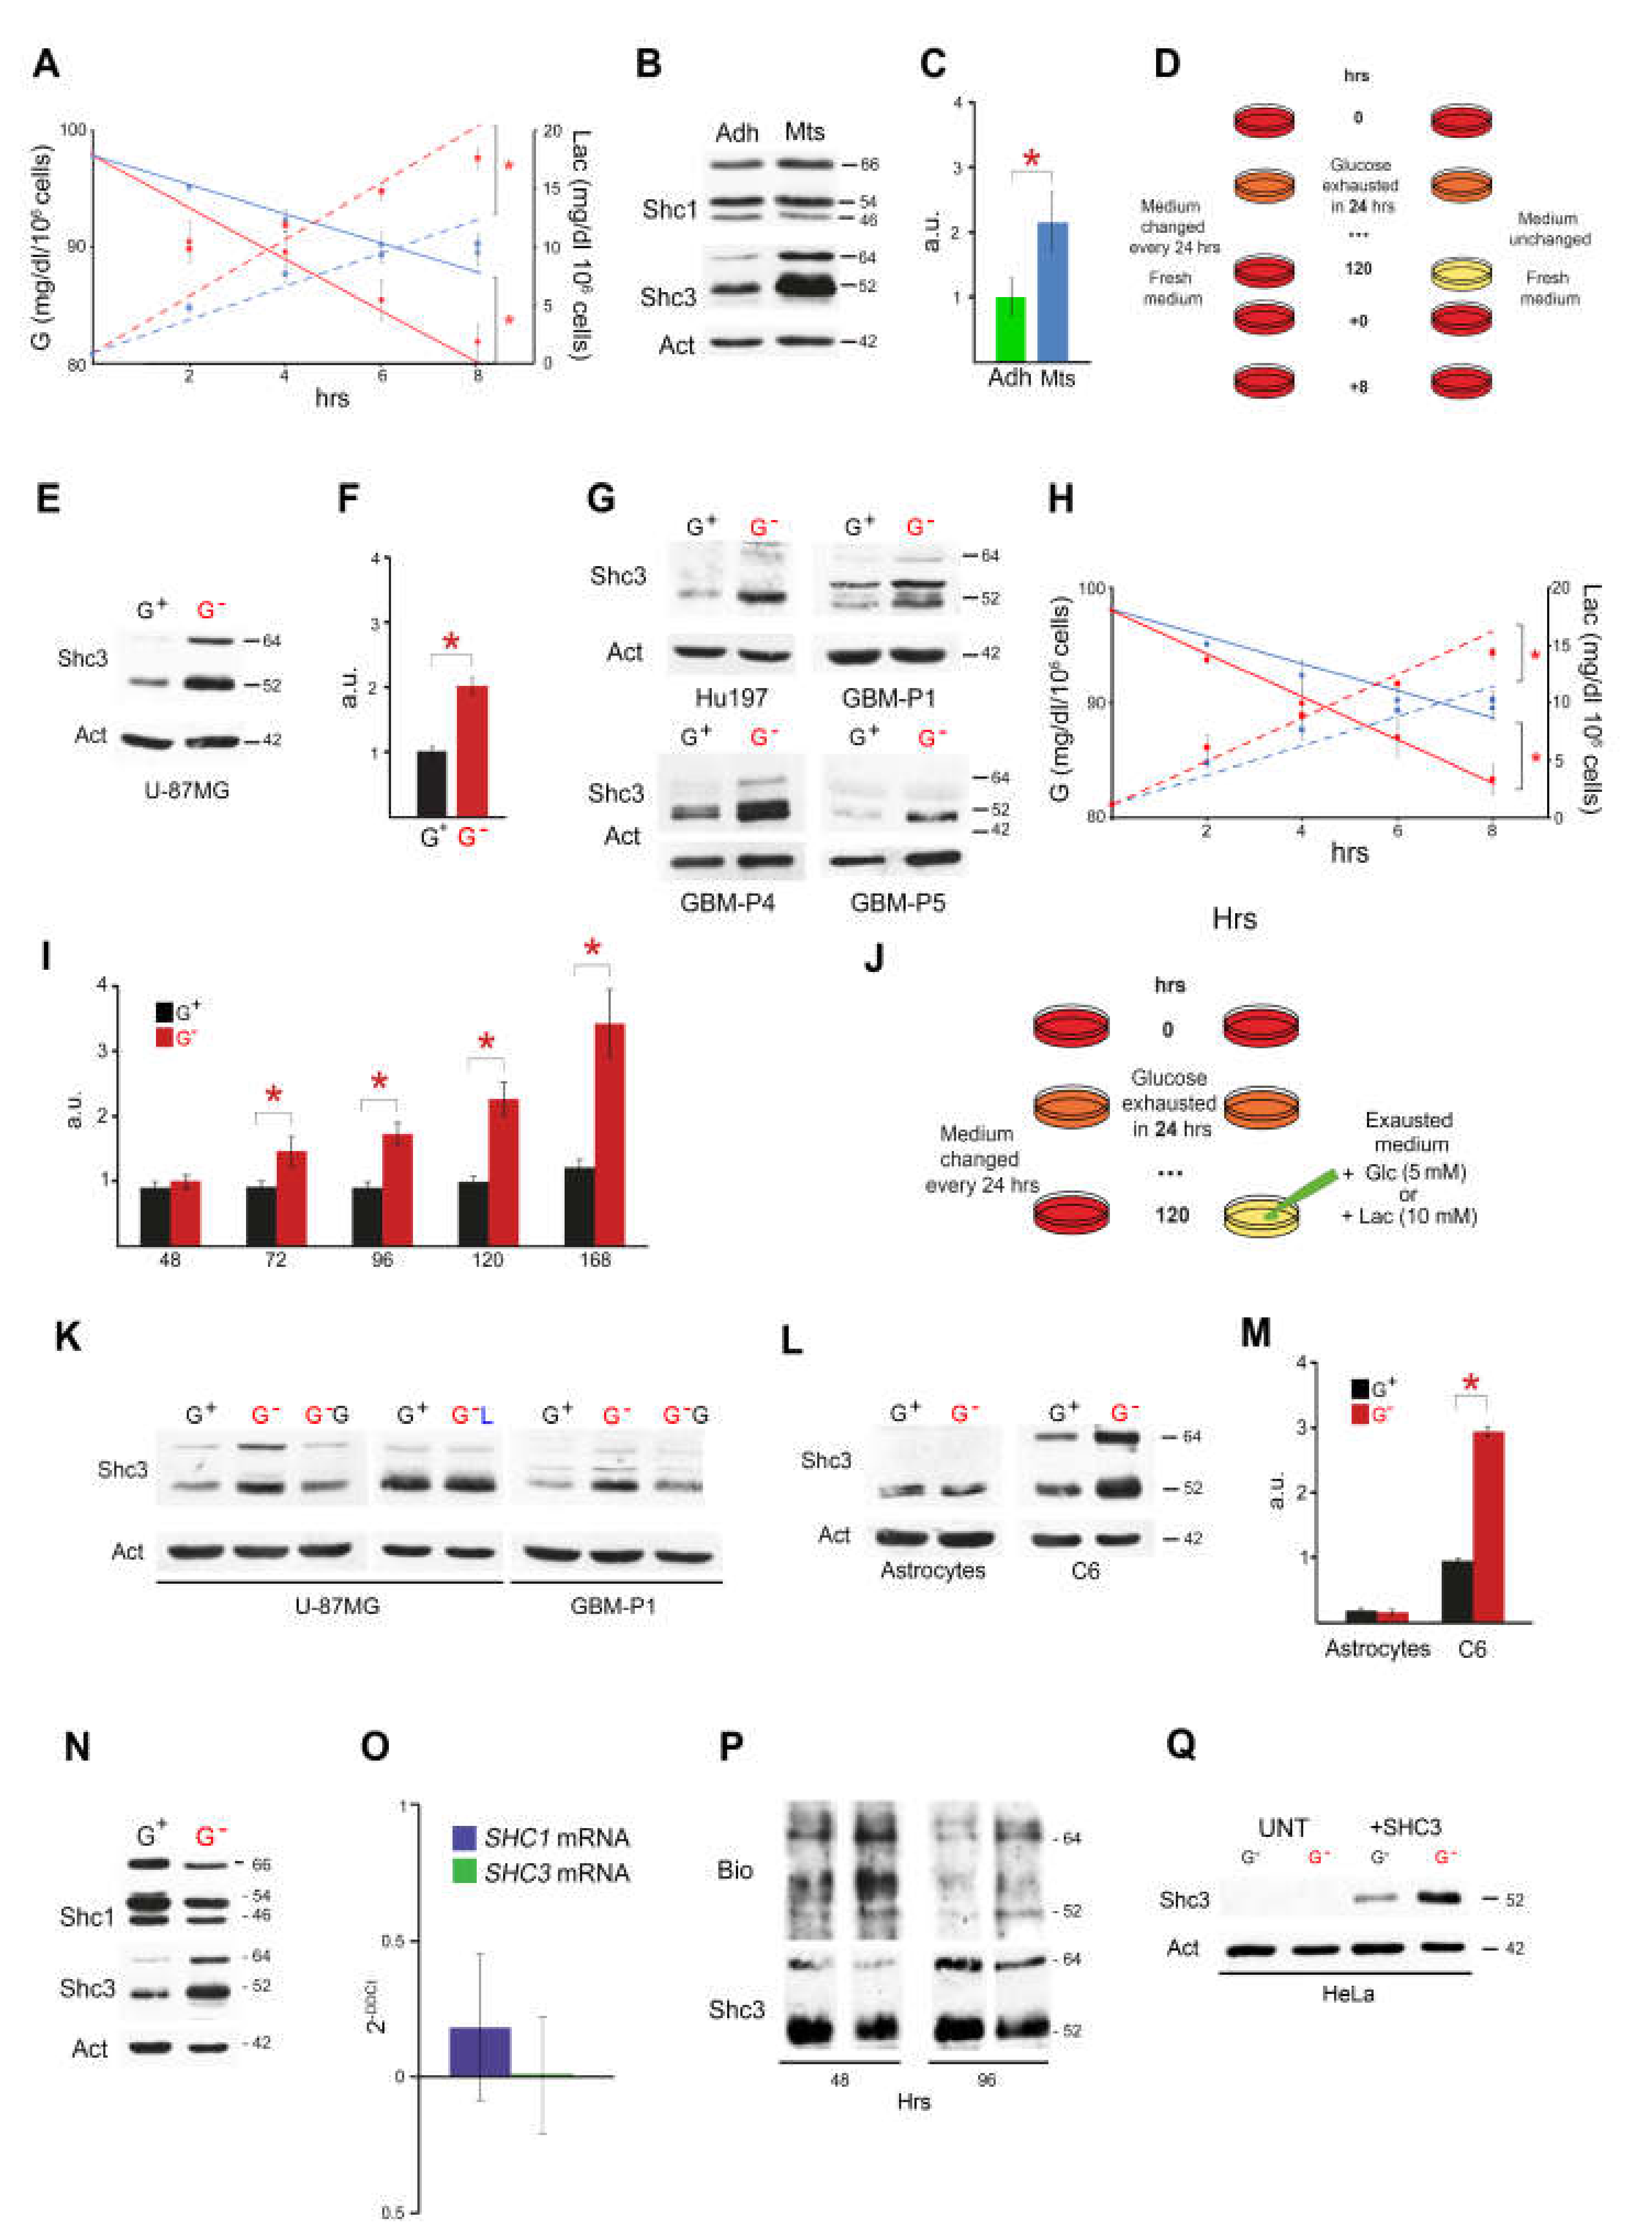
Abstract
1. Introduction
2. Materials and Methods
2.1. Cell Cultures, Vectors and Transfection Protocol
2.2. Western Blot
2.3. Measure of Glucose Consumption/Uptake and Lactate Production
2.4. Quantitative RT-PCR Analysis
2.5. Measure of SHC3 Protein Stability
2.6. Imaging Flow Cytometry Analysis
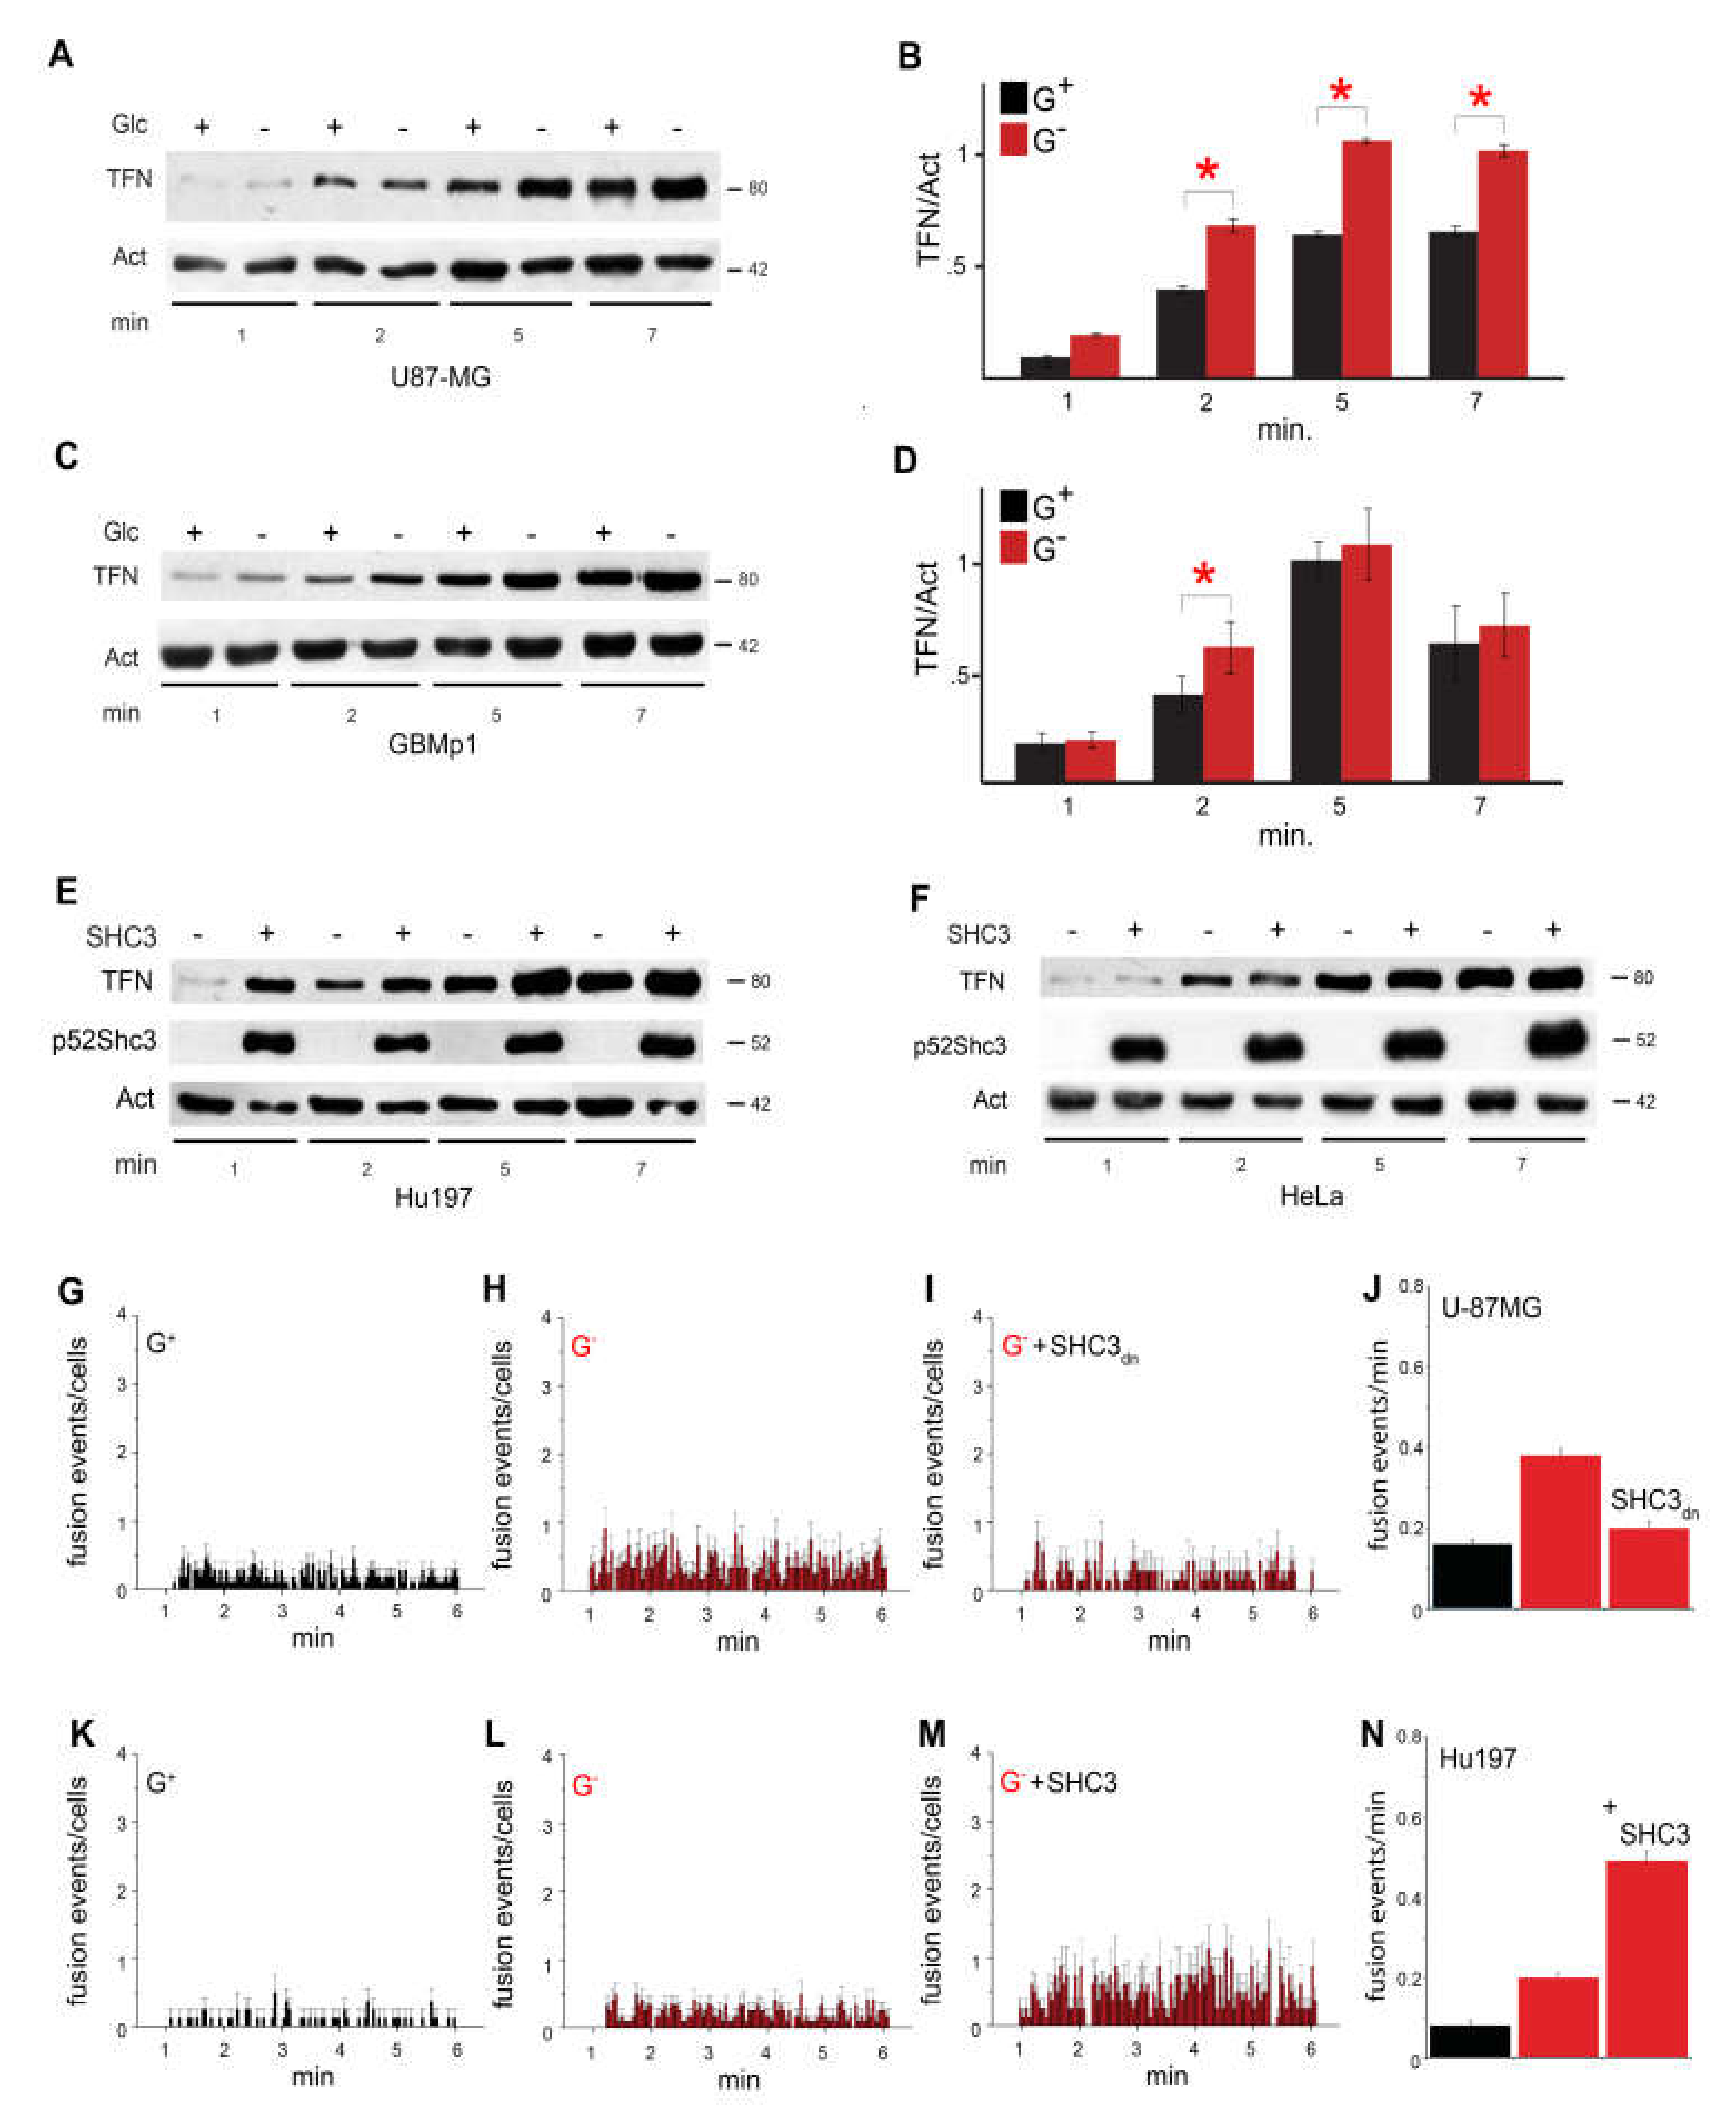
2.7. Transferrin Endocytosis
2.8. Immunohistochemistry and TIRF
2.9. Immunoprecipitation Assays
2.10. LC-MS Analysis
2.11. Immunoelectron Microscopy
2.12. Cell Fractionation and Vesicles Separation
2.13. In Vitro Inhibition of PARP-1 Activity
2.14. Statistical Analysis
3. Results
3.1. Culture Conditions Modulate Glucose Consumption, Lactate Production and SHC3 Levels
3.2. Glucose Deprivation Enhances SHC3 Protein Stability
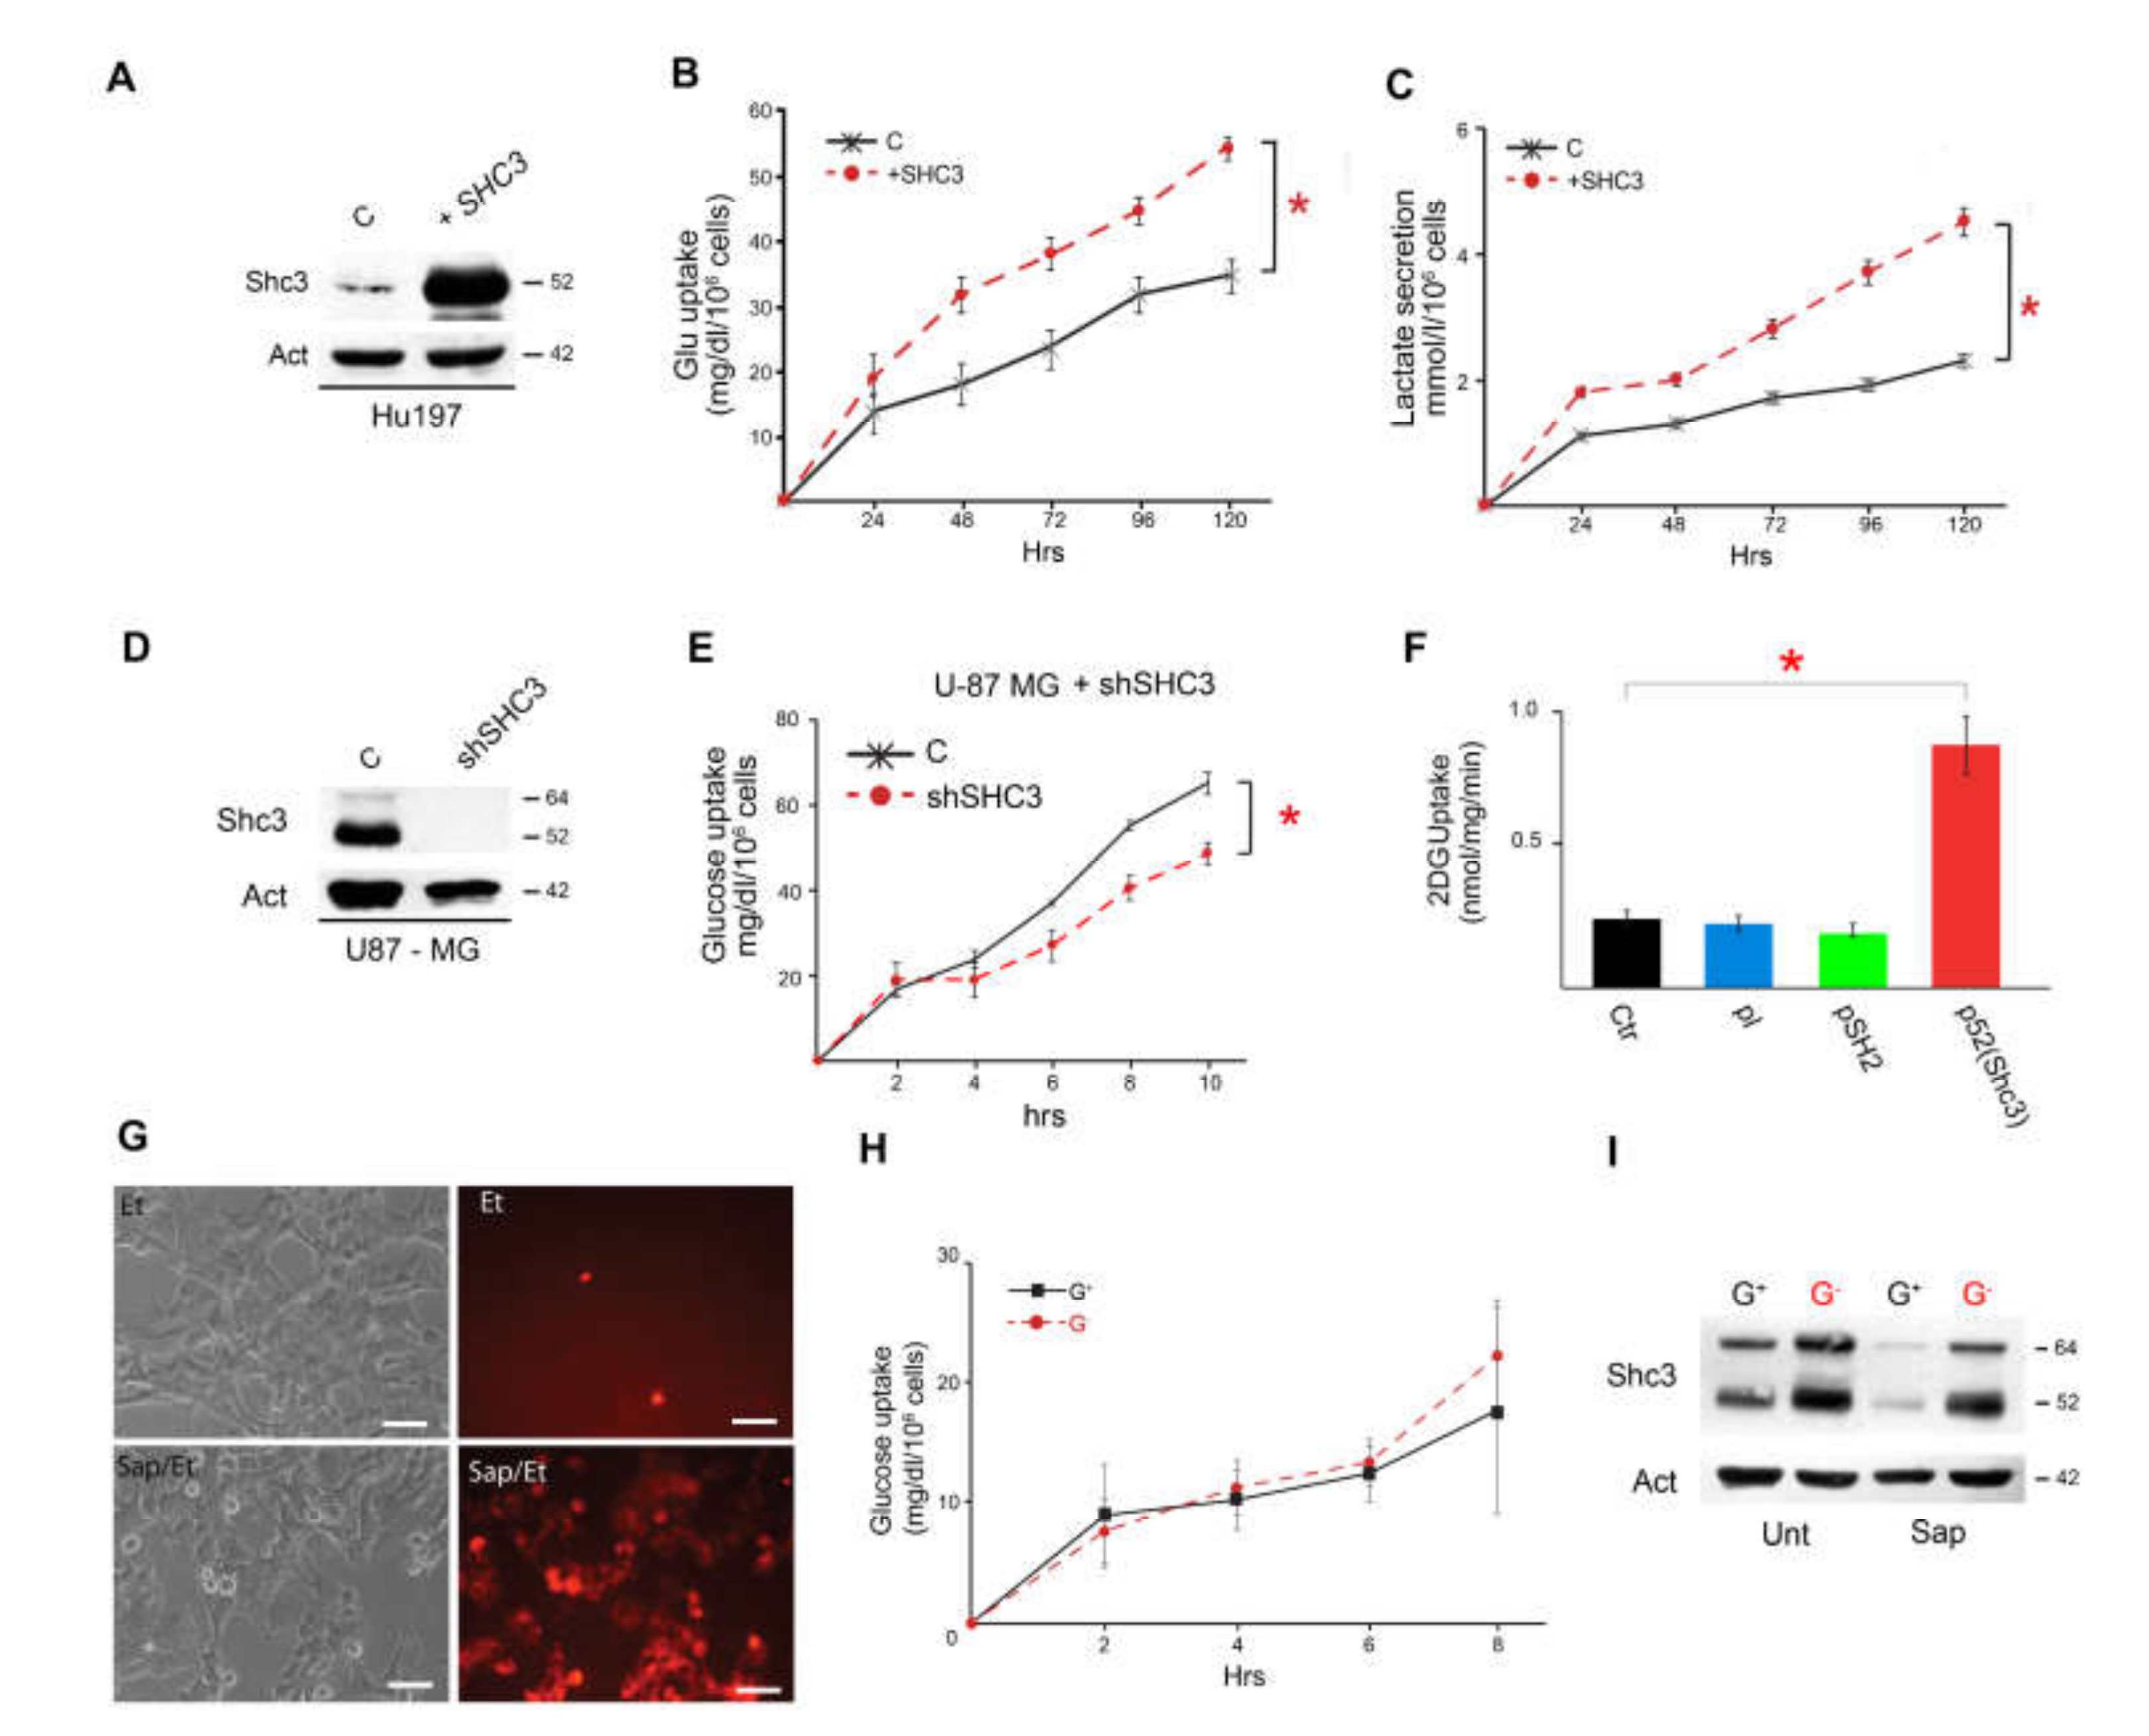
3.3. Increased SHC3 in Human Glioblastoma Cells Accelerates Glucose Consumption and Lactate Production by Increasing Glucose Uptake
3.4. Multiple Proteins Involved in Vesicle Recycling Interact with SHC3
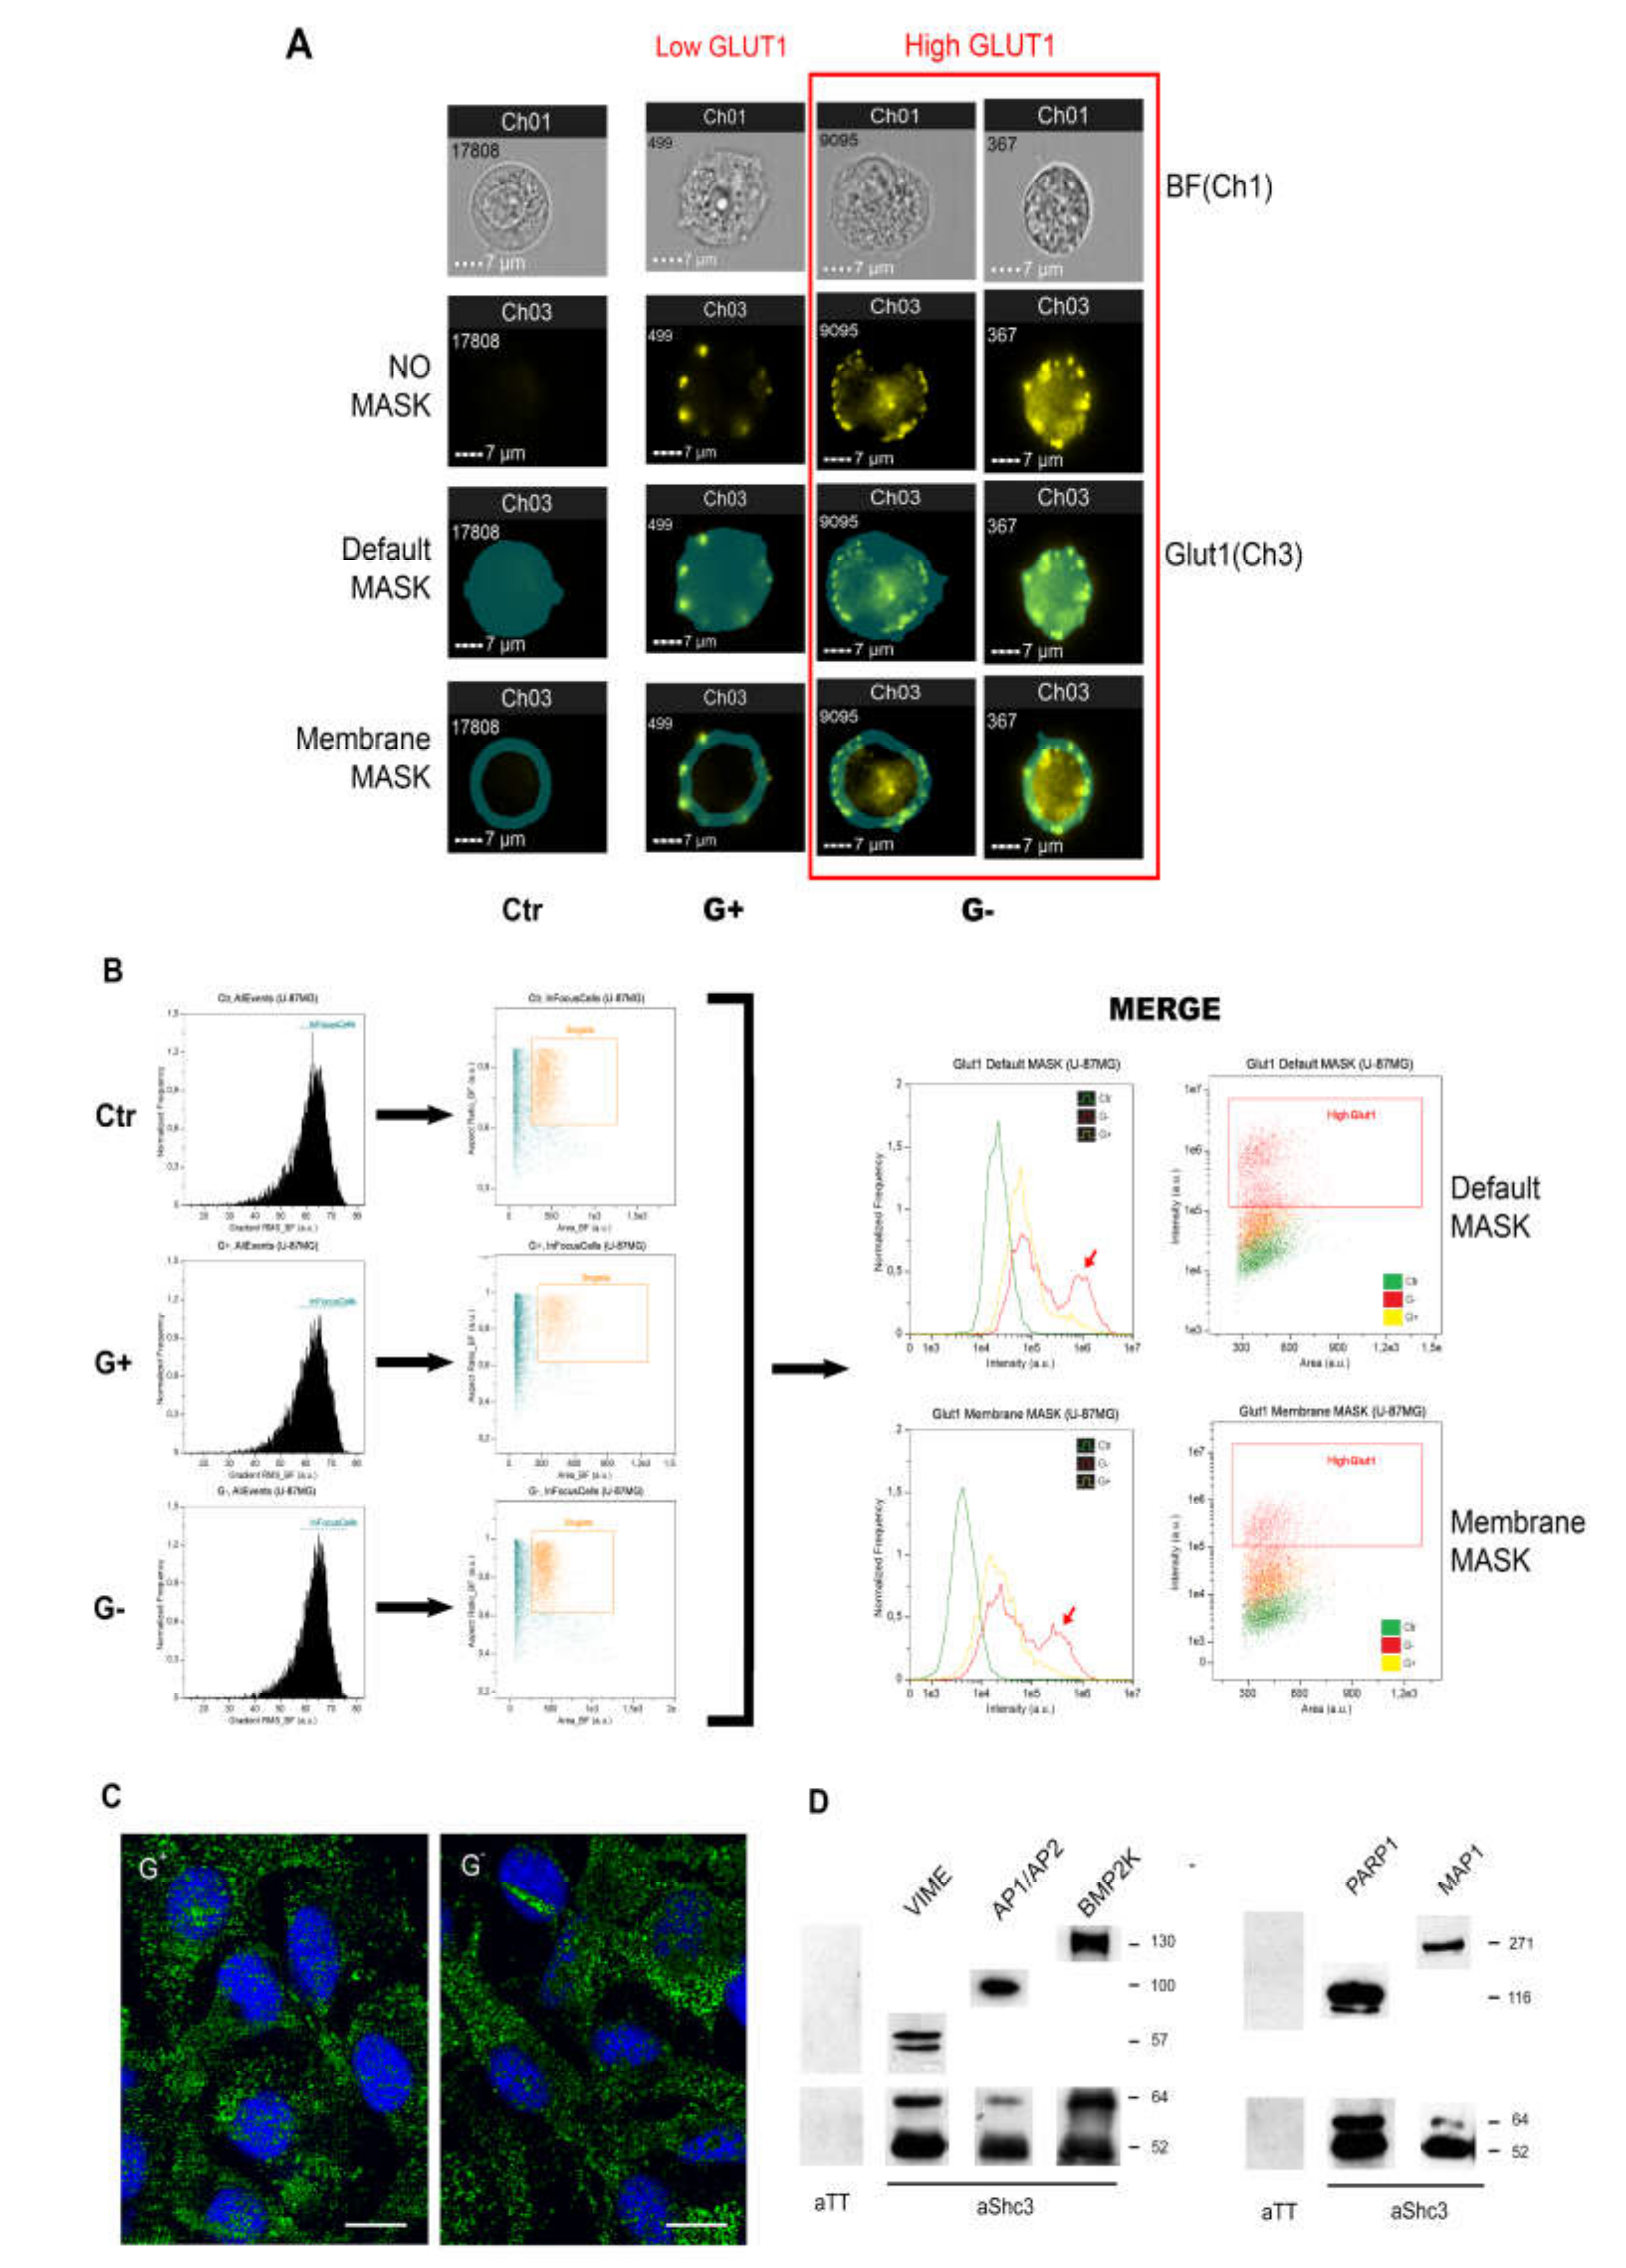
3.5. Increased Glucose Uptake Is Linked to an Increase in Vesicles Trafficking
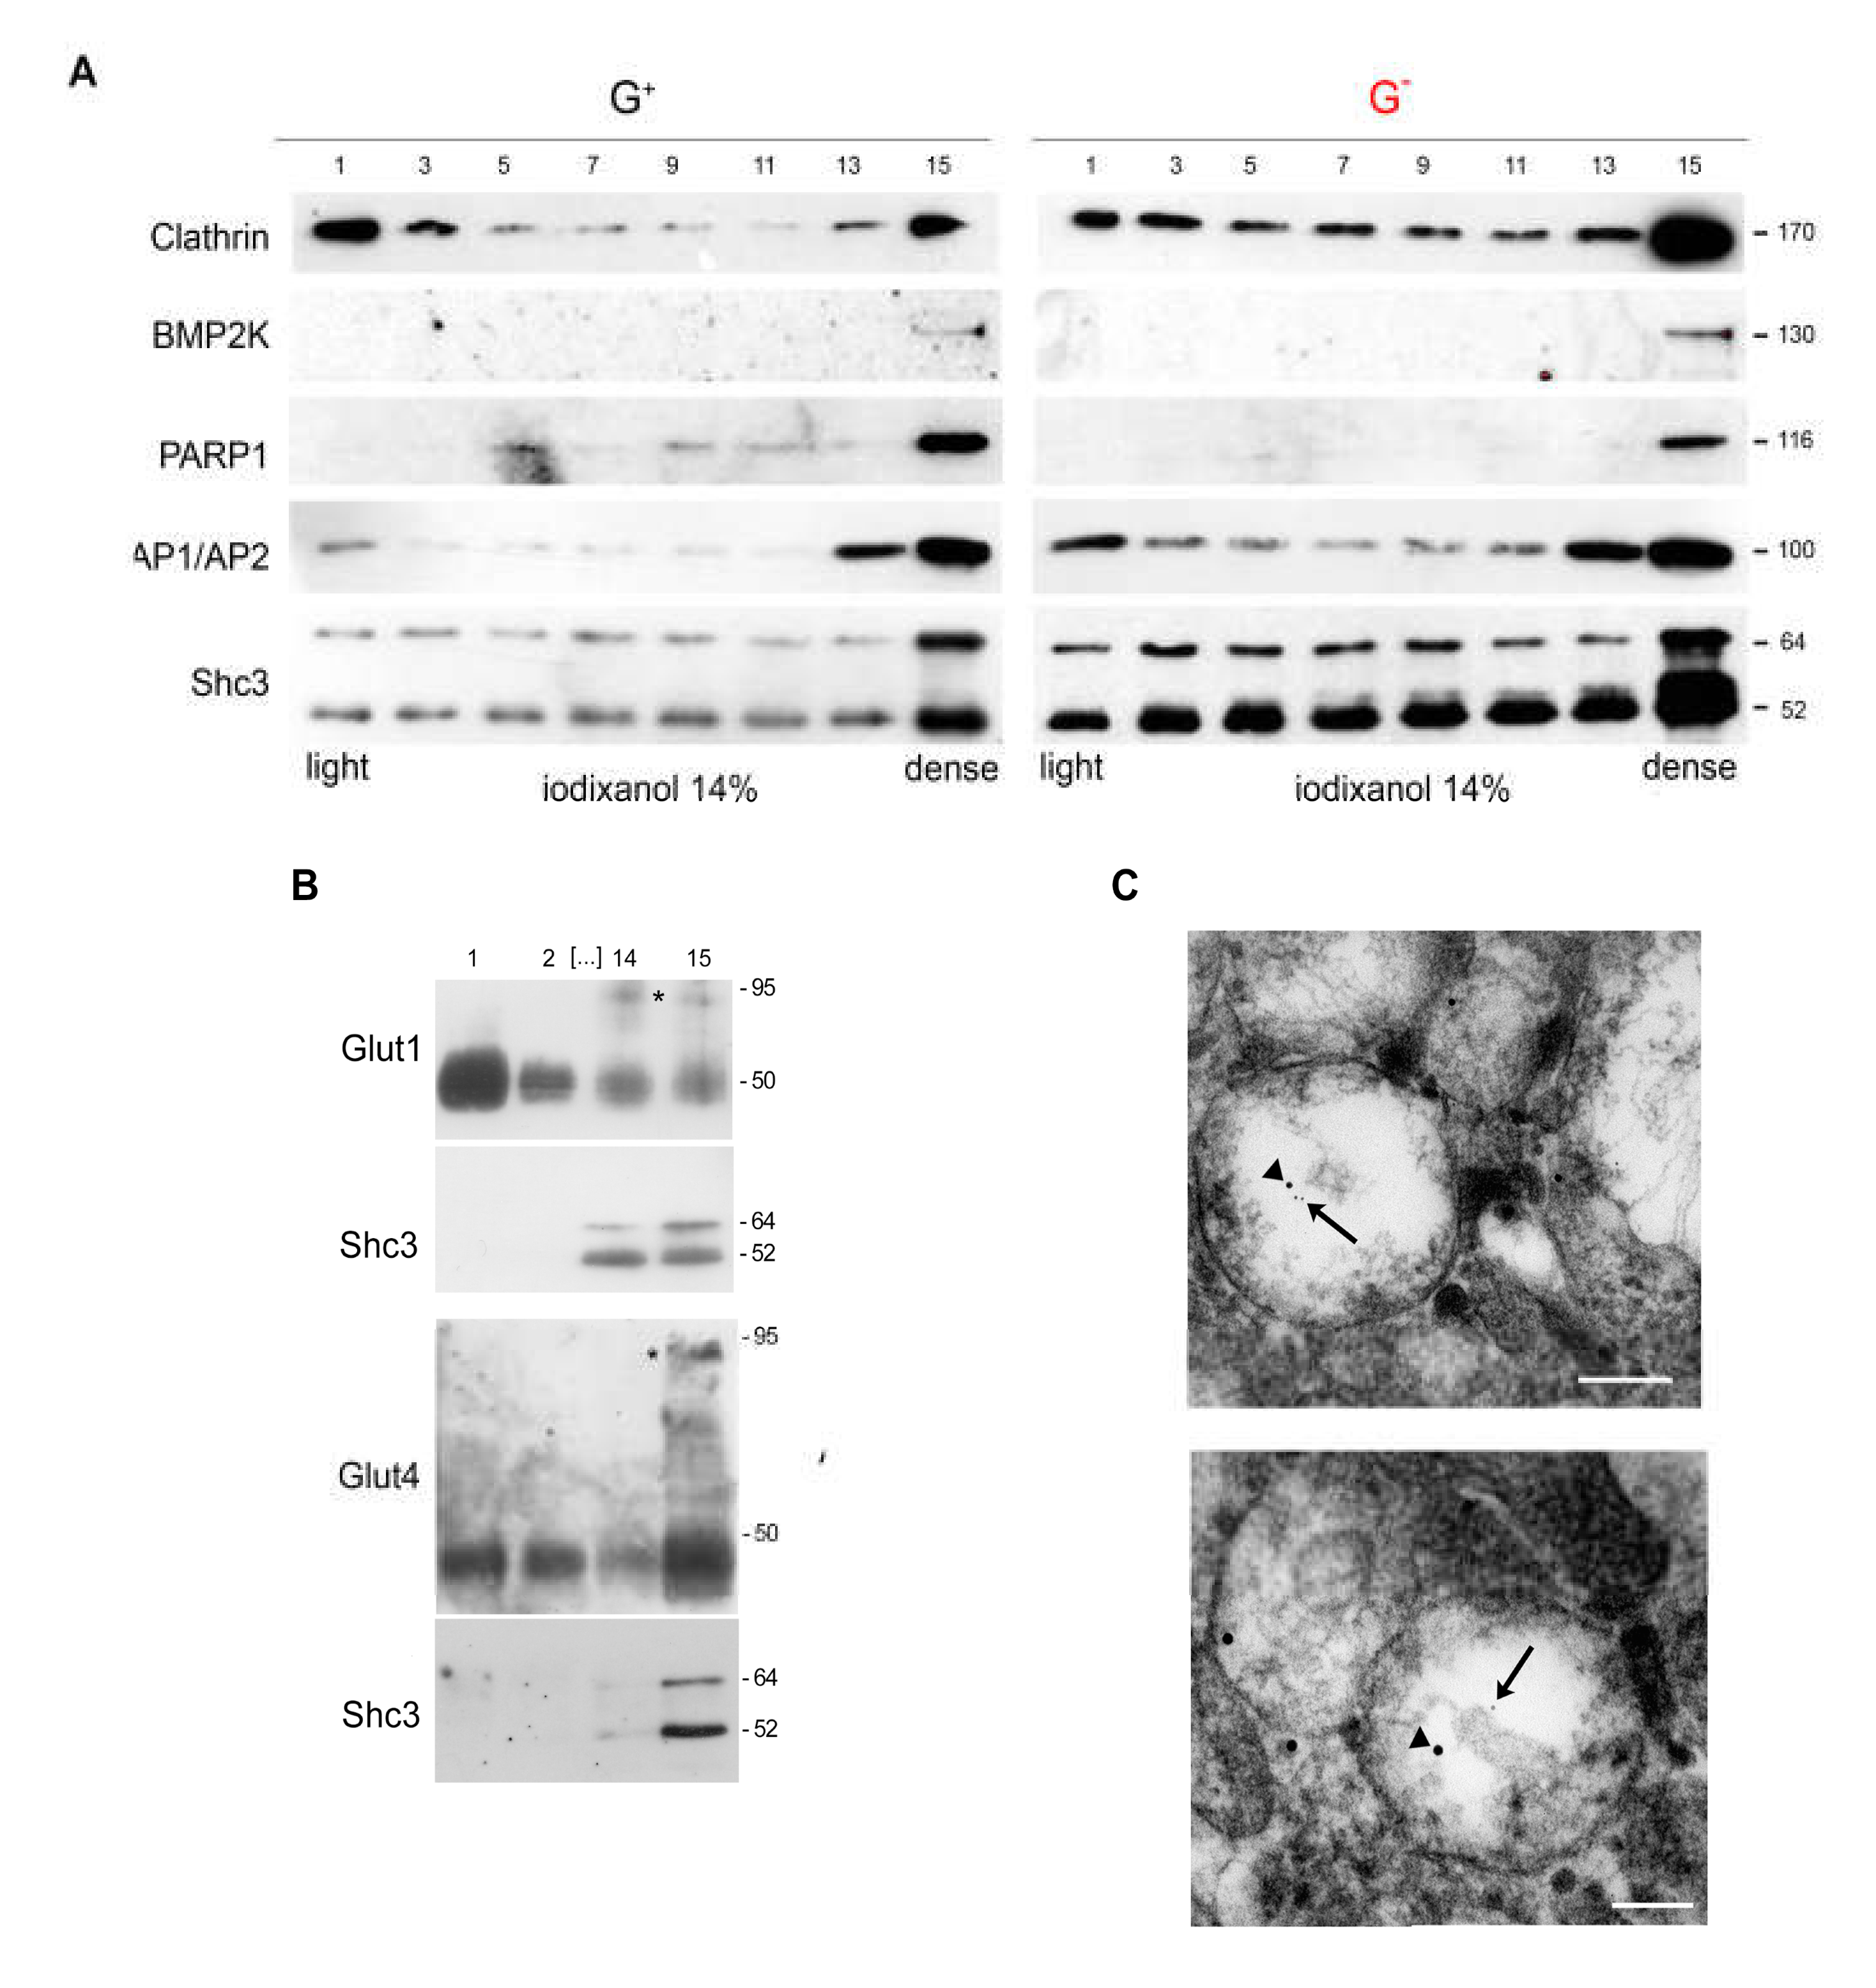
3.6. SHC3 Is Associated with Vesicles That Contain GLUT/SLC2As and Other Proteins Co-Immunoprecipitating with SHC3
3.7. Immunoelectron Microscopy Confirms That There Are Vesicles Containing both SHC3 and PARP1
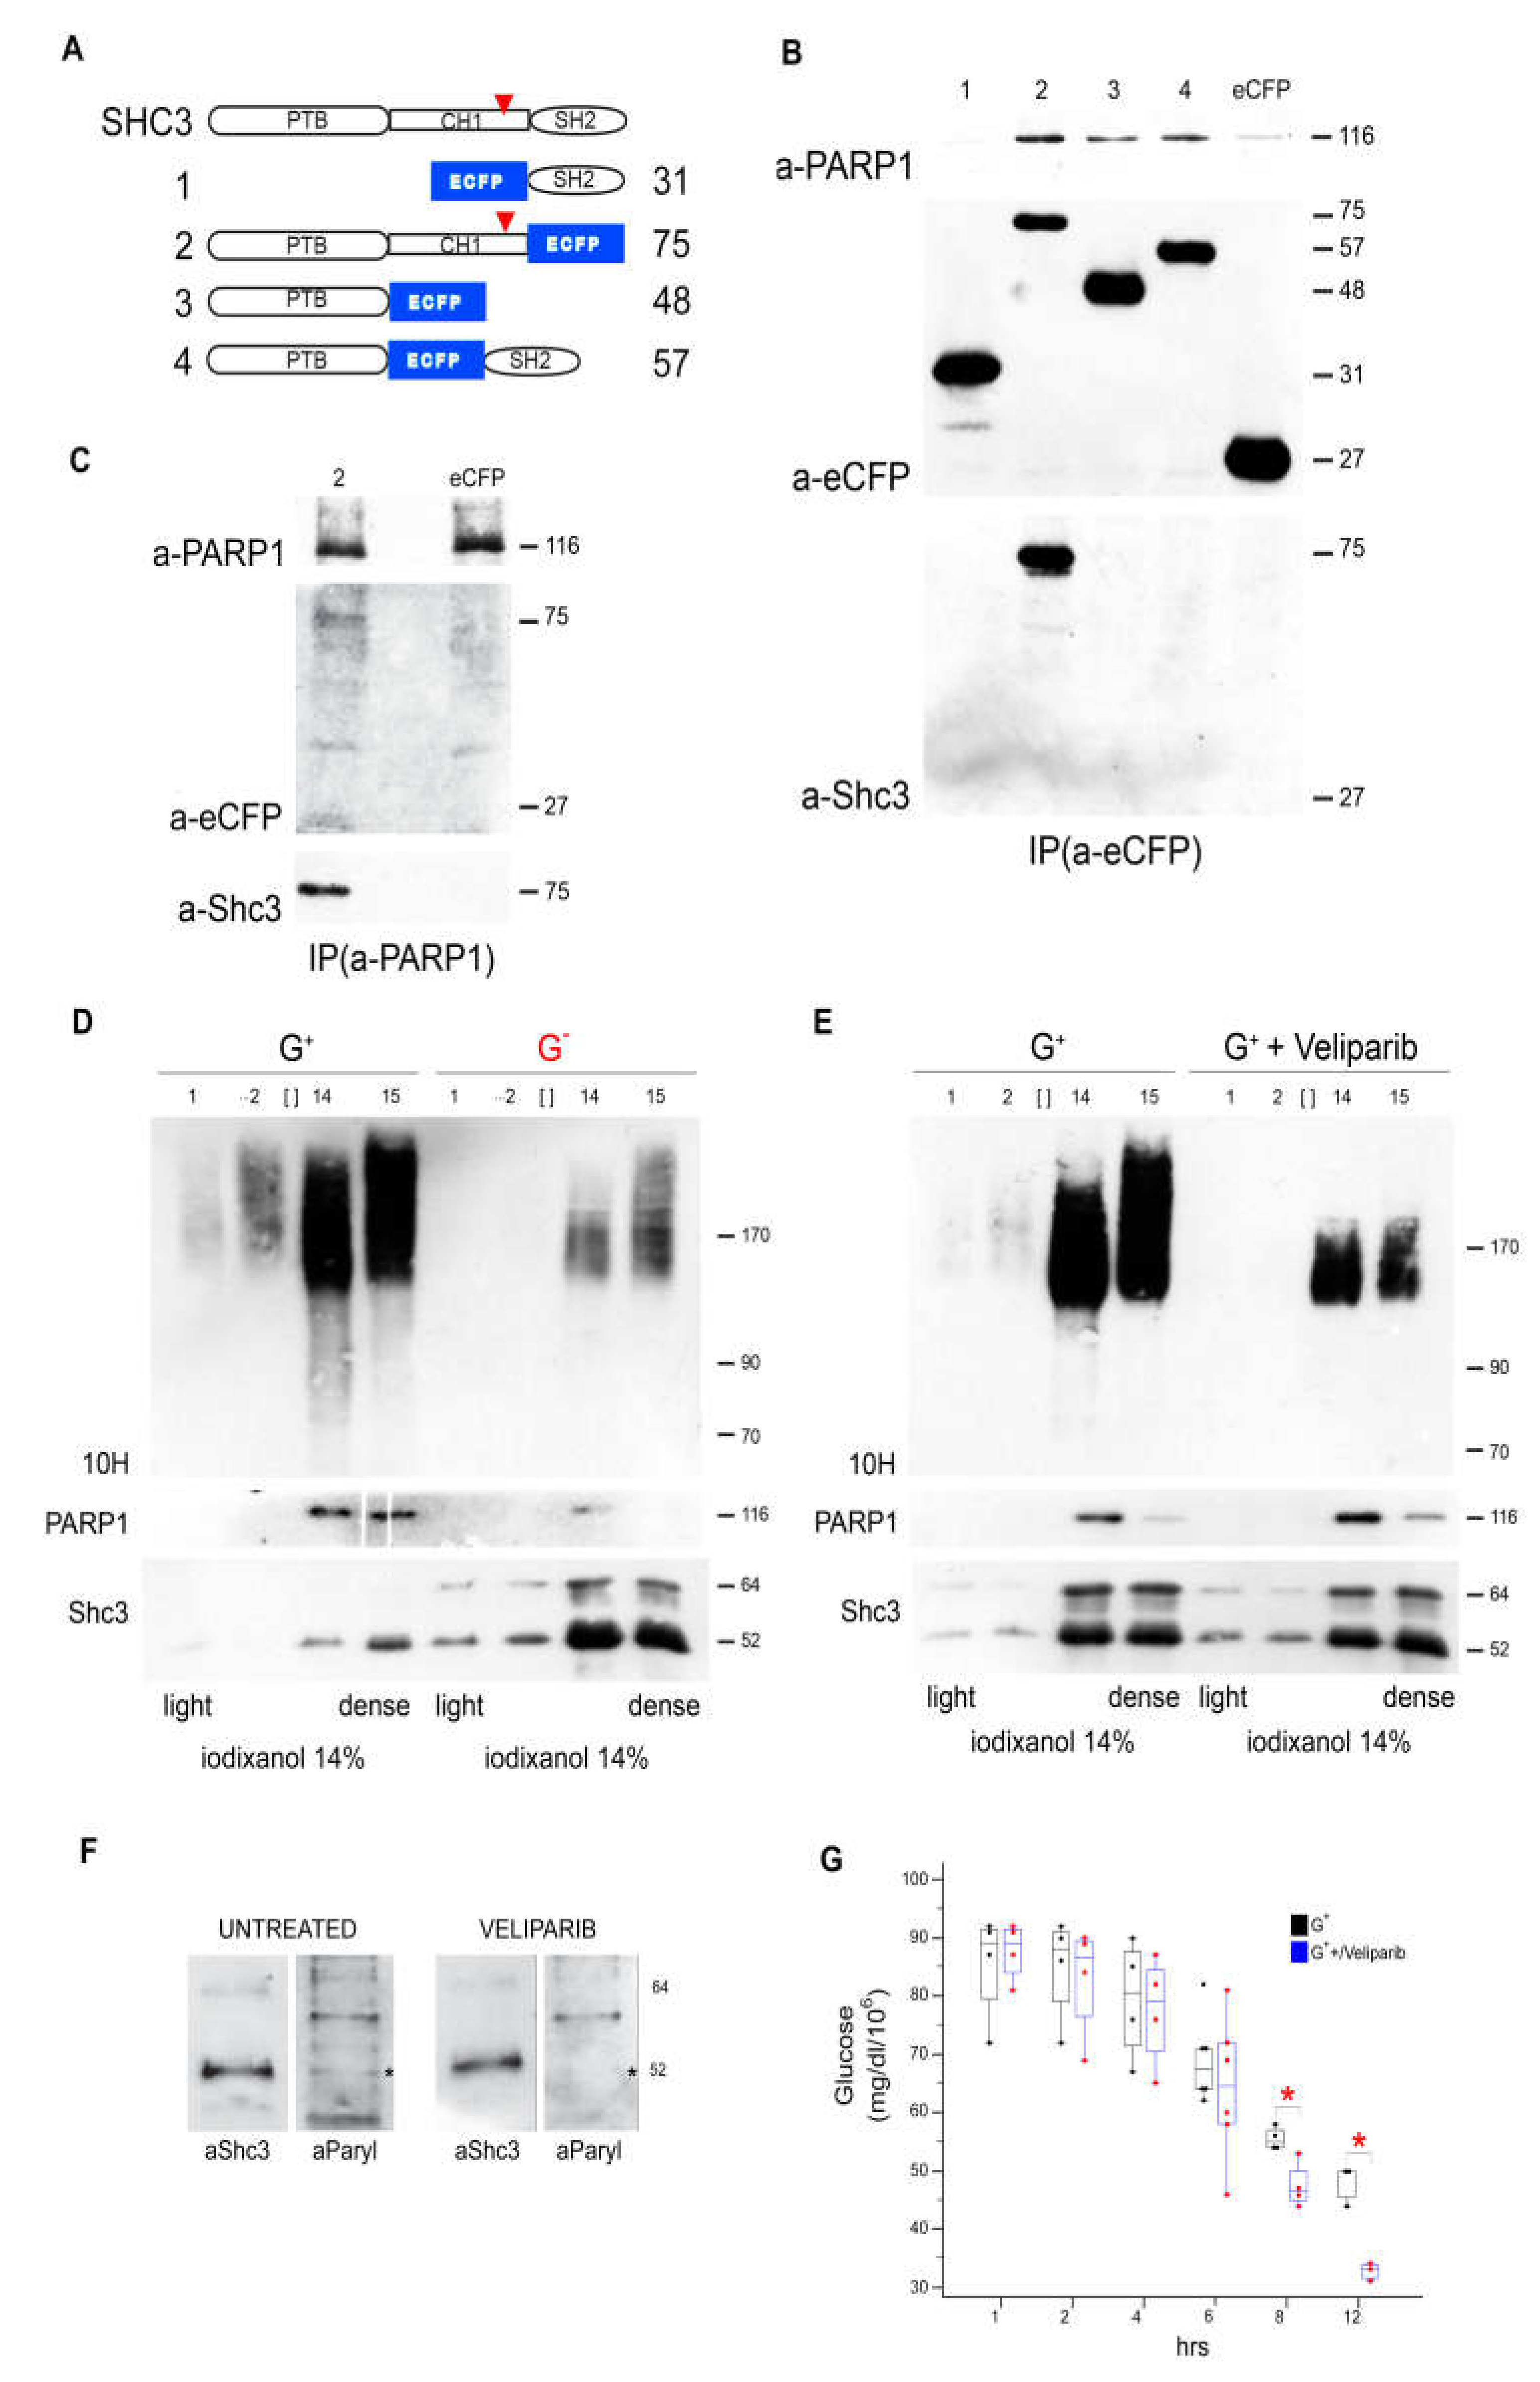
3.8. SHC3 and PARP1 Interact Through the SHC3 PTB Domain
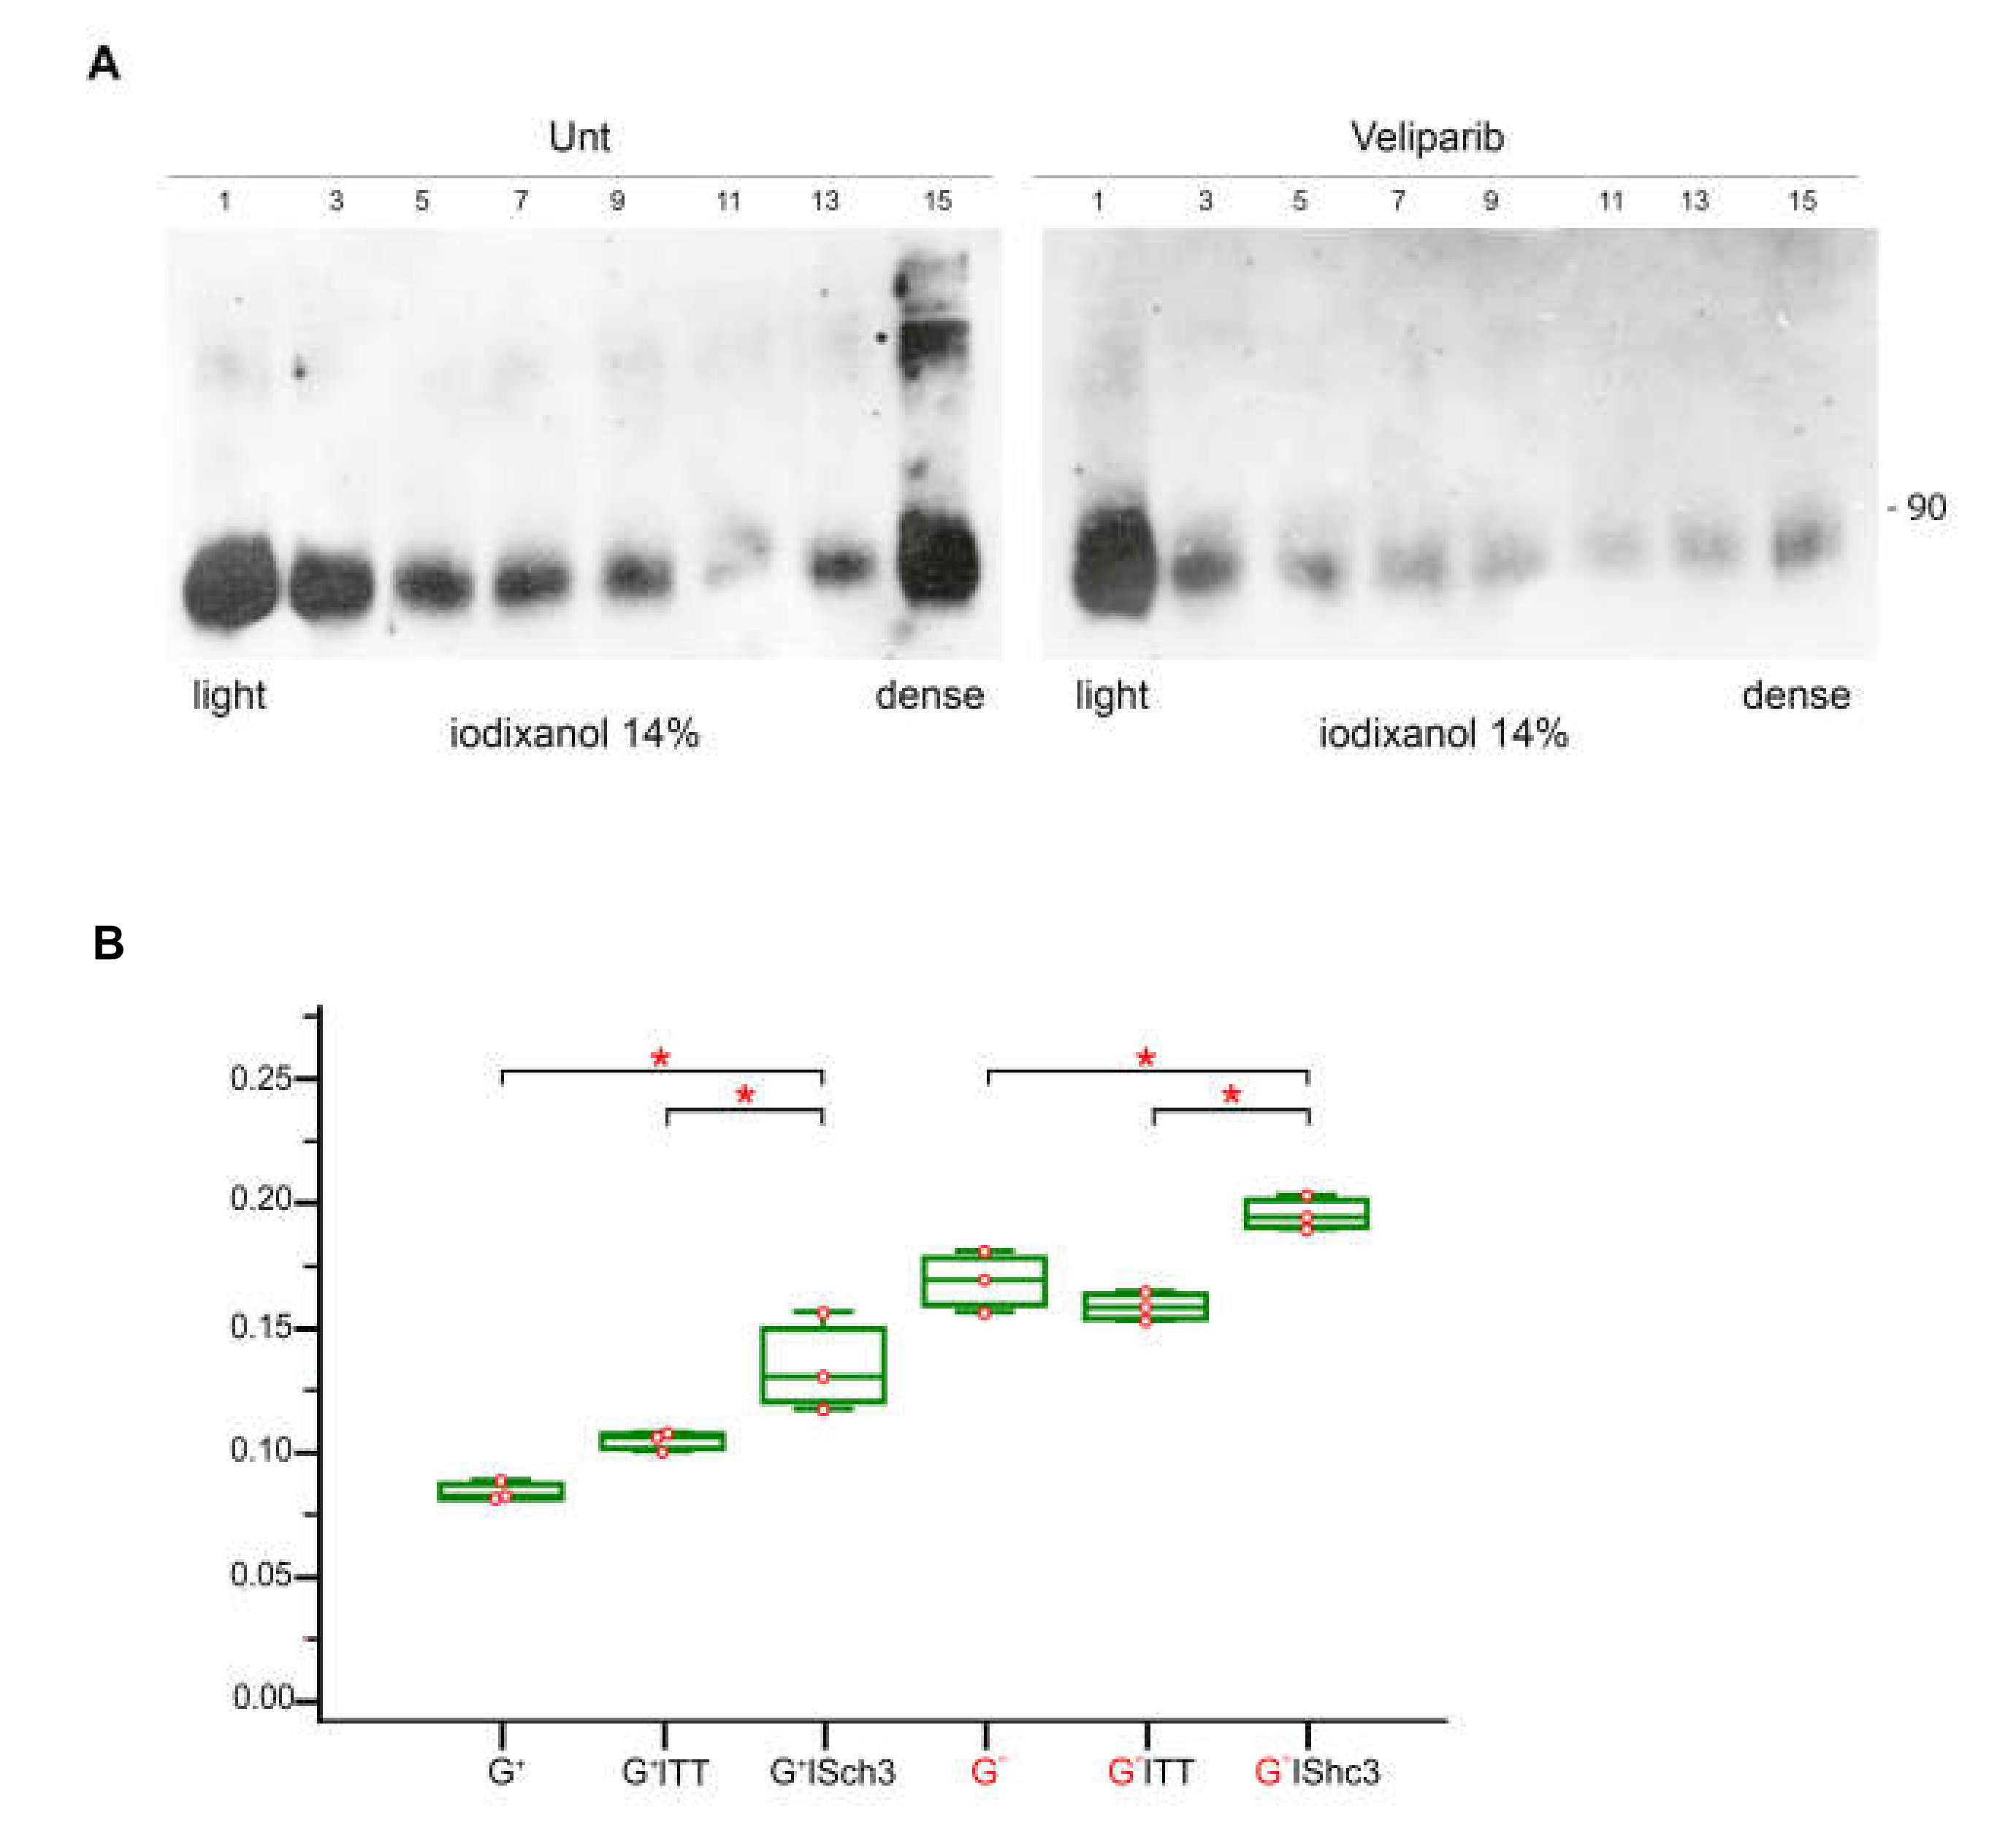
3.9. Parylated Proteins Concentrate in the Same Fractions Containing SHC3 and PARP1 and Treatment with Veliparib Reduces Parylation and Increases Glucose Uptake
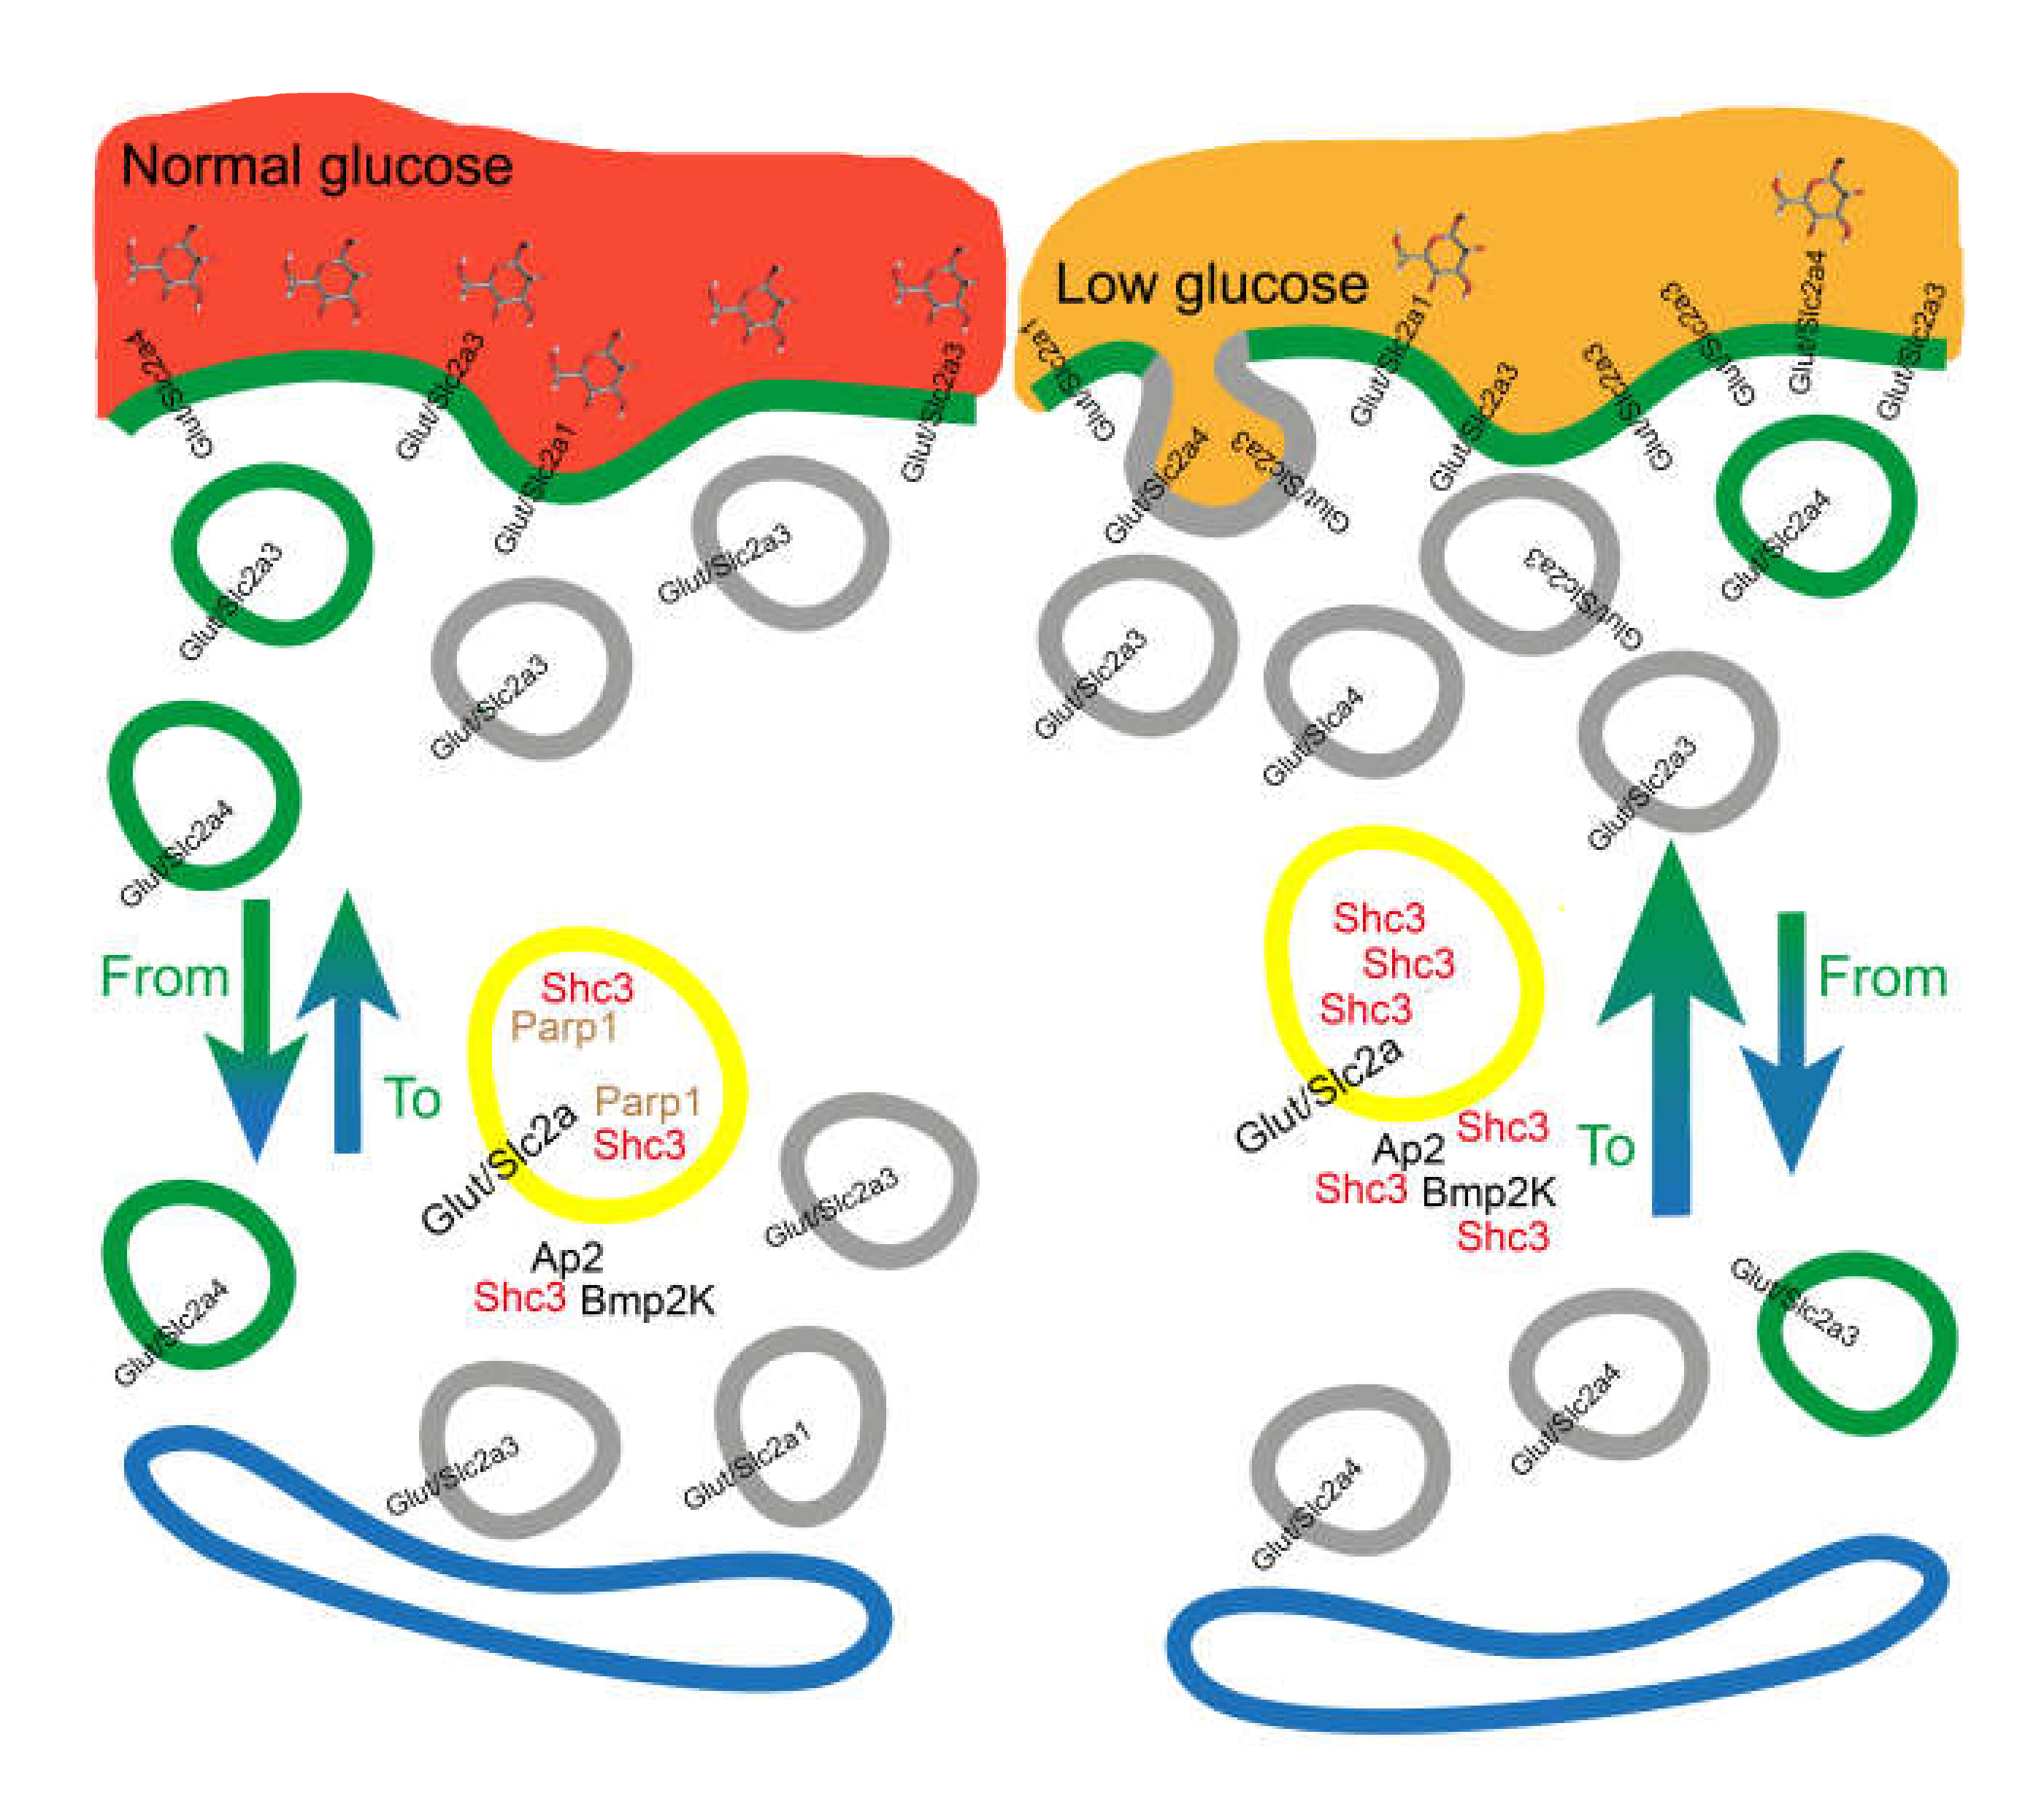
4. Discussion
5. Conclusions
Supplementary Materials
Author Contributions
Funding
Acknowledgments
Conflicts of Interest
References
- Toyonaga, T.; Yamaguchi, S.; Hirata, K.; Kobayashi, K.; Manabe, O.; Watanabe, S.; Terasaka, S.; Kobayashi, H.; Hattori, N.; Shiga, T.; et al. Hypoxic glucose metabolism in glioblastoma as a potential prognostic factor. Eur. J. Nucl. Med. Mol. Imaging 2016, 44, 611–619. [Google Scholar] [CrossRef] [PubMed]
- Adeberg, S.; Bernhardt, D.; Förster, R.; Bostel, T.; Koerber, S.A.; Mohr, A.; Koelsche, C.; Rieken, S.; Debus, J. The influence of hyperglycemia during radiotherapy on survival in patients with primary glioblastoma. Acta Oncol. 2015, 55, 1–7. [Google Scholar] [CrossRef] [PubMed]
- Tieu, M.T.; Lovblom, L.E.; McNamara, M.G.; Mason, W.; Laperriere, N.; Millar, B.-A.; Ménard, C.; Kiehl, T.-R.; Perkins, B.A.; Chung, C. Impact of glycemia on survival of glioblastoma patients treated with radiation and temozolomide. J. Neuro-Oncology 2015, 124, 119–126. [Google Scholar] [CrossRef] [PubMed]
- Masui, K.; Tanaka, K.; Ikegami, S.; Villa, G.R.; Yang, H.; Yong, W.H.; Cloughesy, T.F.; Yamagata, K.; Arai, N.; Cavenee, W.K.; et al. Glucose-dependent acetylation of Rictor promotes targeted cancer therapy resistance. Proc. Natl. Acad. Sci. USA 2015, 112, 9406–9411. [Google Scholar] [CrossRef] [PubMed]
- Flavahan, W.A.; Wu, Q.; Hitomi, M.; Rahim, N.; Kim, Y.; Sloan, A.E.; Weil, R.J.; Nakano, I.; Sarkaria, J.N.; Stringer, B.W.; et al. Brain tumor initiating cells adapt to restricted nutrition through preferential glucose uptake. Nat. Neurosci. 2013, 16, 1373–1382. [Google Scholar] [CrossRef]
- Mao, P.; Joshi, K.; Li, J.; Kim, S.-H.; Li, P.; Santana-Santos, L.; Luthra, S.; Chandran, U.R.; Benos, P.V.; Smith, L.; et al. Mesenchymal glioma stem cells are maintained by activated glycolytic metabolism involving aldehyde dehydrogenase 1A3. Proc. Natl. Acad. Sci. USA 2013, 110, 8644–8649. [Google Scholar] [CrossRef] [PubMed]
- Tardito, S.; Oudin, A.; Ahmed, S.U.; Fack, F.; Keunen, O.; Zheng, L.; Miletic, H.; Sakariassen, P. Øystein; Weinstock, A.; Wagner, A.; et al. Glutamine synthetase activity fuels nucleotide biosynthesis and supports growth of glutamine-restricted glioblastoma. Nature 2015, 17, 1556–1568. [Google Scholar] [CrossRef]
- Fack, F.; Tardito, S.; Hochart, G.; Oudin, A.; Zheng, L.; Fritah, S.; Golebiewska, A.; Nazarov, P.V.; Bernard, A.; Hau, A.; et al. Altered metabolic landscape in IDH -mutant gliomas affects phospholipid, energy, and oxidative stress pathways. EMBO Mol. Med. 2017, 9, 1681–1695. [Google Scholar] [CrossRef]
- Nishioka, T.; Oda, Y.; Seino, Y.; Yamamoto, T.; Inagaki, N.; Yano, H.; Imura, H.; Shigemoto, R.; Kikuchi, H. Distribution of the glucose transporters in human brain tumors. Cancer Res. 1992, 52, 3972–3979. [Google Scholar]
- Nagamatsu, S.; Sawa, H.; Wakizaka, A.; Hoshino, T. Expression of Facilitative Glucose Transporter Isoforms in Human Brain Tumors. J. Neurochem. 1993, 61, 2048–2053. [Google Scholar] [CrossRef]
- Azzalin, A.; Nato, G.; Parmigiani, E.; Garello, F.; Buffo, A.; Magrassi, L. Inhibitors of GLUT/SLC2A Enhance the Action of BCNU and Temozolomide against High-Grade Gliomas. Neoplasia 2017, 19, 364–373. [Google Scholar] [CrossRef] [PubMed]
- Libby, C.J.; Tran, A.; Scott, S.E.; Griguer, C.; Hjelmeland, A.B. The pro-tumorigenic effects of metabolic alterations in glioblastoma including brain tumor initiating cells. Biochim. Biophys. Acta (BBA) - Bioenerg. 2018, 1869, 175–188. [Google Scholar] [CrossRef] [PubMed]
- A Maher, E.; Marin-Valencia, I.; Bachoo, R.M.; Mashimo, T.; Raisanen, J.; Hatanpaa, K.J.; Jindal, A.; Jeffrey, F.M.; Choi, C.; Madden, C.; et al. Metabolism of [U-13C]glucose in human brain tumors in vivo. NMR Biomed. 2012, 25, 1234–1244. [Google Scholar] [CrossRef] [PubMed]
- Masui, K.; Shibata, N.; Cavenee, W.K.; Mischel, P.S. mTORC2 activity in brain cancer: Extracellular nutrients are required to maintain oncogenic signaling. BioEssays 2016, 38, 839–844. [Google Scholar] [CrossRef]
- Masui, K.; Tanaka, K.; Akhavan, D.; Babic, I.; Gini, B.; Matsutani, T.; Iwanami, A.; Liu, F.; Villa, G.R.; Gu, Y.; et al. mTOR complex 2 controls glycolytic metabolism in glioblastoma through FoxO acetylation and upregulation of c-Myc. Cell Metab. 2013, 18, 726–739. [Google Scholar] [CrossRef]
- Qin, X.; Lin, L.; Cao, L.; Zhang, X.; Song, X.; Hao, J.; Zhang, Y.; Wei, R.; Huang, X.; Lu, J.; et al. Extracellular matrix protein Reelin promotes myeloma progression by facilitating tumor cell proliferation and glycolysis. Sci. Rep. 2017, 7, 45305. [Google Scholar] [CrossRef]
- Zhang, H.; Qi, S.; Fan, J.; Fang, L.-X.; Qiu, B.; Liu, Y.; Qiu, X.-Y. Bifocal germinomas in the pineal region and hypothalamo-neurohypophyseal axis: Primary or metastasis? J. Clin. Neurosci. 2016, 34, 151–157. [Google Scholar] [CrossRef]
- Azzalin, A.; Moretti, E.; Arbustini, E.; Magrassi, L. Cell density modulates SHC3 expression and survival of human glioblastoma cells through Fak activation. J. Neuro-Oncology 2014, 120, 245–256. [Google Scholar] [CrossRef]
- Luzi, L.; Confalonieri, S.; Di Fiore, P.P.; Pelicci, P.G. Evolution of Shc functions from nematode to human. Curr. Opin. Genet. Dev. 2000, 10, 668–674. [Google Scholar] [CrossRef]
- Magrassi, L.; Conti, L.; Lanterna, L.A.; Zuccato, C.; Marchionni, M.; Cassini, P.; Arienta, C.; Cattaneo, E. Shc3 affects human high-grade astrocytomas survival. Oncogene 2005, 24, 5198–5206. [Google Scholar] [CrossRef][Green Version]
- Magrassi, L.; Marziliano, N.; Inzani, F.; Cassini, P.; Chiaranda, I.; Skrap, M.; Pizzolito, S.; Arienta, C.; Arbustini, E. EDG3 and SHC3 on chromosome 9q22 are co-amplified in human ependymomas. Cancer Lett. 2010, 290, 36–42. [Google Scholar] [CrossRef] [PubMed]
- Ward, C.W.; Gough, K.H.; Rashke, M.; Wan, S.S.; Tribbick, G.; Wang, J.-X. Systematic Mapping of Potential Binding Sites for Shc and Grb2 SH2 Domains on Insulin Receptor Substrate-1 and the Receptors for Insulin, Epidermal Growth Factor, Platelet-derived Growth Factor, and Fibroblast Growth Factor. J. Biol. Chem. 1996, 271, 5603–5609. [Google Scholar] [CrossRef] [PubMed]
- Hagopian, K.; Kim, K.; López-Dominguez, J.A.; Tomilov, A.A.; Cortopassi, G.A.; Ramsey, J.J. Mice with low levels of Shc proteins display reduced glycolytic and increased gluconeogenic activities in liver. Biochem. Biophys. Rep. 2016, 7, 273–286. [Google Scholar] [CrossRef] [PubMed][Green Version]
- Tomilov, A.A.; Ramsey, J.J.; Hagopian, K.; Giorgio, M.; Kim, K.M.; Lam, A.; Migliaccio, E.; Lloyd, K.C.; Berniakovich, I.; Prolla, T.A.; et al. The Shc locus regulates insulin signaling and adiposity in mammals. Aging Cell 2010, 10, 55–65. [Google Scholar] [CrossRef]
- Hagopian, K.; Tomilov, A.A.; Kim, K.; Cortopassi, G.A.; Ramsey, J.J. Key Glycolytic Enzyme Activities of Skeletal Muscle Are Decreased under Fed and Fasted States in Mice with Knocked Down Levels of Shc Proteins. PLoS ONE 2015, 10, e0124204. [Google Scholar] [CrossRef]
- Kirchhausen, T.; Owen, D.; Harrison, S.C. Molecular Structure, Function, and Dynamics of Clathrin-Mediated Membrane Traffic. Cold Spring Harb. Perspect. Biol. 2014, 6, a016725. [Google Scholar] [CrossRef]
- Conti, L.; Crisafulli, L.; Caldera, V.; Tortoreto, M.; Brilli, E.; Conforti, P.; Zunino, F.; Magrassi, L.; Schiffer, D.; Cattaneo, E. REST Controls Self-Renewal and Tumorigenic Competence of Human Glioblastoma Cells. PLoS ONE 2012, 7, e38486. [Google Scholar] [CrossRef]
- A Demeneix, B.; Ghorbel, M.; Goula, D. Optimizing polyethylenimine-based gene transfer into mammalian brain for analysis of promoter regulation and protein function. Methods Mol. Biol. (Clifton, N.J.) 2000, 133, 21–35. [Google Scholar]
- Lauritzen, H.P.; Galbo, H.; Brandauer, J.; Goodyear, L.J.; Ploug, T. Large GLUT4 Vesicles Are Stationary While Locally and Reversibly Depleted During Transient Insulin Stimulation of Skeletal Muscle of Living Mice: Imaging Analysis of GLUT4-Enhanced Green Fluorescent Protein Vesicle Dynamics. Diabetes 2007, 57, 315–324. [Google Scholar] [CrossRef]
- Greenlee, M.H.W.; Uemura, E.; Carpenter, S.L.; Doyle, R.T.; Buss, J.E. Glucose uptake in PC12 cells: GLUT3 vesicle trafficking and fusion as revealed with a novel GLUT3-GFP fusion protein. J. Neurosci. Res. 2003, 73, 518–525. [Google Scholar] [CrossRef]
- Wu, X.; Zhao, X.; Puertollano, R.; Bonifacino, J.S.; Eisenberg, E.; Greene, L.E. Adaptor and Clathrin Exchange at the Plasma Membrane and trans-Golgi Network. Mol. Biol. Cell 2003, 14, 516–528. [Google Scholar] [CrossRef] [PubMed]
- Irie, F.; Okuno, M.; Pasquale, E.B.; Yamaguchi, Y. EphrinB-EphB signalling regulates clathrin-mediated endocytosis through tyrosine phosphorylation of synaptojanin 1. Nature 2005, 7, 501–509. [Google Scholar] [CrossRef] [PubMed]
- Li, X.; Standley, C.; Sapp, E.; Valencia, A.; Qin, Z.-H.; Kegel, K.B.; Yoder, J.; Comer-Tierney, L.A.; Esteves, M.; Chase, K.; et al. Mutant Huntingtin Impairs Vesicle Formation from Recycling Endosomes by Interfering with Rab11 Activity. Mol. Cell. Biol. 2009, 29, 6106–6116. [Google Scholar] [CrossRef] [PubMed]
- Marchaland, J.; Calì, C.; Voglmaier, S.M.; Li, H.; Regazzi, R.; Edwards, R.H.; Bezzi, P. Fast subplasma membrane Ca2+ transients control exo-endocytosis of synaptic-like microvesicles in astrocytes. J. Neurosci. 2008, 28, 9122–9132. [Google Scholar] [CrossRef]
- Prada, I.; Marchaland, J.; Podini, P.; Magrassi, L.; D’Alessandro, R.; Bezzi, P.; Meldolesi, J. REST/NRSF governs the expression of dense-core vesicle gliosecretion in astrocytes. J. Cell Biol. 2011, 193, 537–549. [Google Scholar] [CrossRef]
- Mauri, P.; Dehò, G.; Dehò, G. Chapter 6 A Proteomic Approach to the Analysis of RNA Degradosome Composition in Escherichia coli. Methods in Enzymology 2008, 447, 99–117. [Google Scholar] [CrossRef]
- Dieterich, D.C.; Lee, J.J.; Link, A.J.; Graumann, J.; Tirrell, D.A.; Schuman, E.M. Labeling, detection and identification of newly synthesized proteomes with bioorthogonal non-canonical amino-acid tagging. Nat. Protoc. 2007, 2, 532–540. [Google Scholar] [CrossRef]
- Chen, X.; Zhang, D.; Dennert, G.; Hung, G.; Lee, A.S. Eradication of murine mammary adenocarcinoma through HSVtk expression directed by the glucose-starvation inducible grp78 promoter. Breast Cancer Res. Treat. 2000, 59, 81–90. [Google Scholar] [CrossRef]
- Yamada, K.; Nakata, M.; Horimoto, N.; Saito, M.; Matsuoka, H.; Inagaki, N. Measurement of Glucose Uptake and Intracellular Calcium Concentration in Single, Living Pancreatic β-Cells. J. Biol. Chem. 2000, 275, 22278–22283. [Google Scholar] [CrossRef]
- Chen, Y.; Zhang, J.; Zhang, X.-Y. 2-NBDG as a Marker for Detecting Glucose Uptake in Reactive Astrocytes Exposed to Oxygen-Glucose Deprivation In Vitro. J. Mol. Neurosci. 2014, 55, 126–130. [Google Scholar] [CrossRef]
- Clerc, P.; Polster, B.M. Investigation of Mitochondrial Dysfunction by Sequential Microplate-Based Respiration Measurements from Intact and Permeabilized Neurons. PLoS ONE 2012, 7, e34465. [Google Scholar] [CrossRef] [PubMed]
- Conti, L.; Sipione, S.; Magrassi, L.; Bonfanti, L.; Rigamonti, D.; Pettirossi, V.; Peschanski, M.; Haddad, B.; Pelicci, P.; Milanesi, G.; et al. Shc signaling in differentiating neural progenitor cells. Nat. Neurosci. 2001, 4, 579–586. [Google Scholar] [CrossRef] [PubMed]
- Collinet, C.; Stöter, M.; Bradshaw, C.R.; Samusik, N.; Rink, J.; Kenski, D.; Habermann, B.; Buchholz, F.; Henschel, R.; Mueller, M.S.; et al. Systems survey of endocytosis by multiparametric image analysis. Nature 2010, 464, 243–249. [Google Scholar] [CrossRef] [PubMed]
- Simeone, A.; Marsico, G.; Collinet, C.; Galvez, T.; Kalaidzidis, Y.; Zerial, M.; Beyer, A. Revealing Molecular Mechanisms by Integrating High-Dimensional Functional Screens with Protein Interaction Data. PLoS Comput. Biol. 2014, 10, e1003801. [Google Scholar] [CrossRef]
- Borner, G.H.H.; Antrobus, R.; Hirst, J.; Bhumbra, G.S.; Kozik, P.; Jackson, L.P.; Sahlender, D.A.; Robinson, M.S. Multivariate proteomic profiling identifies novel accessory proteins of coated vesicles. J. Cell Biol. 2012, 197, 141–160. [Google Scholar] [CrossRef]
- Mayle, K.M.; Le, A.M.; Kamei, D.T. The intracellular trafficking pathway of transferrin. Biochim. Biophys. Acta (BBA) - Bioenerg. 2011, 1820, 264–281. [Google Scholar] [CrossRef]
- O’Bryan, J.P.; Lambert, Q.T.; Der, C.J. The Src Homology 2 and Phosphotyrosine Binding Domains of the ShcC Adaptor Protein Function as Inhibitors of Mitogenic Signaling by the Epidermal Growth Factor Receptor. J. Biol. Chem. 1998, 273, 20431–20437. [Google Scholar] [CrossRef]
- Hirayama, S.; Hori, Y.; Benedek, Z.; Suzuki, T.; Kikuchi, K. Fluorogenic probes reveal a role of GLUT4 N-glycosylation in intracellular trafficking. Nat. Methods 2016, 12, 853–859. [Google Scholar] [CrossRef]
- Maier, V.H.; Gould, G.W. Long-term insulin treatment of 3T3-L1 adipocytes results in mis-targeting of GLUT4: implications for insulin-stimulated glucose transport. Diabetologia 2000, 43, 1273–1281. [Google Scholar] [CrossRef]
- Riffell, J.L.; Lord, C.J.; Ashworth, A. Tankyrase-targeted therapeutics: expanding opportunities in the PARP family. Nat. Rev. Drug Discov. 2012, 11, 923–936. [Google Scholar] [CrossRef]
- Yeh, T.-Y.J.; Sbodio, J.I.; Tsun, Z.-Y.; Luo, B.; Chi, N.-W. Insulin-stimulated exocytosis of GLUT4 is enhanced by IRAP and its partner tankyrase. Biochem. J. 2007, 402, 279–290. [Google Scholar] [CrossRef] [PubMed]
- Stout, R.F.; Spray, D.C.; Parpura, V. Astrocytic ‘power-grid’: Delivery upon neuronal demand. Cellscience 2009, 5, 34–43. [Google Scholar] [PubMed]
- Belanger, M.; Allaman, I.; Magistretti, P.J. Brain Energy Metabolism: Focus on Astrocyte-Neuron Metabolic Cooperation. Cell Metab. 2011, 14, 724–738. [Google Scholar] [CrossRef] [PubMed]
- Antonescu, C.N.; McGraw, T.E.; Klip, A. Reciprocal Regulation of Endocytosis and Metabolism. Cold Spring Harb. Perspect. Biol. 2014, 6, a016964. [Google Scholar] [CrossRef]
- Ferro, M.; Savino, M.T.; Ortensi, B.; Finetti, F.; Genovese, L.; Masi, G.; Ulivieri, C.; Benati, D.; Pelicci, G.; Baldari, C.T. The Shc Family Protein Adaptor, Rai, Negatively Regulates T Cell Antigen Receptor Signaling by Inhibiting ZAP-70 Recruitment and Activation. PLoS ONE 2011, 6, e29899. [Google Scholar] [CrossRef]
- Lampson, M.A.; Schmoranzer, J.; Zeigerer, A.; Simon, S.M.; McGraw, T.E. Insulin-regulated Release from the Endosomal Recycling Compartment Is Regulated by Budding of Specialized Vesicles. Mol. Biol. Cell 2001, 12, 3489–3501. [Google Scholar] [CrossRef]
- Lanzerstorfer, P.; Stadlbauer, V.; Chtcheglova, L.; Haselgrübler, R.; Borgmann, D.; Wruss, J.; Hinterdorfer, P.; Schröder, K.; Winkler, S.M.; Höglinger, O.; et al. Identification of novel insulin mimetic drugs by quantitative total internal reflection fluorescence (TIRF) microscopy. Br. J. Pharmacol. 2014, 171, 5237–5251. [Google Scholar] [CrossRef]
- McMahon, H.T.; Boucrot, E. Molecular mechanism and physiological functions of clathrin-mediated endocytosis. Nat. Rev. Mol. Cell Biol. 2011, 12, 517–533. [Google Scholar] [CrossRef]
- Sugimoto, Y.; Okabayashi, Y.; Totty, N.F.; Hsuan, J.; Kido, Y.; Sakaguchi, K.; Gout, I.; Waterfield, M.D.; Kasuga, M. Interaction of Shc with Adaptor Protein Adaptins. J. Biol. Chem. 1996, 271, 5265–5269. [Google Scholar] [CrossRef]
- Sorrell, F.; Szklarz, M.; Azeez, K.R.A.; Elkins, J.M.; Knapp, S. Family-wide Structural Analysis of Human Numb-Associated Protein Kinases. Structure 2016, 24, 401–411. [Google Scholar] [CrossRef]
- Praefcke, G.; Ford, M.G.J.; Schmid, E.M.; E Olesen, L.; Gallop, J.L.; Peak-Chew, S.-Y.; Vallis, Y.; Babu, M.M.; Mills, I.G.; McMahon, H.T. Evolving nature of the AP2 α-appendage hub during clathrin-coated vesicle endocytosis. EMBO J. 2004, 23, 4371–4383. [Google Scholar] [CrossRef] [PubMed]
- Kubelt, C.; Hattermann, K.; Sebens, S.; Mehdorn, H.M.; Held-Feindt, J. Epithelial-to-mesenchymal transition in paired human primary and recurrent glioblastomas. Int. J. Oncol. 2015, 46, 2515–2525. [Google Scholar] [CrossRef] [PubMed]
- Rohrbeck, A.; Von Elsner, L.; Hagemann, S.; Just, I. Uptake of Clostridium botulinum C3 Exoenzyme into Intact HT22 and J774A.1 Cells. Toxins 2015, 7, 380–395. [Google Scholar] [CrossRef] [PubMed]
- Runembert, I.; Queffeulou, G.; Federici, P.; Vrtovsnik, F.; Colucci-Guyon, E.; Babinet, C.; Briand, P.; Trugnan, G.; Friedlander, G.; Terzi, F. Vimentin affects localization and activity of sodium-glucose cotransporter SGLT1 in membrane rafts. J. Cell Sci. 2002, 115, 713–724. [Google Scholar] [PubMed]
- Styers, M.L.; Salazar, G.; Love, R.; A Peden, A.; Kowalczyk, A.P.; Faundez, V. The Endo-Lysosomal Sorting Machinery Interacts with the Intermediate Filament Cytoskeleton D. Mol. Biol. Cell 2004, 15, 5369–5382. [Google Scholar] [CrossRef]
- Ridge, K.M.; Shumaker, D.; Robert, A.; Hookway, C.; I Gelfand, V.; Janmey, P.A.; Lowery, J.; Guo, M.; Weitz, D.A.; Kuczmarski, E.; et al. Methods for Determining the Cellular Functions of Vimentin Intermediate Filaments. Methods Enzym. 2015, 568, 389–426. [Google Scholar] [CrossRef]
- Cookson, M.R.; Ince, P.G.; Usher, P.A.; Shaw, P. Poly(ADP-ribose) polymerase is found in both the nucleus and cytoplasm of human CNS neurons. Brain Res. 1999, 834, 182–185. [Google Scholar] [CrossRef]
- Carlile, G.W.; Robert, R.; Matthes, E.; Yang, Q.; Solari, R.; Hatley, R.; Edge, C.M.; Hanrahan, J.W.; Andersen, R.; Thomas, D.Y.; et al. Latonduine Analogs Restore F508del–Cystic Fibrosis Transmembrane Conductance Regulator Trafficking through the Modulation of Poly-ADP Ribose Polymerase 3 and Poly-ADP Ribose Polymerase 16 Activity. Mol. Pharmacol. 2016, 90, 65–79. [Google Scholar] [CrossRef]
- Chi, N.-W.; Lodish, H.F. Tankyrase Is a Golgi-associated Mitogen-activated Protein Kinase Substrate That Interacts with IRAP in GLUT4 Vesicles*. J. Biol. Chem. 2000, 275, 38437–38444. [Google Scholar] [CrossRef]
- Elmageed, Z.Y.A.; Naura, A.S.; Errami, Y.; Zerfaoui, M. The Poly(ADP-ribose) polymerases (PARPs): New roles in intracellular transport. Cell. Signal. 2012, 24, 1–8. [Google Scholar] [CrossRef]
- Carlile, G.W.; Keyzers, R.A.; Teske, K.A.; Robert, R.; Williams, D.E.; Linington, R.G.; Gray, C.A.; Centko, R.M.; Yan, L.; Anjos, S.M.; et al. Correction of F508del-CFTR Trafficking by the Sponge Alkaloid Latonduine Is Modulated by Interaction with PARP. Chem. Biol. 2012, 19, 1288–1299. [Google Scholar] [CrossRef] [PubMed]
- Jungmichel, S.; Rosenthal, F.; Altmeyer, M.; Lukas, J.; Hottiger, M.O.; Nielsen, M.L. Proteome-wide Identification of Poly(ADP-Ribosyl)ation Targets in Different Genotoxic Stress Responses. Mol. Cell 2013, 52, 272–285. [Google Scholar] [CrossRef] [PubMed]
- Nathubhai, A.; Haikarainen, T.; Koivunen, J.; Murthy, S.; Koumanov, F.; Lloyd, M.; Holman, G.; Pihlajaniemi, T.; Tosh, D.; Lehtiö, L.; et al. Highly Potent and Isoform Selective Dual Site Binding Tankyrase/Wnt Signaling Inhibitors That Increase Cellular Glucose Uptake and Have Antiproliferative Activity. J. Med. Chem. 2017, 60, 814–820. [Google Scholar] [CrossRef] [PubMed]
- Devalaraja-Narashimha, K.; Padanilam, B.J. PARP1 deficiency exacerbates diet-induced obesity in mice. J. Endocrinol. 2010, 205, 243–252. [Google Scholar] [CrossRef] [PubMed]
- Troglio, F.; Echart, C.; Gobbi, A.; Pawson, T.; Pelicci, P.G.; De Simoni, M.-G.; Pelicci, G. The Rai (Shc C) adaptor protein regulates the neuronal stress response and protects against cerebral ischemia. Proc. Natl. Acad. Sci. USA 2004, 101, 15476–15481. [Google Scholar] [CrossRef] [PubMed]
- Du, Y.; Yamaguchi, H.; Wei, Y.; Hsu, J.L.; Wang, H.-L.; Hsu, Y.-H.; Lin, W.-C.; Yu, W.-H.; Leonard, P.G.; Lee, G.R.; et al. Blocking c-Met–mediated PARP1 phosphorylation enhances anti-tumor effects of PARP inhibitors. Nat. Med. 2016, 22, 194–201. [Google Scholar] [CrossRef] [PubMed]
- Landry, M.; Pomerleau, V.; Saucier, C. Non-canonical dynamic mechanisms of interaction between the p66Shc protein and Met receptor. Biochem. J. 2016, 473, 1617–1627. [Google Scholar] [CrossRef]
- Kaneko, T.; Joshi, R.; Feller, S.M.; Li, S. Phosphotyrosine recognition domains: The typical, the atypical and the versatile. Cell Commun. Signal. 2012, 10, 32. [Google Scholar] [CrossRef]
- Lin, S.-C.; Hardie, D.G. AMPK: Sensing Glucose as well as Cellular Energy Status. Cell Metab. 2018, 27, 299–313. [Google Scholar] [CrossRef]
- Ansari, K.I.; Ogawa, D.; Rooj, A.K.; Lawler, S.E.; Krichevsky, A.M.; Johnson, M.D.; Chiocca, E.A.; Bronisz, A.; Godlewski, J. Glucose-based regulation of miR-451/AMPK signaling depends on the OCT1 transcription factor. Cell Rep. 2015, 11, 902–909. [Google Scholar] [CrossRef]
- Godlewski, J.; Nowicki, M.O.; Bronisz, A.; Nuovo, G.; Palatini, J.; De Lay, M.; Van Brocklyn, J.; Ostrowski, M.C.; Chiocca, E.A.; Lawler, S.E. MicroRNA-451 regulates LKB1/AMPK signaling and allows adaptation to metabolic stress in glioma cells. Mol. Cell 2010, 37, 620–632. [Google Scholar] [CrossRef] [PubMed]
- Ha, H.C.; Hester, L.D.; Snyder, S.H. Poly(ADP-ribose) polymerase-1 dependence of stress-induced transcription factors and associated gene expression in glia. Proc. Natl. Acad. Sci. USA 2002, 99, 3270–3275. [Google Scholar] [CrossRef] [PubMed]
- Tomilov, A.; Allen, S.A.; Hui, C.K.; Bettaieb, A.; Cortopassi, G.A. Idebenone is a cytoprotective insulin sensitizer whose mechanism is Shc inhibition. Pharmacol. Res. 2018, 137, 89–103. [Google Scholar] [CrossRef] [PubMed]
- Robins, H.I.; Zhang, P.; Gilbert, M.R.; Chakravarti, A.; De Groot, J.F.; Grimm, S.A.; Wang, F.; Lieberman, F.S.; Krauze, A.; Trotti, A.M.; et al. A randomized phase I/II study of ABT-888 in combination with temozolomide in recurrent temozolomide resistant glioblastoma: an NRG oncology RTOG group study. J. Neuro-Oncology 2015, 126, 309–316. [Google Scholar] [CrossRef]
- Gupta, S.K.; Kizilbash, S.H.; Carlson, B.L.; Mladek, A.C.; Boakye-Agyeman, F.; Bakken, K.K.; Pokorny, J.L.; Schroeder, M.A.; Decker, P.A.; Cen, L.; et al. Delineation of MGMT Hypermethylation as a Biomarker for Veliparib-Mediated Temozolomide-Sensitizing Therapy of Glioblastoma. J. Natl. Cancer Inst. 2015, 108, 108. [Google Scholar] [CrossRef]
- Lemasson, B.; Wang, H.; Galban, S.; Li, Y.; Zhu, Y.; Heist, K.A.; Tsein, C.; Chenevert, T.L.; Rehemtulla, A.; Galbán, C.J.; et al. Evaluation of Concurrent Radiation, Temozolomide and ABT-888 Treatment Followed by Maintenance Therapy with Temozolomide and ABT-888 in a Genetically Engineered Glioblastoma Mouse Model. Neoplasia 2016, 18, 82–89. [Google Scholar] [CrossRef]


© 2020 by the authors. Licensee MDPI, Basel, Switzerland. This article is an open access article distributed under the terms and conditions of the Creative Commons Attribution (CC BY) license (http://creativecommons.org/licenses/by/4.0/).
Share and Cite
Azzalin, A.; Brambilla, F.; Arbustini, E.; Basello, K.; Speciani, A.; Mauri, P.; Bezzi, P.; Magrassi, L. A New Pathway Promotes Adaptation of Human Glioblastoma Cells to Glucose Starvation. Cells 2020, 9, 1249. https://doi.org/10.3390/cells9051249
Azzalin A, Brambilla F, Arbustini E, Basello K, Speciani A, Mauri P, Bezzi P, Magrassi L. A New Pathway Promotes Adaptation of Human Glioblastoma Cells to Glucose Starvation. Cells. 2020; 9(5):1249. https://doi.org/10.3390/cells9051249
Chicago/Turabian StyleAzzalin, Alberto, Francesca Brambilla, Eloisa Arbustini, Katia Basello, Attilio Speciani, Pierluigi Mauri, Paola Bezzi, and Lorenzo Magrassi. 2020. "A New Pathway Promotes Adaptation of Human Glioblastoma Cells to Glucose Starvation" Cells 9, no. 5: 1249. https://doi.org/10.3390/cells9051249
APA StyleAzzalin, A., Brambilla, F., Arbustini, E., Basello, K., Speciani, A., Mauri, P., Bezzi, P., & Magrassi, L. (2020). A New Pathway Promotes Adaptation of Human Glioblastoma Cells to Glucose Starvation. Cells, 9(5), 1249. https://doi.org/10.3390/cells9051249