Article

Hepatic NAPE-PLD Is a Key Regulator of Liver Lipid Metabolism

1
Metabolism and Nutrition Research Group, Louvain Drug Research Institute, Walloon Excellence in Life Sciences and BIOtechnology (WELBIO), UCLouvain, Université Catholique de Louvain, Av. E. Mounier, 73 B1.73.11, 1200 Bruxelles, Belgium
2
Bioanalysis and Pharmacology of Bioactive Lipids Research Group, Louvain Drug Research Institute, UCLouvain, Université Catholique de Louvain, 1200 Bruxelles, Belgium
3
Laboratory of Hepato-Gastroenterology, UCLouvain, Université Catholique de Louvain, 1200 Bruxelles, Belgium
4
Quebec Heart and Lung Institute Research Centre, Université Laval, Quebec City, QC G1V 0A6, Canada
5
Centre NUTRISS, Institute of Nutrition and Functional Foods, Université Laval, Quebec City, QC G1V 0A6, Canada
6
Endocannabinoid Research Group, Institute of Biomolecular Chemistry, Consiglio Nazionale delle Ricerche, 80078 Pozzuoli, Napoli, Italy
7
Université de Paris, BFA, UMR 8251, CNRS, F-75014 Paris, France
*
Author to whom correspondence should be addressed.
Cells 2020, 9(5), 1247; https://doi.org/10.3390/cells9051247
Submission received: 7 April 2020 / Revised: 5 May 2020 / Accepted: 13 May 2020 / Published: 18 May 2020

Abstract

:
Diverse metabolic disorders have been associated with an alteration of N-acylethanolamine (NAE) levels. These bioactive lipids are synthesized mainly by N-acylphosphatidylethanolamine-selective phospholipase D (NAPE-PLD) and influence host metabolism. We have previously discovered that NAPE-PLD in the intestine and adipose tissue is connected to the pathophysiology of obesity. However, the physiological function of NAPE-PLD in the liver remains to be deciphered. To study the role of liver NAPE-PLD on metabolism, we generated a new mouse model of inducible Napepld hepatocyte-specific deletion (Napepld∆Hep mice). In this study, we report that Napepld∆Hep mice develop a high-fat diet-like phenotype, characterized by an increased fat mass gain, hepatic steatosis and we show that Napepld∆Hep mice are more sensitive to liver inflammation. We also demonstrate that the role of liver NAPE-PLD goes beyond the mere synthesis of NAEs, since the deletion of NAPE-PLD is associated with a marked modification of various bioactive lipids involved in host homeostasis such as oxysterols and bile acids. Collectively these data suggest that NAPE-PLD in hepatocytes is a key regulator of liver bioactive lipid synthesis and a dysregulation of this enzyme leads to metabolic complications. Therefore, deepening our understanding of the regulation of NAPE-PLD could be crucial to tackle obesity and related comorbidities.

Graphical Abstract

1. Introduction

Over the last few years, interest in specific bioactive lipids, the N-acylethanolamines (NAEs), has increased exponentially as accumulating evidence demonstrated an association between variations in NAE levels and diverse pathological conditions such as obesity, inflammation or hepatic disorders [1,2,3]. NAEs belong to the expanded endocannabinoid system, or endocannabinoidome (eCBome), which is composed of several enzymes, receptors and bioactive lipids involved in energy homeostasis [2,4]. The best-known NAEs include anandamide (N-arachidonoylethanolamine, AEA, an endocannabinoid), N-palmitoylethanolamine (PEA), N-stearoylethanolamine (SEA), N-linoleylethanolamine (LEA) and N-oleoylethanolamine (OEA). In the context of metabolic disorders, some NAEs have been reported to regulate food intake [5,6,7], to mediate inflammation [8,9] or to contribute to the development of steatosis [10,11]. Even though many of their physiological actions have been discovered, understanding the molecular mechanisms that link NAEs to metabolic diseases remains challenging.
Since N-acylphosphatidylethanolamine-selective phospholipase D (NAPE-PLD) is the main enzyme producing NAEs [12], inhibiting its action, represents an efficient way to explore the function of NAEs. However, the mechanisms of regulation of NAPE-PLD activity, especially in vivo, are not yet fully deciphered. Interestingly, recent studies have made progress in that perspective and have elegantly shown that natural bile acids, and specific steroidal hydroxylation pattern were key elements for modulating the enzyme activity [13]. These data suggesting a link between NAPE-PLD and steroid acids open the floor to design putative small-molecule modulators with potential therapeutic applications [14].
Nevertheless, in order to better understand the physiological role of NAPE-PLD, deleting this enzyme in the whole-body has been the initial strategy. Although whole-body Napepld-knockouts displayed controversial brain lipid profiles, they did not exhibit a peculiar phenotype [15,16,17,18,19], suggesting that compensatory mechanisms come into effect when this vital system is deficient in early developmental stages. To overcome this problem, we generated Napepld-deleted mouse models in which NAPE-PLD could be inactivated in specific organs from adult mice, using the Cre-lox system [20]. This allowed us to previously discover that mice deleted for Napepld in the adipose tissue developed an obese-like phenotype, with higher fat mass, glucose intolerance and low-grade inflammation, when fed a normal diet [21]. In addition, we also demonstrated that the deletion of Napepld in the intestinal epithelial cells affected food intake regulation [22]. These two studies highlighted that NAPE-PLD and the bioactive products it generates are involved in host homeostasis and that the phenotypes observed were organ-specific. Interestingly, in humans, a single nucleotide polymorphism in Napepld has been linked to obesity [23]. Since obesity is associated with a cluster of metabolic complications including liver disorders [24,25,26], and both organ-specific Napepld knockout mouse models previously investigated were prone to develop obesity-associated steatosis, we next wondered what would be the role of NAPE-PLD in the liver. In the present study, we therefore generated a new mouse model of inducible hepatocyte-specific deletion of Napepld in hepatocytes (Napepld∆Hep) to further investigate the physiological functions of this enzyme in the context of metabolic diseases.

2. Materials and Methods

2.1. Mice

All mice were bred in our specific opportunistic and pathogen free (SOPF) animal facility. Animals were housed filter-top cages kept in a controlled environment (room temperature of 22 ± 2 °C, humidity 55% ± 10%, 12 h daylight cycle) in groups of two mice per cage, with free access to irradiated food and autoclaved water. Mice were fed a normal diet (ND; AIN93Mi, Research Diets, New Brunswick, NJ, USA). Body composition (lean and fat mass) was assessed by using 7.5 MHz time domain-nuclear magnetic resonance (TD-NMR; LF50 Minispec, Bruker, Rheinstetten, Germany). This technique allows one to follow in vivo the development of adipose tissue, fat-free mass in non-anesthetized mice throughout the experimental treatment.

2.2. Generation of Napepld∆Hep Mice

Inducible hepatocyte Napepld-deleted C57Bl6/J mice (Napepld∆Hep) were generated by crossing mice harboring a tamoxifen-dependent Cre recombinase expressed under the control of the albumin promoter (Albumin Cre-ERT2 mice were kindly provided by Prof. Pierre Chambon, GIE-CERBM (IGBMC), Illkirch, France) with mice bearing a loxP-flanked Napepld allele [21,27]. After verification of the genotype by PCR, littermate mice were randomly assigned to the different experimental groups. The deletion was induced at 8 weeks of age by intra-peritoneal (i.p.) injection of 100 μL tamoxifen (10 mg/mL) for 5 consecutive days. The control mice (wild-type (WT) that is Napepldlox/lox × Albumin Cre-ERT2) were injected by an i.p. injection of 100 μL of vehicle (filtered sunflower oil with ethanol) for 5 consecutive days. Tamoxifen was prepared by addition of ethanol to 100 mg of tamoxifen (tamoxifen-free base, MP Biomedicals) to obtain a 100 mg/mL of tamoxifen suspension. A 10 mg/mL tamoxifen solution was prepared by addition of filtered sunflower oil, followed by 30 min sonication. The 10 mg/mL solution of tamoxifen solution was stored at 4 °C for up to 1 week and was sonicated 5 min before use. After the 5 days of injections, mice were allowed to rest for two weeks to recover from any stress or discomfort they may have experienced due to the injections and to allow any residual oil and ethanol to wash out.

2.3. Phenotyping in Normal Diet (ND) Condition

A cohort of 11-week-old male Napepld∆Hep and WT mice were fed a control diet (AIN93Mi, Research Diets) for 7 weeks.

2.4. Phenotyping in High-Fat Diet (HFD) Condition

A cohort of 11-week-old male Napepld∆Hep and WT mice were fed a HFD (60% fat, D12492i, Research Diets) for 8 weeks.

2.5. Oral Glucose Tolerance Test

One week before the end of the experiments, mice were fasted for 6 h prior to be given an oral glucose load (2 g glucose per kg body weight). Blood glucose levels were measured 30 min before, just prior to gavage, and 15, 30, 60, 90 and 120 min after oral glucose load using a standard glucose meter (Accu Check, Roche, Basel, Switzerland) on the tip of the tail vein. Plasma samples were collected from the tip of the tail vein in heparinized tubes 30 min before and 15 min after oral glucose load for determination of insulin concentration.

2.6. Insulin Resistance Index

Plasma insulin concentration was determined using an ultrasensitive mouse insulin ELISA kit (Mercodia, Uppsala, Sweden) according to the manufacturer’s instructions. Insulin resistance index was determined by multiplying the area under the curve of both blood glucose (−30 and 15 min) and plasma insulin (−30 and 15 min) obtained following the oral glucose tolerance test.

2.7. LPS Injection Experiment

A cohort of 14-week-old ND-fed male Napepld∆Hep and WT mice were injected, as previously described [28], intraperitoneally with either 300 µg/kg LPS solution (LPS from Escherichia coli O55:B5; Sigma L2880) or saline solution (CT). Mice were killed 4 h after the injection.

2.8. Tissue Sampling

At the end of the experiment, mice were anesthetized with isoflurane (Forene, Abbott, Queenborough, Kent, England) after a fasting period of 6 h. Blood was sampled from the portal and cava veins. After exsanguination, mice were killed by cervical dislocation. Tissues were precisely dissected, weighed and immediately immersed in liquid nitrogen followed by storage at −80 °C for further analysis.

2.9. Hepatocyte Isolation

A cohort of 11-week-old ND-fed male Napepld∆Hep and WT mice were anesthetized with Ketamine-Xylazine (Nimatek, Eurovet Animal Health BV, Bladel, Netherlands-Rompun, Bayer Healthcare, Loos, France) solution. The mice were surgically opened and the liver was infused with a PBS solution containing EGTA and HEPES buffer injected in the portal vein via a 26 g needle at a rate of 9 mL/min for 10 min. Warm (37 °C) digestion medium including DMEM/F12, no glutamine (Thermo Fisher, Waltham, MA, USA), Penicillin-Streptomycin, HEPES buffer, thermolysin (Promega, Madison, WI, USA), collagenase G (Abiel, Palermo, Italy) and collagenase H (Abiel, Palermo, Italy) was then added for 7 min. The liver was then removed and incubated with the medium at 37 °C for 15 min for further digestion. The obtained solution was then filtered (70 µm) and centrifuged twice (4 °C, 50 g, 2 min) to allow the separation between hepatocytes and non-parenchymal cells (NPC). The resulting pellet contained the hepatocytes whereas NPC were enriched in the supernatant. After isolating the two fractions in different tubes, they were centrifuged (4 °C, 10,000× g, 10 min) and pellets were stored in −80 °C prior TriPure RNA extraction.

2.10. RNA Preparation and Real-Time qPCR Analysis

Total RNA was prepared from tissues using TriPure reagent (Roche Diagnostics, Penzberg, Germany). Quantification and integrity analysis of total RNA were performed by analyzing 1 μL of each sample in an Agilent 2100 Bioanalyzer (Agilent RNA 6000 Nano Kit, Agilent). cDNA was prepared by reverse transcription of 1 μg total RNA using the GoScript Reverse Transcriptase kit (Promega, Madison, WI, USA). Real-time PCR was performed with the QuantStudio 3 real-time PCR system (Thermo Fisher, Waltham, MA, USA). Rpl19 RNA was chosen as the housekeeping gene. All samples were performed in duplicate, and data were analyzed according to the 2−ΔΔCT method. The identity and purity of the amplified product were assessed by melting curve analysis at the end of amplification. The primer sequences for the targeted mouse genes are presented in Table 1.

2.11. Adipocyte Histological Analysis

SAT tissues were fixed in 4% formaldehyde. Hematoxylin and eosin staining was performed using standard protocols on 5-µm adipose tissue sections. Adipocyte size was determined using ImageJ software (version 1.50a, National Institutes of Health, Bethesda, MD, USA).

2.12. Hepatic Lipid Content Analysis by Oil Red O Staining

Liver tissue was embedded in Tissue-Tek Optimal Cutting Temperature compound (Sakura Europe, Leiden, Netherlands) and flash-frozen in cold isopentane. Five µm-tick tissue sections were stained with oil red O staining for lipid content analysis. Quantification of the mean droplet size was performed using ImageJ software (version 1.50a, National Institutes of Health, Bethesda, MD, USA).

2.13. Extraction of Liver Lipids

Total lipids were measured in the liver tissue after extraction in CHCl3:MeOH according to the Folch method [29] and adapted as follows: briefly, 100 mg of liver tissue was homogenized in 2 mL of CHCl3:MeOH (2:1) using a tissue lyser followed by an ultrasonic homogenizer. Four hundred microliter of 0.9% NaCl solution was added and lipids were then extracted by vigorous shaking. After centrifugation, the chloroform phase was recovered in glass tubes and dried under a stream of N2. Glass tubes were weighed before and after lipid extraction to quantify total lipid content. The dried residue was solubilized in 1.5 mL isopropanol.

2.14. Biochemical Analyses

Plasma non-esterified fatty acids (NEFA) and liver and plasma cholesterol and triglyceride concentrations were measured using kits coupling an enzymatic reaction with spectrophotometric detection of the reaction endproducts (Diasys Diagnostic and Systems, Holzheim, Germany) according to the manufacturer’s instructions.

2.15. Lipidomics Analysis

All lipids measured are presented in Table 2.
eCBome mediators. NAEs and other eCBome mediators were quantified by LC–MS/MS as described in Everard, Plovier and Rastelli et al. [22]. Briefly, liver lipids were injected in the HPLC system interfaced with the electrospray source of a Shimadzu 8050 triple quadrupole mass spectrometer and mass spectrometric analysis was done in the positive ion mode using multiple reaction monitoring using the specific mass transitions [30].
Oxysterols. Oxysterols were analyzed by LC-MS as previously reported [31]. Briefly, lipids were extracted, in the presence of internal standards, through liquid–liquid extraction, and then samples were prepurified by solid phase extraction. The eluate was recovered and injected in the LC–MS system consisting in an Accela HPLC system (Thermo Fisher Scientific) coupled to an LTQ-Orbitrap XL mass spectrometer (Thermo Fisher Scientific) equipped with an APCI probe used in positive mode. Lipids were quantified using calibration curves obtained using the same procedure.
Bile acids. Bile acids were quantified using a LC-MS method adapted from Guillemot-Legris et al. [32]. Liver samples were homogenized in ice-cold bi-distilled water. Proteins were then precipitated overnight at −20 °C using acetone containing deuterated internal standards. Supernatant was recovered and evaporated to dryness. The organic residue was resuspended in methanol and injected in the LC–MS system, equipped with an electrospray probe used in negative mode. Lipids were quantified using calibration curves obtained using the same procedure.

2.16. Ethics Statement

All mouse experiments were reviewed and approved by and performed in accordance with the guidelines of the local ethics committee for animal care of the Health Sector of the Université catholique de Louvain under the specific agreement numbers 2014/UCL/MD/022 and 2017/UCL/MD/005. Housing conditions were as specified by the Belgian Law of 29 May 2013 regarding the protection of laboratory animals (agreement number LA1230314). Every effort was made to minimize animal pain, suffering, and distress.

2.17. Statistical Analysis

Data were presented as the mean ± s.e.m. The difference between two groups was evaluated by a t-test. Differences between more than two groups were assessed by two-way ANOVA, followed by the Tukey post hoc test. Data were analyzed with GraphPad Prism (GraphPad Software).

3. Results

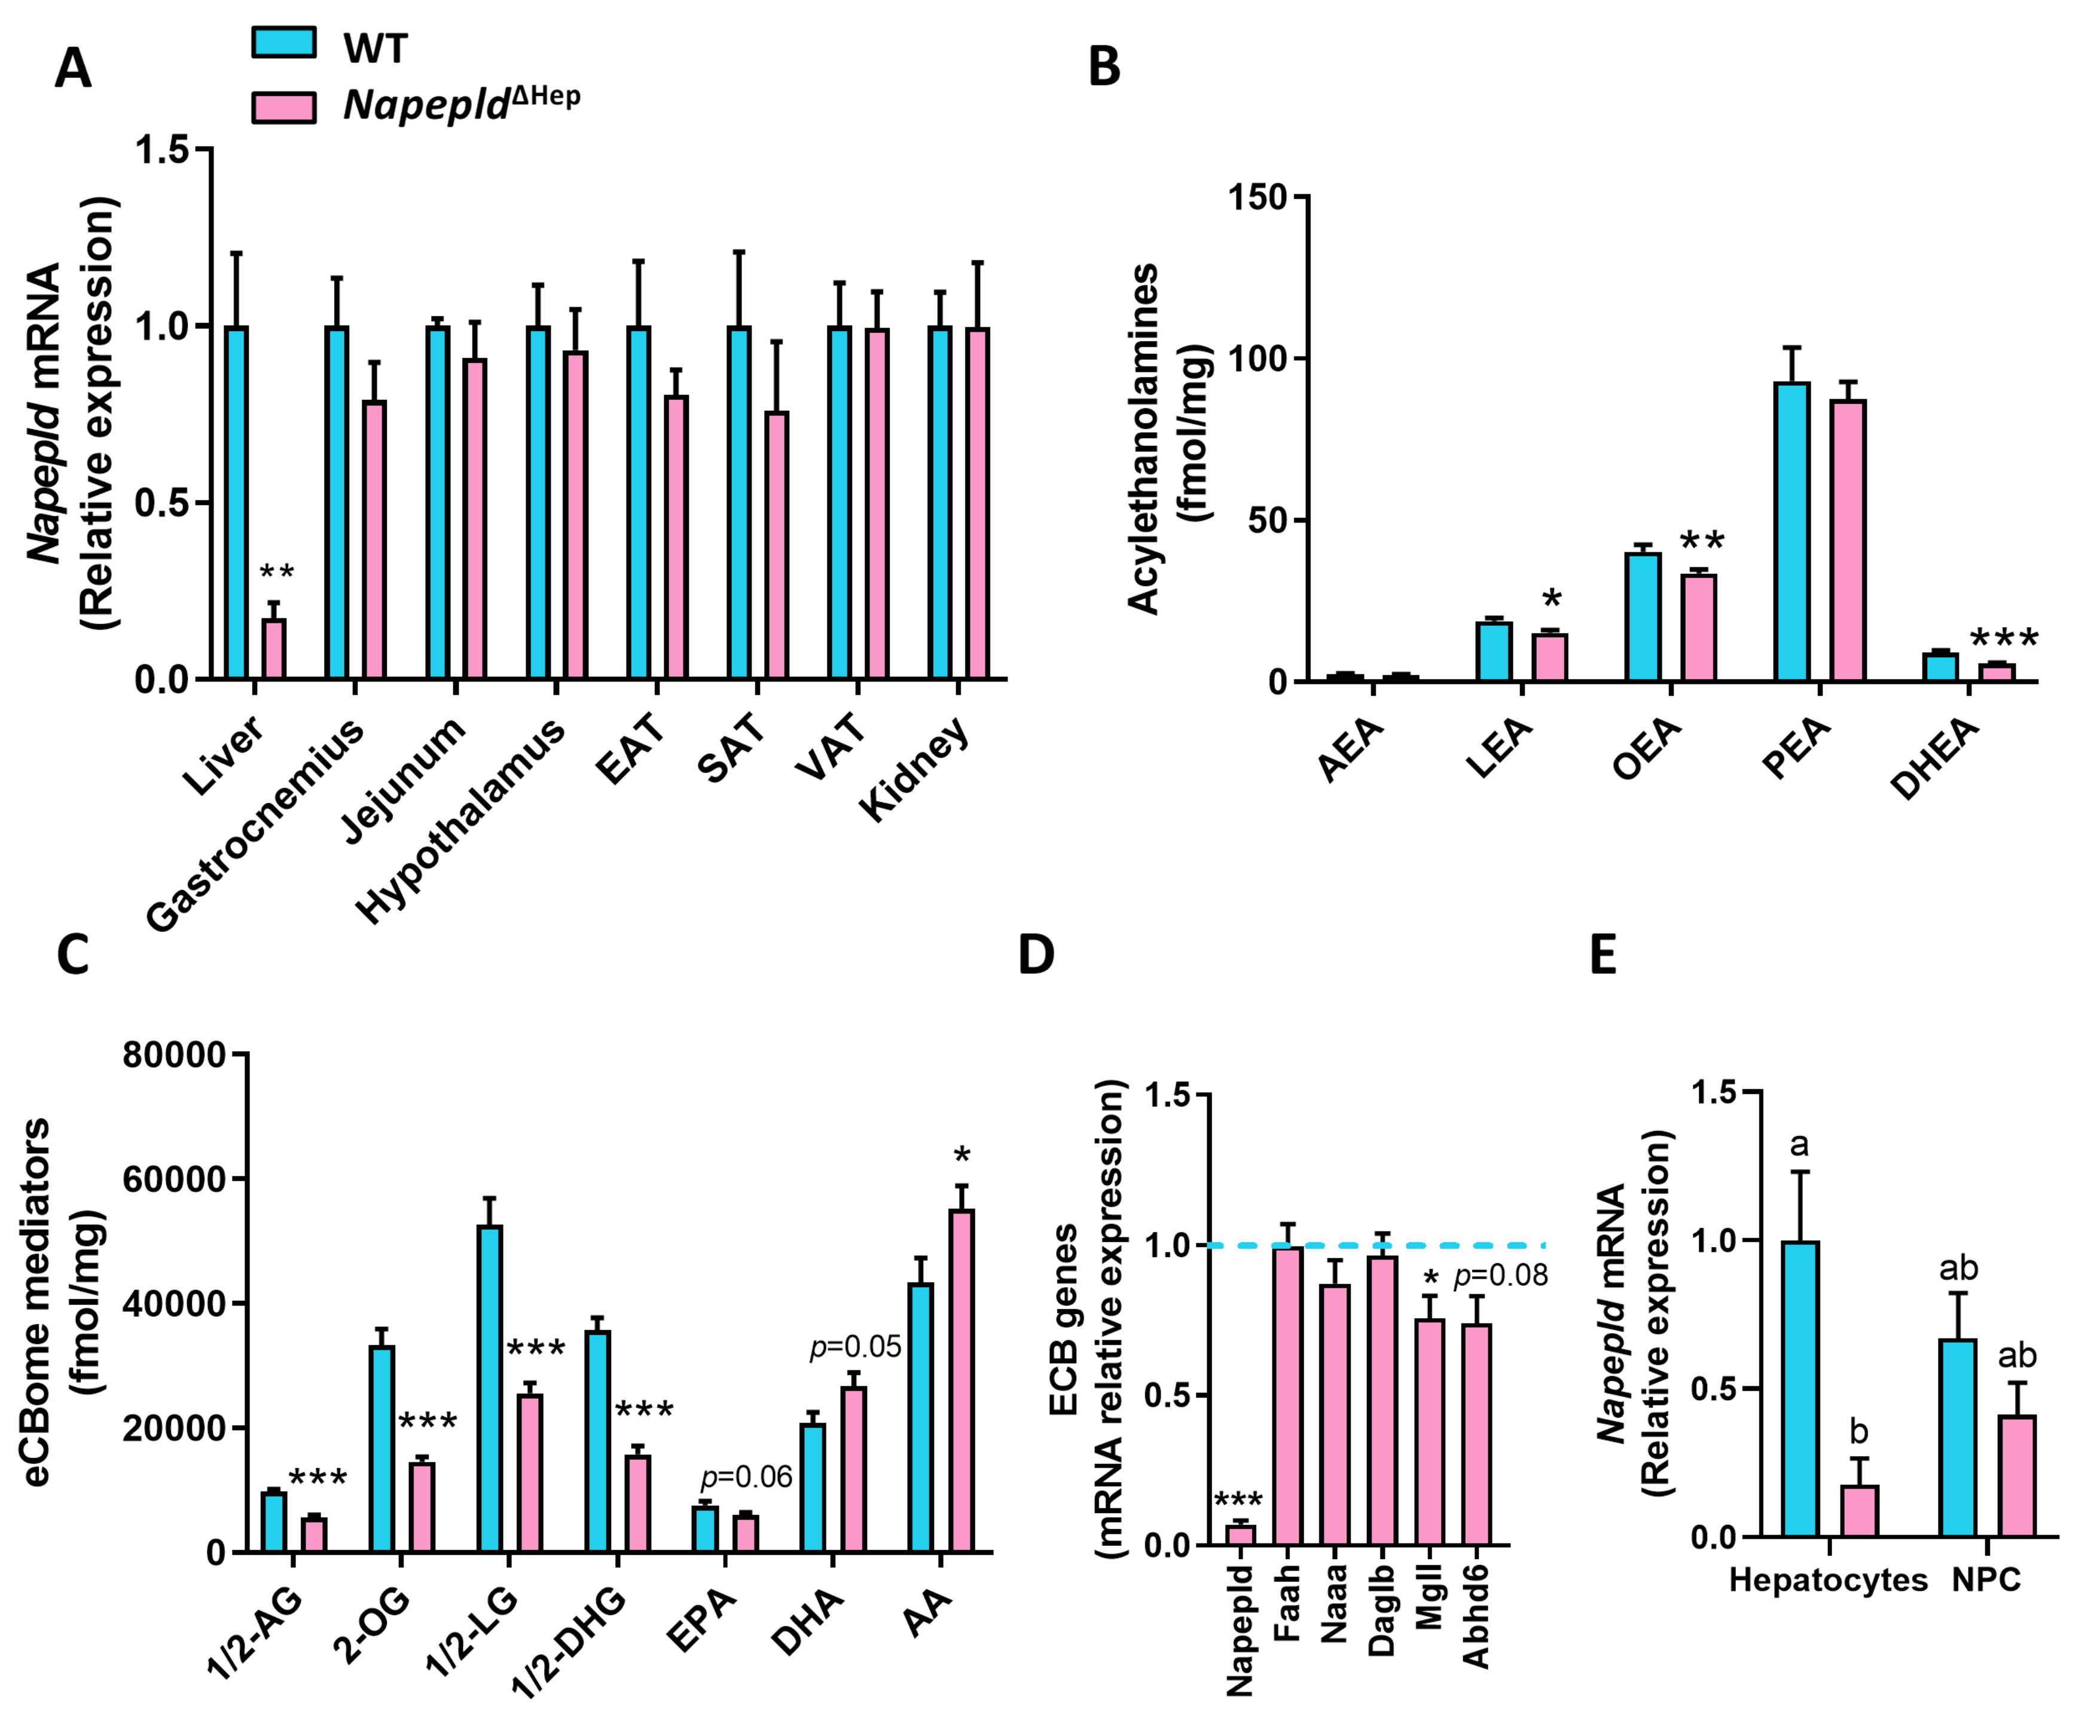
3.1. Hepatocyte-Specific Deletion of Napepld

To explore the role of liver NAPE-PLD on metabolism, Napepld∆Hep mice were generated by crossing Albumin-CreERT2 mice [27] with Napepldlox/lox mice [21]. The liver specificity of the deletion upon tamoxifen treatment was assessed by quantifying Napepld messenger RNA (mRNA) expression in the liver and in several organs including adipose tissues, brain, intestine, muscle or the kidney of wild-type (WT) and Napepld∆Hep mice fed a control diet (Figure 1A). As expected, the liver was the unique organ exhibiting a strong reduction of Napepld mRNA expression confirming the liver specificity of the model. In accordance with this data, the deletion was also observed by in situ hybridization performed on liver slices of both genotypes since the Napepld-specific probe was not detected in Napepld∆Hep hepatocytes (Figure S1A).
Next, we measured the NAEs produced by NAPE-PLD in the liver of WT and Napepld∆Hep mice (Figure 1B). The levels of OEA and LEA were significantly lower, as mirrored by the 20% reduction, in Napepld∆Hep livers compared to WT whereas no change was reported regarding AEA and PEA levels. These data support the existence of alternative pathways, possibly tissue- and cell-specific for NAE biosynthesis. This alternative pathway has been largely described for AEA biosynthesis, which is also consistent with our previous studies [15,16,21,33,34,35]. Surprisingly, almost all the lipid congeners related to the eCBome (i.e., acylglycerols) were affected in the liver of Napepld∆Hep mice, suggesting that NAPE-PLD could, albeit indirectly, control the biosynthesis of a larger group of bioactive lipids in the liver than initially thought (Figure 1C and Figure S1B). The altered lipid profile could not be explained by a major impact on the other biosynthetic and degrading enzymes for these mediators because the monoacylglycerol lipase (Mgll) was the only enzyme significantly altered at the mRNA level, as reflected by a 25% decreased expression, in Napepld∆Hep livers as compared to WT (Figure 1D).
To further validate the specific deletion of NAPE-PLD in hepatocytes, we separated these cells from the hepatic non-parenchymal cells (NPC). Of interest, the purity of both fractions was measured by various markers: the NPC fraction was assessed by an increased mRNA expression of F4/80, Cd31, Acta2 and Ck19, which are specific to Kupffer cells, sinusoidal endothelial cells, stellate cells and cholangiocytes respectively whereas a higher expression of Hnf4a was unique to the hepatocyte fraction (Figure S1C) [36,37,38,39]. Our data showed that the expression of Napepld was markedly decreased in the hepatocyte enriched fraction from Napepld∆Hep mice, while the NPC were not significantly affected (Figure 1F).
Altogether, these data confirm the invalidation of the Napepld gene in hepatocytes and highlight a new role of NAPE-PLD in the regulation of liver lipid metabolism.

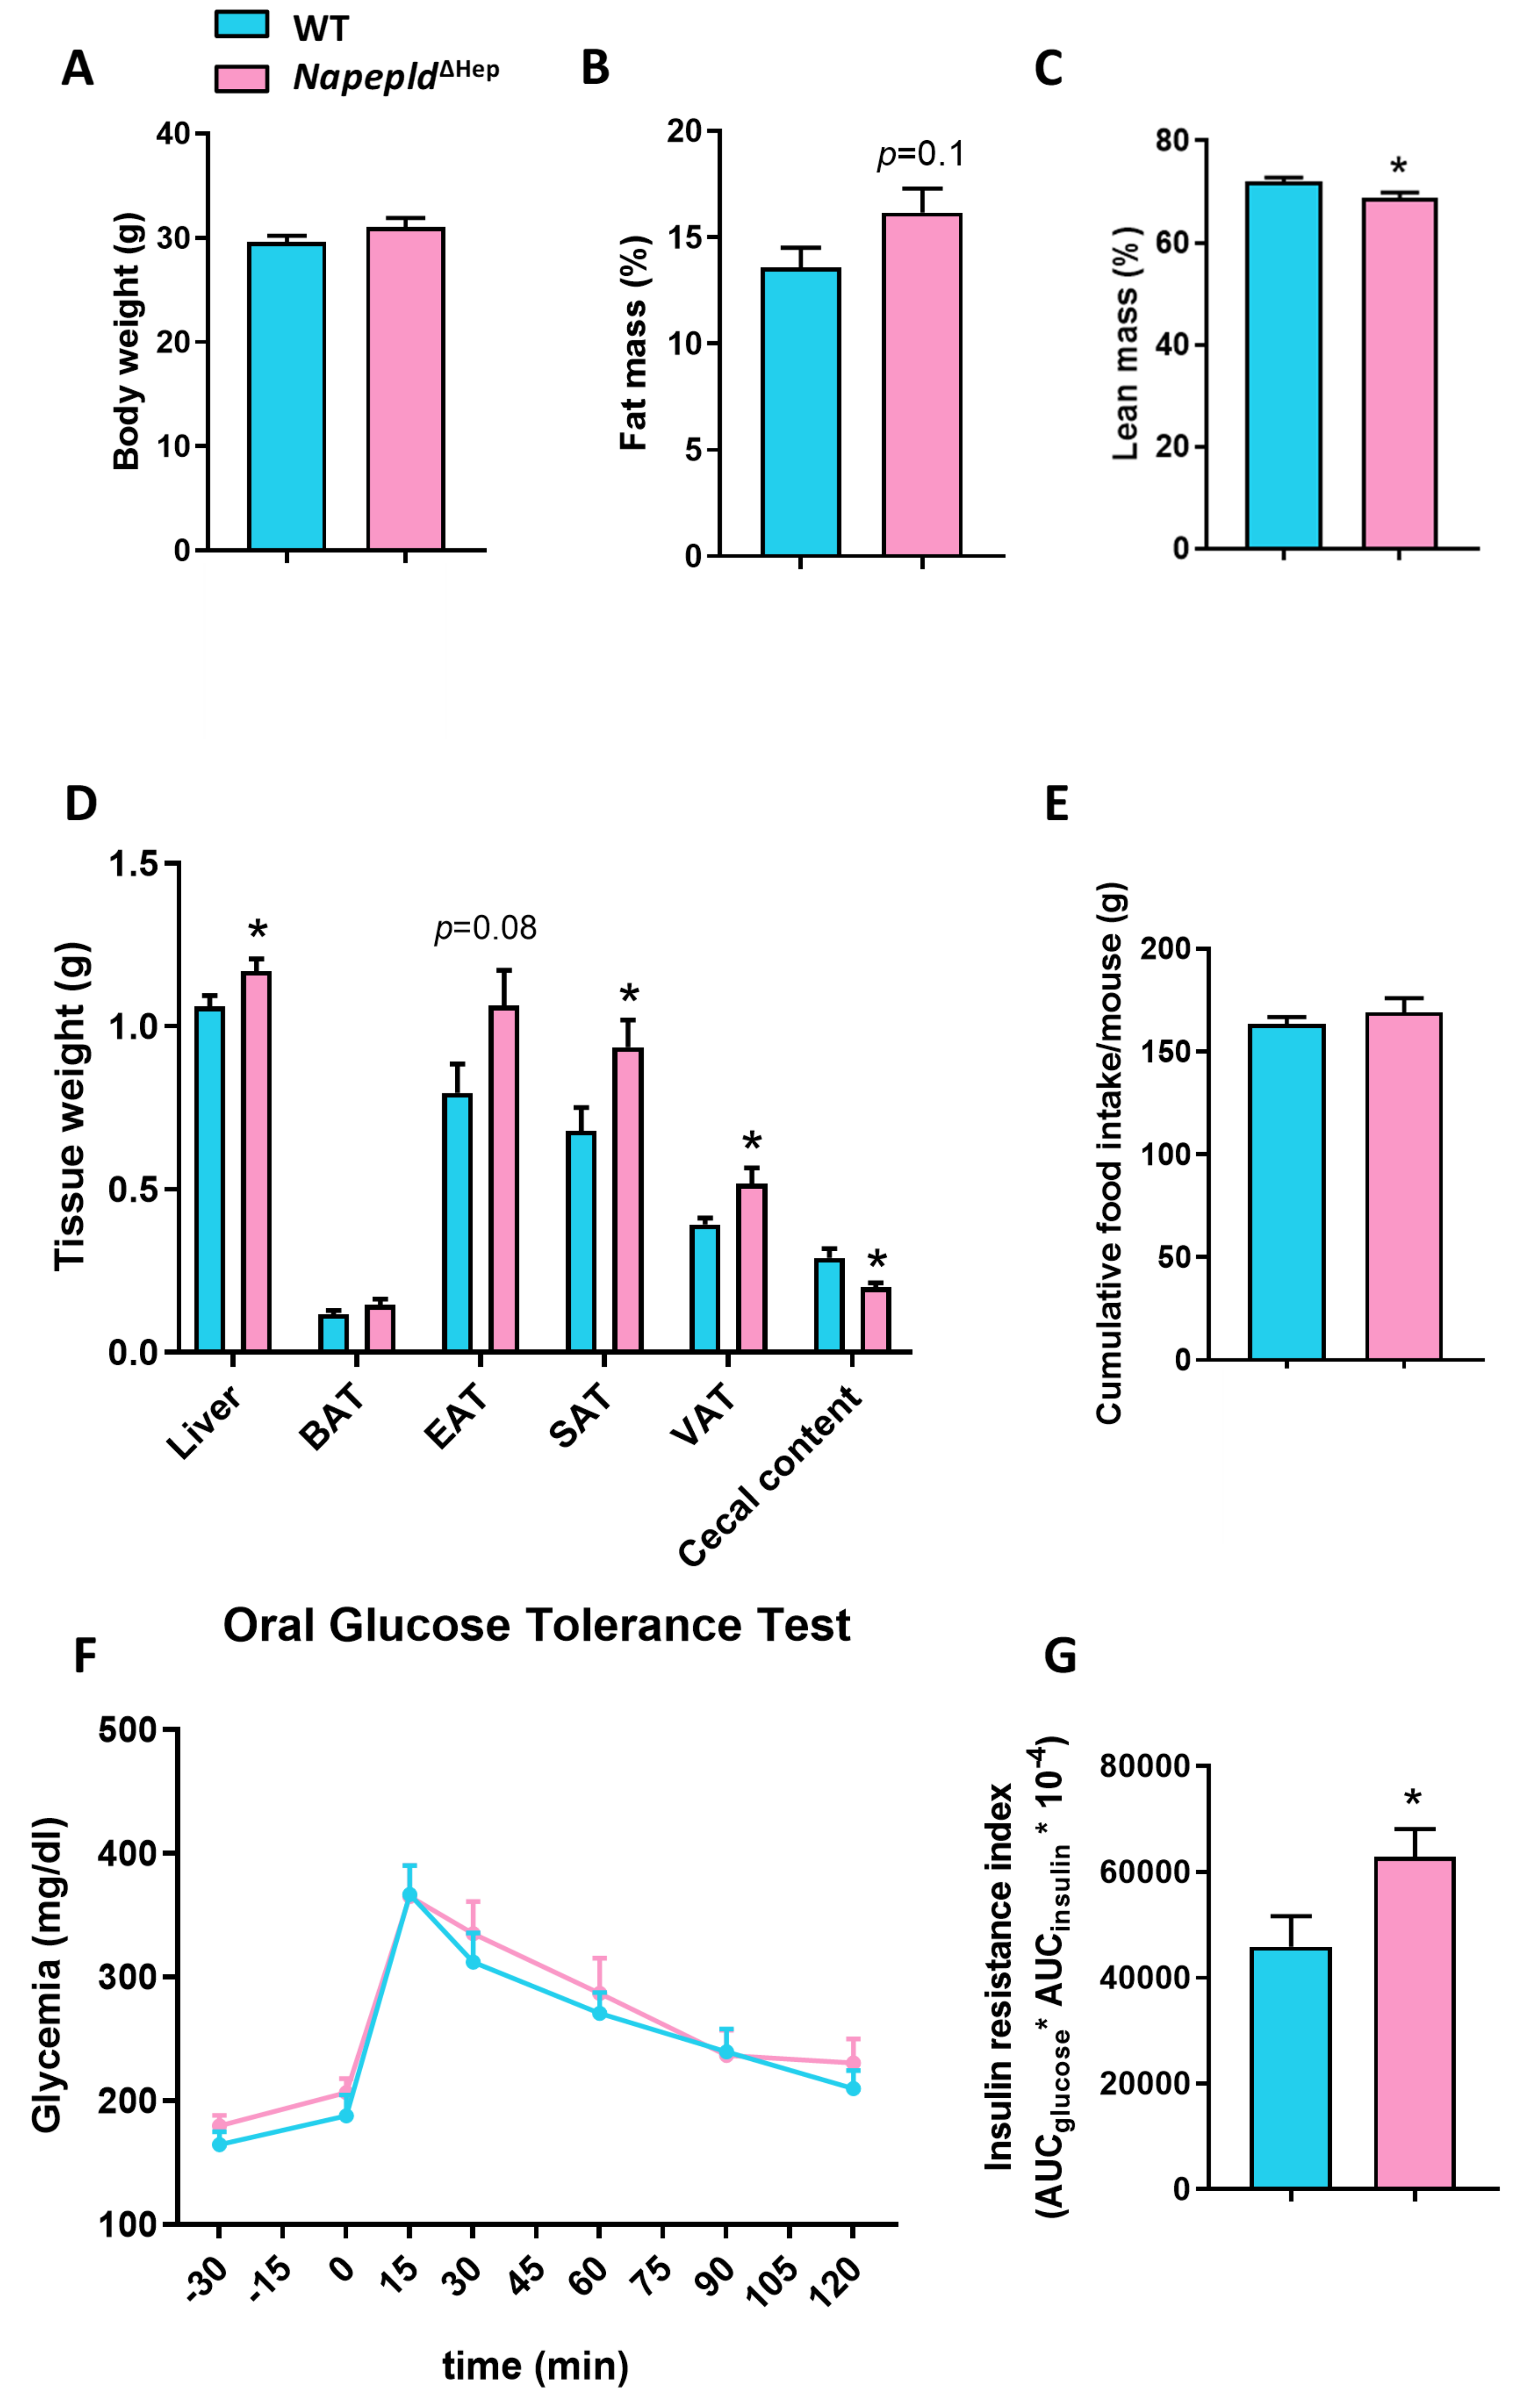
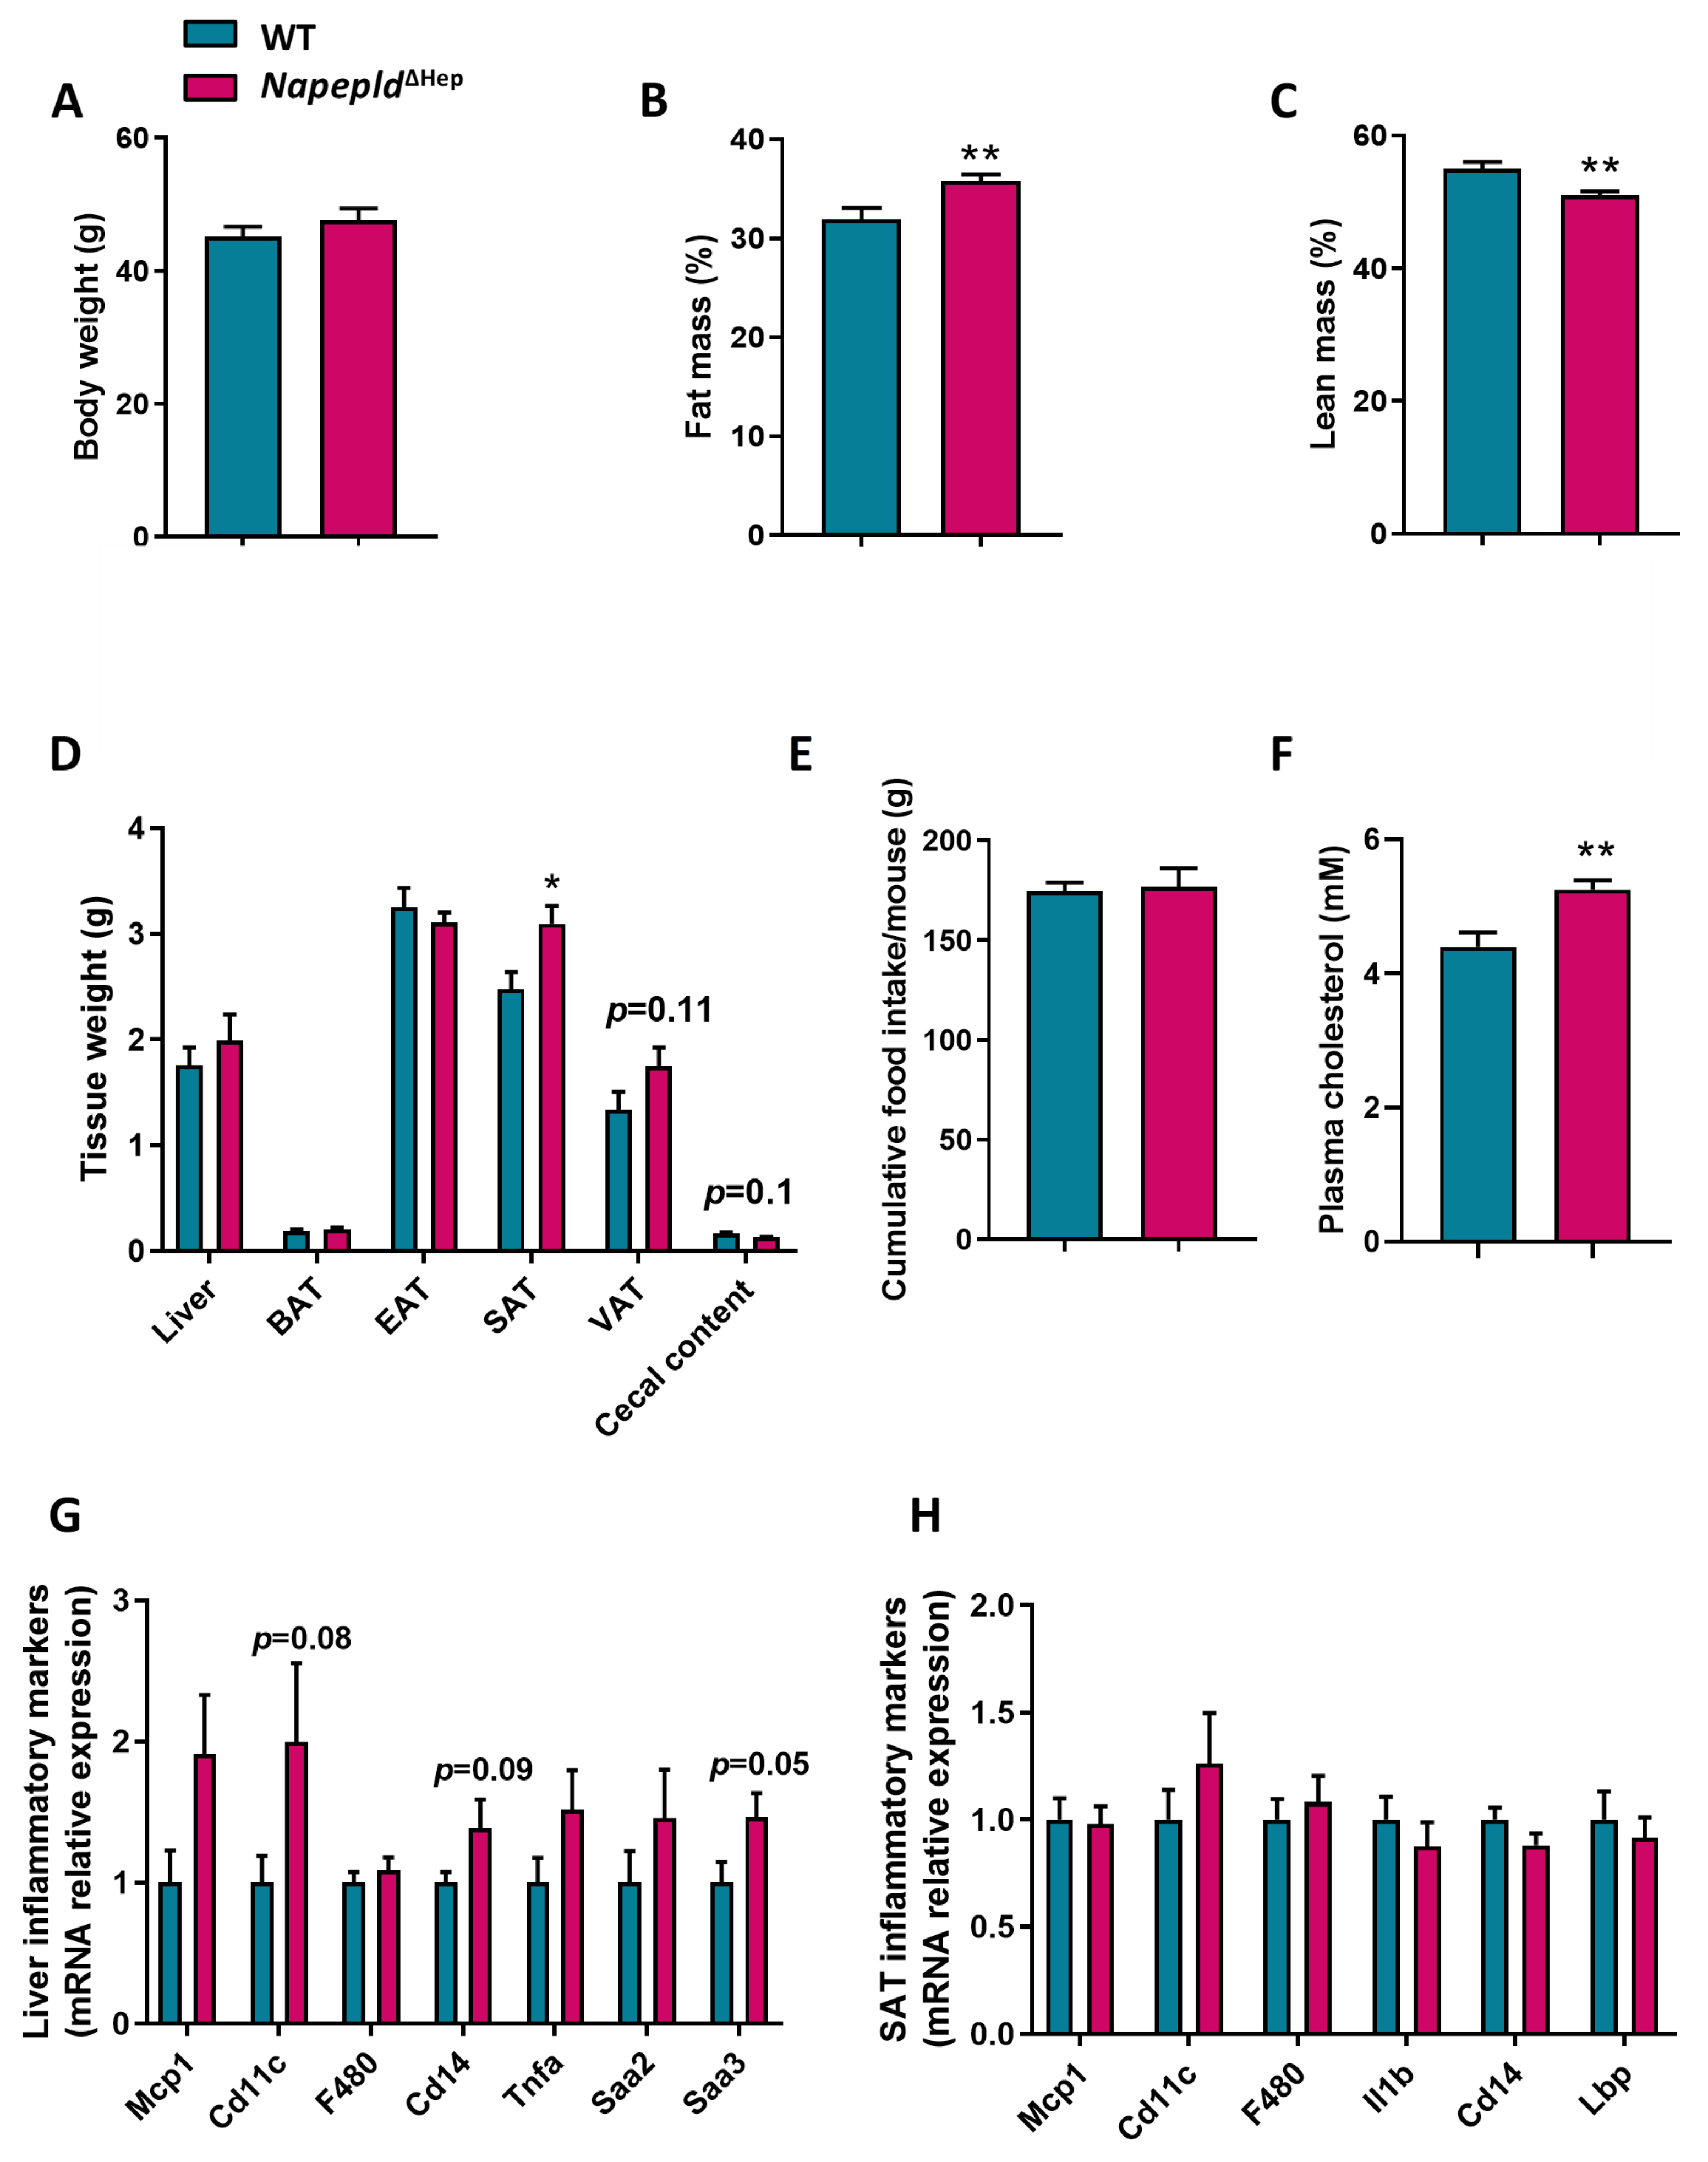
3.2. Napepld∆Hep Mice Develop a High-Fat Diet-Like Phenotype upon Normal Diet

To assess whether the Napepld deletion in hepatocytes affects the whole-body metabolism, we followed a cohort of WT and Napepld∆Hep mice fed a control diet for 7 weeks. Strikingly, although the body weight of the two genotypes was equivalent at the end of the experiment, nuclear magnetic resonance (NMR) revealed that Napepld∆Hep mice tended to have a higher percentage of fat mass and a significantly lower percentage of lean mass compared to WT mice (Figure 2A–C). The fat mass accumulation was reflected by increased adipose tissue weights in Napepld∆Hep mice, obtained after precise dissection. The liver weight of Napepld∆Hep mice was also higher compared to WT mice, while a significant reduction of the cecal content was observed in Napepld∆Hep mice (Figure 2D). All the aforementioned measures observed in Napepld∆Hep mice are usually reported in the animal model of diet-induced obesity and this effect could not be attributed to an increase in food intake (Figure 2E). Therefore, we evaluated the impact of hepatocyte Napepld deletion on whole-body glucose metabolism by performing an oral glucose tolerance test (OGTT). The glycemia of WT and Napepld∆Hep mice was similar during the test (Figure 2F). However, Napepld∆Hep mice exhibited a higher insulin resistance index (Figure 2G), mainly explained by elevated plasma insulin levels (Figure S2).
Overall, Napepld∆Hep mice display a high-fat diet-like phenotype without developing glucose intolerance.

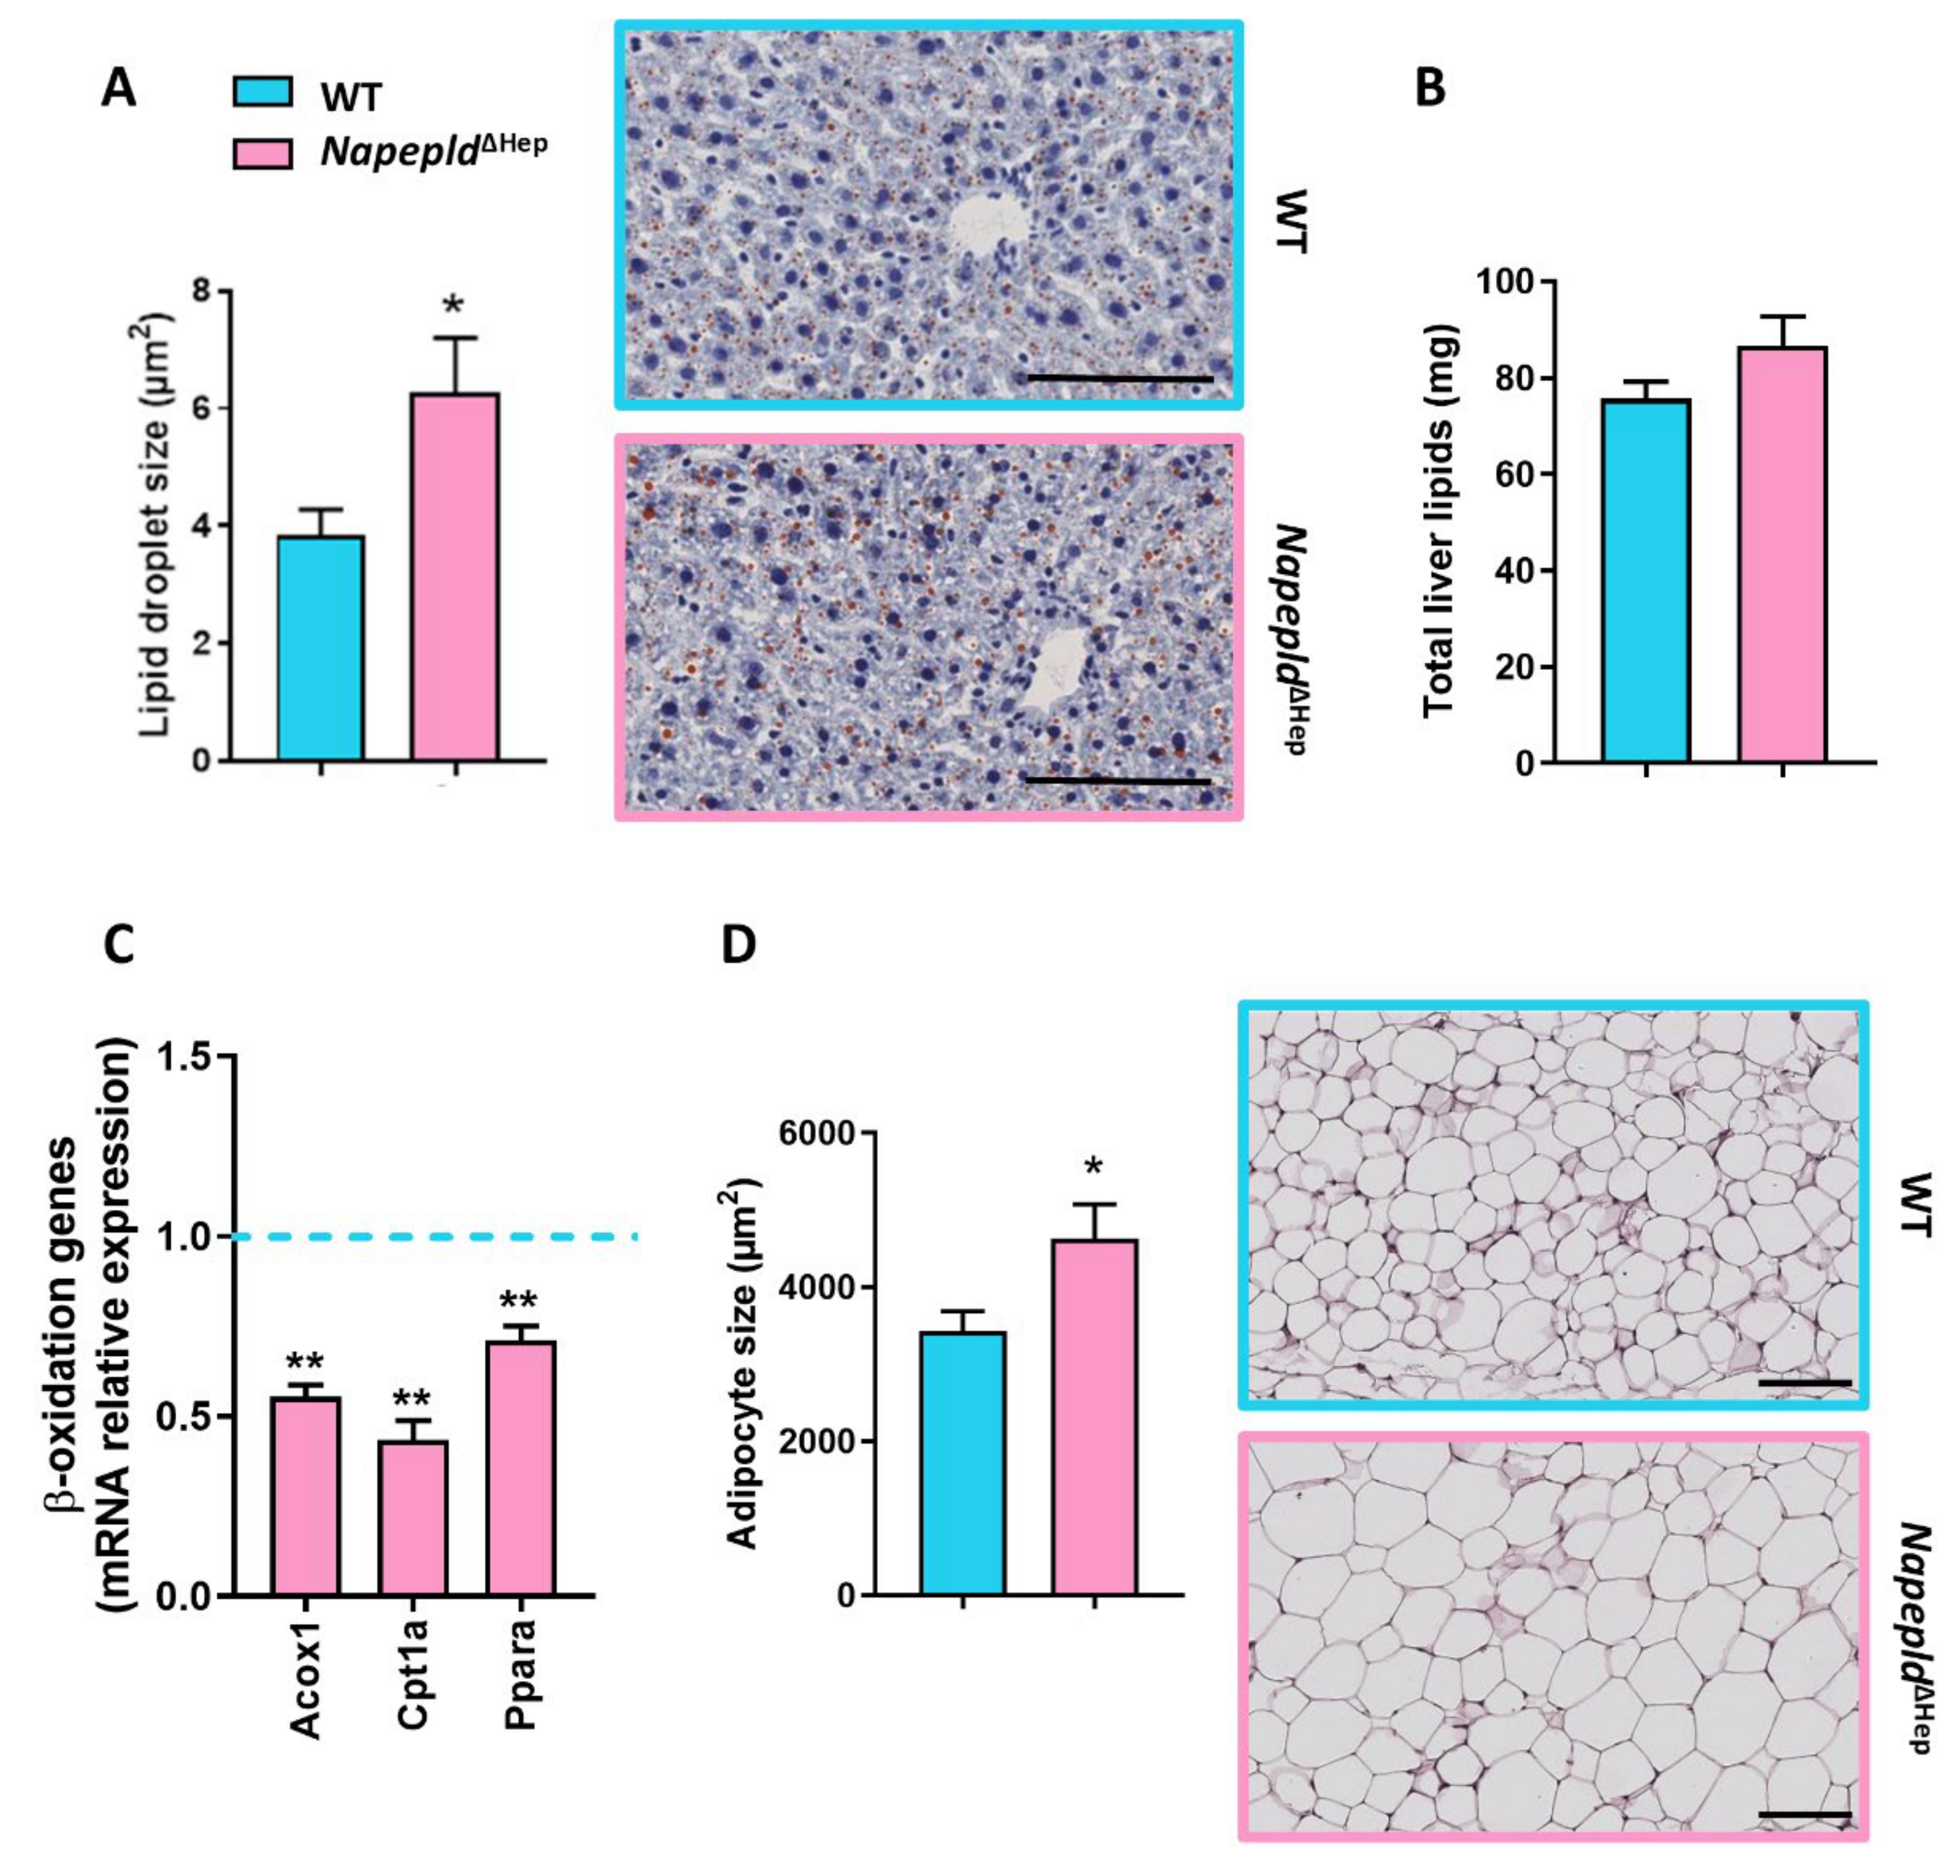
3.3. Napepld∆Hep Mice Are More Sensitive to Liver Lipid Accumulation

Since Napepld∆Hep mice displayed an altered liver lipid metabolism as well as a higher liver weight, we wondered whether this latter was due to an accumulation of liver lipids. To address this question, we first performed histology analysis by staining liver slices of WT and Napepld∆Hep mice with oil red O dye, which highlights lipid droplet in red. Although the global liver morphology was similar between both genotypes, the lipid droplet size was larger in Napepld∆Hep liver compared to WT (Figure 3A). In parallel, gravimetric and biochemical measurements were conducted to quantify liver lipid content in WT and Napepld∆Hep mice. In accordance with the 10% increased of liver mass, the results, albeit not significant, showed a slight elevation in total liver lipid (15%) and triglyceride (11%) levels in Napepld∆Hep liver (Figure 3B and Figure S3A). To gain a better insight into the origins of the higher liver lipid accumulation, we investigated the enzymes involved in the β-oxidation pathway including peroxisomal acyl-coenzyme A oxidase 1 (Acox1), carnitine O-palmitoyltransferase 1α (Cpt1a) and peroxisome proliferator-activated receptorα (Ppara; Figure 3C). Strikingly, all studied genes were downregulated at the mRNA level indicating that the absence of Napepld in hepatocytes could contribute to this phenomenon. Besides, we also explored the adipose tissue metabolism given that this organ plays a pivotal role on lipid storage and release. By carrying out hematoxylin and eosin staining on SAT deposits, we discovered that the size of adipocytes was larger in Napepld∆Hep mice strengthening the high-fat diet-like phenotype exhibited by these mutant mice (Figure 3D). Additionally, because insulin resistance can be linked with a higher release of circulating free fatty acids promoted by the lipolysis and that Napepld∆Hep mice had a higher insulin resistance index, we quantified plasma lipid levels. We discovered that plasma triglyceride level tended to increase (p = 0.05) whereas plasma non-esterified fatty acids (NEFA) and cholesterol levels were unchanged in both groups (Figure S3B–D).
All the aforementioned results indicate that deletion of NAPE-PLD in hepatocytes contributes to liver lipid accumulation by affecting β-oxidation pathway rather than lipolysis.

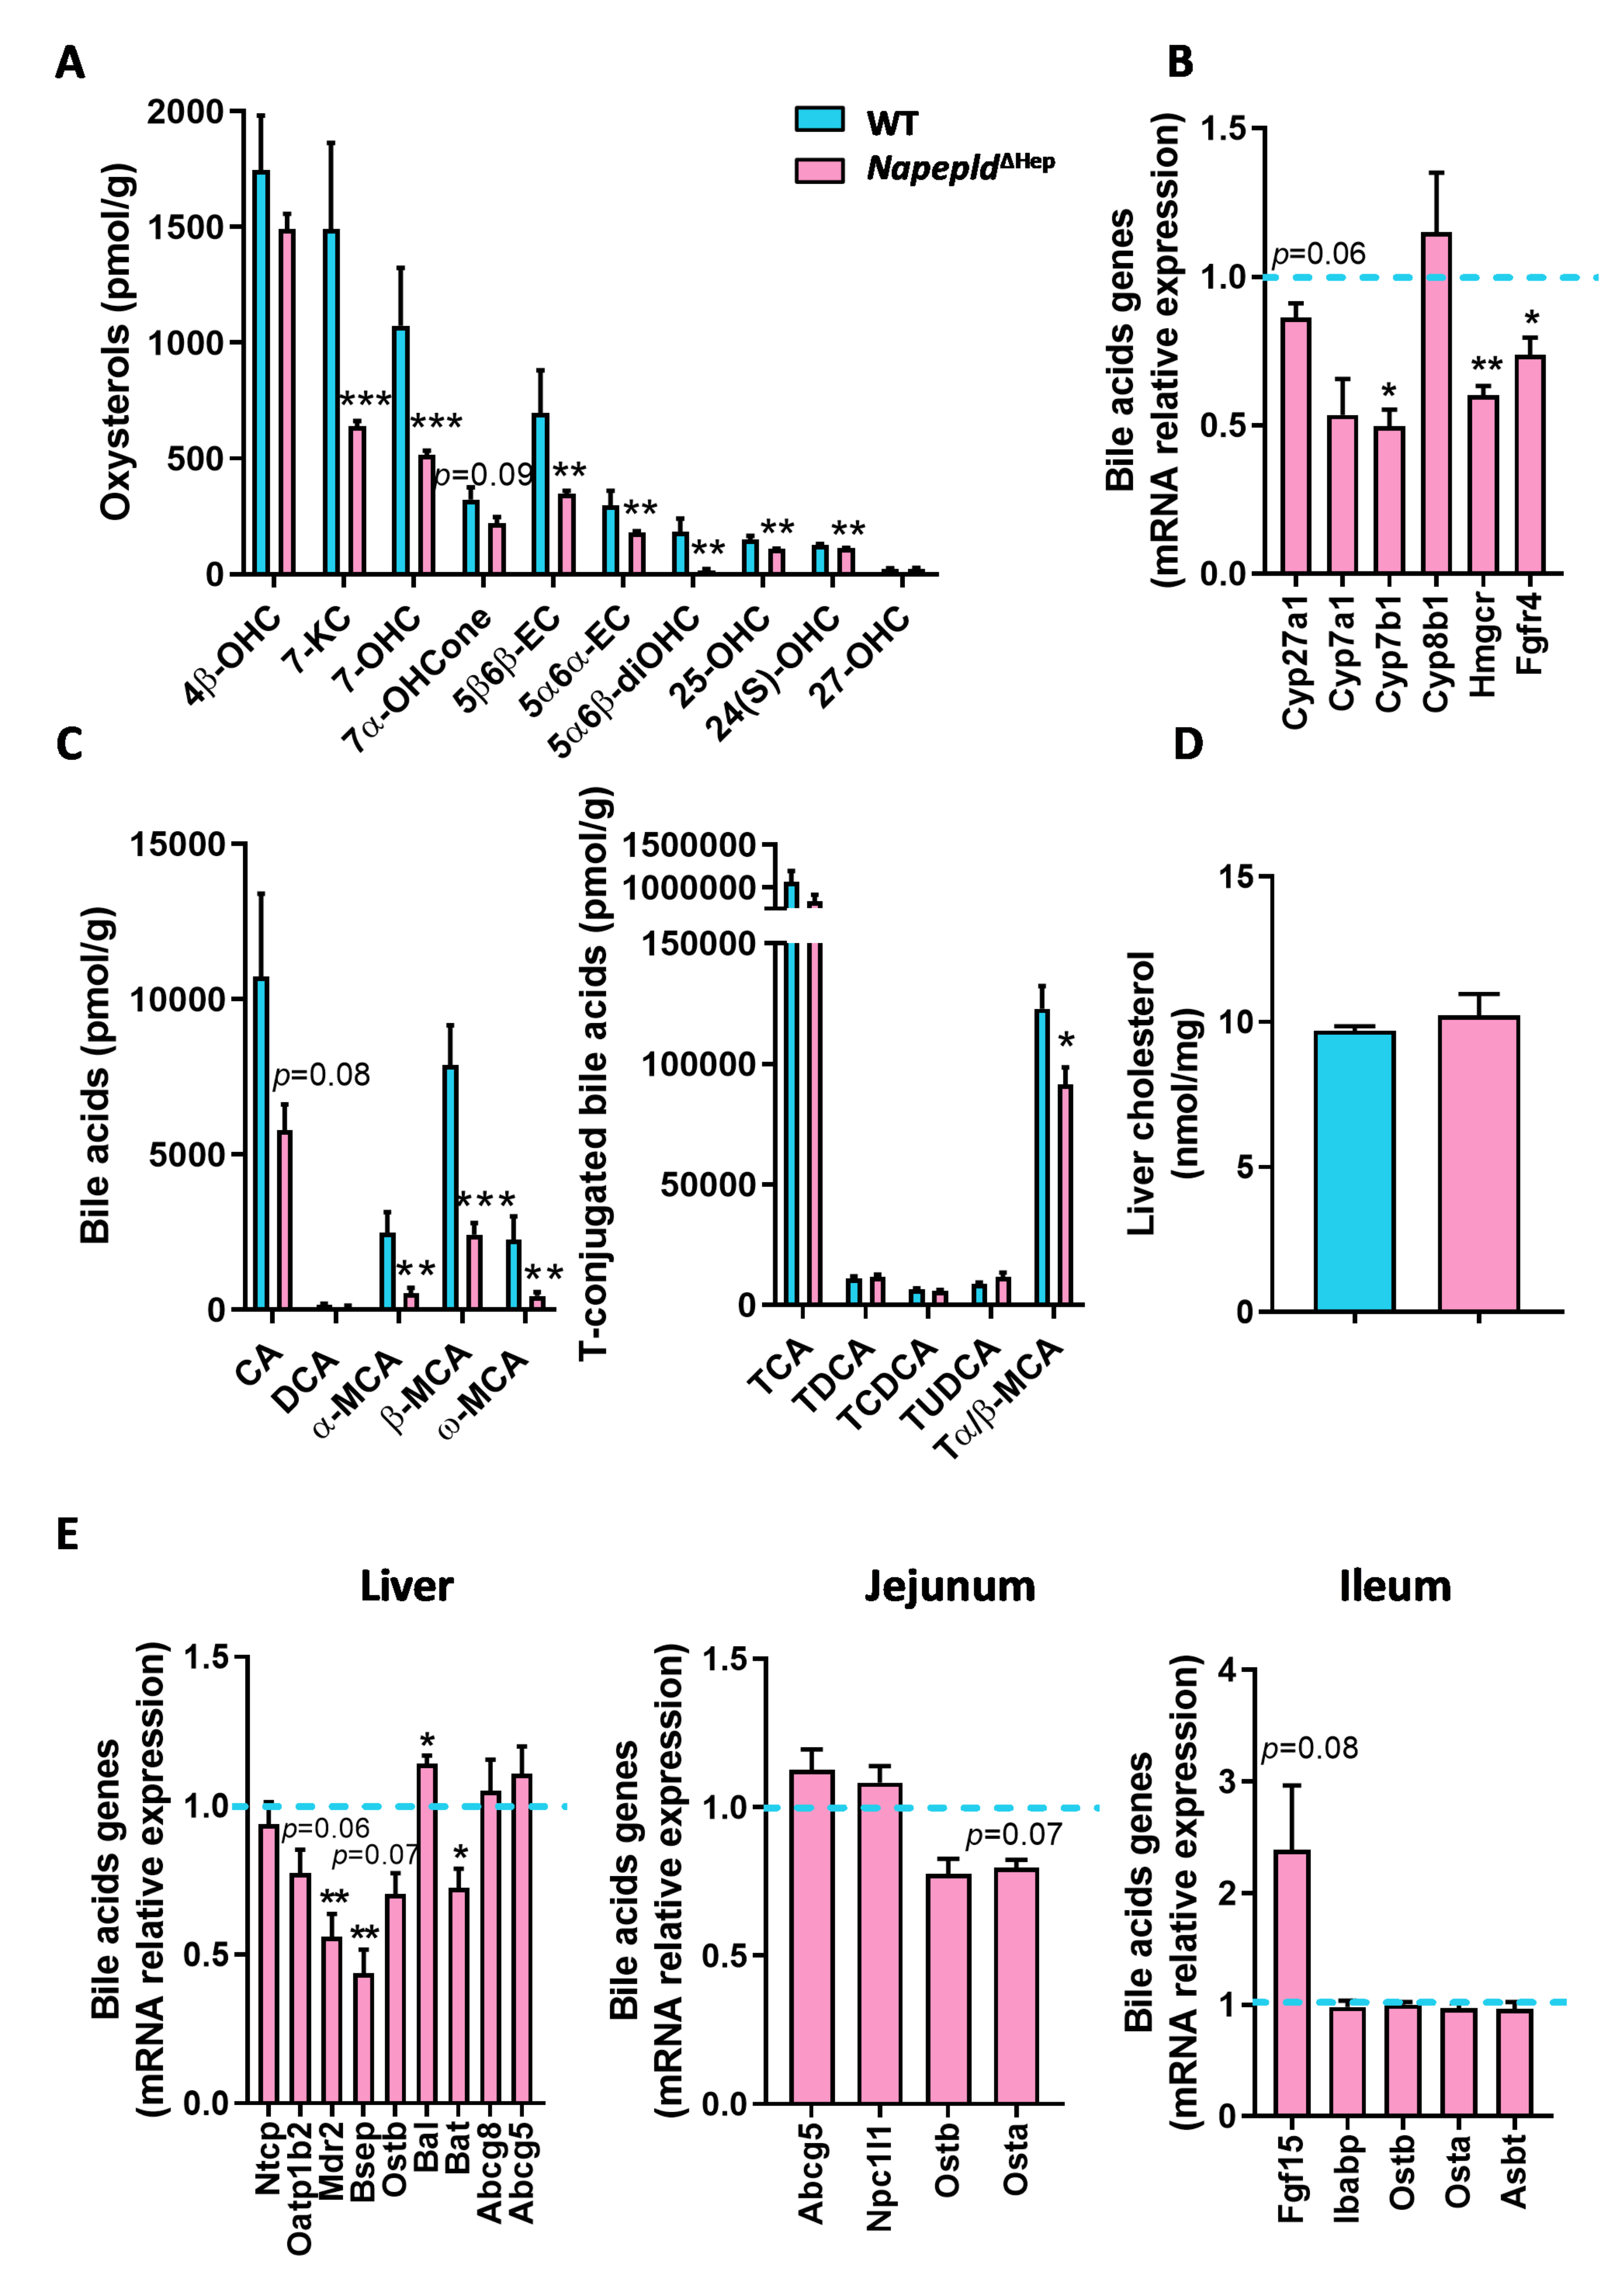
3.4. Hepatocyte Napepld Deletion Modifies Liver Bioactive Lipid Metabolism

Our first liver lipidomic analysis regarding NAEs and eCBome mediators comparing WT and Napepld∆Hep mice revealed that NAPE-PLD deletion impacts lipid regulation beyond NAEs synthesis. To investigate the effect of NAPE-PLD deletion on additional lipid mediators in the liver, we quantified two important liver lipid families derived from cholesterol oxidation, namely the bile acids and their precursors, the oxysterols. Surprisingly, almost all bioactive lipids belonging to both families were strongly decreased in Napepld∆Hep mice in comparison to WT (Figure 4A,C). To better characterize this altered lipid profile, we studied the gene expression of enzymes responsible for the synthesis of cholesterol and bile acid metabolism. We found a significant downregulation of Cyp7b1 and Hmgcr mRNA and a tendency for decreased Cyp27a1 mRNA (p = 0.06; Figure 4B). This finding is in line with the reduced concentrations of these bioactive lipids in the liver of Napepld∆Hep mice. We also explored the enterohepatic feedback loop of bile acid metabolism by examining the mRNA expression of receptors and transporters related to the recirculation of bile acids to the liver (Figure 4E). After their synthesis in hepatocytes and prior to secretion into the biliary canaliculi, bile acids must be conjugated with taurine in mice or glycine in humans. Interestingly, the enzymes involved in bile acid conjugation, bile acid CoA ligase (Bal) and bile acid CoA:amino acid N-acyltransferase (Bat), were already altered in this first step in Napepld∆Hep mice. Following conjugation, bile acids cannot diffuse across membranes and need specific transporters to go through hepatocyte membrane. As such, the organic solute transporter (OST)β mediates bile acid efflux and the bile salt export protein (BSEP) allows them to reach biliary canaliculi. In this study, we found that Ostb tended to be reduced (p = 0.07) while Bsep was significantly downregulated in Napepld∆Hep mice suggesting a decreased secretion of bile salts. Of interest, the bile is also composed of phospholipids and cholesterol, which are transported from hepatocytes to the gallbladder by respectively multidrug resistance protein 2 (MDR2) and ATP-binding cassette sub-family G member (ABCG)5 and ABCG8. Mdr2 mRNA expression was significantly decreased in Napepld∆Hep livers whereas cholesterol transporters were reported unchanged. In addition, transporters in charge of the reabsorption of bile acids in hepatocytes such as the sodium (Na+)-taurocholate cotransporting polypeptide (NTCP) and the organic anion transporter (OATP)1B2 were also investigated. Although Ntcp mRNA expression was similar in both groups, Oatp1b2 tended to be reduced in Napepld∆Hep mice (p = 0.06). In the jejunum and ileum, however, we found no significant difference in mRNA level of bile acid transporters such as the apical sodium-dependent transporter (ASBT) or OSTα/OSTβ that would have indicated a change in bile acid reabsorption. Besides, the expression of intestinal bile acid-binding protein (Ibabp) that facilitates the travel of bile acids from the apical to the basolateral membrane of enterocytes was not different either between groups. Of note, the enterohepatic feedback loop is also driven by the stimulation of the endocrine hormone fibroblast growth factor (FGF)-15. This latter is induced by the activation of farnesoid receptor X (FXR) by specific bile acids in the enterocyte and then secreted into the portal circulation to repress bile acid synthesis by inhibiting cytochrome P450 enzyme (CYP)7A1 and (CYP)8B1 via fibroblast growth factor receptor (FGFR)4 receptor expressed in the liver. We found that Fgf15 expression doubled in the ileum of Napepld∆Hep mice as compared to WT (p = 0.08) whereas Fgfr4 was downregulated. Although the increased level of Fgf15 could contribute mildly to the slight decrease in Cyp7a1 expression, no significant repression was reported regarding Cyp7a1 and Cyp8b1 mRNA expressions in the liver of Napepld∆Hep mice. This suggests that the enterohepatic feedback loop is functional in enterocytes but not properly active in the liver. Finally, the deletion of hepatocyte Napepld did not change total liver cholesterol content (Figure 4D) nor the expression of cholesterol transporters measured both in the liver (Abcg5 and Abcg8) and in the intestine (Abcg5 and Npc1l1). Thereby, it indicates that hepatocyte NAPE-PLD influences bile acid and oxysterol production without affecting cholesterol secretion and absorption.
Taken together, these findings demonstrate a strong link between hepatic Napepld and the regulation of cholesterol-derived lipid metabolism.

3.5. Deletion of Napepld Partially Accentuates the Obese Phenotype Induced by a High-Fat Diet

Given that, in the absence of Napepld in hepatocytes, the mice fed control diet developed a high-fat diet-like phenotype, we wondered whether challenging the mice with a high-fat diet (HFD) would worsen the phenotype. After 8 weeks of HFD, Napepld∆Hep mice had a higher percentage of fat mass and a decreased percentage of lean mass compared to WT. This was independent of food intake or body weight (Figure 5A–C,E). Subcutaneous adipose tissue (SAT) was significantly increased and visceral adipose tissue (VAT) tended to be larger (p = 0.1) in Napepld∆Hep mice. Similarly to what observed upon the normal diet, in this experiment the cecal content also tended to be reduced in Napepld∆Hep mice as compared to WT mice exposed to HFD (Figure 5D). Moreover, biochemical analyses showed an elevated concentration of plasma cholesterol in Napepld∆Hep mice whereas no change was reported for plasma triglycerides (Figure 5F and Figure S4F).
Although, Napepld∆Hep mice exhibited an exacerbated fat mass accumulation, they did not develop a worsened glucose intolerance nor higher plasma insulin level compared to WT during the OGTT suggesting that the potential effect of NAPE-PLD on insulin level might be hidden by the diet itself, which could be the main driver (Figure S4A–E). However, the inflammatory tone in the liver of Napepld∆Hep mice tended to be higher as reflected by RT-qPCR measurements of inflammatory markers such as cluster of differentiation 11c (Cd11c; p = 0.08) that reflects activated macrophages, cluster of differentiation 14 (Cd14; p = 0.09) that contributes to endotoxin-induced inflammation or serum amyloid A3 (Saa3; p = 0.05) which encodes an acute phase protein that increases upon inflammation (Figure 5G). Of interest, this trend was not observed in adipose tissue suggesting that hepatocyte NAPE-PLD exerts a substantial function locally rather than distally regarding the inflammatory response (Figure 5H).
Collectively, the results show that following a nutritional stress, Napepld∆Hep mice store a greater amount of fat and seem predisposed to develop high-fat diet-induced inflammation.

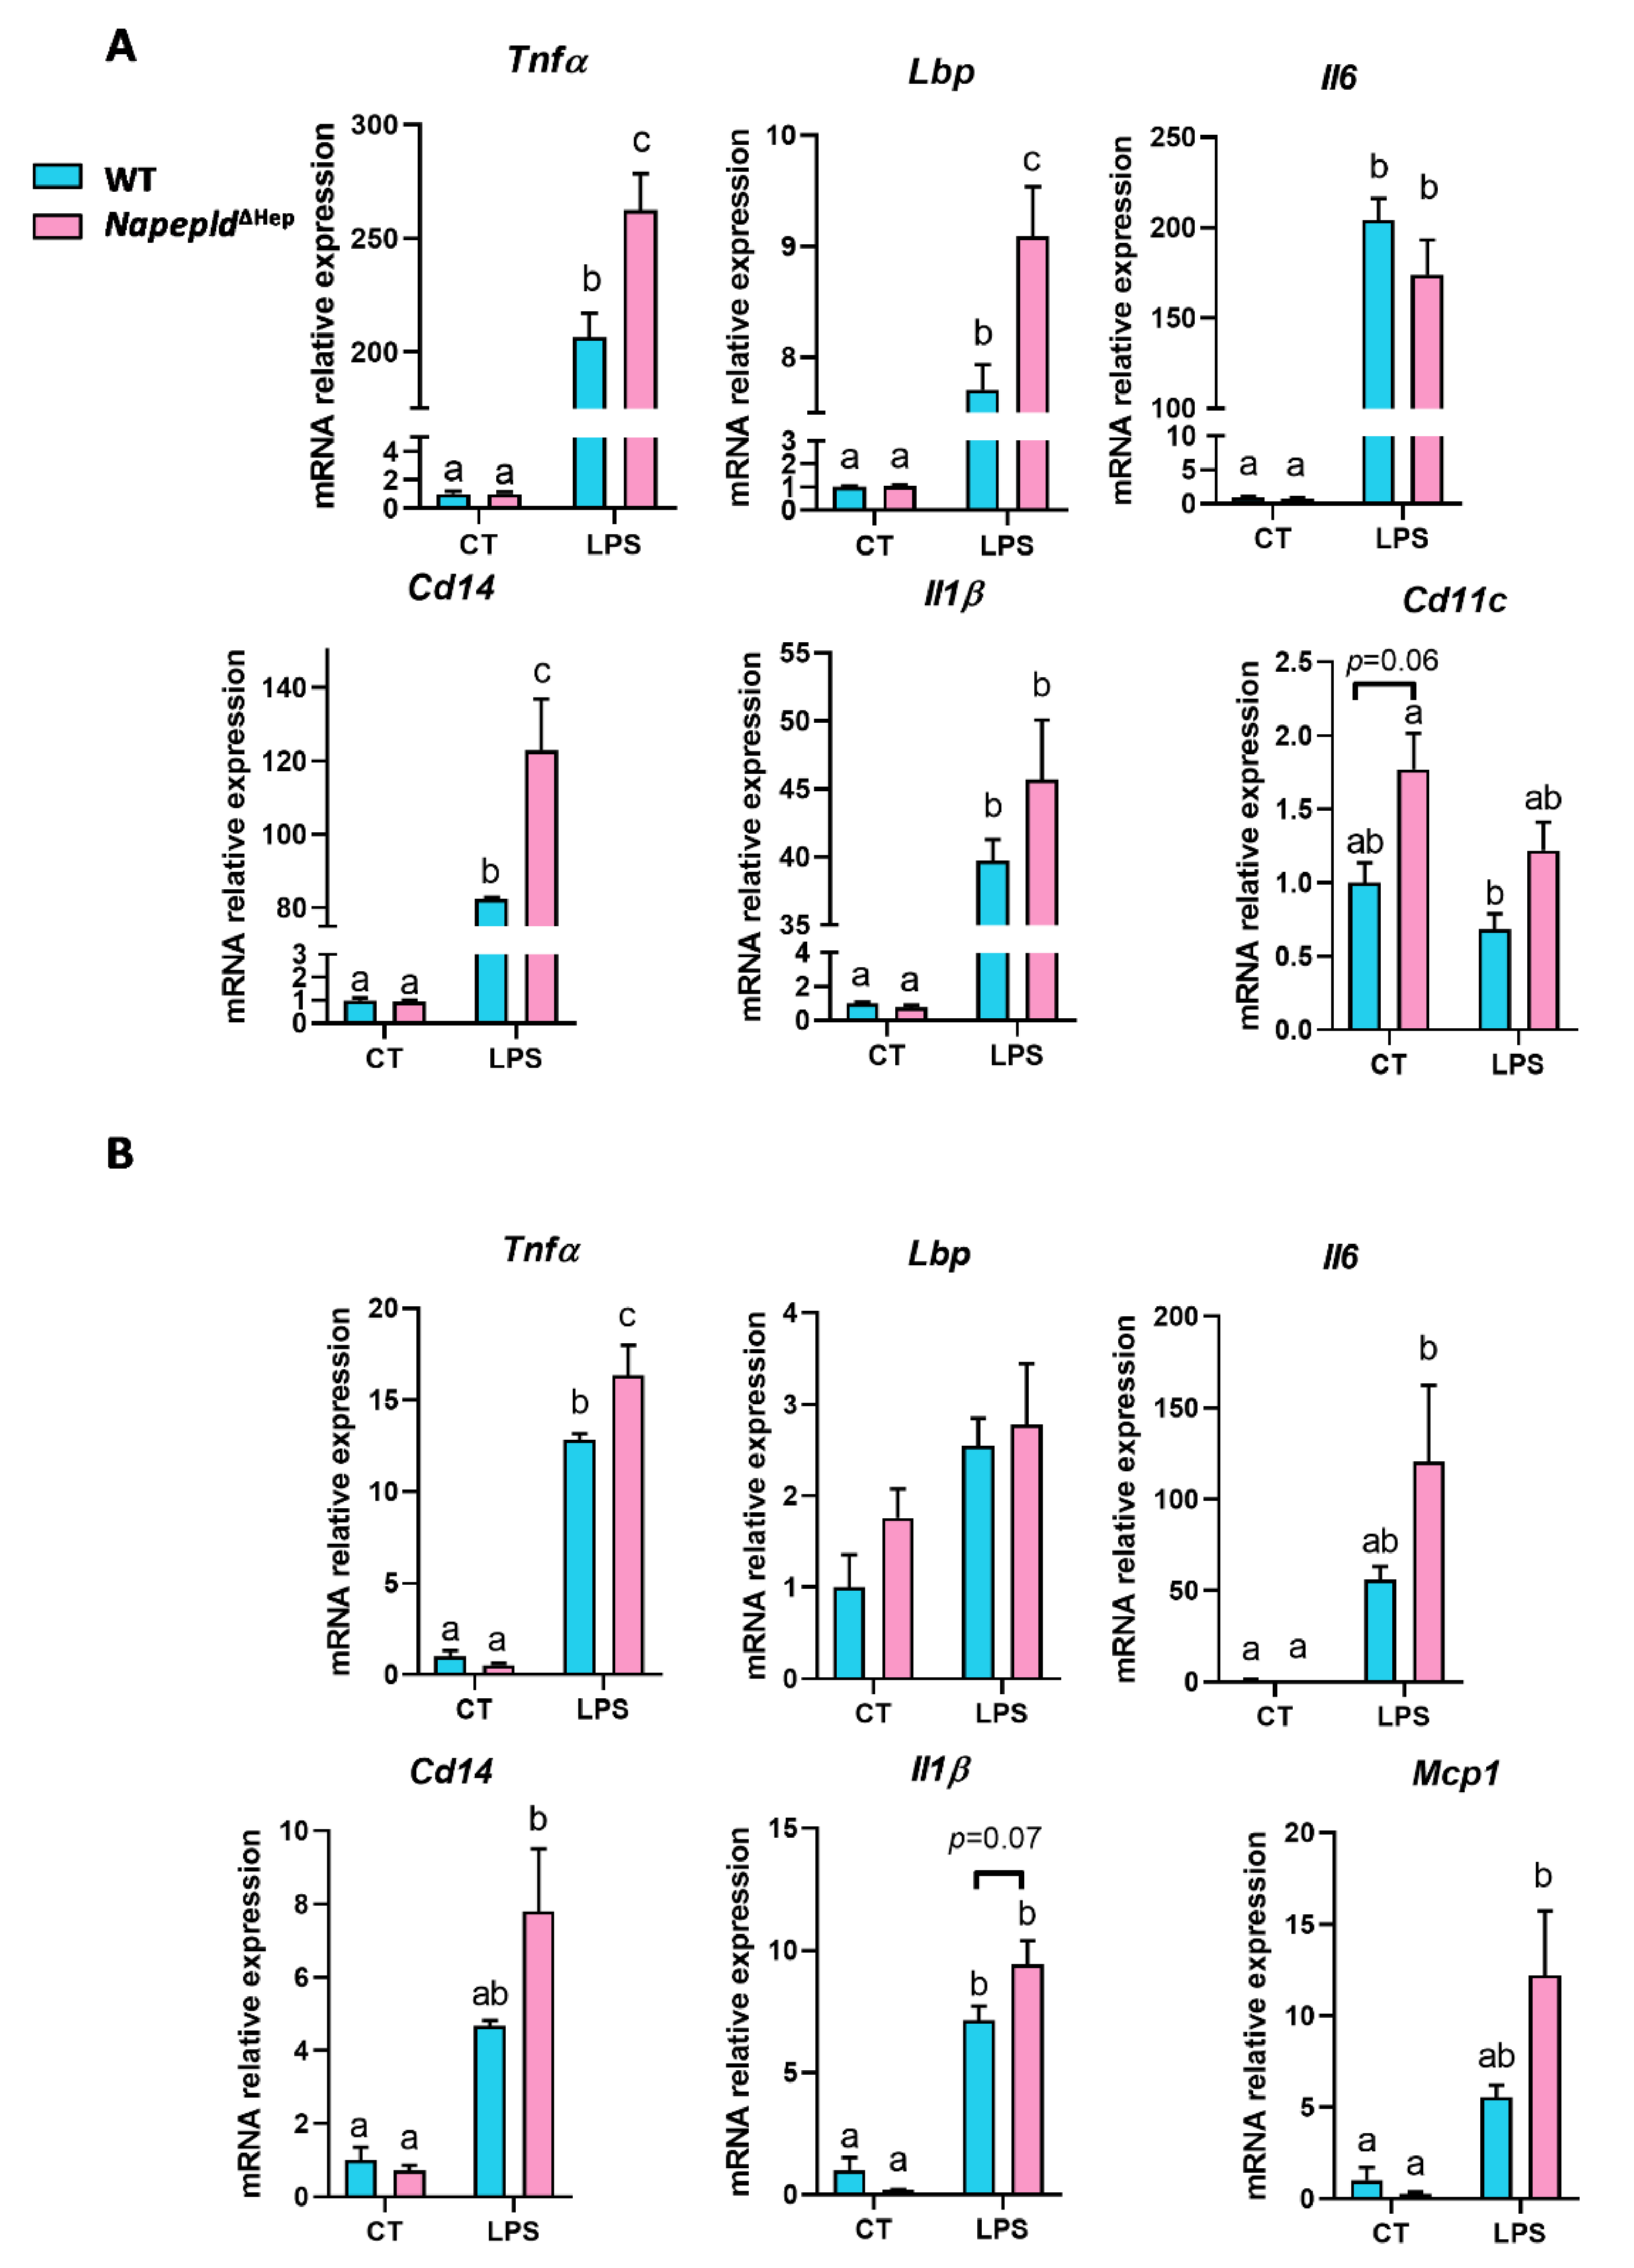
3.6. Napepld∆Hep Mice are More Sensitive to Inflammation
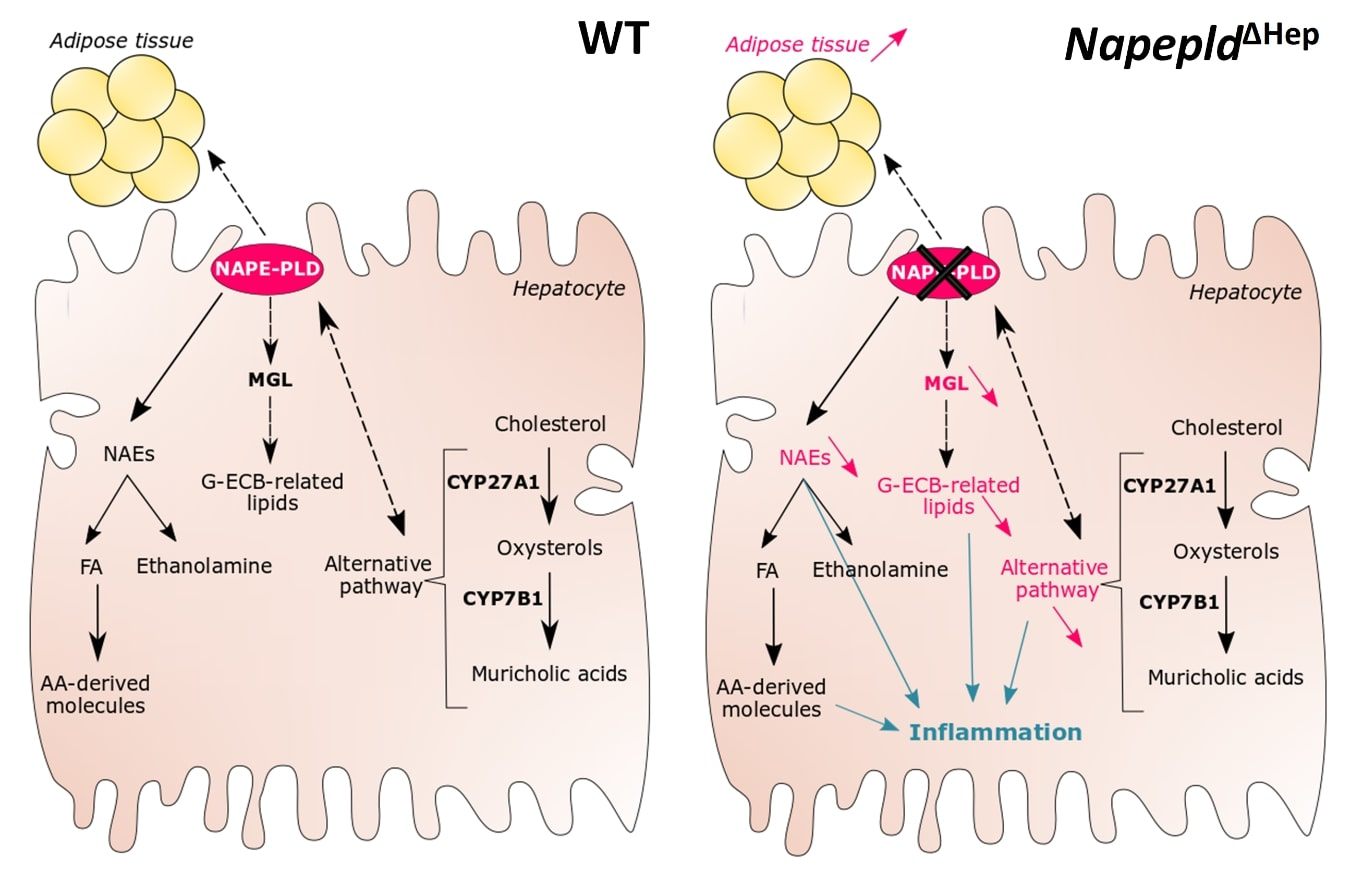
To better evaluate the involvement of hepatocyte Napepld in the inflammatory response, we injected WT and Napepld∆Hep mice with lipopolysaccharides (LPS), a known potent proinflammatory compound. LPS challenge induced an acute inflammation in the liver of both WT and Napepld∆Hep mice (Figure 6A), but the inflammatory tone was worsened in the liver of Napepld∆Hep mice as reflected by the increased mRNA expression of inflammatory markers. Even though, proinflammatory cytokines interleukin-1β (Il1β) and interleukin-6 (Il6) did not reach the significance, tumor necrosis factor alpha (Tnfα) was significantly upregulated in Napepld∆Hep livers. In line with this, gene expression of proteins contributing to the inflammatory response triggered by LPS such as LPS-binding protein (Lbp) and Cd14 were both significantly increased in Napepld∆Hep mice. Interestingly, the expression of Cd11c, a marker of activated macrophages, tended to be more elevated in Napepld∆Hep mice already in basal conditions (p = 0.06) compared to WT mice. This might explain the predisposition of these mice to develop a higher inflammatory tone when challenged by a chronic or acute inflammation.
Additionally, we examined the inflammation in the subcutaneous adipose tissue to investigate whether hepatocyte Napepld also affects inflammatory response in another peripheral organ involved in obesity. The magnitude of the increase in the LPS-induced inflammation markers was lower in the adipose tissue as compared to the liver. Although only Tnfα expression was significantly higher in Napepld∆Hep mice, a consistent trend was observed for the other inflammatory markers when compared to WT mice (Figure 6B).
These data suggest that the marked reduction in the different bioactive lipids that regulate inflammation, caused by the deletion of Napepld in the liver, affects primarily the immune response in the liver itself and to a lesser extent that in the periphery.

4. Discussion

The bioactive lipids belonging to the eCBome are involved in numerous metabolic functions, including lipid and glucose metabolism, energy homeostasis and regulation of inflammatory tone [2,40]. In this study, we discovered that hepatocyte NAPE-PLD plays a major role in most of these physiological processes.
Regarding the direct targets of NAPE-PLD, the NAEs [35,41,42], we found a significant decrease in OEA and LEA concentrations in the liver of Napepld∆Hep mice, whereas AEA and PEA levels remained unchanged. The lack of reduction of PEA and AEA levels could not be explained by a downregulation of the enzyme in charge of their degradation since the expression of both fatty acid amide hydrolase (Faah) and N-acylethanolamine acid amide hydrolase (Naaa) was unaltered in Napepld∆Hep mice [43,44]. However, alternative biosynthetic pathways have already been demonstrated for some NAEs and especially for AEA [15,16,21,33,34,35]. Even tough NAPE-PLD is the main enzyme producing NAEs, we cannot rule out that the serine hydrolase α/β -hydrolase 4 (ABHD4) and the glycerophosphodiesterase 1 (GDE1) may also partially contribute to their synthesis [35]. Finally, among the different roles of PEA, it is well-documented that this NAE displays anti-inflammatory properties and is produced by immune cells [45,46,47,48,49,50]. As we observed that NPC also expressed Napepld, we could not exclude that the absence of a decreased concentration of this mediator, or even AEA, in the tissue was due to compensatory mechanisms from cells unaffected by the deletion construct, possibly immune cells (i.e., Kupffer cells).
More surprisingly, NAPE-PLD deletion led to a robust and consistent reduction of almost all other eCBome mediators investigated here, suggesting that hepatocyte NAPE-PLD controls bioactive liver lipid metabolism that goes beyond NAEs production, which is the only reported function of NAPE-PLD so far [42]. Our data showed that the absence of NAPE-PLD in hepatocytes did not alter the expression of other key enzymes of the eCBome except one, the monoacylglycerol lipase (Mgll), which was downregulated. Since this enzyme is an endocannabinoid-glycerol lipase, as well as Abhd6 that tended to be decreased (p = 0.08), one would have expected an accumulation of monoacylglycerols into Napepld∆Hep livers. Strikingly, the results indicated the opposite effect. As other endocannabinoid-glycerol lipases have recently been discovered in human leukocytes [51], we cannot rule out that they do not take part into the degradation of monoacylglycerols in the mouse liver. This assumption deserves however further investigations. Interestingly, Mgll, aside from degrading monoacylglycerols is also involved in the hydrolysis of triglycerides to fatty acid and glycerol [35,52]. As Napepld∆Hep mice did not accumulate monoacylglycerols in the liver, we hypothesized that the decreased Mgll mRNA expression may restrict glycerol availability and contribute to the reduction of the concentrations of glycerol-associated lipids. This was also reflected by the increased levels of arachidonic acid (AA) in Napepld∆Hep mice whereas its glycerol-conjugated forms, 1/2-AG, were strongly decreased.
The hypothesis that NAPE-PLD acts as a hub controlling, albeit indirectly, the levels of a large range of liver lipids was further confirmed by the lipidomic analysis of two essential liver bioactive lipid families, namely the bile acids and the oxysterols. Strikingly, although most of the bile acids and the oxysterols were strongly reduced in Napepld∆Hep mice, the level of cholesterol, which is the precursor of these lipids was not affected by the lack of Napepld in hepatocytes. Besides, the expression of cholesterol transporters measured in the liver and in the intestine (Abcg5/8 and Npc1l1) was similar between Napepld∆Hep mice and WT. However, several enzymes involved in bile acids synthesis were significantly, or tended to be, downregulated in Napepld∆Hep mice. Interestingly, these enzymes (Cyp27a1 and Cyp7b1) are involved in the alternative pathway of bile acids (as opposed to the classic pathway) and produce muricholic acids in rodents [53,54]. This is in line with the marked reduction in muricholic acids (i.e., α-MCA, β-MCA, ω-MCA and to a lower extent Tα/β-MCA) observed in Napepld∆Hep mice.
The enterohepatic feedback loop also contributes to the reduction of bile acid synthesis [55,56]. By investigating this pathway we discovered that the main transporters of bile acids regulating their reabsorption in the ileum (Osta/b and Asbt) [57] were not altered, whereas the majority of the liver-specific transporters were reduced in Napepld∆Hep mice (Oatp1b2, Bsep and Ostb). This negative feedback loop also involves a bile acid–FXR–FGF15 axis, in which specific bile acids bind to FXR in the intestine to induce the secretion of FGF15 into the portal circulation. FGF15 then binds to the heterodimeric FGFR4/βKlotho receptor and inhibits CYP7A1 and CYP8B1 expression in hepatocytes thereby limiting de novo synthesis of bile acids [58,59,60]. In Napepld∆Hep mice, Fgf15 was strongly expressed in the enterocyte, confirming the absorption of bile acids in the intestine. Yet, we did not see a significant decrease in Cyp7a1 and Cyp8b1 mRNA expression in the liver of Napepld∆Hep mice, possibly due to a downregulation of the intermediate, Fgfr4. Of interest, the elevated Fgf15 expression might be explained by a significant decrease in a well-characterized FXR antagonist, Tα/βMCA [61]. In comparison, FXR agonists such as TCDCA, TCA and TDCA were not significantly reduced. All the aforementioned results suggest that the enterohepatic loop was not altered in the intestine while it was impacted in the liver. Therefore, we may conclude that the reduced production of bile acids was not likely due to FGF15/FGFR4 signaling pathway but rather to an altered regulation in the liver itself. Since cholesterol levels in WT and Napepld∆Hep mice were similar but the cholesterol-derived metabolites were deeply modified in Napepld∆Hep livers, we hypothesized that hepatic NAPE-PLD modulates the cascade participating to cholesterol oxidation and specifically the alternative pathway of bile acid synthesis rather than the classic pathway given that this latter was only slightly affected. This possibility, and the underlying molecular mechanisms, will need to be explored in future studies.
It is also worth mentioning that secondary bile acids (i.e., LCA and DCA) are potential structural cofactors regulating NAPE-PLD activity [13,14]. Interestingly, in our study, by deleting NAPE-PLD we discovered that Napepld∆Hep mice were characterized by a specific change in bile acid profile. Hence, given that bile acid metabolism is highly affected in Napepld∆Hep mice and that different data have linked bile acids with the regulation of NAPE-PLD activity [13,14], we speculated on the existence of a mutual regulation between bile acids and NAPE-PLD activity. Nonetheless, this assumption deserves further investigations.
One of the remarkable outcomes of this study is that a targeted deletion for Napepld in hepatocytes is sufficient to induce a high-fat diet-like phenotype. Indeed, we showed that Napepld∆Hep mice were more sensitive to accumulate liver lipids as mirrored by the increased liver weight and the larger vacuolar lipid droplets highlighted by oil-red O staining. We indicated that this phenomenon was likely due to a decreased expression of genes involved in the β-oxidation process rather than an increase in circulating fatty acid level. Indeed, since Napepld∆Hep mice also accumulated fat mass in various adipose tissues, had larger adipocytes and exhibited a higher insulin resistance index compared to WT mice, the lipolysis pathway could have been promoted. Nevertheless, the plasma NEFA level was similar in both genotypes suggesting that adipose tissue was still responsive to insulin action. This obesity-prone phenotype in Napepld∆Hep mice existed already in basal conditions under a normal chow diet and was partially accentuated upon HFD exposure. These observations corroborate a central role of NAPE-PLD in lipid metabolism as a higher accumulation of fat mass has also been reported in mice lacking Napepld in either the adipose tissue or the intestinal epithelial cells [21,22]. Interestingly, in this present study, we could hypothesize that this higher body fat content might be linked to the decreased levels of monoacylglycerols in Napepld∆Hep mice since mice globally deleted for Mgll accumulate monoacylglycerols and display a leaner phenotype [62]. However, the exact molecular mechanisms behind this connection remain to be elucidated.
Although glucose metabolism is also regulated by the endocannabinoid system [21,40,63,64], the liver glucose metabolism was not affected by the absence of Napepld in hepatocytes, neither under basal (i.e., control diet) nor under pathological conditions (i.e., diet-induced obesity). This absence of hyperglycemia in Napepld∆Hep mice indicated that these mice were not yet strongly resistant to insulin despite their increased insulin resistance index under control diet. Since the timeline of events regarding hyperinsulinemia and insulin resistance is still under debates, we proposed that the hyperinsulinemia displayed by Napepld∆Hep mice would be the cause of a future insulin resistance [65]. This suggests that Napepld∆Hep mice were at the early stage of a diabetic disorder when exposed to a normal diet for seven weeks. Given that glucose metabolism and bile acids are intertwined, we speculated that the alteration of bile acids might be responsible of hyperinsulinemia. For instance, Jiang and colleagues demonstrated an improvement of glucose metabolism and a reduction of plasma insulin level in mice treated with glycine-β-MCA [66]. Interestingly, MCA were strongly reduced in Napepld∆Hep mice. Nonetheless, the relationship between glucose metabolism and these bioactive lipids are not that clear and further investigations are needed in that field to fully identify the molecular interconnections [67]. Under HFD, Napepld∆Hep mice and WT exhibited a similar level of insulin. This could be explained by the fact that HFD per se induces hyperinsulinemia and hyperglycemia suggesting that this factor is the major driver contributing to this phenotype and might hide the potential effect caused by Napepld deletion. Of note, intestinal Napepld-deleted mice do not develop glucose intolerance either unlike mice deleted for Napepld in the adipose tissue [21,22], reinforcing our hypothesis that NAPE-PLD plays an organ-dependent role in regulating lipid and glucose metabolism. These various roles might be explained with the fact that the enzyme controls the concentrations of different lipid mediators in specific cells: different NAEs in hepatocytes, adipocytes and epithelial intestinal cells as well as monoacylglycerols, bile acids and oxysterols in hepatocytes. These bioactive lipids display different or even opposite effects, mediated by different receptors (i.e., CB1, GPR119, GPR55, FXR and LXR), on lipid and glucose metabolism [56,68,69].
In addition to excessive fat mass, obesity is also linked to a low-grade inflammation [70]. Interestingly, we reported that when exposed to a nutritional stress such as a high-fat diet, Napepld∆Hep mice tended to be more sensitive to liver inflammation compared to WT mice. To further explore this phenomenon, we challenged the mice with an acute exposure to LPS. We found that, following this treatment, Napepld∆Hep mice exhibited a worsened inflammatory response in the liver. One explanation for this predisposition to inflammation may be found in the altered liver lipid profile of the Napepld∆Hep mice. Indeed, AA, a polyunsaturated fatty acid, accumulated in the liver of Napepld∆Hep mice. AA may come from the degradation of endocannabinoids such as AEA or 2-AG and is a precursor of prostaglandins, leukotrienes or lipoxins, which are involved in the inflammatory response [71,72,73,74]. Besides, eCBome mediators as well as oxysterols and bile acids regulate inflammation [69,73,75,76]. The relationship between immunity, inflammation, oxysterols and bile acids has also been described in our lab since we recently demonstrated that deletion of hepatocyte myeloid differentiation primary response gene 88 (MyD88) led to a profound alteration of bile acid and oxysterol profiles, which contributed to the increased inflammation sensitivity displayed by the mutant mice [28,77]. Hence, we may not exclude that the reduced levels of these molecules detected here in Napepld∆Hep mice also participated to the observed sensitivity. Likewise, the decrease, found in these mice, in the hepatic levels of OEA, previously observed also in obese Zucker rats [78], in view of the PPARα agonist action of this NAE [72], may underlie both the excessive hepatic lipid accumulation and inflammation that are typical of both animal models. However, as both pro- and anti-inflammatory lipids were decreased in Napepld∆Hep mouse livers, understanding their role in this context, particularly in view of their different relative potencies, would be rather complicated at this stage, thus calling for further research. Finally, it is important to note that the higher inflammatory tone was not observed in the adipose tissue, suggesting that the involvement of hepatocyte NAPE-PLD is restricted to local regulation of inflammation.
In conclusion, by generating a mouse model harboring a liver specific deletion of NAPE-PLD, we discovered that hepatocyte NAPE-PLD orchestrates the synthesis of a large range of bioactive lipids in the liver. We also found that hepatocyte NAPE-PLD acts as a crucial player on energy homeostasis since Napepld∆Hep mice are prone to develop an obese-like phenotype and are predisposed to inflammation. These findings contribute to the understanding of the physiological and pathological roles of hepatocyte NAPE-PLD, and, when combined with our previous studies, shed light on the broad contribution of this enzyme in the development and the progression of metabolic disorders.

Supplementary Materials

The following are available online at https://www.mdpi.com/2073-4409/9/5/1247/s1. Figure S1. Napepld deletion is specific to hepatocytes. (A) Localization of Napepld mRNA by in situ hybridization in the liver (scale bar: 100 µm; n = 4–5). (B) eCBome mediator levels in the liver (fmol/mg; n = 8–10). (C) Specific markers of NPC (F4/80, Cd31, Ck19 and Acta2) and hepatocytes (Hnf4a) measured by real-time qPCR (n = 4–5). Blue: WT ND mice. Pink: Napepld∆Hep ND mice. Data are presented as the mean ± s.e.m. * and *** indicate a significant difference versus WT ND (Respectively p < 0.05 and p < 0.001) according to the t-test. Data with different superscript letters are significantly different (p < 0.05) according to a two-way ANOVA followed by a Tukey post hoc test. Lipid abbreviations: 1/2-DPG; 1/2-DPA-glycerol; 1/2-EPG, 1/2-EPA-glycerol; 1-PG, 1-palmitoylglycerol; 2-PG, 2-palmitoylglycerol; DPA-ω3, DPA-omega3. Figure S2. Napepld∆Hep mice develop a high-fat diet-like phenotype upon normal diet. (A) Plasma insulin levels (pM) at 30 min before and 15 min after oral glucose loading. (B) Mean area under the curve (AUC) of insulin measured between 30 min before and 15 min after oral glucose loading. Blue: WT ND mice. Pink: Napepld∆Hep ND mice (n = 8–10). Data are presented as the mean ± s.e.m. * indicate a significant difference versus WT ND (p < 0.05) according to t-test. Figure S3. Napepld∆Hep mice are more sensitive to liver lipid accumulation. (A) Liver triglycerides (nmol/mg). (B) Plasma triglycerides (mM). (C) Plasma cholesterol (mM). (D) Plasma NEFA (mM). Blue: WT ND mice. Pink: Napepld∆Hep ND mice (n = 8–10). Data are presented as the mean ± s.e.m. Figure S4. Deletion of Napepld partially accentuates the obese phenotype induced by a high-fat diet. (A) Plasma glucose profile (mg/dl) measured between 30 min before and 120 min after glucose loading. (B) Mean area under the curve of glycemia measured between 30 min before and 120 min after glucose loading. (C) Plasma insulin levels (pM) at 30 min before and 15 min after glucose loading. (D) Mean area under the curve (AUC) of insulin measured between 30 min before and 15 min after glucose loading. (E) Insulin resistance index determined by multiplying the AUC of blood glucose by the AUC of insulin. (F) Plasma triglyceride concentration (mM). Dark blue: WT HFD mice. Dark pink: Napepld∆Hep HFD mice (n = 11). Data are presented as the mean ± s.e.m.

Author Contributions

Conceptualization: C.L. and P.D.C. Supervision: P.D.C. Methodology: C.L., P.D.C., S.L. Funding acquisition: P.D.C., G.G.M., V.D.M., C.S., N.F. Investigation: C.L., M.V.H., Martin Roumain, R.M., I.L., G.G.M., Marialetizia Rastelli, N.F., Resources: P.D.C., N.M.D., S.L., G.G.M., C.S., N.F., V.D.M., I.L. Writing - Original Draft: P.D.C. and C.L. Writing - Review & Editing: all the authors. All authors have read and agreed to the published version of the manuscript.

Funding

This work was supported by the Fonds de la Recherche Scientifique (FNRS FRFS-WELBIO) under the grants WELBIO-CR-2017C-02 and WELBIO-CR-2019C-02R, the Funds Baillet-Latour under the grant “Grant For Medical Research 2015”. C.S. and N.F. are associated to the Canada Excellence Research Chair on the microbiome-endocannabinoidome axis in metabolic health, held by VD and funded by the Canadian Federal Tri-Agency.

Acknowledgments

We thank A. Barrois, H. Danthinne and A. Puel for excellent technical assistance. We thank P. Chambon for the kind gift of the Albumin Cre-ERT2 mice. P.D. Cani is a senior research associate at FRS-FNRS (Fonds de la Recherche Scientifique), Belgium. V.D. is the holder of a Canada Excellence Research Chair at Université Laval. The authors wish to thank M. Cyril Martin for his valuable technical assistance with the LC/MS-MS analyses.

Conflicts of Interest

The authors have not conflict of interest to declare with the present study.

References

  1. Maccarrone, M.; Bab, I.; Biro, T.; Cabral, G.A.; Dey, S.K.; Di Marzo, V.; Konje, J.C.; Kunos, G.; Mechoulam, R.; Pacher, P.; et al. Endocannabinoid signaling at the periphery: 50 years after thc. Trends Pharmacol. Sci. 2015, 36, 277–296. [Google Scholar] [CrossRef] [PubMed] [Green Version]
  2. Cani, P.D.; Plovier, H.; Van Hul, M.; Geurts, L.; Delzenne, N.M.; Druart, C.; Everard, A. Endocannabinoids--at the crossroads between the gut microbiota and host metabolism. Nat. Rev. Endocrinol. 2016, 12, 133–143. [Google Scholar] [CrossRef]
  3. Gatta-Cherifi, B.; Cota, D. New insights on the role of the endocannabinoid system in the regulation of energy balance. Int. J. Obes. 2016, 40, 210–219. [Google Scholar] [CrossRef] [PubMed]
  4. Cani, P.D.; Van Hul, M.; Lefort, C.; Depommier, C.; Rastelli, M.; Everard, A. Microbial regulation of organismal energy homeostasis. Nat. Metab. 2019, 1, 34–46. [Google Scholar] [CrossRef]
  5. Jamshidi, N.; Taylor, D.A. Anandamide administration into the ventromedial hypothalamus stimulates appetite in rats. Br. J. Pharmacol. 2001, 134, 1151–1154. [Google Scholar] [CrossRef] [PubMed] [Green Version]
  6. Hansen, H.S.; Diep, T.A. N-acylethanolamines, anandamide and food intake. Biochem. Pharmacol. 2009, 78, 553–560. [Google Scholar] [CrossRef] [Green Version]
  7. Piomelli, D. A fatty gut feeling. Trends Endocrinol. Metab. 2013, 24, 332–341. [Google Scholar] [CrossRef] [Green Version]
  8. Lo Verme, J.; Fu, J.; Astarita, G.; La Rana, G.; Russo, R.; Calignano, A.; Piomelli, D. The nuclear receptor peroxisome proliferator-activated receptor-alpha mediates the anti-inflammatory actions of palmitoylethanolamide. Mol. Pharmacol. 2005, 67, 15–19. [Google Scholar] [CrossRef]
  9. Esposito, G.; Capoccia, E.; Turco, F.; Palumbo, I.; Lu, J.; Steardo, A.; Cuomo, R.; Sarnelli, G.; Steardo, L. Palmitoylethanolamide improves colon inflammation through an enteric glia/toll like receptor 4-dependent ppar-alpha activation. Gut 2014, 63, 1300–1312. [Google Scholar] [CrossRef]
  10. Osei-Hyiaman, D.; DePetrillo, M.; Pacher, P.; Liu, J.; Radaeva, S.; Bátkai, S.; Harvey-White, J.; Mackie, K.; Offertáler, L.; Wang, L.; et al. Endocannabinoid activation at hepatic cb1 receptors stimulates fatty acid synthesis and contributes to diet-induced obesity. J. Clin. Investig. 2005, 115, 1298–1305. [Google Scholar] [CrossRef] [Green Version]
  11. Purohit, V.; Rapaka, R.; Shurtleff, D. Role of cannabinoids in the development of fatty liver (steatosis). AAPS J. 2010, 12, 233–237. [Google Scholar] [CrossRef] [PubMed] [Green Version]
  12. Okamoto, Y.; Morishita, J.; Tsuboi, K.; Tonai, T.; Ueda, N. Molecular characterization of a phospholipase d generating anandamide and its congeners. J. Biol. Chem. 2004, 279, 5298–5305. [Google Scholar] [CrossRef] [PubMed] [Green Version]
  13. Margheritis, E.; Castellani, B.; Magotti, P.; Peruzzi, S.; Romeo, E.; Natali, F.; Mostarda, S.; Gioiello, A.; Piomelli, D.; Garau, G. Bile acid recognition by nape-pld. ACS Chem. Biol. 2016, 11, 2908–2914. [Google Scholar] [CrossRef] [PubMed] [Green Version]
  14. Magotti, P.; Bauer, I.; Igarashi, M.; Babagoli, M.; Marotta, R.; Piomelli, D.; Garau, G. Structure of human n-acylphosphatidylethanolamine-hydrolyzing phospholipase d: Regulation of fatty acid ethanolamide biosynthesis by bile acids. Structure 2015, 23, 598–604. [Google Scholar] [CrossRef] [PubMed] [Green Version]
  15. Leung, D.; Saghatelian, A.; Simon, G.M.; Cravatt, B.F. Inactivation of n-acyl phosphatidylethanolamine phospholipase d reveals multiple mechanisms for the biosynthesis of endocannabinoids. Biochemistry 2006, 45, 4720–4726. [Google Scholar] [CrossRef] [PubMed] [Green Version]
  16. Simon, G.M.; Cravatt, B.F. Characterization of mice lacking candidate n-acyl ethanolamine biosynthetic enzymes provides evidence for multiple pathways that contribute to endocannabinoid production in vivo. Mol. Biosyst. 2010, 6, 1411–1418. [Google Scholar] [CrossRef] [Green Version]
  17. Powell, D.R.; Gay, J.P.; Wilganowski, N.; Doree, D.; Savelieva, K.V.; Lanthorn, T.H.; Read, R.; Vogel, P.; Hansen, G.M.; Brommage, R.; et al. Diacylglycerol lipase alpha knockout mice demonstrate metabolic and behavioral phenotypes similar to those of cannabinoid receptor 1 knockout mice. Front. Endocrinol. 2015, 6, 86. [Google Scholar] [CrossRef] [Green Version]
  18. Inoue, M.; Tsuboi, K.; Okamoto, Y.; Hidaka, M.; Uyama, T.; Tsutsumi, T.; Tanaka, T.; Ueda, N.; Tokumura, A. Peripheral tissue levels and molecular species compositions of n-acyl-phosphatidylethanolamine and its metabolites in mice lacking n-acyl-phosphatidylethanolamine-specific phospholipase d. J. Biochem. 2017, 162, 449–458. [Google Scholar] [CrossRef]
  19. Leishman, E.; Mackie, K.; Luquet, S.; Bradshaw, H.B. Lipidomics profile of a nape-pld ko mouse provides evidence of a broader role of this enzyme in lipid metabolism in the brain. Biochim. Biophys. Acta 2016, 1861, 491–500. [Google Scholar] [CrossRef] [Green Version]
  20. Gunschmann, C.; Chiticariu, E.; Garg, B.; Hiz, M.M.; Mostmans, Y.; Wehner, M.; Scharfenberger, L. Transgenic mouse technology in skin biology: Inducible gene knockout in mice. J. Investig. Dermatol. 2014, 134, e22. [Google Scholar] [CrossRef] [Green Version]
  21. Geurts, L.; Everard, A.; Van Hul, M.; Essaghir, A.; Duparc, T.; Matamoros, S.; Plovier, H.; Castel, J.; Denis, R.G.; Bergiers, M.; et al. Adipose tissue nape-pld controls fat mass development by altering the browning process and gut microbiota. Nat. Commun. 2015, 6, 6495. [Google Scholar] [CrossRef] [PubMed] [Green Version]
  22. Everard, A.; Plovier, H.; Rastelli, M.; Van Hul, M.; de Wouters d’Oplinter, A.; Geurts, L.; Druart, C.; Robine, S.; Delzenne, N.M.; Muccioli, G.G.; et al. Intestinal epithelial n-acylphosphatidylethanolamine phospholipase d links dietary fat to metabolic adaptations in obesity and steatosis. Nat. Commun. 2019, 10, 457. [Google Scholar] [CrossRef] [PubMed]
  23. Wangensteen, T.; Akselsen, H.; Holmen, J.; Undlien, D.; Retterstol, L. A common haplotype in napepld is associated with severe obesity in a norwegian population-based cohort (the hunt study). Obesity 2011, 19, 612–617. [Google Scholar] [CrossRef] [PubMed]
  24. Collaboration N.C.D.R.F. Worldwide trends in body-mass index, underweight, overweight, and obesity from 1975 to 2016: A pooled analysis of 2416 population-based measurement studies in 128.9 million children, adolescents, and adults. Lancet 2017, 390, 2627–2642. [Google Scholar]
  25. Loomba, R.; Sanyal, A.J. The global nafld epidemic. Nat. Rev. Gastroenterol. Hepatol. 2013, 10, 686–690. [Google Scholar] [CrossRef]
  26. Rinella, M.E.; Sanyal, A.J. Nafld in 2014: Genetics, diagnostics and therapeutic advances in nafld. Nat. Rev. Gastroenterol. Hepatol. 2015, 12, 65–66. [Google Scholar] [CrossRef] [Green Version]
  27. Schuler, M.; Dierich, A.; Chambon, P.; Metzger, D. Efficient temporally controlled targeted somatic mutagenesis in hepatocytes of the mouse. Genesis 2004, 39, 167–172. [Google Scholar] [CrossRef]
  28. Lefort, C.; Van Hul, M.; Delzenne, N.M.; Everard, A.; Cani, P.D. Hepatic myd88 regulates liver inflammation by altering synthesis of oxysterols. Am. J. Physiol. Endocrinol. Metab. 2019, 317, E99–E108. [Google Scholar] [CrossRef]
  29. Folch, J.; Lees, M.; Sloane Stanley, G.H. A simple method for the isolation and purification of total lipides from animal tissues. J. Biol. Chem. 1957, 226, 497–509. [Google Scholar]
  30. Manca, C.; Boubertakh, B.; Leblanc, N.; Deschenes, T.; Lacroix, S.; Martin, C.; Houde, A.; Veilleux, A.; Flamand, N.; Muccioli, G.G.; et al. Germ-free mice exhibit profound gut microbiota-dependent alterations of intestinal endocannabinoidome signaling. J. Lipid Res. 2020, 61, 70–85. [Google Scholar] [CrossRef]
  31. Mutemberezi, V.; Masquelier, J.; Guillemot-Legris, O.; Muccioli, G.G. Development and validation of an hplc-ms method for the simultaneous quantification of key oxysterols, endocannabinoids, and ceramides: Variations in metabolic syndrome. Anal. Bioanal. Chem. 2016, 408, 733–745. [Google Scholar] [CrossRef] [PubMed]
  32. Guillemot-Legris, O.; Mutemberezi, V.; Cani, P.D.; Muccioli, G.G. Obesity is associated with changes in oxysterol metabolism and levels in mice liver, hypothalamus, adipose tissue and plasma. Sci. Rep. 2016, 6, 19694. [Google Scholar] [CrossRef] [PubMed] [Green Version]
  33. Liu, J.; Wang, L.; Harvey-White, J.; Huang, B.X.; Kim, H.Y.; Luquet, S.; Palmiter, R.D.; Krystal, G.; Rai, R.; Mahadevan, A.; et al. Multiple pathways involved in the biosynthesis of anandamide. Neuropharmacology 2008, 54, 1–7. [Google Scholar] [CrossRef] [PubMed] [Green Version]
  34. Tsuboi, K.; Okamoto, Y.; Ikematsu, N.; Inoue, M.; Shimizu, Y.; Uyama, T.; Wang, J.; Deutsch, D.G.; Burns, M.P.; Ulloa, N.M.; et al. Enzymatic formation of n-acylethanolamines from n-acylethanolamine plasmalogen through n-acylphosphatidylethanolamine-hydrolyzing phospholipase d-dependent and -independent pathways. Biochim. Biophys. Acta 2011, 1811, 565–577. [Google Scholar] [CrossRef] [PubMed]
  35. Muccioli, G.G. Endocannabinoid biosynthesis and inactivation, from simple to complex. Drug Discov. Today 2010, 15, 474–483. [Google Scholar] [CrossRef]
  36. Movita, D.; Kreefft, K.; Biesta, P.; van Oudenaren, A.; Leenen, P.J.; Janssen, H.L.; Boonstra, A. Kupffer cells express a unique combination of phenotypic and functional characteristics compared with splenic and peritoneal macrophages. J. Leukoc. Biol. 2012, 92, 723–733. [Google Scholar] [CrossRef]
  37. Elvevold, K.; Smedsrod, B.; Martinez, I. The liver sinusoidal endothelial cell: A cell type of controversial and confusing identity. Am. J. Physiol. Gastrointest. Liver Physiol. 2008, 294, G391–G400. [Google Scholar] [CrossRef] [Green Version]
  38. Carpino, G.; Morini, S.; Ginanni Corradini, S.; Franchitto, A.; Merli, M.; Siciliano, M.; Gentili, F.; Onetti Muda, A.; Berloco, P.; Rossi, M.; et al. Alpha-sma expression in hepatic stellate cells and quantitative analysis of hepatic fibrosis in cirrhosis and in recurrent chronic hepatitis after liver transplantation. Dig. Liver Dis. 2005, 37, 349–356. [Google Scholar] [CrossRef]
  39. Manco, R.; Clerbaux, L.A.; Verhulst, S.; Bou Nader, M.; Sempoux, C.; Ambroise, J.; Bearzatto, B.; Gala, J.L.; Horsmans, Y.; van Grunsven, L.; et al. Reactive cholangiocytes differentiate into proliferative hepatocytes with efficient DNA repair in mice with chronic liver injury. J. Hepatol. 2019, 70, 1180–1191. [Google Scholar] [CrossRef]
  40. Cani, P.D.; Geurts, L.; Matamoros, S.; Plovier, H.; Duparc, T. Glucose metabolism: Focus on gut microbiota, the endocannabinoid system and beyond. Diabetes Metab. 2014, 40, 246–257. [Google Scholar] [CrossRef]
  41. Sugiura, T.; Kondo, S.; Sukagawa, A.; Tonegawa, T.; Nakane, S.; Yamashita, A.; Ishima, Y.; Waku, K. Transacylase-mediated and phosphodiesterase-mediated synthesis of n-arachidonoylethanolamine, an endogenous cannabinoid-receptor ligand, in rat brain microsomes. Comparison with synthesis from free arachidonic acid and ethanolamine. Eur. J. Biochem. 1996, 240, 53–62. [Google Scholar] [CrossRef] [PubMed]
  42. Maccarrone, M. Missing pieces to the endocannabinoid puzzle. Trends Mol. Med. 2020, 26, 263–272. [Google Scholar] [CrossRef] [PubMed]
  43. Cravatt, B.F.; Giang, D.K.; Mayfield, S.P.; Boger, D.L.; Lerner, R.A.; Gilula, N.B. Molecular characterization of an enzyme that degrades neuromodulatory fatty-acid amides. Nature 1996, 384, 83–87. [Google Scholar] [CrossRef]
  44. Ueda, N.; Yamanaka, K.; Yamamoto, S. Purification and characterization of an acid amidase selective for n-palmitoylethanolamine, a putative endogenous anti-inflammatory substance. J. Biol. Chem. 2001, 276, 35552–35557. [Google Scholar] [CrossRef] [PubMed] [Green Version]
  45. Bisogno, T.; Maurelli, S.; Melck, D.; De Petrocellis, L.; Di Marzo, V. Biosynthesis, uptake, and degradation of anandamide and palmitoylethanolamide in leukocytes. J. Biol. Chem. 1997, 272, 3315–3323. [Google Scholar] [CrossRef] [Green Version]
  46. Muccioli, G.G.; Stella, N. Microglia produce and hydrolyze palmitoylethanolamide. Neuropharmacology 2008, 54, 16–22. [Google Scholar] [CrossRef] [PubMed] [Green Version]
  47. Alhouayek, M.; Muccioli, G.G. Harnessing the anti-inflammatory potential of palmitoylethanolamide. Drug Discov. Today 2014, 19, 1632–1639. [Google Scholar] [CrossRef]
  48. Zhu, C.; Solorzano, C.; Sahar, S.; Realini, N.; Fung, E.; Sassone-Corsi, P.; Piomelli, D. Proinflammatory stimuli control n-acylphosphatidylethanolamine-specific phospholipase d expression in macrophages. Mol. Pharmacol. 2011, 79, 786–792. [Google Scholar] [CrossRef] [Green Version]
  49. Ohara, M.; Ohnishi, S.; Hosono, H.; Yamamoto, K.; Fu, Q.; Maehara, O.; Suda, G.; Sakamoto, N. Palmitoylethanolamide ameliorates carbon tetrachloride-induced liver fibrosis in rats. Front. Pharmacol. 2018, 9, 709. [Google Scholar] [CrossRef] [Green Version]
  50. Petrosino, S.; Di Marzo, V. The pharmacology of palmitoylethanolamide and first data on the therapeutic efficacy of some of its new formulations. Br. J. Pharmacol. 2017, 174, 1349–1365. [Google Scholar] [CrossRef]
  51. Turcotte, C.; Dumais, E.; Archambault, A.S.; Martin, C.; Blanchet, M.R.; Bissonnette, E.; Boulet, L.P.; Laviolette, M.; Di Marzo, V.; Flamand, N. Human leukocytes differentially express endocannabinoid-glycerol lipases and hydrolyze 2-arachidonoyl-glycerol and its metabolites from the 15-lipoxygenase and cyclooxygenase pathways. J. Leukoc. Biol. 2019, 106, 1337–1347. [Google Scholar] [CrossRef] [PubMed]
  52. Zechner, R.; Zimmermann, R.; Eichmann, T.O.; Kohlwein, S.D.; Haemmerle, G.; Lass, A.; Madeo, F. Fat signals—Lipases and lipolysis in lipid metabolism and signaling. Cell Metab. 2012, 15, 279–291. [Google Scholar] [CrossRef] [PubMed] [Green Version]
  53. Russell, D.W. The enzymes, regulation, and genetics of bile acid synthesis. Annu. Rev. Biochem. 2003, 72, 137–174. [Google Scholar] [CrossRef] [PubMed] [Green Version]
  54. Li, T.; Chiang, J.Y. Bile acid signaling in metabolic disease and drug therapy. Pharmacol. Rev. 2014, 66, 948–983. [Google Scholar] [CrossRef] [Green Version]
  55. Inagaki, T.; Choi, M.; Moschetta, A.; Peng, L.; Cummins, C.L.; McDonald, J.G.; Luo, G.; Jones, S.A.; Goodwin, B.; Richardson, J.A.; et al. Fibroblast growth factor 15 functions as an enterohepatic signal to regulate bile acid homeostasis. Cell Metab. 2005, 2, 217–225. [Google Scholar] [CrossRef] [Green Version]
  56. Schaap, F.G.; Trauner, M.; Jansen, P.L. Bile acid receptors as targets for drug development. Nat. Rev. Gastroenterol. Hepatol. 2014, 11, 55–67. [Google Scholar] [CrossRef]
  57. Dawson, P.A.; Karpen, S.J. Intestinal transport and metabolism of bile acids. J. Lipid Res. 2015, 56, 1085–1099. [Google Scholar] [CrossRef] [Green Version]
  58. Lin, B.C.; Wang, M.; Blackmore, C.; Desnoyers, L.R. Liver-specific activities of fgf19 require klotho beta. J. Biol. Chem. 2007, 282, 27277–27284. [Google Scholar] [CrossRef] [Green Version]
  59. Kong, B.; Wang, L.; Chiang, J.Y.; Zhang, Y.; Klaassen, C.D.; Guo, G.L. Mechanism of tissue-specific farnesoid x receptor in suppressing the expression of genes in bile-acid synthesis in mice. Hepatology 2012, 56, 1034–1043. [Google Scholar] [CrossRef] [Green Version]
  60. Somm, E.; Henry, H.; Bruce, S.J.; Aeby, S.; Rosikiewicz, M.; Sykiotis, G.P.; Asrih, M.; Jornayvaz, F.R.; Denechaud, P.D.; Albrecht, U.; et al. Beta-klotho deficiency protects against obesity through a crosstalk between liver, microbiota, and brown adipose tissue. JCI Insight. 2017, 2. [Google Scholar] [CrossRef]
  61. Sayin, S.I.; Wahlstrom, A.; Felin, J.; Jantti, S.; Marschall, H.U.; Bamberg, K.; Angelin, B.; Hyotylainen, T.; Oresic, M.; Backhed, F. Gut microbiota regulates bile acid metabolism by reducing the levels of tauro-beta-muricholic acid, a naturally occurring fxr antagonist. Cell Metab. 2013, 17, 225–235. [Google Scholar] [CrossRef] [Green Version]
  62. Douglass, J.D.; Zhou, Y.X.; Wu, A.; Zadroga, J.A.; Gajda, A.M.; Lackey, A.I.; Lang, W.; Chevalier, K.M.; Sutton, S.W.; Zhang, S.P.; et al. Global deletion of mgl in mice delays lipid absorption and alters energy homeostasis and diet-induced obesity. J. Lipid Res. 2015, 56, 1153–1171. [Google Scholar] [CrossRef] [PubMed] [Green Version]
  63. Geurts, L.; Muccioli, G.G.; Delzenne, N.M.; Cani, P.D. Chronic endocannabinoid system stimulation induces muscle macrophage and lipid accumulation in type 2 diabetic mice independently of metabolic endotoxaemia. PLoS ONE 2013, 8, e55963. [Google Scholar] [CrossRef] [PubMed]
  64. Li, Z.; Schmidt, S.F.; Friedman, J.M. Developmental role for endocannabinoid signaling in regulating glucose metabolism and growth. Diabetes 2013, 62, 2359–2367. [Google Scholar] [CrossRef] [PubMed] [Green Version]
  65. Czech, M.P. Insulin action and resistance in obesity and type 2 diabetes. Nat. Med. 2017, 23, 804–814. [Google Scholar] [CrossRef]
  66. Jiang, C.; Xie, C.; Lv, Y.; Li, J.; Krausz, K.W.; Shi, J.; Brocker, C.N.; Desai, D.; Amin, S.G.; Bisson, W.H.; et al. Intestine-selective farnesoid x receptor inhibition improves obesity-related metabolic dysfunction. Nat. Commun. 2015, 6, 10166. [Google Scholar] [CrossRef] [Green Version]
  67. Ahmad, T.R.; Haeusler, R.A. Bile acids in glucose metabolism and insulin signalling—Mechanisms and research needs. Nat. Rev. Endocrinol. 2019, 15, 701–712. [Google Scholar] [CrossRef]
  68. Silvestri, C.; Di Marzo, V. The endocannabinoid system in energy homeostasis and the etiopathology of metabolic disorders. Cell Metab. 2013, 17, 475–490. [Google Scholar] [CrossRef] [Green Version]
  69. Guillemot-Legris, O.; Mutemberezi, V.; Muccioli, G.G. Oxysterols in metabolic syndrome: From bystander molecules to bioactive lipids. Trends Mol. Med. 2016, 22, 594–614. [Google Scholar] [CrossRef]
  70. Cani, P.D.; Amar, J.; Iglesias, M.A.; Poggi, M.; Knauf, C.; Bastelica, D.; Neyrinck, A.M.; Fava, F.; Tuohy, K.M.; Chabo, C.; et al. Metabolic endotoxemia initiates obesity and insulin resistance. Diabetes 2007, 56, 1761–1772. [Google Scholar] [CrossRef] [Green Version]
  71. Wahli, W.; Michalik, L. Ppars at the crossroads of lipid signaling and inflammation. Trends Endocrinol. Metab. 2012, 23, 351–363. [Google Scholar] [CrossRef] [PubMed]
  72. Piomelli, D.; Sasso, O. Peripheral gating of pain signals by endogenous lipid mediators. Nat. Neurosci. 2014, 17, 164–174. [Google Scholar] [CrossRef] [PubMed] [Green Version]
  73. Dennis, E.A.; Norris, P.C. Eicosanoid storm in infection and inflammation. Nat. Rev. Immunol. 2015, 15, 511–523. [Google Scholar] [CrossRef] [PubMed] [Green Version]
  74. Alhouayek, M.; Muccioli, G.G. Cox-2-derived endocannabinoid metabolites as novel inflammatory mediators. Trends Pharmacol. Sci. 2014, 35, 284–292. [Google Scholar] [CrossRef] [PubMed]
  75. Spann, N.J.; Glass, C.K. Sterols and oxysterols in immune cell function. Nat. Immunol. 2013, 14, 893–900. [Google Scholar] [CrossRef]
  76. Mazuy, C.; Helleboid, A.; Staels, B.; Lefebvre, P. Nuclear bile acid signaling through the farnesoid x receptor. Cell. Mol. Life Sci. 2015, 72, 1631–1650. [Google Scholar] [CrossRef]
  77. Duparc, T.; Plovier, H.; Marrachelli, V.G.; Van Hul, M.; Essaghir, A.; Stahlman, M.; Matamoros, S.; Geurts, L.; Pardo-Tendero, M.M.; Druart, C.; et al. Hepatocyte myd88 affects bile acids, gut microbiota and metabolome contributing to regulate glucose and lipid metabolism. Gut 2017, 66, 620–632. [Google Scholar] [CrossRef] [Green Version]
  78. Izzo, A.A.; Piscitelli, F.; Capasso, R.; Marini, P.; Cristino, L.; Petrosino, S.; Di Marzo, V. Basal and fasting/refeeding-regulated tissue levels of endogenous PPAR-alpha ligands in Zucker rats. Obesity (Silver Spring). 2010, 18, 55–62. [Google Scholar] [CrossRef]
Figure 1. Hepatocyte-specific deletion of Napepld. (A) Napepld mRNA expression measured by real-time qPCR in the liver, gastrocnemius muscle, jejunum, hypothalamus, epididymal adipose tissue (EAT), subcutaneous adipose tissue (SAT), visceral adipose tissue (VAT) and kidney (n = 6). (B–C) Levels of N-acylethanolamines and other eCBome mediators in the liver (fmol/mg; n = 8–10). (D) mRNA expression of key enzymes of the endocannabinoid system (ECB) measured by real-time qPCR in the liver (n = 8–10). (E) Napepld mRNA expression in hepatocytes and hepatic non-parenchymal cells (NPC; n = 4–5). Blue: wild-type (WT) normal diet (ND) mice. Pink: Napepld∆Hep ND mice. Data are presented as the mean ± s.e.m. *, ** and *** indicate a significant difference versus WT ND (Respectively p < 0.05, p < 0.01 and p < 0.001) according to the t-test. Data with different superscript letters are significantly different (p < 0.05) according to two-way ANOVA followed by Tukey post hoc test. Lipid abbreviations: 1/2-AG, 1/2-arachidonoylglycerol; 1/2-DHG, 1/2-DHA-glycerol; 1/2-LG, 1/2-linoleoylglycerol; 2-OG, 2-oleoylglycerol; AA, Arachidonic acid; AEA, N-arachidonoylethanolamine; DHA, Docosahexaenoic acid; DHEA, N-docosahexaenoylethanolamine; EPA, Eicosapentaenoic acid; LEA, N-linoleylethanolamine; OEA, N-oleoylethanolamine; PEA, N-palmitoylethanolamine.
Cells 09 01247 g001
Figure 2. Napepld∆Hep mice develop a high-fat diet-like phenotype upon normal diet. (A) Body weight (g), (B) fat mass (%) and (C) lean mass (%) after a 7 weeks period on normal diet. (D) Weight (g) of different tissues: liver, brown adipose tissue (BAT), epididymal adipose tissue (EAT), subcutaneous adipose tissue (SAT), visceral adipose tissue (VAT) and cecal content. (E) Cumulative food intake per mouse (g) after a 7 weeks period. (F) Plasma glucose profile (mg/dl) measured between 30 min before and 120 min after oral glucose loading (G) Insulin resistance index determined by multiplying the area under the curve (AUC) of blood glucose by the AUC of insulin. Blue: WT ND mice. Pink: Napepld∆Hep ND mice (n = 8–10). Data are presented as the mean ± s.e.m. *and ** indicate a significant difference versus WT ND (Respectively p < 0.05 and p < 0.01) according to the t-test.
Cells 09 01247 g002
Figure 3. Napepld∆Hep mice are more sensitive to liver lipid accumulation. (A) Representative liver oil red O staining (scale bar: 100 µm) and average lipid droplet size (μm²). (B) Liver lipid content measured by gravimetry (mg). (C) mRNA expression of genes involved in β-oxidation measured by real-time qPCR in the liver. (D) Representative hematoxylin and eosin-stained pictures of SAT deposits (scale bar: 100 µm) and mean adipocyte size (μm²). Blue: WT ND mice. Pink: Napepld∆Hep ND mice (n = 8–10). Data are presented as the mean ± s.e.m. *and ** indicate a significant difference versus WT ND (Respectively p < 0.05 and p < 0.01) according to the t-test.
Cells 09 01247 g003
Figure 4. Hepatocyte Napepld deletion modifies liver bioactive lipid metabolism. (A) Liver oxysterol concentration (pmol/g). (B) Key markers of bile acid metabolism measured by real-time qPCR in the liver. (C) Liver bile acid concentration (pmol/g). (D) Liver cholesterol concentration (nmol/mg). (E) Markers of the enterohepatic feedback loop involved in bile acid metabolism measured by real-time qPCR in the liver, jejunum and ileum. Blue: WT ND mice. Pink: Napepld∆Hep ND mice (n = 8–10). Data are presented as the mean ± s.e.m. *, ** and *** indicate a significant difference versus WT ND (Respectively p < 0.05, p < 0.01 and p < 0.001) according to the t-test. Lipid abbreviations: 24(S)-OHC, 24(S)-hydroxycholesterol; 25-OHC, 25-hydroxycholesterol; 27-OHC, 27-hydroxycholesterol; 4β-OHC, 4β-hydroxycholesterol; 5α6α-EC, 5α,6α-epoxycholesterol; 5α6β-diOHC, 5α,6β-dihydroxycholesterol; 5β6β-EC, 5β,6β-epoxycholesterol; 7-KC, 7-ketocholesterol; 7-OHC, 7-hydroxycholesterol; 7α-OHCone, 7α-hydroxycholestenone; CA, Cholic acid; CDCA, Chenodeoxycholic acid; DCA, Deoxycholic acid; (α, β or ω)-MCA, (α, β or ω)-Muricholic acid.
Cells 09 01247 g004
Figure 5. Deletion of Napepld partially accentuates the obese phenotype induced by a high-fat diet. (A) Body weight (g) after an 8 weeks period. (B) Fat mass (%) over an 8 weeks period. (C) Lean mass (%) after an 8 weeks period. (D) Weight (g) of different tissues: liver, brown adipose tissue (BAT), epididymal adipose tissue (EAT), subcutaneous adipose tissue (SAT), visceral adipose tissue (VAT) and cecal content. (E) Cumulative food intake per mouse (g) after an 8 weeks period. (F) Plasma cholesterol concentration (mM). (G) Liver and (H) SAT inflammatory markers measured by real-time qPCR. Dark blue: WT HFD mice. Dark pink: Napepld∆Hep HFD mice (n = 11). Data are presented as the mean ± s.e.m. * and ** indicate a significant difference versus WT HFD (Respectively p < 0.05 and p < 0.01) according to the t-test (except for (B) that is according to a two-way ANOVA followed by a Tukey post hoc test).
Cells 09 01247 g005
Figure 6. Napepld∆Hep mice are more sensitive to inflammation. mRNA expression of inflammatory markers measured by real-time qPCR in WT and Napepld∆Hep mice injected with either saline solution (control (CT)) or LPS (A) in the liver and (B) in the subcutaneous adipose tissue (SAT). Blue: WT ND mice. Pink: Napepld∆Hep ND mice. Data are presented as the mean ± s.e.m. (n = 4–6). Data with different superscript letters are significantly different (p < 0.05) according to a two-way ANOVA followed by a Tukey post hoc test.
Cells 09 01247 g006
Table 1. Primers used for real-time qPCR.
GeneProteinForward Primer Sequence (5’-3’)Reverse Primer Sequence (5’-3’)
Abcb11BSEPAGATACAACCGAAGGGGACATCAACTTCTTCCACAAGCACA
Abcb4MDR2GAGCCCGTGCTGTTCTCTACTCTGTTTCTGTCCCCCACTC
Abcg5ABCG5ACCTTACCCACGGTTCCTTTACGCATAATCACTGCCTGCT
Abcg8ABCG8CCGTCGTCAGATTTCCAATGAGGCTTCCGACCCATGAATG
Abhd6ABHD6CTGTCCATAGTGGGGCAAGTTCAGATGGGTAGTAAGCGGC
Acox1ACOX1CTATGGGATCAGCCAGAAAGGAGTCAAAGGCATCCACCAAAG
Acta2αSMAGGCTGGAGAATTGGATCTCCAGCAAAGGTCAGAGAAGG
Adgre1F4/80TGACAACCAGACGGCTTGTGGCAGGCGAGGAAAAGATAGTGT
BaatBATGCACAGGCTCATCAACAAGATAGAGCACACCACGTTCCTG
Ccl2MCP1GCAGTTAACGCCCCACTCATCCAGCCTACTCATTGGGATCA
Cd14CD14CCTGCCCTCTCCACCTTAGACTCAGTCCTCTCTCGCCCAAT
Cpt1aCPT1αAGACCGTGAGGAACTCAAACCTATTGAAGAGTCGCTCCCACT
Cyp27a1CYP27A1TCTGGCTACCTGCACTTCCTGTGTGTTGGATGTCGTGTCC
Cyp7a1CYP7A1GGGATTGCTGTGGTAGTGAGCGGTATGGAATCAACCCGTTGTC
Cyp7b1CYP7B1TAGGCATGACGATCCTGAAATCTCTGGTGAAGTGGACTGAAA
Cyp8b1CYP8B1GATCCGTCGCGGAGATAAGGCGGGTTGAGGAACCGATCAT
DaglbDAGLβCTCCACCAGCAACAAGACAAGCAGTTCTCCACTTCTGCATC
FaahFAAHGTGAGGATTTGTTCCGCTTGGGAGTGGGCATGGTGTAGTT
Fabp6IBABPCAAGGCTACCGTGAAGATGGACCCACGACCTCCGAAGTCT
Fgf15FGF15GAGGACCAAAACGAACGAAATTACGTCCTTGATGGCAATCG
Fgfr4FGFR4CTCGATCCGCTTTGGGAATTCCAGGTCTGCCAAATCCTTGTC
HmgcrHMGCRTGGTGGGACCAACCTTCTACGCCATCACAGTGCCACATAC
Hnf4aHNF4αAAGAGGTCCATGGTGTTTAAGGATCGAGGATGCGGATGGA
Il1bIL1βTCGCTCAGGGTCACAAGAAACATCAGAGGCAAGGAGGAAAAC
Il6IL6ACAAGTCGGAGGCTTAATTACACATTTGCCATTGCACAACTCTTTTC
ItgaxCD11cACGTCAGTACAAGGAGATGTTGGAATCCTATTGCAGAATGCTTCTTTACC
Krt19CK19AGCGTGATCAGCGGTTTTGCCTGGTTCTGGCGCTCTATG
LbpLBPGTCCTGGGAATCTGTCCTTGCCGGTAACCTTGCTGTTGTT
MgllMGLATGGTCCTGATTTCACCTCTGGTTCAACCTCCGACTTGTTCCGAGACA
NaaaNAAAATTATGACCATTGGAAGCCTGCACGCTCATCACTGTAGTATAAATTGTGTAG
NapepldNAPE-PLDCTCCATCCCGAATGTGCTAAGCCAGCCTCTCTCACTCC
Npc1l1NPC1L1GGCTCCATCTGGAGTAGCTGATCGCACTACCATCCAGGAC
Oatp1b2OATP1B2ATCCCGTGACTAATCCAACAACCAAACTGCTGCTCTATAAACT
Pecam1CD31GGAACGAGAGCCACAGAGACTGCACTGCCTTGACTGTCTT
PparaPPARαCAACGGCGTCGAAGACAAATGACGGTCTCCACGGACAT
Rpl19RPL19GAAGGTCAAAGGGAATGTGTTCACCTTGTCTGCCTTCAGCTTGT
Saa2SAA2GGGGTCTGGGCTTCCTATCTCCATTCTGAAACCCTTGTGG
Saa3SAA3CGCAGCACGAGCAGGATCCAGGATCAAGATGCAAAGAATG
Slc10a1NTCPGGACAAGGTGCCCTACAAAGACAGCCACAGAGAGGGAGAA
Slc10a2ASBTTGGGTTTCTTCCTGGCTAGACTTGTTCTGCATTCCAGTTTCCAA
Slc27a5BALTGTGTGTGAAGGAACCTGGAACCCGGACAACTTTGTGAAG
Slc51aOSTαTACAAGAACACCCTTTGCCCCGAGGAATCCAGAGACCAAA
Slc51bOSTβGTATTTTCGTGCAGAAGATGCGTTTCTGTTTGCCAGGATGCTC
TnfTNFαTCGAGTGACAAGCCTGTAGCCTTGAGATCCATGCCGTTGG
Table 2. Lipids abbreviations.
NAEs and ECB-Related MoleculesBile Acids
1-AG1-arachidonoylglycerolCACholic acid
2-AG2-arachidonoylglycerolCDCAChenodeoxycholic acid
1-LG1-linoleoylglycerolDCADeoxycholic acid
2-LG2-linoleoylglycerol(α, β or ω) MCA(α, β or ω) Muricholic acid
2-OG2-oleoylglycerol
1-PG1-palmitoylglycerol
2-PG2-palmitoylglycerol
AAArachidonic acid
AEAN-arachidonoylethanolamineOxysterols
DHADocosahexaenoic acid24(S)-OHC24(S)-hydroxycholesterol
DHA-1-GDHA-1-glycerol25-OHC25-hydroxycholesterol
DHA-2-GDHA-2-glycerol27-OHC27-hydroxycholesterol
DHEAN-docosahexaenoylethanolamine4β-OHC4β-hydroxycholesterol
DPA-1-GDPA-1-glycerol5α6α-EC5α,6α-epoxycholesterol
DPA-2-GDPA-2-glycerol5α6β-diOHC5α,6β-dihydroxycholesterol
DPA-ω3DPA-omega35β6β-EC5β,6β-epoxycholesterol
EPAEicosapentaenoic acid7α-OHCone7α-hydroxycholestenone
EPA-1-GEPA-1-glycerol7-KC7-ketocholesterol
EPA-2-GEPA-2-glycerol7-OHC7-hydroxycholesterol
EPEAN-eicosapentaenoylethanolamine
LEAN-linoleylethanolamine
OEAN-oleoylethanolamine
PEAN-palmitoylethanolamine

