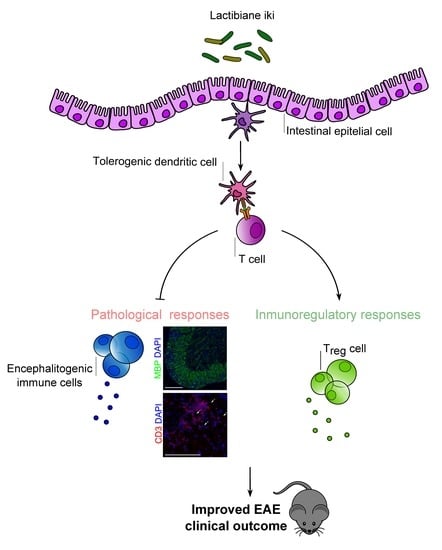
A Commercial Probiotic Induces Tolerogenic and Reduces Pathogenic Responses in Experimental Autoimmune Encephalomyelitis
 ,
,  , , ,
, , ,  ,
, 
Abstract
1. Introduction
2. Materials and Methods
2.1. Mice
2.2. Induction and Assessment of EAE
2.3. Motor Function Assessment
2.4. Bacterial Strains and Treatments
2.5. Ex Vivo Splenocyte Proliferative Capacity
2.6. Cytokine Detection by Luminex
2.7. RNA Isolation, cDNA Synthesis, and qRT-PCR
2.8. Flow Cytometry Analysis
2.9. Histological Analysis
2.10. In Vivo Intestinal Permeability Studies
2.11. Stool Sample Collection, DNA Extraction, Library Preparation, and 16S rDNA Sequencing
2.12. Microbiome Bioinformatics
2.13. Statistical Analysis
3. Results
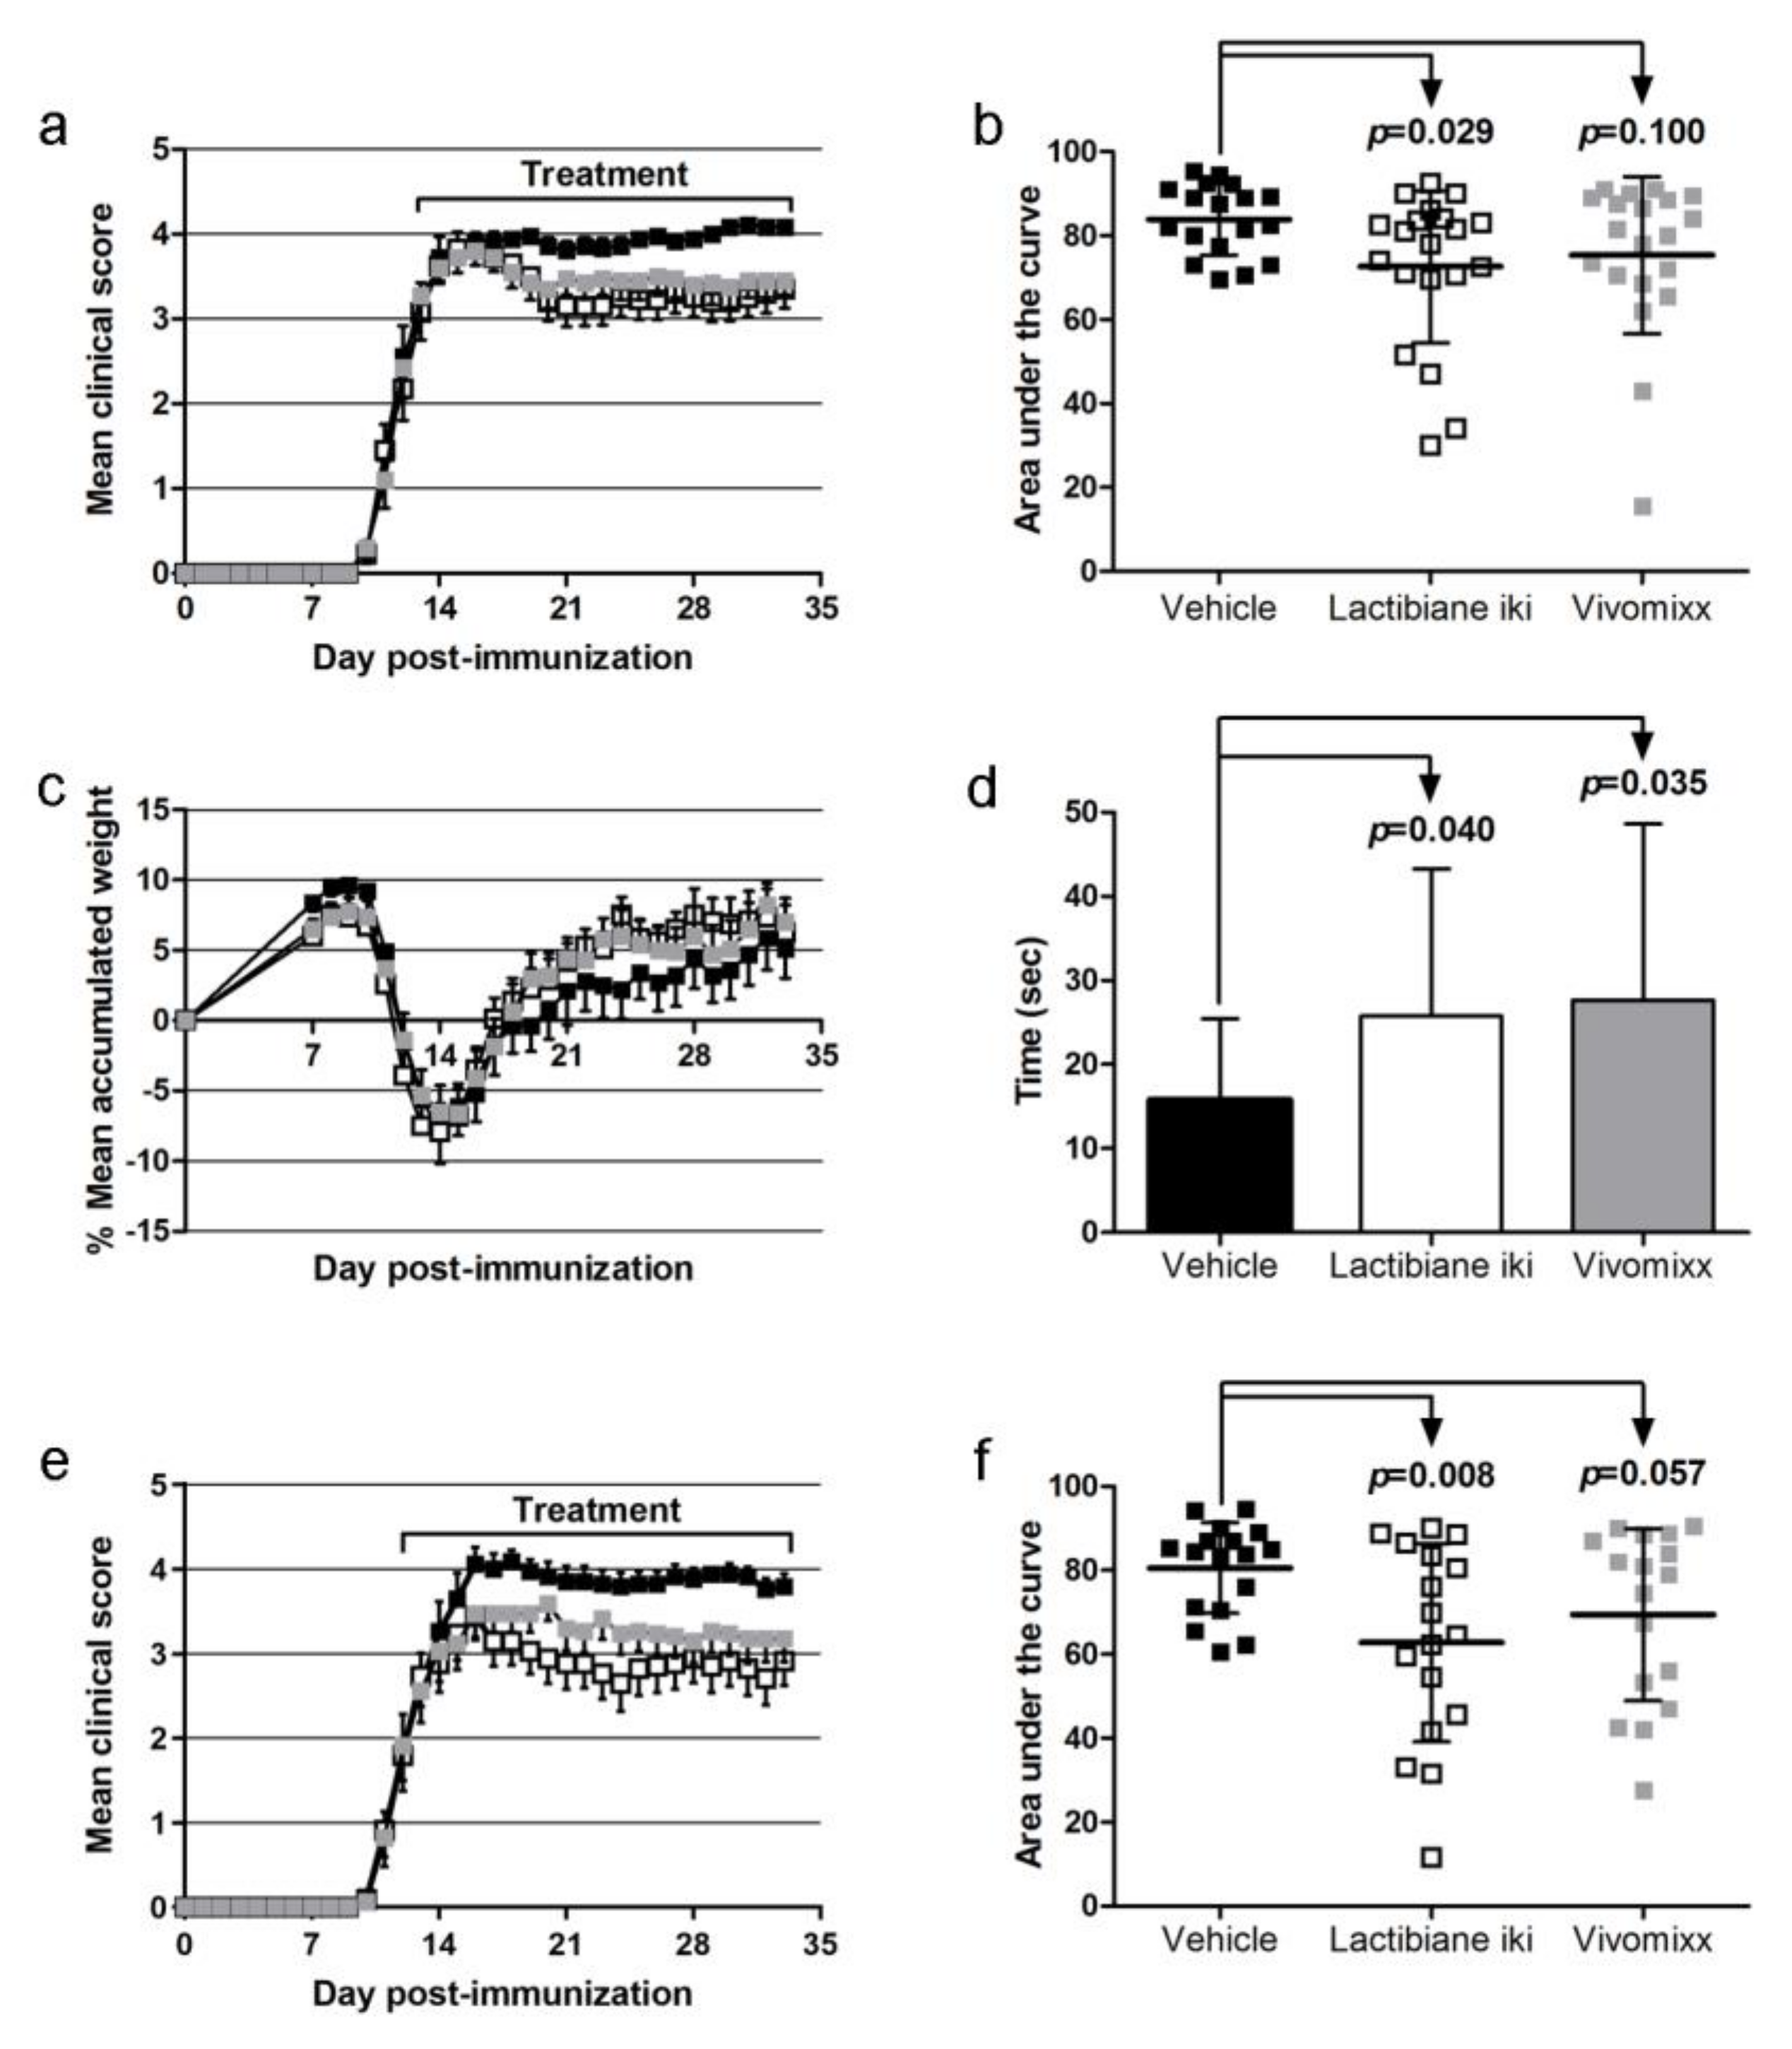
3.1. Lactibiane iki Improves the EAE Clinical Outcome in a Dose-Dependent Manner as a Therapeutic Approach
3.2. Pathogenic Responses are Reduced in the Spinal Cords of Probiotic-Treated EAE Mice
3.3. Lactibiane iki Reduces Antigen-Specific Proliferation but Does Not Modify Disease-Related Cytokine Profile
3.4. Lactibiane iki Increases Treg Cells and Diminishes Plasma Cells in the Periphery
3.5. Commercial Probiotics Modulate the Number and Phenotype of Antigen Presenting Cells (APCs)
3.6. Commercial Probiotics do not Alter Intestinal Permeability but do Modify Gut Microbiome Composition
3.7. Specific Bacterial Taxa are Associated with Disease Progression
4. Discussion
5. Conclusions
Supplementary Materials
Author Contributions
Funding
Acknowledgments
Conflicts of Interest
References
- Dendrou, C.; Fugger, L.; Friese, M.A. Immunopathology of multiple sclerosis. Nat. Rev. Immunol. 2015, 15, 545–558. [Google Scholar] [CrossRef] [PubMed]
- Sospedra, M.; Martin, R. Immunology of Multiple Sclerosis. Semin. Neurol. 2016, 36, 115–127. [Google Scholar] [CrossRef] [PubMed]
- Viglietta, V.; Baecher-Allan, C.; Weiner, H.L.; Hafler, D.A. Loss of Functional Suppression by CD4+CD25+ Regulatory T Cells in Patients with Multiple Sclerosis. J. Exp. Med. 2004, 199, 971–979. [Google Scholar] [CrossRef] [PubMed]
- Berer, K.; Mues, M.; Koutrolos, M.; Al Rasbi, Z.; Boziki, M.; Johner, C.; Wekerle, H.; Krishnamoorthy, G. Commensal microbiota and myelin autoantigen cooperate to trigger autoimmune demyelination. Nature 2011, 479, 538–541. [Google Scholar] [CrossRef]
- Lee, Y.K.; Menezes, J.S.; Umesaki, Y.; Mazmanian, S.K. Proinflammatory T-cell responses to gut microbiota promote experimental autoimmune encephalomyelitis. Proc. Natl. Acad. Sci. USA 2010, 108, 4615–4622. [Google Scholar] [CrossRef]
- Ochoa-Re, J.; Mielcarz, D.W.; Ditrio, L.E.; Burroughs, A.R.; Foureau, D.M.; Haque-Begum, S.; Kasper, L.H. Role of Gut Commensal Microflora in the Development of Experimental Autoimmune Encephalomyelitis. J. Immunol. 2009, 183, 6041–6050. [Google Scholar] [CrossRef]
- Kwon, H.-K.; Kim, G.-C.; Kim, Y.; Hwang, W.; Jash, A.; Sahoo, A.; Kim, J.-E.; Nam, J.H.; Im, S.-H. Amelioration of experimental autoimmune encephalomyelitis by probiotic mixture is mediated by a shift in T helper cell immune response. Clin. Immunol. 2013, 146, 217–227. [Google Scholar] [CrossRef]
- Ochoa-Re, J.; Mielcarz, D.W.; Wang, Y.; Begum-Haque, S.; Dasgupta, S.; Kasper, D.L.; Kasper, L.H. A polysaccharide from the human commensal Bacteroides fragilis protects against CNS demyelinating disease. Mucosal Immunol. 2010, 3, 487–495. [Google Scholar] [CrossRef]
- Lavasani, S.; Dzhambazov, B.; Nouri, M.; Fåk, F.; Buske, S.; Molin, G.; Thorlacius, H.; Alenfall, J.; Jeppsson, B.; Weström, B. A Novel Probiotic Mixture Exerts a Therapeutic Effect on Experimental Autoimmune Encephalomyelitis Mediated by IL-10 Producing Regulatory T Cells. PLOS ONE 2010, 5, 9009. [Google Scholar] [CrossRef]
- Mangalam, A.K.; Shahi, S.K.; Luckey, D.; Karau, M.; Marietta, E.; Luo, N.; Choung, R.S.; Ju, J.; Sompallae, R.; Gibson-Corley, K.; et al. Human Gut-Derived Commensal Bacteria Suppress CNS Inflammatory and Demyelinating Disease. Cell Rep. 2017, 20, 1269–1277. [Google Scholar] [CrossRef]
- Salehipour, Z.; Haghmorad, D.; Sankian, M.; Rastin, M.; Nosratabadi, R.; Dallal, M.M.S.; Tabasi, N.; Khazaee, M.; Nasiraii, L.R.; Mahmoudi, M. Bifidobacterium animalis in combination with human origin of Lactobacillus plantarum ameliorate neuroinflammation in experimental model of multiple sclerosis by altering CD4+ T cell subset balance. Biomed. Pharmacother. 2017, 95, 1535–1548. [Google Scholar] [CrossRef]
- Secher, T.; Kassem, S.; Benamar, M.; Bernard, I.; Boury, M.; Barreau, F.; Oswald, E.; Saoudi, A. Oral Administration of the Probiotic Strain Escherichia coli Nissle 1917 Reduces Susceptibility to Neuroinflammation and Repairs Experimental Autoimmune Encephalomyelitis-Induced Intestinal Barrier Dysfunction. Front. Immunol. 2017, 8, 8. [Google Scholar] [CrossRef]
- He, B.; Hoang, T.K.; Tian, X.; Taylor, C.M.; Blanchard, E.; Luo, M.; Bhattacharjee, M.B.; Freeborn, J.; Park, S.; Couturier, J.; et al. Lactobacillus reuteri Reduces the Severity of Experimental Autoimmune Encephalomyelitis in Mice by Modulating Gut Microbiota. Front. Immunol. 2019, 10, 385. [Google Scholar] [CrossRef] [PubMed]
- Foligne, B.; Nutten, S.; Grangette, C.; Dennin, V.; Goudercourt, D.; Poiret, S.; Dewulf, J.; Brassart, D.; Mercenier, A.; Pot, B. Correlation between in vitro and in vivo immunomodulatory properties of lactic acid bacteria. World J. Gastroenterol. 2007, 13, 236–243. [Google Scholar] [CrossRef] [PubMed]
- Di Giacinto, C.; Marinaro, M.; Sanchez, M.; Strober, W.; Boirivant, M. Probiotics Ameliorate Recurrent Th1-Mediated Murine Colitis by Inducing IL-10 and IL-10-Dependent TGF-β-Bearing Regulatory Cells. J. Immunol. 2005, 174, 3237–3246. [Google Scholar] [CrossRef] [PubMed]
- Dolpady, J.; Sorini, C.; Di Pietro, C.; Cosorich, I.; Ferrarese, R.; Saita, D.; Clementi, M.; Canducci, F.; Falcone, M. Oral Probiotic VSL#3 Prevents Autoimmune Diabetes by Modulating Microbiota and Promoting Indoleamine 2,3-Dioxygenase-Enriched Tolerogenic Intestinal Environment. J. Diabetes Res. 2016, 2016, 1–12. [Google Scholar]
- Tankou, S.K.; Regev, K.; Healy, B.C.; Tjon, E.; Laghi, L.; Cox, L.M.; Kivisakk, P.; Pierre, I.V.; Hrishikesh, L.; Gandhi, R.; et al. A probiotic modulates the microbiome and immunity in multiple sclerosis. Ann. Neurol. 2018, 83, 1147–1161. [Google Scholar] [CrossRef] [PubMed]
- Tankou, S.K.; Regev, K.; Healy, B.C.; Cox, L.M.; Tjon, E.; Kivisakk, P.; Vanande, I.P.; Cook, S.; Gandhi, R.; Glanz, B.; et al. Investigation of probiotics in multiple sclerosis. Mult. Scler. J. 2018, 24, 58–63. [Google Scholar] [CrossRef] [PubMed]
- Gutiérrez-Franco, A.; Eixarch, H.; Costa, C.; Castillo, M.; Barreiro, L.C.; Gil, V.; Montalban, X.; Del Río, J.A.; Espejo, C. Semaphorin 7A as a Potential Therapeutic Target for Multiple Sclerosis. Mol. Neurobiol. 2016, 54, 4820–4831. [Google Scholar] [CrossRef] [PubMed]
- Baker, D.; Amor, S. Publication guidelines for refereeing and reporting on animal use in experimental autoimmune encephalomyelitis. J. Neuroimmunol. 2012, 242, 78–83. [Google Scholar] [CrossRef] [PubMed]
- Ivanov, I.I.; McKenzie, B.S.; Zhou, L.; Tadokoro, C.E.; Lepelley, A.; Lafaille, J.J.; Cua, D.J.; Littman, D.R. The Orphan Nuclear Receptor RORγt Directs the Differentiation Program of Proinflammatory IL-17+ T Helper Cells. Cell 2006, 126, 1121–1133. [Google Scholar] [CrossRef] [PubMed]
- Livak, K.J.; Schmittgen, T.D. Analysis of relative gene expression data using real-time quantitative PCR and the 2(-Delta Delta C(T)) Method. Methods 2001, 25, 402–408. [Google Scholar] [CrossRef] [PubMed]
- Bustin, S.; Benes, V.; Garson, J.A.; Hellemans, J.; Huggett, J.; Kubista, M.; Mueller, R.; Nolan, T.; Pfaffl, M.W.; Shipley, G.L.; et al. The MIQE Guidelines: Minimum Information for Publication of Quantitative Real-Time PCR Experiments. Clin. Chem. 2009, 55, 611–622. [Google Scholar] [CrossRef] [PubMed]
- Nouri, M.; Bredberg, A.; Weström, B.; Lavasani, S. Intestinal Barrier Dysfunction Develops at the Onset of Experimental Autoimmune Encephalomyelitis, and Can Be Induced by Adoptive Transfer of Auto-Reactive T Cells. PLOS ONE 2014, 9, e106335. [Google Scholar] [CrossRef]
- Bolyen, E.; Rideout, J.R.; Dillon, M.R.; Bokulich, N.A.; Abnet, C.; Al-Ghalith, G.A.; Alexander, H.; Alm, E.J.; Arumugam, M.; Asnicar, F.; et al. QIIME 2: Reproducible, interactive, scalable, and extensible microbiome data science. PeerJ Preprints 2018, 6, e27295v2. [Google Scholar] [CrossRef]
- Callahan, B.J.; McMurdie, P.; Rosen, M.J.; Han, A.W.; A Johnson, A.J.; Holmes, S. DADA2: High-resolution sample inference from Illumina amplicon data. Nat. Methods 2016, 13, 581–583. [Google Scholar] [CrossRef]
- Callahan, B.J.; McMurdie, P.J.; Holmes, S.P. Exact sequence variants should replace operational taxonomic units in marker-gene data analysis. ISME J. 2017, 11, 2639–2643. [Google Scholar] [CrossRef]
- Wang, J.; Zhang, Q.; Wu, G.; Zhang, C.; Zhang, M.; Zhao, L. Minimizing spurious features in 16S rRNA gene amplicon sequencing. PeerJ Preprints 2018, 6, e26872v1. [Google Scholar]
- Katoh, K. MAFFT: a novel method for rapid multiple sequence alignment based on fast Fourier transform. Nucleic Acids Res. 2002, 30, 3059–3066. [Google Scholar] [CrossRef]
- Price, M.N.; Dehal, P.S.; Arkin, A.P. FastTree 2—Approximately Maximum-Likelihood Trees for Large Alignments. PLOS ONE 2010, 5, e9490. [Google Scholar] [CrossRef]
- Bokulich, N.A.; Kaehler, B.; Rideout, J.R.; Dillon, M.; Bolyen, E.; Knight, R.; Huttley, G.A.; Caporaso, J.G. Optimizing taxonomic classification of marker-gene amplicon sequences with QIIME 2’s q2-feature-classifier plugin. Microbiome 2018, 6, 90. [Google Scholar] [CrossRef] [PubMed]
- Quast, C.; Pruesse, E.; Yilmaz, P.; Gerken, J.; Schweer, T.; Yarza, P.; Peplies, J.; Glöckner, F.O. The SILVA ribosomal RNA gene database project: improved data processing and web-based tools. Nucleic Acids Res. 2012, 41, D590–D596. [Google Scholar] [CrossRef] [PubMed]
- Faith, D.P. Conservation evaluation and phylogenetic diversity. Boil. Conserv. 1992, 61, 1–10. [Google Scholar] [CrossRef]
- Lozupone, C.; Knight, R. UniFrac: a New Phylogenetic Method for Comparing Microbial Communities. Appl. Environ. Microbiol. 2005, 71, 8228–8235. [Google Scholar] [CrossRef] [PubMed]
- Lozupone, C.A.; Hamady, M.; Kelley, S.T.; Knight, R. Quantitative and Qualitative β Diversity Measures Lead to Different Insights into Factors That Structure Microbial Communities. Appl. Environ. Microbiol. 2007, 73, 1576–1585. [Google Scholar] [CrossRef] [PubMed]
- Kruskal, W.H.; Wallis, W.A. Use of Ranks in One-Criterion Variance Analysis. J. Am. Stat. Assoc. 1952, 47, 583–621. [Google Scholar] [CrossRef]
- Anderson, M.J. A new method for non-parametric multivariate analysis of variance. Austral Ecol. 2001, 26, 32–46. [Google Scholar]
- Mantel, N. The detection of disease clustering and a generalized regression approach. Cancer Res. 1967, 27, 209–220. [Google Scholar]
- Segata, N.; Izard, J.; Waldron, L.; Gevers, D.; Miropolsky, L.; Garrett, W.S.; Huttenhower, C. Metagenomic biomarker discovery and explanation. Genome Boil. 2011, 12, R60. [Google Scholar] [CrossRef]
- Morton, J.T.; Sanders, J.; Quinn, R.A.; McDonald, D.; Gonzalez, A.; Vázquez-Baeza, Y.; Navas-Molina, J.A.; Song, S.J.; Metcalf, J.L.; Hyde, E.R.; et al. Balance Trees Reveal Microbial Niche Differentiation. mSystems 2017, 2, e00162-16. [Google Scholar] [CrossRef]
- Martino, C.; Morton, J.T.; Marotz, C.A.; Thompson, L.R.; Tripathi, A.; Knight, R.; Zengler, K. A Novel Sparse Compositional Technique Reveals Microbial Perturbations. mSystems 2019, 4, e00016-19. [Google Scholar] [CrossRef]
- Fedarko, M.W.; Martino, C.; Morton, J.T.; González, A.; Rahman, G.; Marotz, C.A.; Minich, J.J.; Allen, E.E.; Knight, R. Visualizing ‘omic feature rankings and log-ratios using Qurro. bioRxiv 2019. [Google Scholar] [CrossRef]
- Deshpande, P.; King, I.L.; Segal, B.M. Cutting edge: CNS CD11c+ cells from mice with encephalomyelitis polarize Th17 cells and support CD25+CD4+ T cell-mediated immunosuppression, suggesting dual roles in the disease process. J. Immunol. 2007, 178, 6695–6699. [Google Scholar] [CrossRef] [PubMed]
- Greter, M.; Heppner, F.L.; Lemos, M.P.; Odermatt, B.M.; Goebels, N.; Laufer, T.; Noelle, R.J.; Becher, B. Dendritic cells permit immune invasion of the CNS in an animal model of multiple sclerosis. Nat. Med. 2005, 11, 328–334. [Google Scholar] [CrossRef] [PubMed]
- Langrish, C.L.; Chen, Y.; Blumenschein, W.M.; Mattson, J.; Basham, B.; Sedgwick, J.D.; McClanahan, T.; Kastelein, R.A.; Cua, D.J. IL-23 drives a pathogenic T cell population that induces autoimmune inflammation. J. Exp. Med. 2005, 201, 233–240. [Google Scholar] [CrossRef]
- Lock, C.; Hermans, G.; Pedotti, R.; Brendolan, A.; Schadt, E.; Garren, H.; Langer-Gould, A.; Strober, S.; Cannella, B.; Allard, J.; et al. Gene-microarray analysis of multiple sclerosis lesions yields new targets validated in autoimmune encephalomyelitis. Nat. Med. 2002, 8, 500–508. [Google Scholar] [CrossRef]
- Siffrin, V.; Radbruch, H.; Glumm, R.; Niesner, R.; Paterka, M.; Herz, J.; Leuenberger, T.; Lehmann, S.M.; Luenstedt, S.; Rinnenthal, J.L.; et al. In Vivo Imaging of Partially Reversible Th17 Cell-Induced Neuronal Dysfunction in the Course of Encephalomyelitis. Immunity 2010, 33, 424–436. [Google Scholar] [CrossRef]
- Tischner, D. Polyclonal expansion of regulatory T cells interferes with effector cell migration in a model of multiple sclerosis. Brain 2006, 129, 2635–2647. [Google Scholar] [CrossRef]
- Zozulya, A.L.; Wiendl, H. The role of regulatory T cells in multiple sclerosis. Nat. Clin. Pr. Neurol. 2008, 4, 384–398. [Google Scholar] [CrossRef]
- Mills, K.H. Regulatory T cells: friend or foe in immunity to infection? Nat. Rev. Immunol. 2004, 4, 841–855. [Google Scholar] [CrossRef]
- Danikowski, K.M.; Jayaraman, S.; Prabhakar, B.S. Regulatory T cells in multiple sclerosis and myasthenia gravis. J. Neuroinflamm. 2017, 14, 117. [Google Scholar] [CrossRef] [PubMed]
- Jang, E.; Cho, W.S.; Cho, M.-L.; Park, H.-J.; Oh, H.-J.; Kang, S.M.; Paik, D.-J.; Youn, J. Foxp3+ Regulatory T Cells Control Humoral Autoimmunity by Suppressing the Development of Long-Lived Plasma Cells. J. Immunol. 2011, 186, 1546–1553. [Google Scholar] [CrossRef] [PubMed]
- Sospedra, M. B cells in multiple sclerosis. Curr. Opin. Neurol. 2018, 31, 256–262. [Google Scholar] [CrossRef] [PubMed]
- Dudek, A.M.; Martin, S.; Garg, A.D.; Agostinis, P. Immature, Semi-Mature, and Fully Mature Dendritic Cells: Toward a DC-Cancer Cells Interface That Augments Anticancer Immunity. Front. Immunol. 2013, 4, 438. [Google Scholar] [CrossRef]
- Waisman, A.; Lukas, M.; Clausen, B.E.; Yogev, N. Dendritic cells as gatekeepers of tolerance. Semin. Immunopathol. 2016, 39, 153–163. [Google Scholar] [CrossRef]
- Carter, L.L.; Leach, M.W.; Azoitei, M.L.; Cui, J.; Pelker, J.W.; Jussif, J.; Benoit, S.; Ireland, G.; Luxenberg, D.; Askew, G.R.; et al. PD-1/PD-L1, but not PD-1/PD-L2, interactions regulate the severity of experimental autoimmune encephalomyelitis. J. Neuroimmunol. 2007, 182, 124–134. [Google Scholar] [CrossRef]
- Zamani, M.R.; Aslani, S.; Salmaninejad, A.; Javan, M.R.; Rezaei, N. PD-1/PD-L and autoimmunity: A growing relationship. Cell. Immunol. 2016, 310, 27–41. [Google Scholar] [CrossRef]
- Trabattoni, D.; Saresella, M.; Pacei, M.; Marventano, I.; Mendozzi, L.; Rovaris, M.; Caputo, M.; Borelli, M.; Clerici, M. Costimulatory Pathways in Multiple Sclerosis: Distinctive Expression of PD-1 and PD-L1 in Patients with Different Patterns of Disease. J. Immunol. 2009, 183, 4984–4993. [Google Scholar] [CrossRef]
- Javan, M.R.; Aslani, S.; Zamani, M.R.; Rostamnejad, J.; Asadi, M.; Farhoodi, M.; Nicknam, M.H. Downregulation of Immunosuppressive Molecules, PD-1 and PD-L1 but not PD-L2, in the Patients with Multiple Sclerosis. Iran. J. Allergy Asthma Immunol. 2016, 15, 296–302. [Google Scholar]
- Keir, M.E.; Freeman, G.J.; Sharpe, A.H. PD-1 regulates self-reactive CD8+ T cell responses to antigen in lymph nodes and tissues. J. Immunol. 2007, 179, 5064–5070. [Google Scholar] [CrossRef]
- Probst, H.C.; McCoy, K.; Okazaki, T.; Honjo, T.; Broek, M.V.D. Resting dendritic cells induce peripheral CD8+ T cell tolerance through PD-1 and CTLA-4. Nat. Immunol. 2005, 6, 280–286. [Google Scholar] [CrossRef] [PubMed]
- Lange, C.M.; Dürr, M.; Doster, H.; Melms, A.; Bischof, F.; D, M. Dendritic cell–regulatory T-cell interactions control self-directed immunity. Immunol. Cell Boil. 2007, 85, 575–581. [Google Scholar] [CrossRef] [PubMed]
- Youn, J.-I.; Nagaraj, S.; Collazo, M.; Gabrilovich, D.I. Subsets of Myeloid-Derived Suppressor Cells in Tumor Bearing Mice1. J. Immunol. 2008, 181, 5791–5802. [Google Scholar] [CrossRef] [PubMed]
- Buscarinu, M.C.; Cerasoli, B.; Annibali, V.; Policano, C.; Lionetto, L.; Capi, M.; Mechelli, R.; Romano, S.; Fornasiero, A.; Mattei, G.; et al. Altered intestinal permeability in patients with relapsing–remitting multiple sclerosis: A pilot study. Mult. Scler. J. 2016, 23, 442–446. [Google Scholar] [CrossRef]
- Saresella, M.; Mendozzi, L.; Rossi, V.; Mazzali, F.; Piancone, F.; La Rosa, F.; Marventano, I.; Caputo, M.; Felis, G.E.; Clerici, M. Immunological and Clinical Effect of Diet Modulation of the Gut Microbiome in Multiple Sclerosis Patients: A Pilot Study. Front. Immunol. 2017, 8, 8. [Google Scholar] [CrossRef]
- Tap, J.; Mondot, S.; Levenez, F.; Pelletier, E.; Caron, C.; Furet, J.-P.; Ugarte, E.; Muñoz-Tamayo, R.; Lepaslier, D.; Nalin, R.; et al. Towards the human intestinal microbiota phylogenetic core. Environ. Microbiol. 2009, 11, 2574–2584. [Google Scholar] [CrossRef]
- Haghikia, A.; Jörg, S.; Duscha, A.; Kaisler, J.; Manzel, A.; Waschbisch, A.; Hammer, A.; Lee, D.-H.; May, C.; Wilck, N.; et al. Dietary Fatty Acids Directly Impact Central Nervous System Autoimmunity via the Small Intestine. Immunity 2016, 44, 951–953. [Google Scholar] [CrossRef]
- Atarashi, K.; Tanoue, T.; Oshima, K.; Suda, W.; Nagano, Y.; Nishikawa, H.; Fukuda, S.; Saito, T.; Narushima, S.; Hase, K.; et al. Treg induction by a rationally selected mixture of Clostridia strains from the human microbiota. Nature 2013, 500, 232–236. [Google Scholar] [CrossRef]
- Consonni, A.; Cordiglieri, C.; Rinaldi, E.; Marolda, R.; Ravanelli, I.; Guidesi, E.; Elli, M.; Mantegazza, R.; Baggi, F. Administration of bifidobacterium and lactobacillus strains modulates experimental myasthenia gravis and experimental encephalomyelitis in Lewis rats. Oncotarget 2018, 9, 22269–22287. [Google Scholar] [CrossRef]
- Hanchi, H.; Mottawea, W.; Sebei, K.; Hammami, R. The Genus Enterococcus: Between Probiotic Potential and Safety Concerns—An Update. Front. Microbiol. 2018, 9, 9. [Google Scholar] [CrossRef]


© 2020 by the authors. Licensee MDPI, Basel, Switzerland. This article is an open access article distributed under the terms and conditions of the Creative Commons Attribution (CC BY) license (http://creativecommons.org/licenses/by/4.0/).
Share and Cite
Calvo-Barreiro, L.; Eixarch, H.; Ponce-Alonso, M.; Castillo, M.; Lebrón-Galán, R.; Mestre, L.; Guaza, C.; Clemente, D.; del Campo, R.; Montalban, X.; et al. A Commercial Probiotic Induces Tolerogenic and Reduces Pathogenic Responses in Experimental Autoimmune Encephalomyelitis. Cells 2020, 9, 906. https://doi.org/10.3390/cells9040906
Calvo-Barreiro L, Eixarch H, Ponce-Alonso M, Castillo M, Lebrón-Galán R, Mestre L, Guaza C, Clemente D, del Campo R, Montalban X, et al. A Commercial Probiotic Induces Tolerogenic and Reduces Pathogenic Responses in Experimental Autoimmune Encephalomyelitis. Cells. 2020; 9(4):906. https://doi.org/10.3390/cells9040906
Chicago/Turabian StyleCalvo-Barreiro, Laura, Herena Eixarch, Manuel Ponce-Alonso, Mireia Castillo, Rafael Lebrón-Galán, Leyre Mestre, Carmen Guaza, Diego Clemente, Rosa del Campo, Xavier Montalban, and et al. 2020. "A Commercial Probiotic Induces Tolerogenic and Reduces Pathogenic Responses in Experimental Autoimmune Encephalomyelitis" Cells 9, no. 4: 906. https://doi.org/10.3390/cells9040906
APA StyleCalvo-Barreiro, L., Eixarch, H., Ponce-Alonso, M., Castillo, M., Lebrón-Galán, R., Mestre, L., Guaza, C., Clemente, D., del Campo, R., Montalban, X., & Espejo, C. (2020). A Commercial Probiotic Induces Tolerogenic and Reduces Pathogenic Responses in Experimental Autoimmune Encephalomyelitis. Cells, 9(4), 906. https://doi.org/10.3390/cells9040906