Profiling and Targeting of Energy and Redox Metabolism in Grade 2 Bladder Cancer Cells with Different Invasiveness Properties

 , ,
, ,  and
and 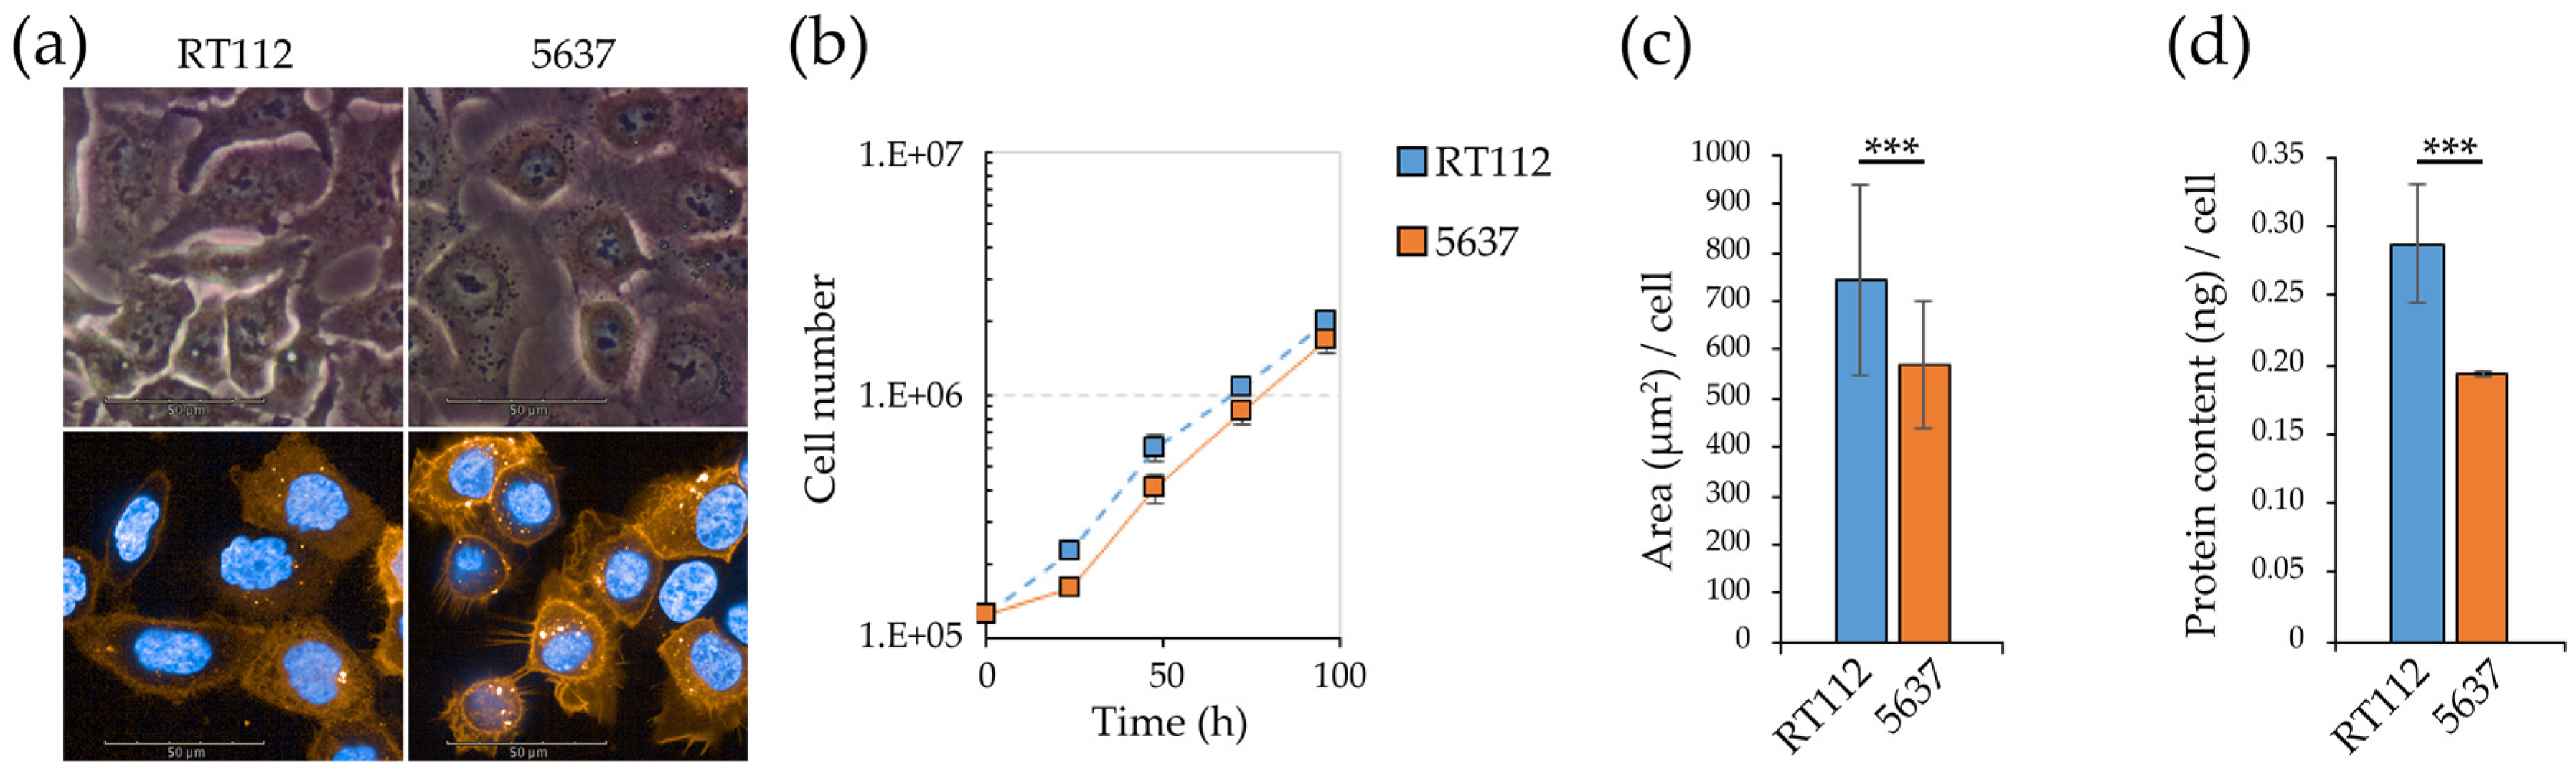
Abstract
1. Introduction
2. Materials and Methods
2.1. Materials and Cell Cultures
2.2. Cell Proliferation and Viability Assays
2.3. Wound Healing Assay
2.4. Sphere Formation Assays
2.5. Metabolic Profiling by Seahorse Assays
2.5.1. XF Cell Mitochondrial Stress Test
2.5.2. XF Glycolysis Stress Test
2.5.3. XF ATP Rate Assay
2.5.4. XF Palmitate-BSA FAO Assay
2.5.5. XF Mitochondrial Fuel Flex Test
2.6. Flow Cytometry
2.7. Imaging
2.7.1. High-Resolution Imaging for Quantitative Analysis
2.7.2. High-Resolution Imaging with Manually Operated Confocal Microscopy
2.8. RNA Extraction and qRT-PCR
2.9. Protein Content, Western Blotting
2.10. Statistical Analysis
3. Results
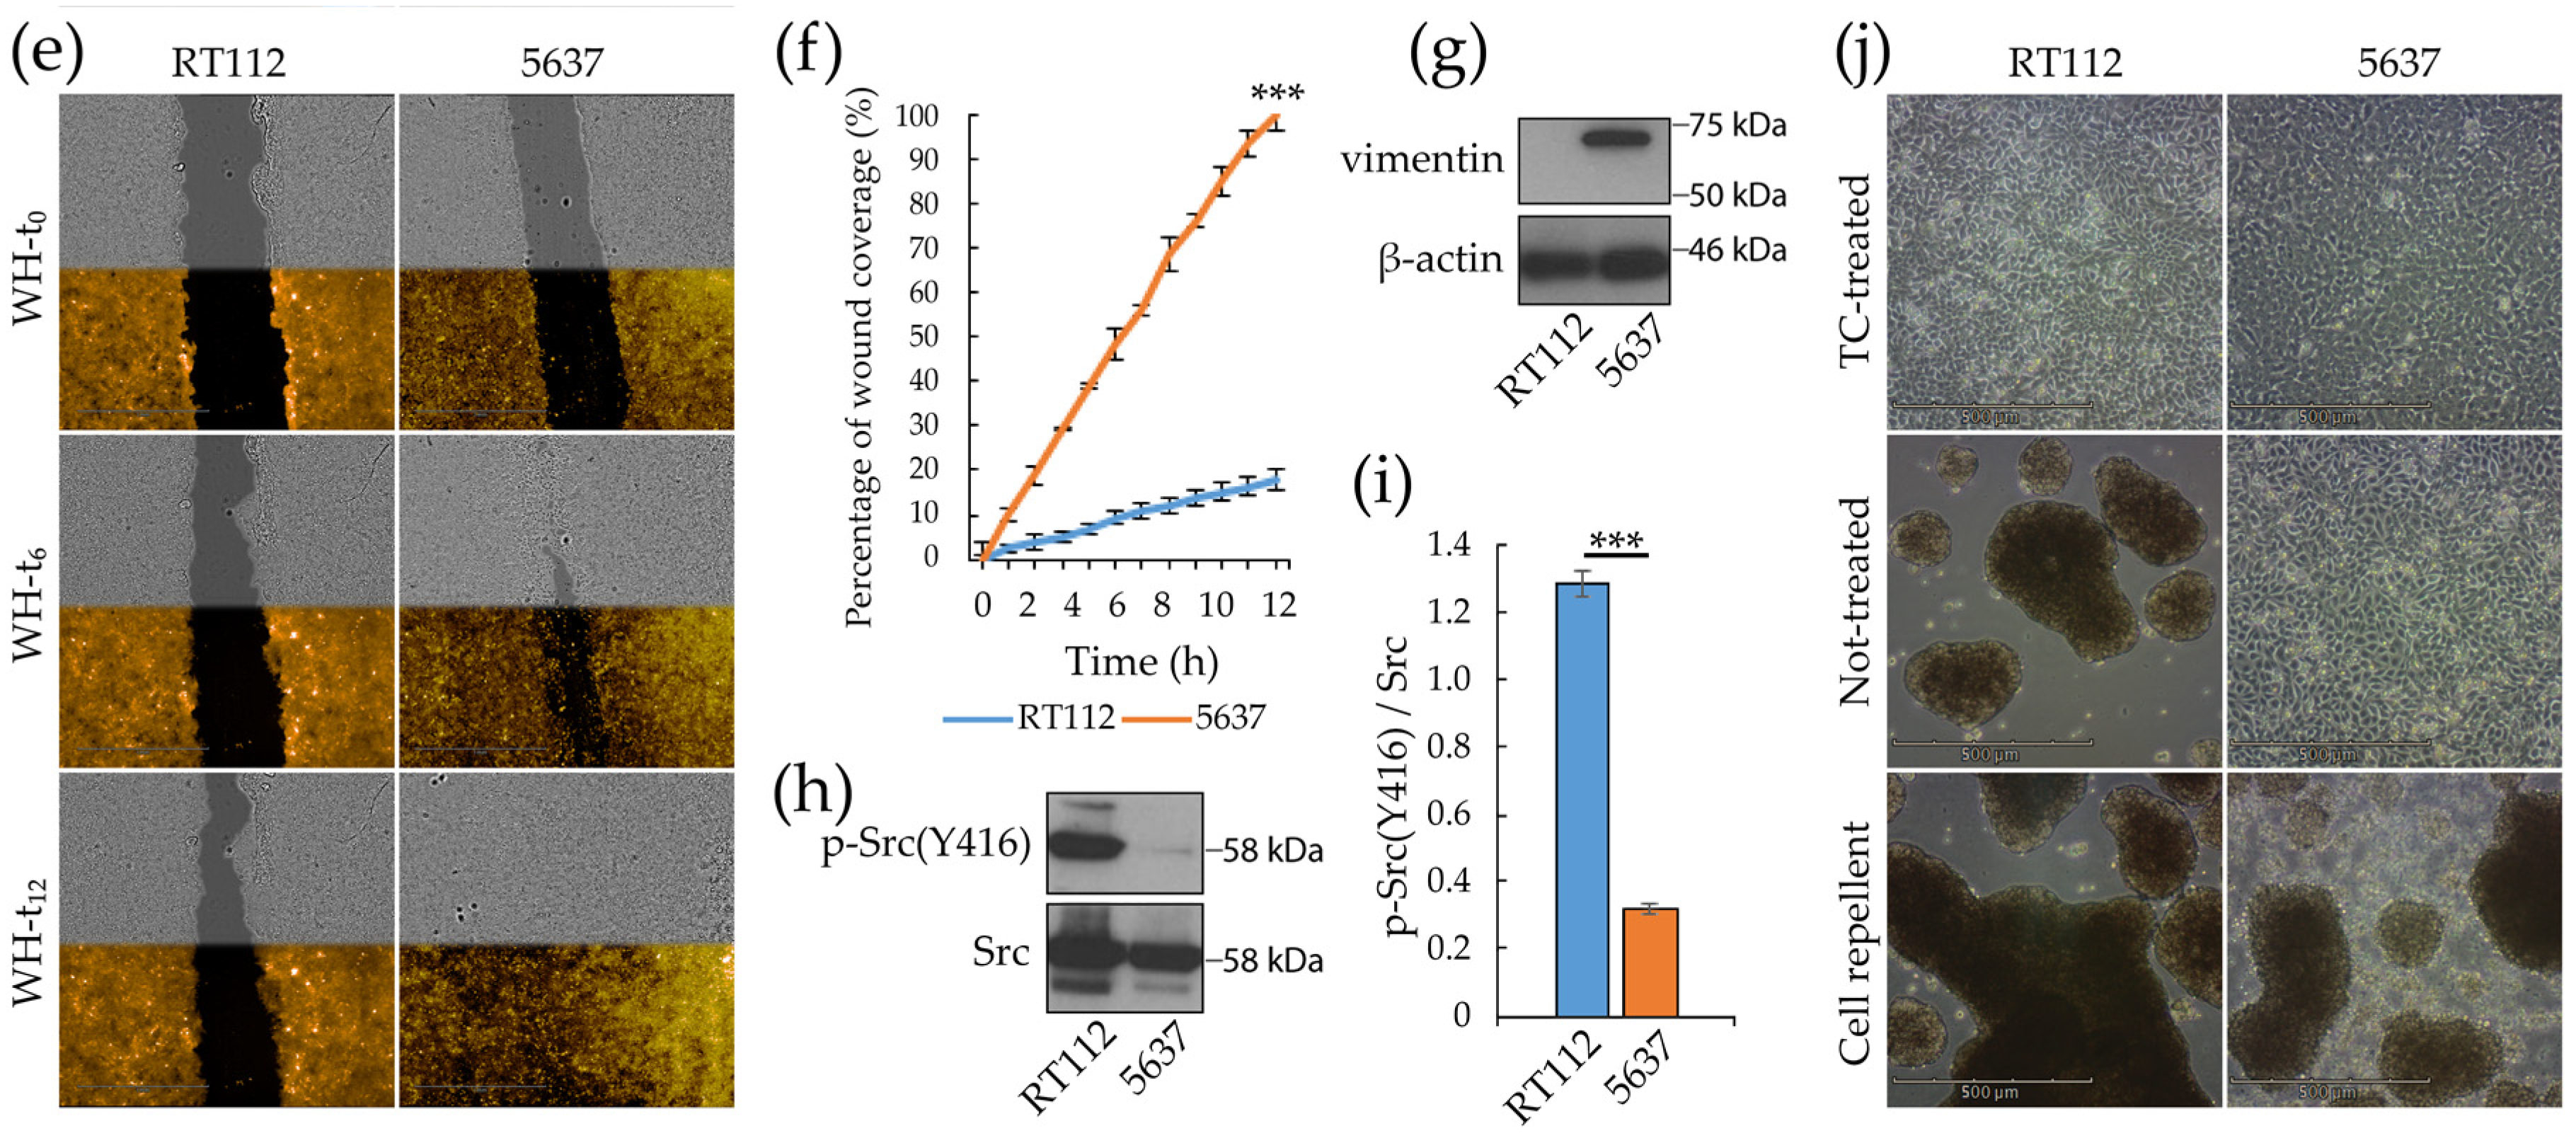
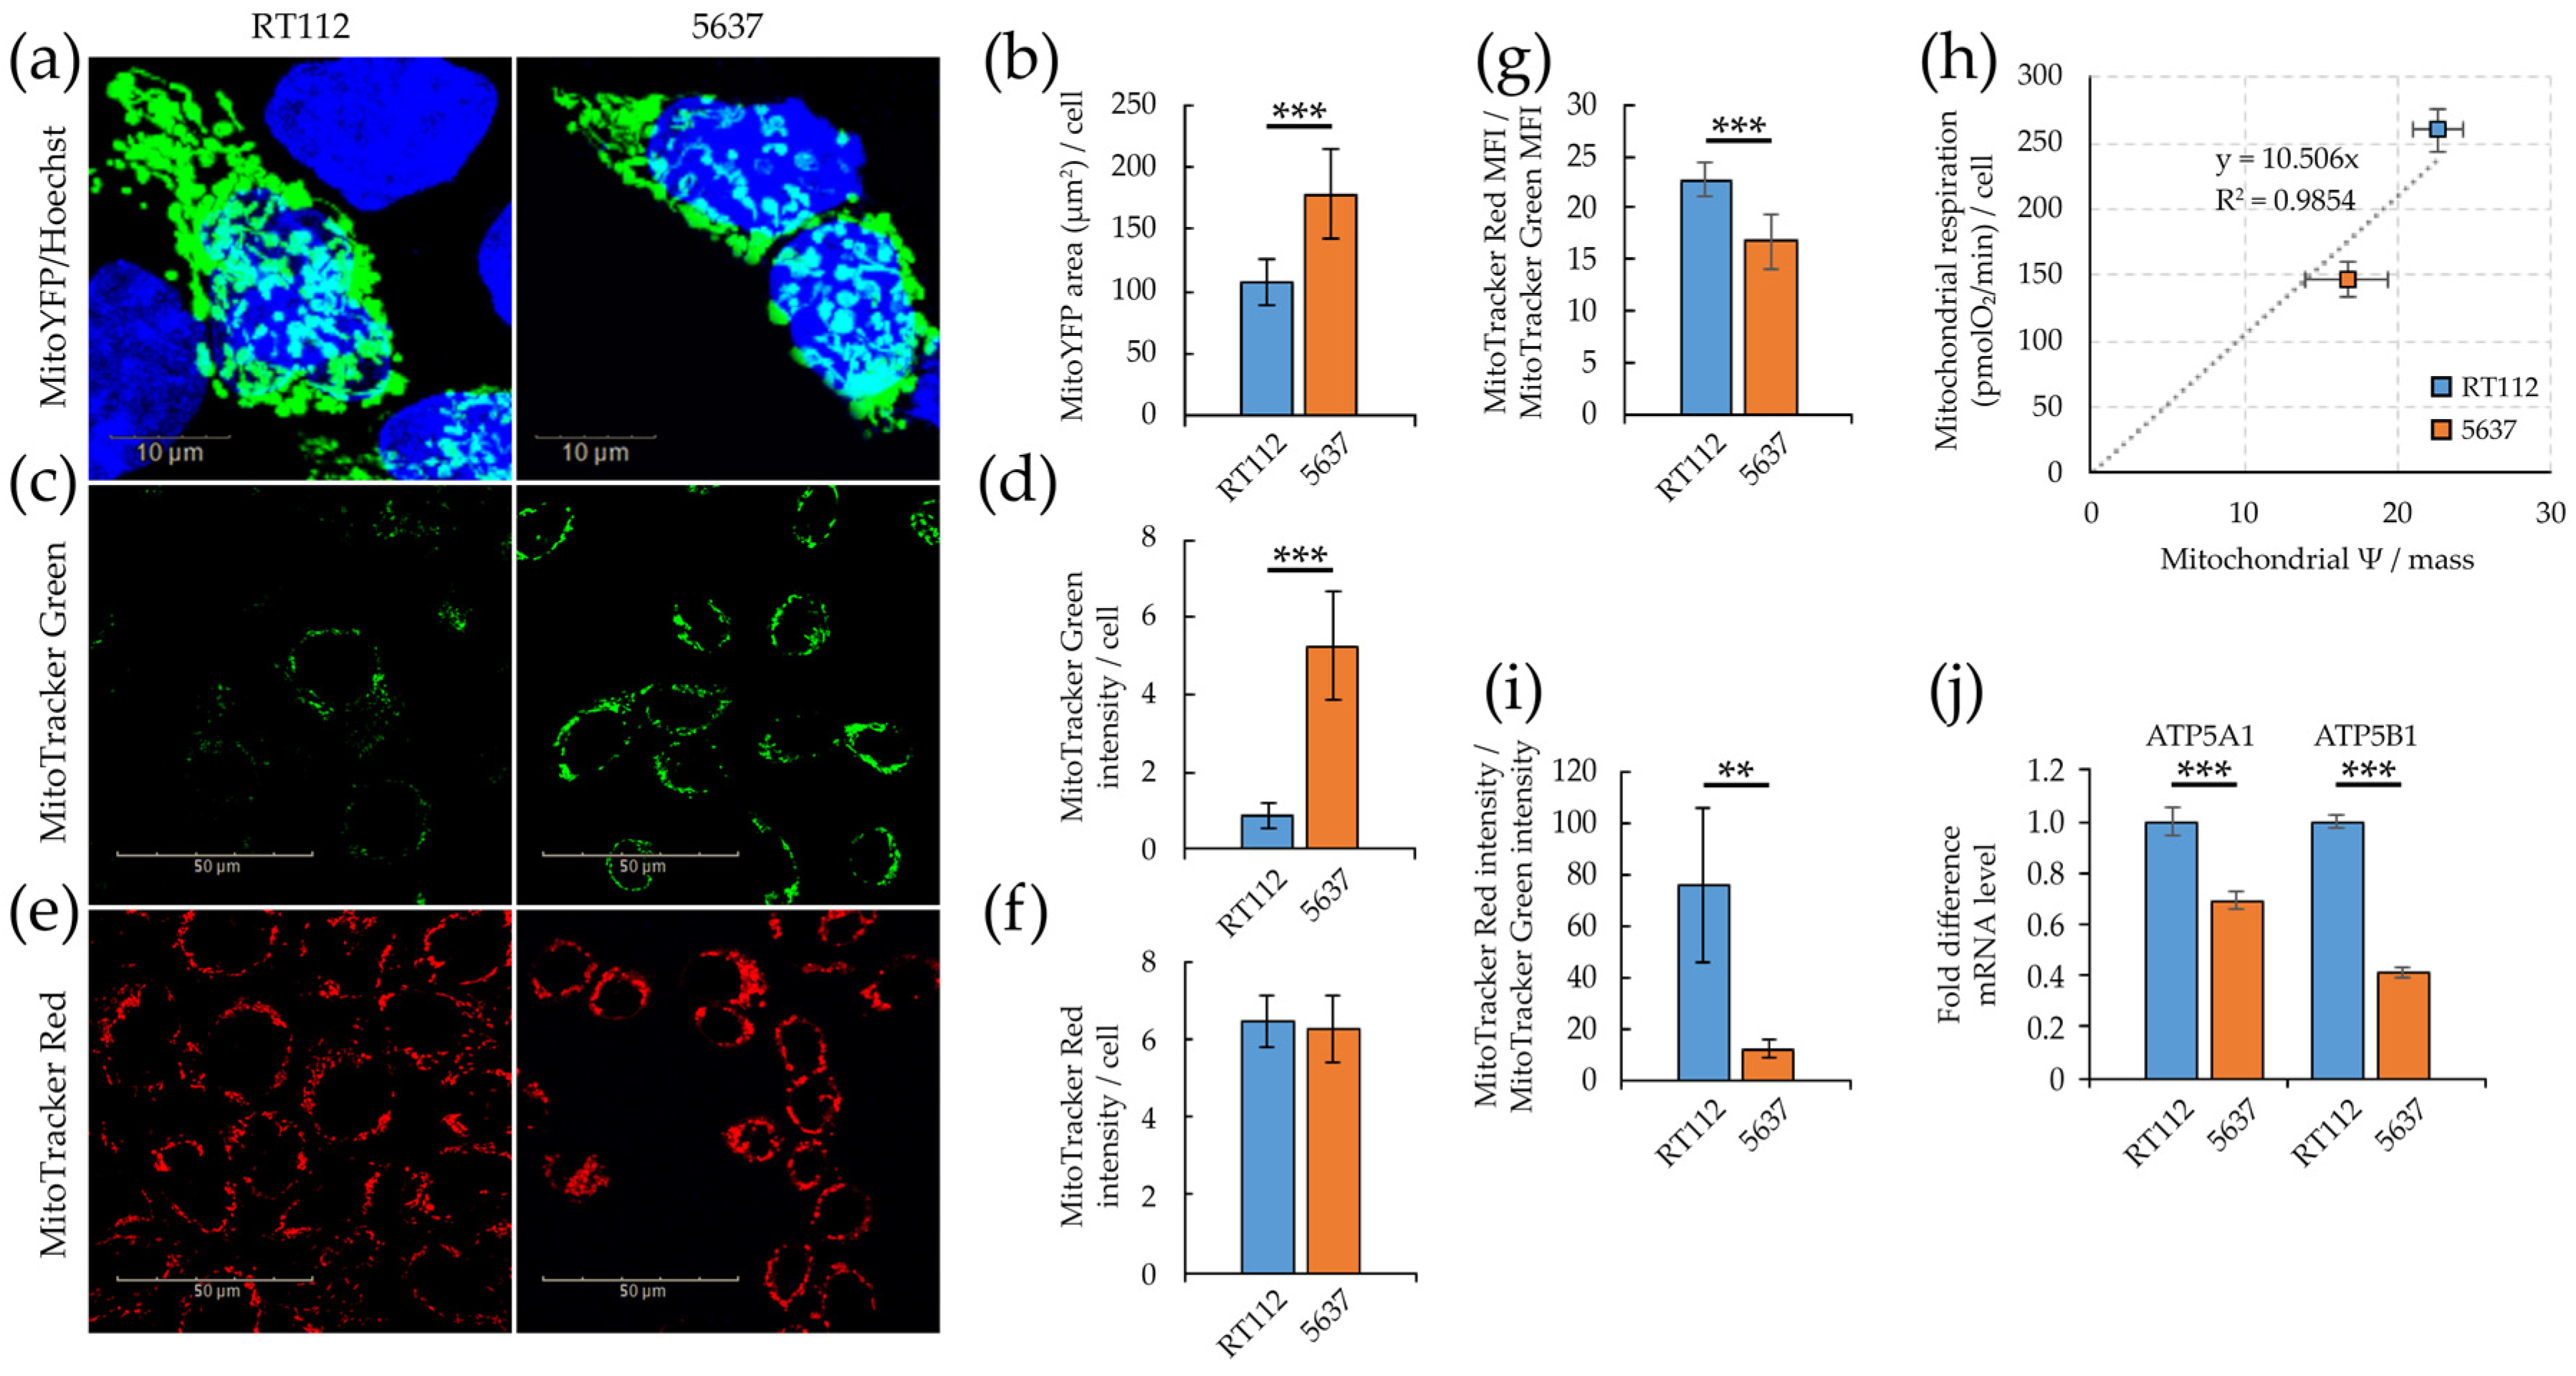
3.1. Morpho/Functional Features of RT112 and 5637 Grade 2 Bladder Cancer Cells
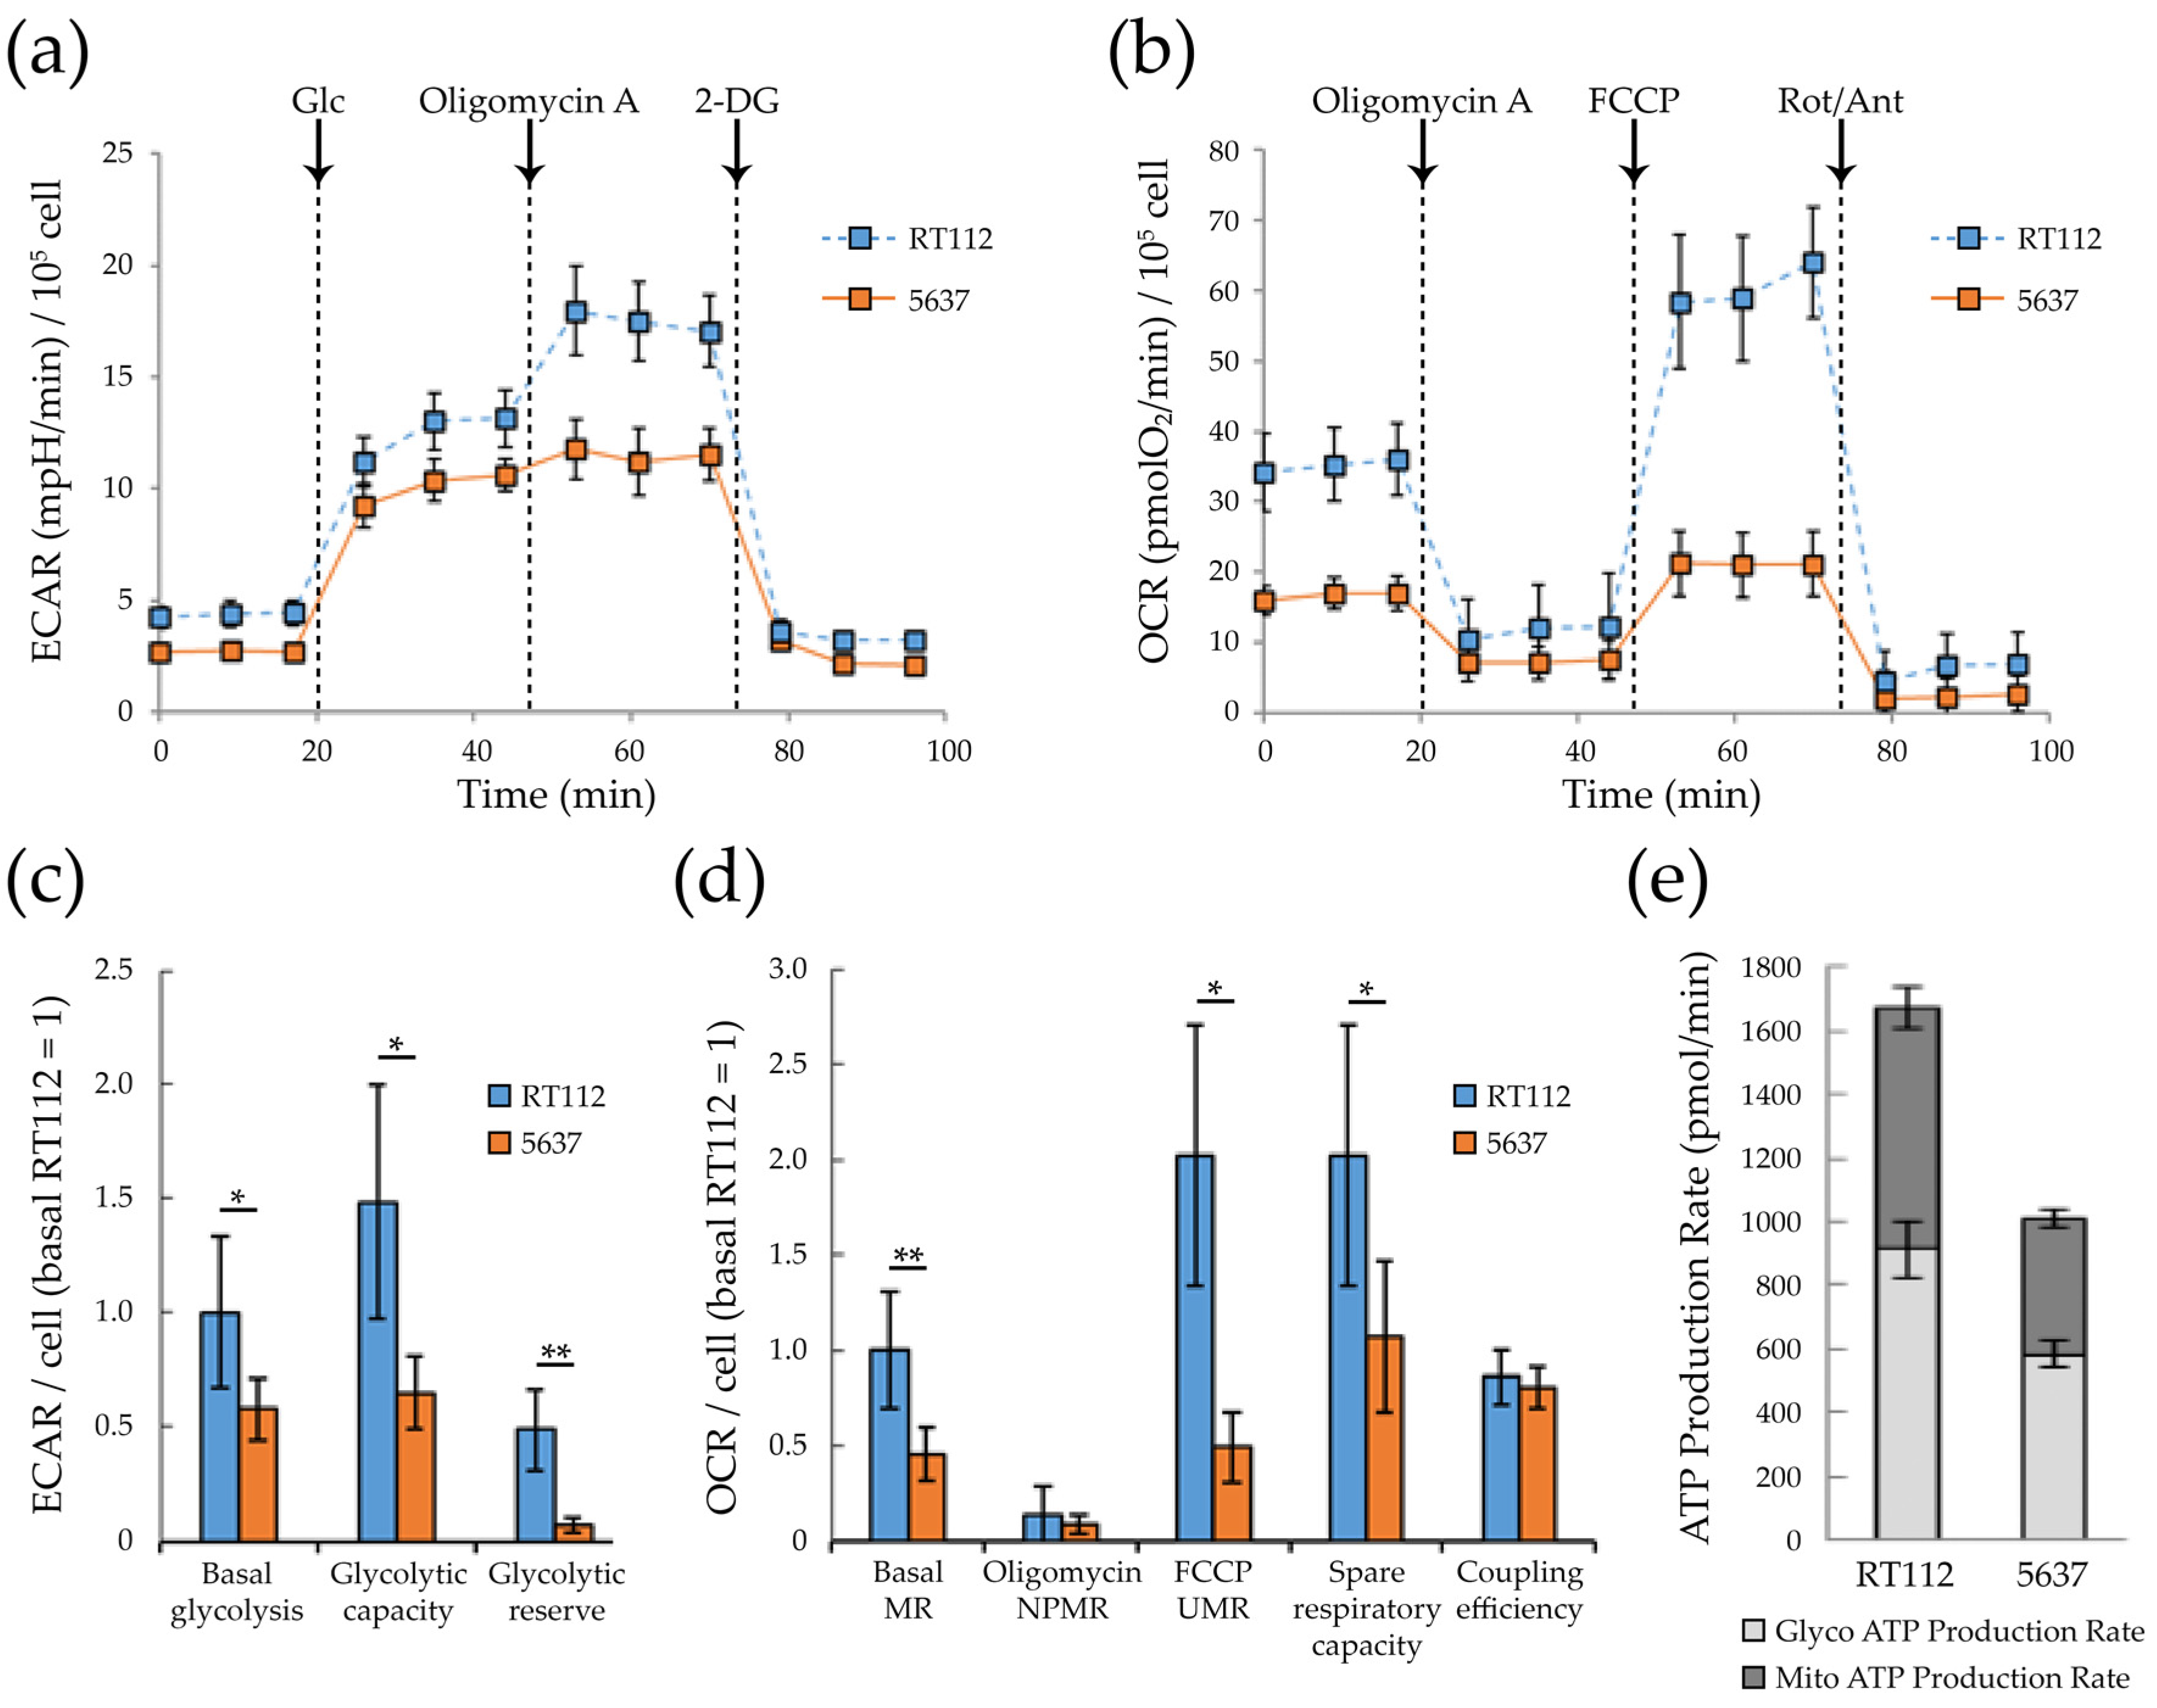
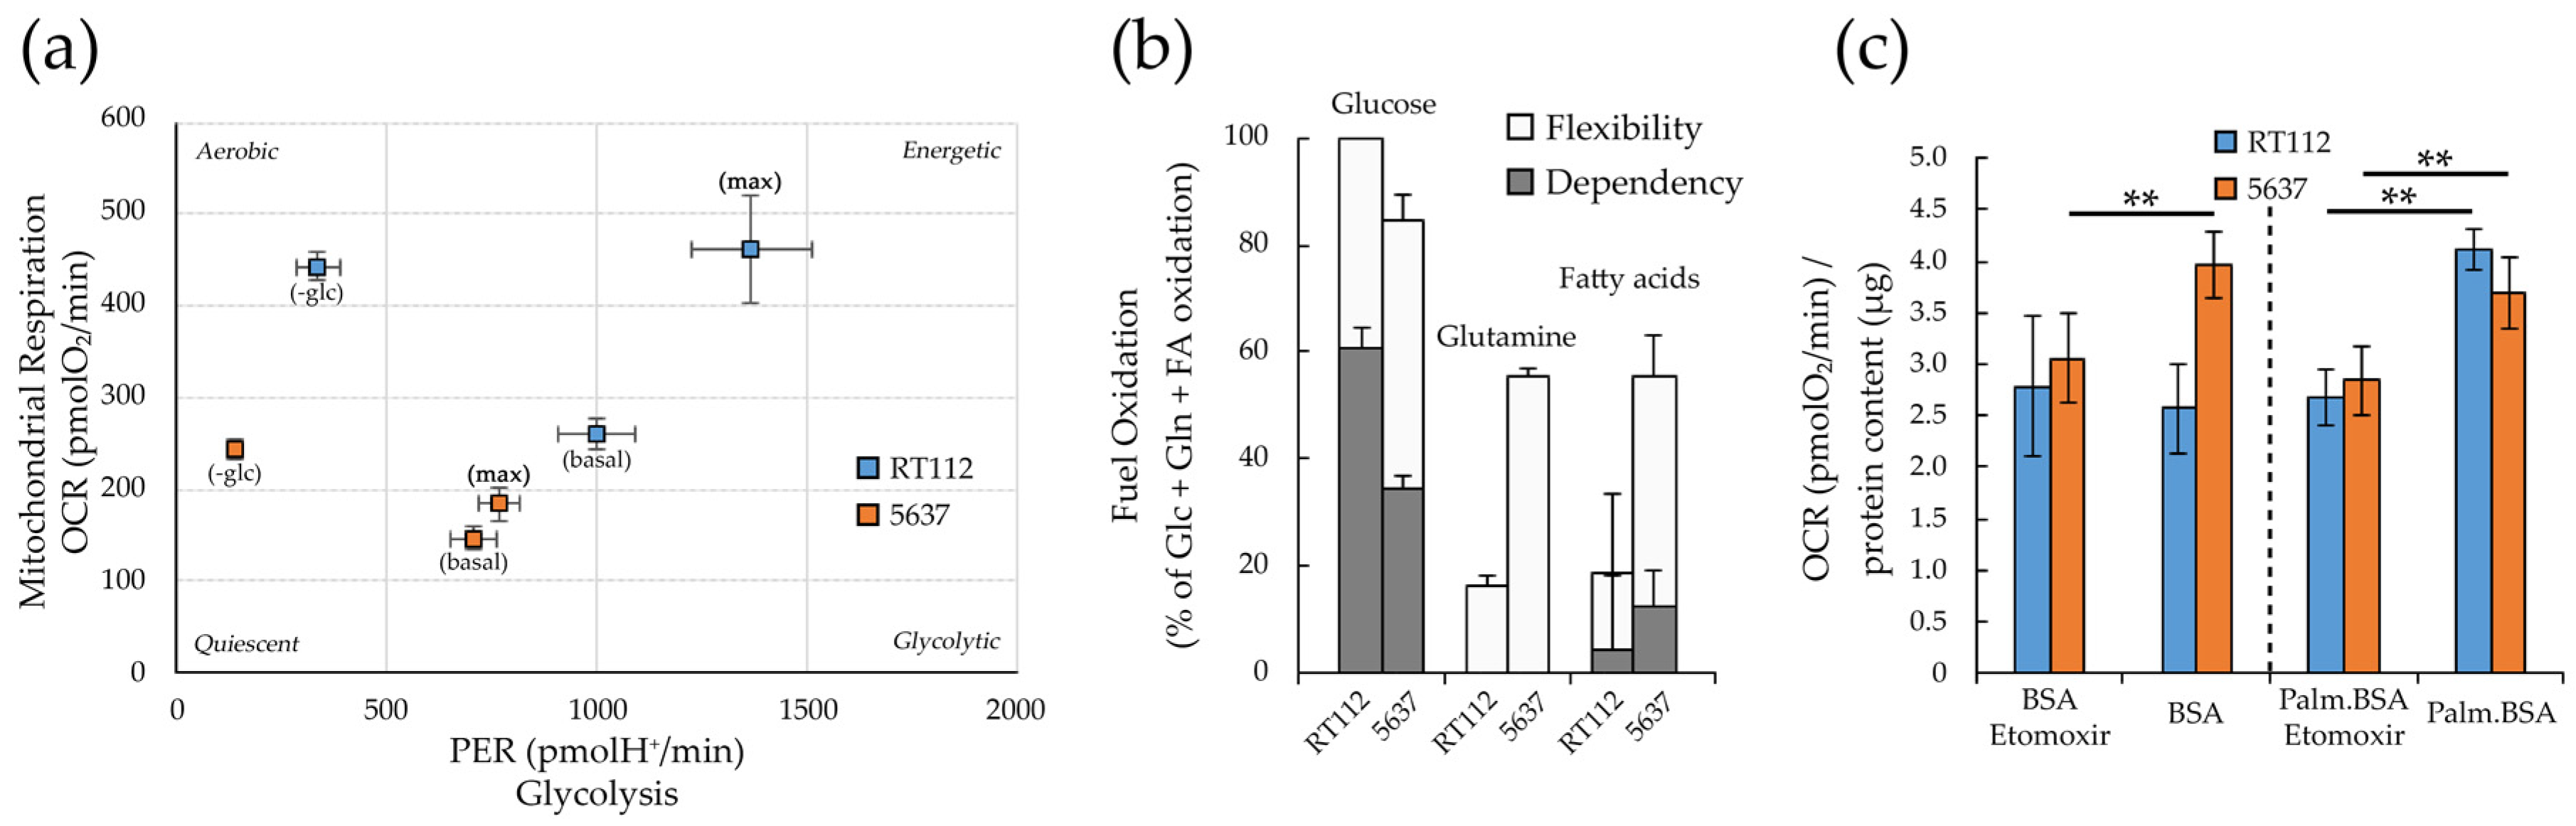
3.2. Glycolytic and Mitochondrial Bioenergetics of RT112 and 5637 Grade 2 Bladder Cancer Cells
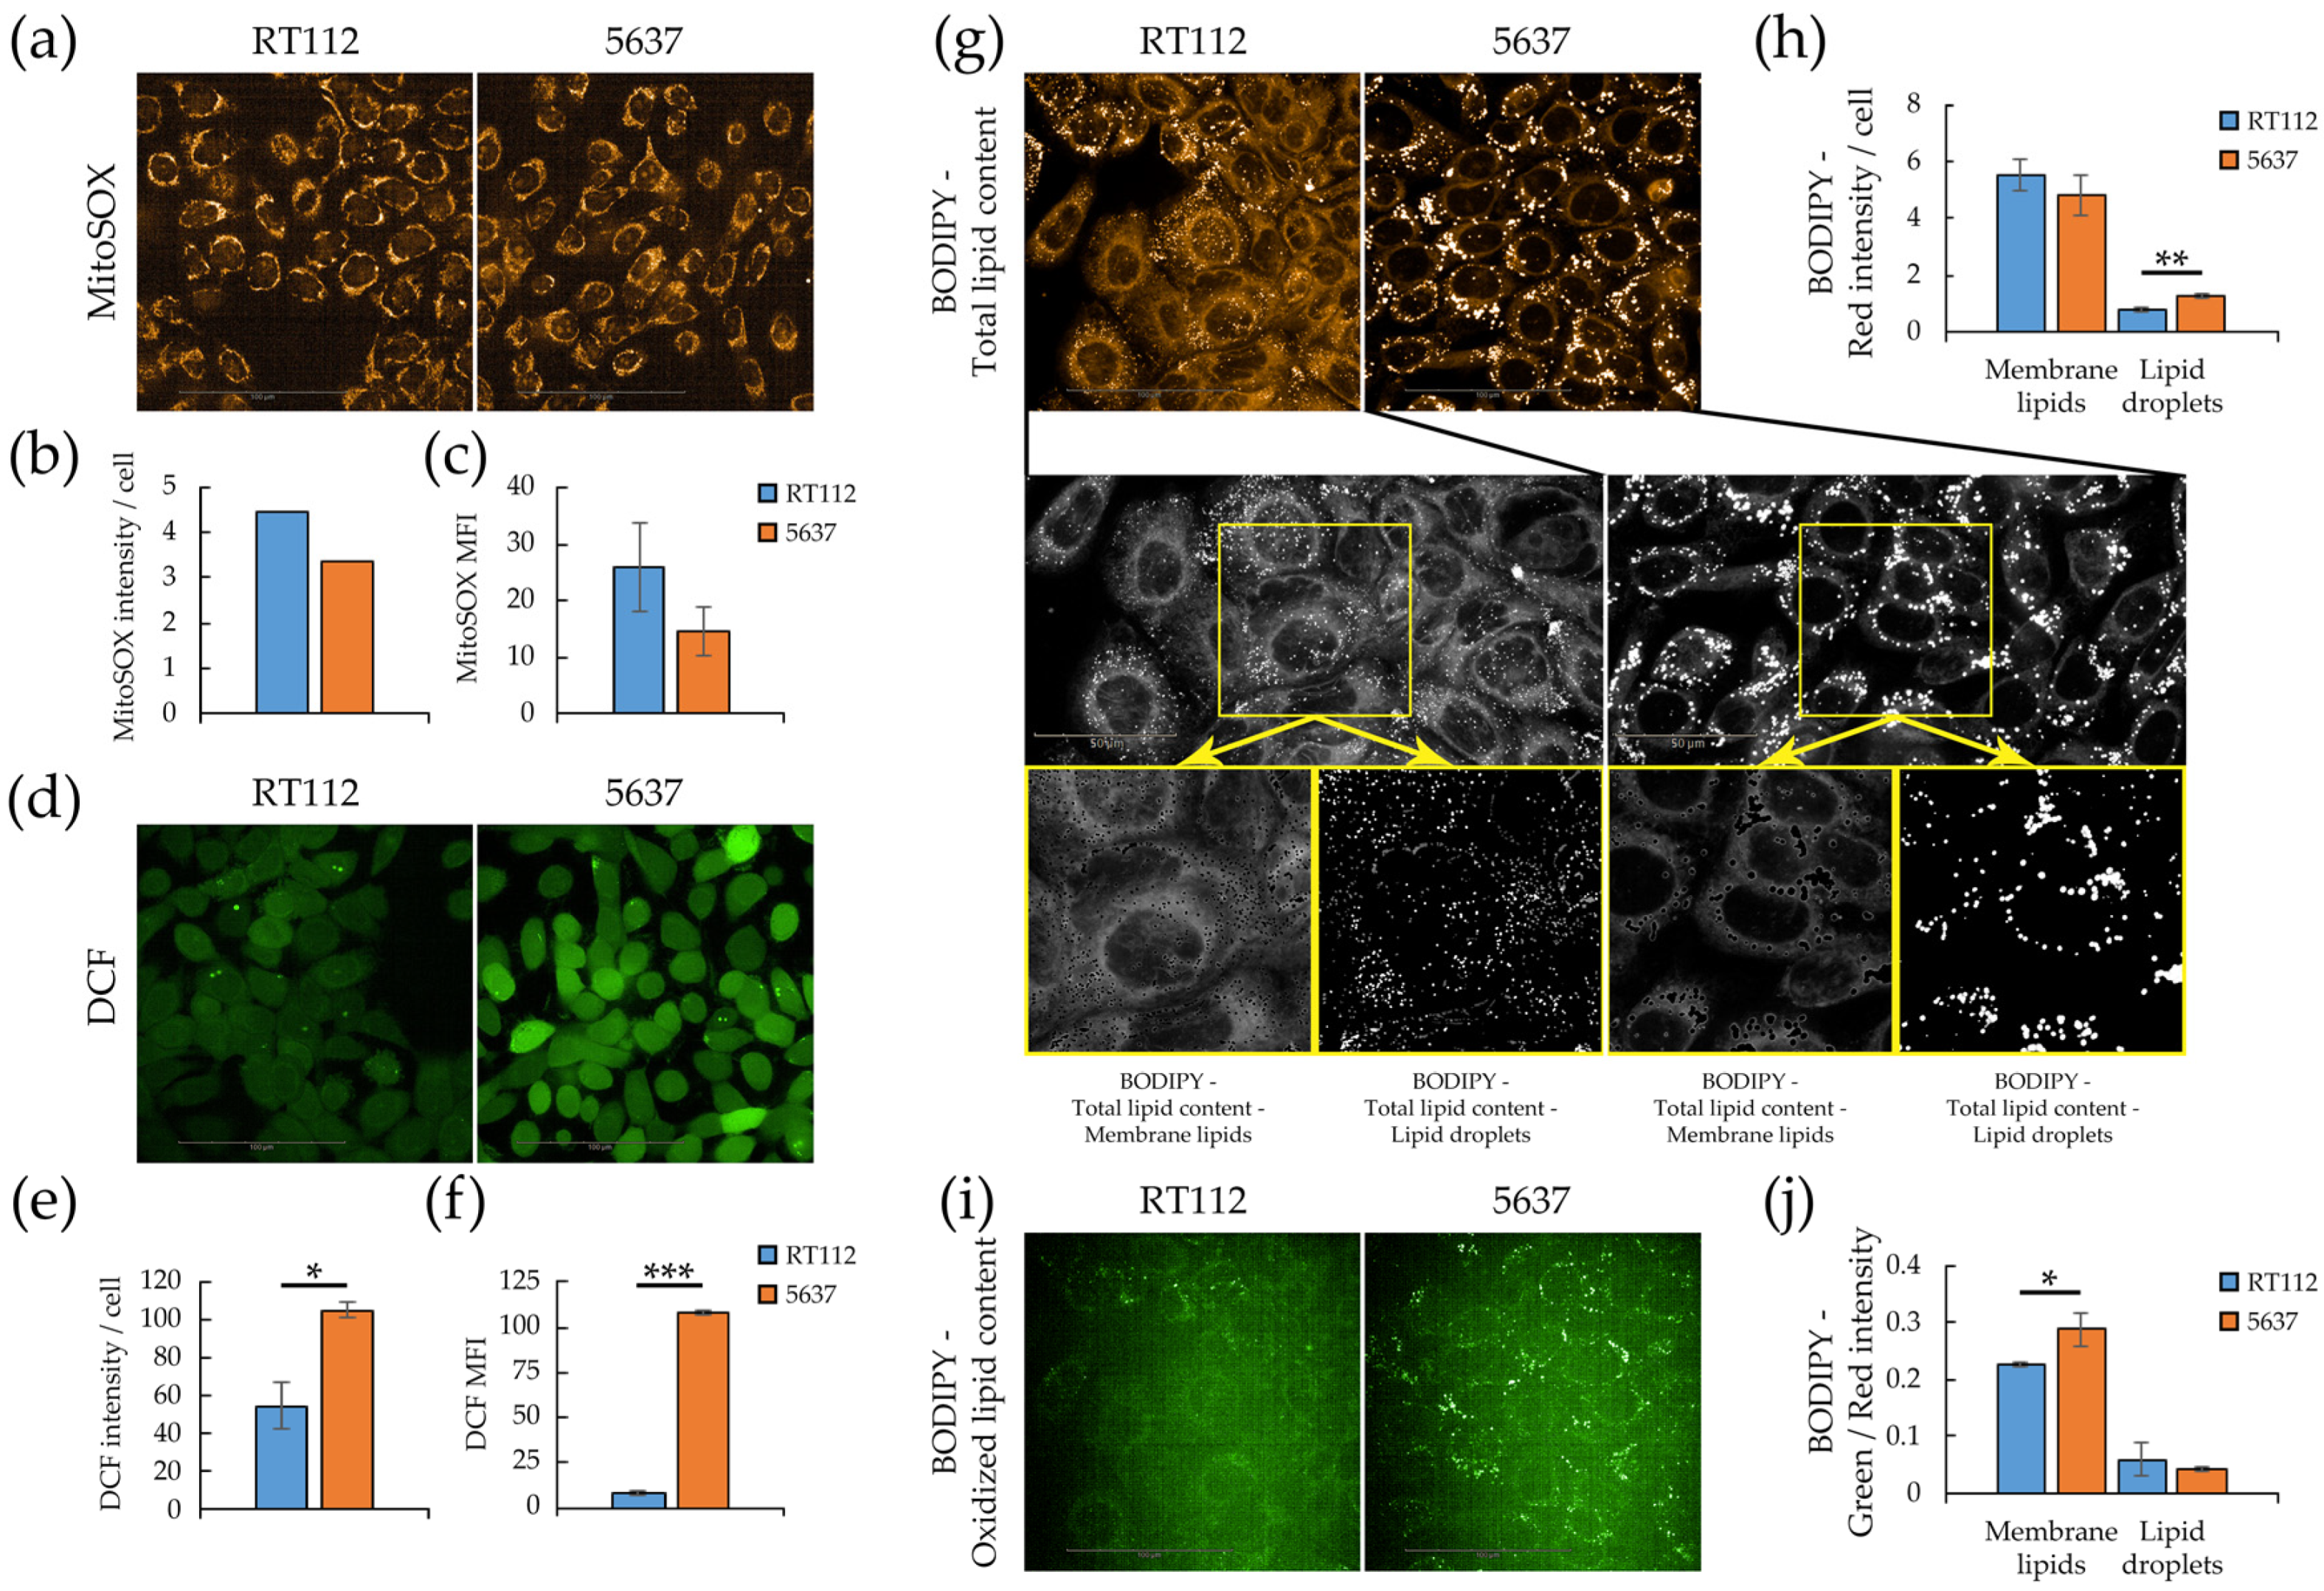
3.3. Redox Homeostasis in RT112 and 5637 Cell Lines
3.4. Metabolic Plasticity in RT112 and 5637 Cell Lines
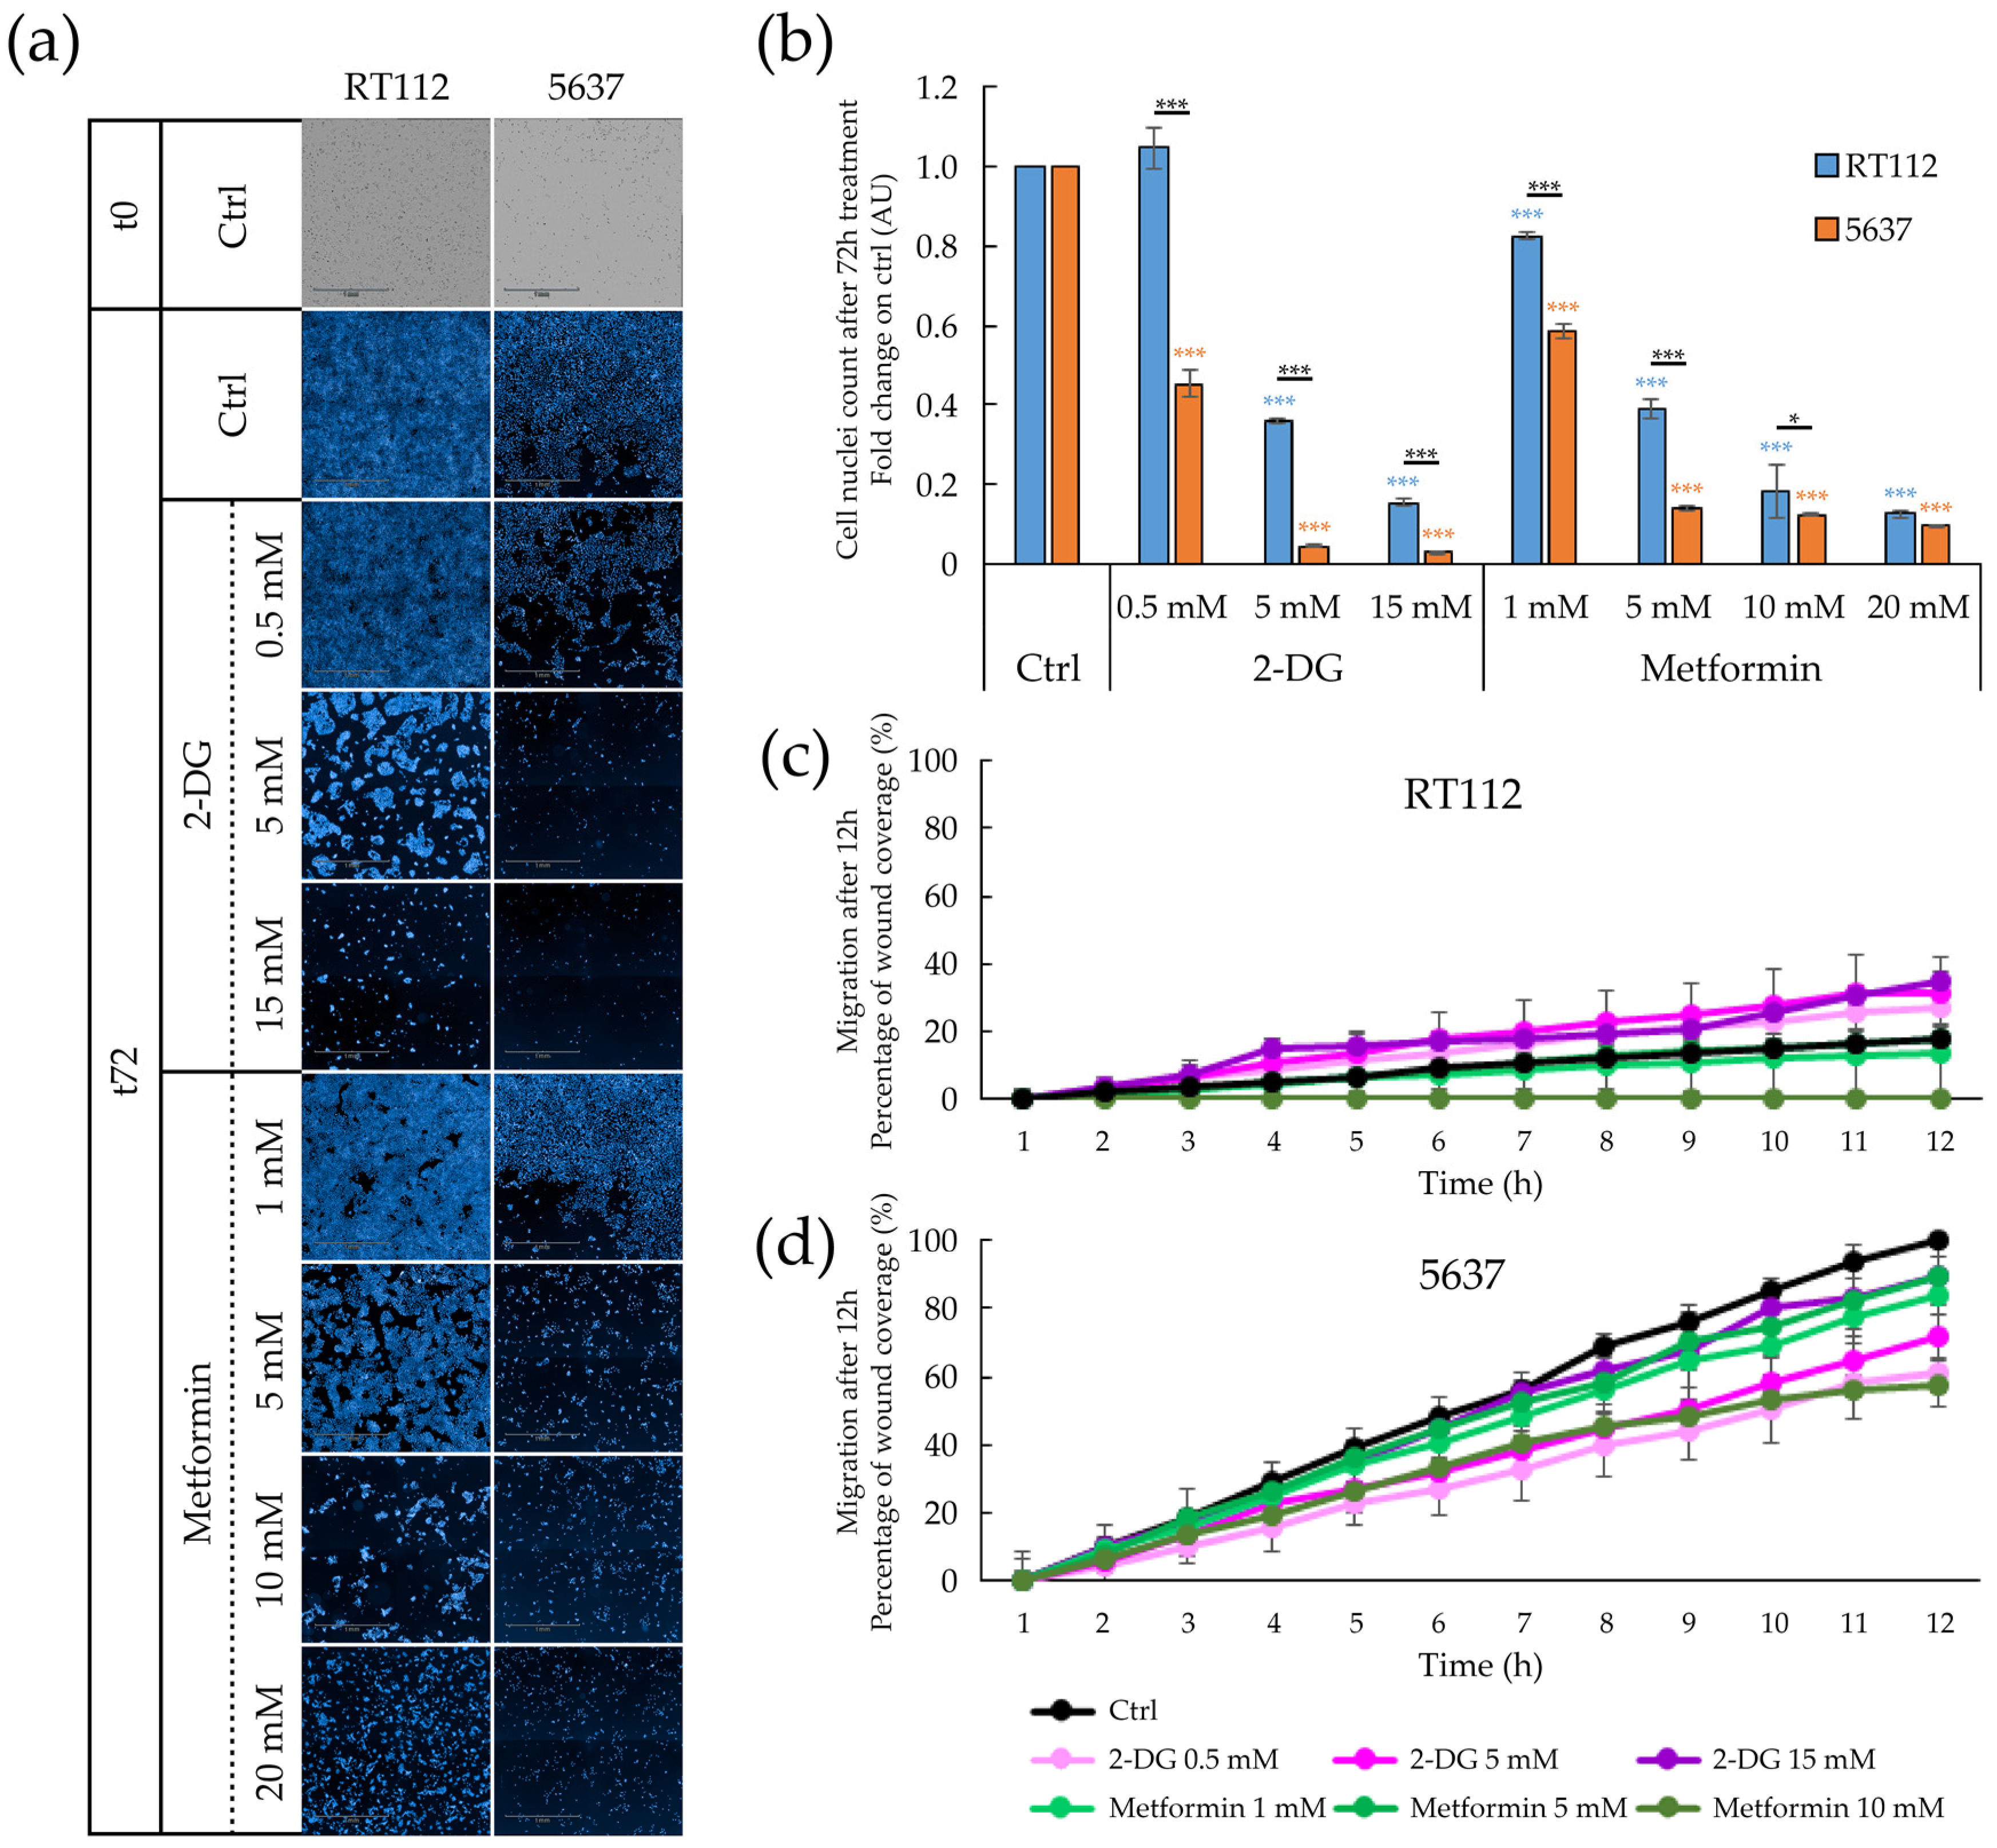
3.5. Targeting Metabolism in RT112 and 5637 Cell Lines
4. Discussion
5. Conclusions
Supplementary Materials
Author Contributions
Funding
Acknowledgments
Conflicts of Interest
References
- Yeung, C.; Dinh, T.; Lee, J. The Health Economics of Bladder Cancer: An Updated Review of the Published Literature. Pharm. Econ. 2014, 32, 1093–1104. [Google Scholar] [CrossRef] [PubMed]
- Babjuk, M.; Böhle, A.; Burger, M.; Capoun, O.; Cohen, D.; Compérat, E.; Hernández, V.; Kaasinen, E.; Palou, J.; Rouprêt, M.; et al. EAU Guidelines on Non–Muscle-invasive Urothelial Carcinoma of the Bladder: Update 2016. Eur. Urol. 2017, 71, 447–461. [Google Scholar] [CrossRef] [PubMed]
- Witjes, F.; Lebret, T.; Compérat, E.; Cowan, N.C.; De Santis, M.; Bruins, H.M.; Hernández, V.; Espinós, E.L.; Dunn, J.; Rouanne, M.; et al. Updated 2016 EAU Guidelines on Muscle-invasive and Metastatic Bladder Cancer. Eur. Urol. 2017, 71, 462–475. [Google Scholar] [CrossRef]
- Compérat, E.M.; Burger, M.; Gontero, P.; Mostafid, H.; Palou, J.; Rouprêt, M.; Van Rhijn, B.W.; Shariat, S.F.; Sylvester, R.J.; Zigeuner, R.; et al. Grading of Urothelial Carcinoma and The New “World Health Organisation Classification of Tumours of the Urinary System and Male Genital Organs 2016”. Eur. Urol. Focus 2019, 5, 457–466. [Google Scholar] [CrossRef]
- Cheng, L.; Neumann, R.M.; Nehra, A.; Spotts, B.E.; Weaver, A.L.; Bostwick, D.G. Cancer heterogeneity and its biologic implications in the grading of urothelial carcinoma. Cancer 2000, 88, 1663–1670. [Google Scholar] [CrossRef]
- Downes, M.R.; Weening, B.; Van Rhijn, B.W.G.; Have, C.L.; Treurniet, K.M.; Van Der Kwast, T.H. Analysis of papillary urothelial carcinomas of the bladder with grade heterogeneity: Supportive evidence for an early role ofCDKN2Adeletions in theFGFR3pathway. Histopathology 2016, 70, 281–289. [Google Scholar] [CrossRef] [PubMed]
- Hanahan, D.; Weinberg, R.A. Hallmarks of cancer: The next generation. Cell 2011, 144, 646–674. [Google Scholar] [CrossRef]
- Warburg, O. On the Origin of Cancer Cells. Science 1956, 123, 309–314. [Google Scholar] [CrossRef]
- DeBerardinis, R.J.; Chandel, N.S. Fundamentals of cancer metabolism. Sci. Adv. 2016, 2, e1600200. [Google Scholar] [CrossRef]
- Zhu, J.; Thompson, C.B. Metabolic regulation of cell growth and proliferation. Nat. Rev. Mol. Cell Biol. 2019, 20, 436–450. [Google Scholar] [CrossRef]
- DeBerardinis, R.J.; Chandel, N.S. We need to talk about the Warburg effect. Nat. Metab. 2020, 2, 127–129. [Google Scholar] [CrossRef] [PubMed]
- Wang, T.; Marquardt, C.; Foker, J. Aerobic glycolysis during lymphocyte proliferation. Nat. Cell Biol. 1976, 261, 702–705. [Google Scholar] [CrossRef] [PubMed]
- Bauer, D.E.; Harris, M.H.; Plas, D.R.; Lum, J.J.; Hammerman, P.S.; Rathmell, J.C.; Riley, J.L.; Thompson, C.B. Cytokine stimulation of aerobic glycolysis in hematopoietic cells exceeds proliferative demand. FASEB J. 2004, 18, 1303–1305. [Google Scholar] [CrossRef] [PubMed]
- Peek, C.B.; Levine, D.C.; Cedernaes, J.; Taguchi, A.; Kobayashi, Y.; Tsai, S.J.; Bonar, N.A.; McNulty, M.R.; Ramsey, K.M.; Bass, J. Circadian Clock Interaction with HIF1α Mediates Oxygenic Metabolism and Anaerobic Glycolysis in Skeletal Muscle. Cell Metab. 2017, 25, 86–92. [Google Scholar] [CrossRef]
- Chiaradonna, F.; Sacco, E.; Manzoni, R.; Giorgio, M.; Vanoni, M.; Alberghina, L. Ras-dependent carbon metabolism and transformation in mouse fibroblasts. Oncogene 2006, 25, 5391–5404. [Google Scholar] [CrossRef]
- Ying, H.; Kimmelman, A.C.; Lyssiotis, C.A.; Hua, S.; Chu, G.C.; Fletcher-Sananikone, E.; Locasale, J.W.; Son, J.; Zhang, H.; Coloff, J.L.; et al. Oncogenic Kras Maintains Pancreatic Tumors through Regulation of Anabolic Glucose Metabolism. Cell 2012, 149, 656–670. [Google Scholar] [CrossRef]
- Damiani, C.; Colombo, R.; Gaglio, D.; Mastroianni, F.; Pescini, D.; Westerhoff, H.V.; Mauri, G.; Vanoni, M.; Alberghina, L. A metabolic core model elucidates how enhanced utilization of glucose and glutamine, with enhanced glutamine-dependent lactate production, promotes cancer cell growth: The WarburQ effect. PLoS Comput. Biol. 2017, 13, e1005758. [Google Scholar] [CrossRef]
- Pupo, E.; Avanzato, D.; Middonti, E.; Bussolino, F.; Lanzetti, L. KRAS-Driven Metabolic Rewiring Reveals Novel Actionable Targets in Cancer. Front. Oncol. 2019, 9, 848. [Google Scholar] [CrossRef]
- Matoba, S.; Kang, J.-G.; Patino, W.D.; Wragg, A.; Boehm, M.; Gavrilova, O.; Hurley, P.J.; Bunz, F.; Hwang, P.M. p53 Regulates Mitochondrial Respiration. Science 2006, 312, 1650–1653. [Google Scholar] [CrossRef]
- Lago, C.U.; Sung, H.J.; Ma, W.; Wang, P.Y.; Hwang, P.M. P53, aerobic metabolism, and cancer. Antioxid. Redox Signal. 2011, 15, 1739–1748. [Google Scholar] [CrossRef]
- Hoxhaj, G.; Manning, B.D. The PI3K–AKT network at the interface of oncogenic signalling and cancer metabolism. Nat. Rev. Cancer 2019, 20, 74–88. [Google Scholar] [CrossRef] [PubMed]
- Sciacovelli, M.; Frezza, C. Oncometabolites: Unconventional triggers of oncogenic signalling cascades. Free Radic. Biol. Med. 2016, 100, 175–181. [Google Scholar] [CrossRef] [PubMed]
- Tommasini-Ghelfi, S.; Murnan, K.; Kouri, F.M.; Mahajan, A.S.; May, J.L.; Stegh, A.H. Cancer-associated mutation and beyond: The emerging biology of isocitrate dehydrogenases in human disease. Sci. Adv. 2019, 5, eaaw4543. [Google Scholar] [CrossRef] [PubMed]
- Dang, C.V.; Lewis, B.C.; Dolde, C.; Dang, G.; Shim, H. Oncogenes in tumor metabolism, tumorigenesis, and apoptosis. J. Bioenerg. Biomembr. 1997, 29, 345–354. [Google Scholar] [CrossRef]
- DeBerardinis, R.J.; Mancuso, A.; Daikhin, E.; Nissim, I.; Yudkoff, M.; Wehrli, S.; Thompson, C.B. Beyond aerobic glycolysis: Transformed cells can engage in glutamine metabolism that exceeds the requirement for protein and nucleotide synthesis. Proc. Natl. Acad. Sci. USA 2007, 104, 19345–19350. [Google Scholar] [CrossRef]
- Gaglio, D.; Metallo, C.M.; A Gameiro, P.; Hiller, K.; Danna, L.S.; Balestrieri, C.; Alberghina, L.; Stephanopoulos, G.; Chiaradonna, F. Oncogenic K-Ras decouples glucose and glutamine metabolism to support cancer cell growth. Mol. Syst. Biol. 2011, 7, 523. [Google Scholar] [CrossRef]
- Son, J.; Lyssiotis, C.A.; Ying, H.; Wang, X.; Hua, S.; Ligorio, M.; Perera, R.M.; Ferrone, C.R.; Mullarky, E.; Shyh-Chang, N.; et al. Glutamine supports pancreatic cancer growth through a KRAS-regulated metabolic pathway. Nat. Cell Biol. 2013, 496, 101–105. [Google Scholar] [CrossRef]
- Rashkovan, M.; Ferrando, A. Metabolic dependencies and vulnerabilities in leukemia. Genes Dev. 2019, 33, 1460–1474. [Google Scholar] [CrossRef]
- Chajès, V.; Cambot, M.; Moreau, K.; Lenoir, G.M.; Joulin, V. Acetyl-CoA Carboxylase α Is Essential to Breast Cancer Cell Survival. Cancer Res. 2006, 66, 5287–5294. [Google Scholar] [CrossRef]
- Wang, Z.; Liu, F.; Fan, N.; Zhou, C.; Li, D.; MacVicar, T.; Dong, Q.; Bruns, C.J.; Zhao, Y. Targeting Glutaminolysis: New Perspectives to Understand Cancer Development and Novel Strategies for Potential Target Therapies. Front. Oncol. 2020, 10, 589508. [Google Scholar] [CrossRef]
- Gaglio, D.; Soldati, C.; Vanoni, M.; Alberghina, L.; Chiaradonna, F. Glutamine Deprivation Induces Abortive S-Phase Rescued by Deoxyribonucleotides in K-Ras Transformed Fibroblasts. PLoS ONE 2009, 4, e4715. [Google Scholar] [CrossRef] [PubMed]
- Massari, F.; Ciccarese, C.; Santoni, M.; Iacovelli, R.; Mazzucchelli, R.; Piva, F.; Scarpelli, M.; Berardi, R.; Tortora, G.; Lopez-Beltran, A.; et al. Metabolic phenotype of bladder cancer. Cancer Treat. Rev. 2016, 45, 46–57. [Google Scholar] [CrossRef] [PubMed]
- Petrella, G.; Ciufolini, G.; Vago, R.; Cicero, D.O. The Interplay between Oxidative Phosphorylation and Glycolysis as a Potential Marker of Bladder Cancer Progression. Int. J. Mol. Sci. 2020, 21, 8107. [Google Scholar] [CrossRef] [PubMed]
- Loras, A.; Trassierra, M.; Sanjuan-Herráez, D.; Martínez-Bisbal, M.C.; Castell, J.V.; Quintás, G.; Ruiz-Cerdá, J.L. Bladder cancer recurrence surveillance by urine metabolomics analysis. Sci. Rep. 2018, 8, 1–10. [Google Scholar] [CrossRef] [PubMed]
- Sborov, D.W.; Haverkos, B.M.; Harris, P.J. Investigational cancer drugs targeting cell metabolism in clinical development. Expert Opin. Investig. Drugs 2015, 24, 79–94. [Google Scholar] [CrossRef] [PubMed]
- A Pierotti, M.; Berrino, F.; Gariboldi, M.B.; Melani, C.; Mogavero, A.; Negri, T.; Pasanisi, P.; Pilotti, S. Targeting metabolism for cancer treatment and prevention: Metformin, an old drug with multi-faceted effects. Oncogene 2013, 32, 1475–1487. [Google Scholar] [CrossRef]
- Luengo, A.; Gui, D.Y.; Vander Heiden, M.G. Targeting Metabolism for Cancer Therapy. Cell Chem. Biol. 2017, 24, 1161–1180. [Google Scholar] [CrossRef]
- De Sanctis, G.; Spinelli, M.; Vanoni, M.; Sacco, E. K-Ras Activation Induces Differential Sensitivity to Sulfur Amino Acid Limitation and Deprivation and to Oxidative and Anti-Oxidative Stress in Mouse Fibroblasts. PLoS ONE 2016, 11, e0163790. [Google Scholar] [CrossRef]
- Baracca, A.; Chiaradonna, F.; Sgarbi, G.; Solaini, G.; Alberghina, L.; Lenaz, G. Mitochondrial Complex I decrease is responsible for bioenergetic dysfunction in K-ras transformed cells. Biochim. Biophys. Acta (BBA) Bioenerg. 2010, 1797, 314–323. [Google Scholar] [CrossRef]
- Weinberg, F.; Hamanaka, R.; Wheaton, W.W.; Weinberg, S.; Joseph, J.; Lopez, M.; Kalyanaraman, B.; Mutlu, G.M.; Budinger, G.R.S.; Chandel, N.S. Mitochondrial metabolism and ROS generation are essential for Kras-mediated tumorigenicity. Proc. Natl. Acad. Sci. USA 2010, 107, 8788–8793. [Google Scholar] [CrossRef]
- Earl, J.; Rico, D.; De Pau, E.C.S.; Rodríguez-Santiago, B.; Méndez-Pertuz, M.; Auer, H.; Gómez-López, G.; Grossman, H.B.; Pisano, D.G.; Schulz, W.A.; et al. The UBC-40 Urothelial Bladder Cancer cell line index: A genomic resource for functional studies. BMC Genom. 2015, 16, 1–16. [Google Scholar] [CrossRef]
- Sjödahl, G.; Eriksson, P.; Patschan, O.; Marzouka, N.; Jakobsson, L.; Bernardo, C.; Lövgren, K.; Chebil, G.; Zwarthoff, E.; Liedberg, F.; et al. Molecular changes during progression from nonmuscle invasive to advanced urothelial carcinoma. Int. J. Cancer 2019, 146, 2636–2647. [Google Scholar] [CrossRef] [PubMed]
- Marshall, C.J.; Franks, L.M.; Carbonell, A.W. Markers of Neoplastic Transformation in Epithelial Cell Lines Derived From Human Carcinomas. J. Natl. Cancer Inst. 1977, 58, 1743–1751. [Google Scholar] [CrossRef] [PubMed]
- Fogh, J.; Fogh, J.M.; Orfeo, T. One Hundred and Twenty-Seven Cultured Human Tumor Cell Lines Producing Tumors in Nude Mice23. J. Natl. Cancer Inst. 1977, 59, 221–226. [Google Scholar] [CrossRef] [PubMed]
- Chung, B.-M.; Rotty, J.D.; A Coulombe, P. Networking galore: Intermediate filaments and cell migration. Curr. Opin. Cell Biol. 2013, 25, 600–612. [Google Scholar] [CrossRef] [PubMed]
- Strouhalova, K.; Přechová, M.; Gandalovičová, A.; Brábek, J.; Gregor, M.; Rösel, D. Vimentin Intermediate Filaments as Potential Target for Cancer Treatment. Cancers 2020, 12, 184. [Google Scholar] [CrossRef]
- Webb, D.J.; Donais, K.; Whitmore, L.A.; Thomas, S.M.; Turner, C.E.; Parsons, J.T.; Horwitz, A.F. FAK–Src signalling through paxillin, ERK and MLCK regulates adhesion disassembly. Nat. Cell Biol. 2004, 6, 154–161. [Google Scholar] [CrossRef]
- Thomas, S.; Overdevest, J.B.; Nitz, M.D.; Williams, P.D.; Owens, C.R.; Sanchez-Carbayo, M.; Frierson, H.F.; Schwartz, M.A.; Theodorescu, D. Src and Caveolin-1 Reciprocally Regulate Metastasis via a Common Downstream Signaling Pathway in Bladder Cancer. Cancer Res. 2010, 71, 832–841. [Google Scholar] [CrossRef]
- Zhang, X.; Zhao, W.; Li, Y. Stemness-related markers in cancer. Cancer Transl. Med. 2017, 3, 87–95. [Google Scholar] [CrossRef]
- Reya, T.; Morrison, S.J.; Clarke, M.F.; Weissman, I.L. Stem cells, cancer, and cancer stem cells. Nature 2001, 414, 105–111. [Google Scholar] [CrossRef]
- Toledo-Guzmán, M.E.; Hernández, M.I.; Gómez-Gallegos, Á.A.; Ortiz-Sánchez, E. ALDH as a Stem Cell Marker in Solid Tumors. Curr. Stem Cell Res. Ther. 2019, 14. [Google Scholar] [CrossRef] [PubMed]
- Rodriguez-Torres, M.; Allan, A.L. Aldehyde dehydrogenase as a marker and functional mediator of metastasis in solid tumors. Clin. Exp. Metastasis 2016, 33, 97–113. [Google Scholar] [CrossRef] [PubMed]
- Farid, R.M.; Sammour, S.A.E.-M.; El-Din, Z.A.E.-K.S.; Salman, M.I.; Omran, T.I. Expression of CD133 and CD24 and their different phenotypes in urinary bladder carcinoma. Cancer Manag. Res. 2019, 11, 4677–4690. [Google Scholar] [CrossRef] [PubMed]
- Shmelkov, S.V.; Butler, J.M.; Hooper, A.T.; Hormigo, A.; Kushner, J.; Milde, T.; Clair, R.S.; Baljevic, M.; White, I.; Jin, D.K.; et al. CD133 expression is not restricted to stem cells, and both CD133+ and CD133– metastatic colon cancer cells initiate tumors. J. Clin. Investig. 2008, 118, 2111–2120. [Google Scholar] [CrossRef]
- Höfner, T.; Macher-Goeppinger, S.; Klein, C.; Schillert, A.; Eisen, C.; Wagner, S.; Rigo-Watermeier, T.; Baccelli, I.; Vogel, V.; Trumpp, A.; et al. Expression and prognostic significance of cancer stem cell markers CD24 and CD44 in urothelial bladder cancer xenografts and patients undergoing radical cystectomy. Urol. Oncol. Semin. Orig. Investig. 2014, 32, 678–686. [Google Scholar] [CrossRef]
- Chan, K.S.; Espinosa, I.; Chao, M.; Wong, D.; Ailles, L.; Diehn, M.; Gill, H.; Presti, J.; Chang, H.Y.; Van De Rijn, M.; et al. Identification, molecular characterization, clinical prognosis, and therapeutic targeting of human bladder tumor-initiating cells. Proc. Natl. Acad. Sci. USA 2009, 106, 14016–14021. [Google Scholar] [CrossRef]
- Wen, Y.; Hou, Y.; Huang, Z.; Cai, J.; Wang, Z. SOX2 is required to maintain cancer stem cells in ovarian cancer. Cancer Sci. 2017, 108, 719–731. [Google Scholar] [CrossRef]
- Pavlova, N.N.; Thompson, C.B. The Emerging Hallmarks of Cancer Metabolism. Cell Metab. 2016, 23, 27–47. [Google Scholar] [CrossRef]
- Ferrick, D.A.; Neilson, A.; Beeson, C. Advances in measuring cellular bioenergetics using extracellular flux. Drug Discov. Today 2008, 13, 268–274. [Google Scholar] [CrossRef]
- Dombrauckas, J.D.; Santarsiero, B.D.; Mesecar, A.D. Structural Basis for Tumor Pyruvate Kinase M2 Allosteric Regulation and Catalysis. Biochemistry 2005, 44, 9417–9429. [Google Scholar] [CrossRef]
- Yuan, M.; McNae, I.; Chen, Y.; Blackburn, E.A.; Wear, M.A.; Michels, P.A.; Gilmore, L.; Hupp, T.; Walkinshaw, M.D. An allostatic mechanism for M2 pyruvate kinase as an amino-acid sensor. Biochem. J. 2018, 475, 1821–1837. [Google Scholar] [CrossRef] [PubMed]
- Poot, M.; Zhang, Y.Z.; Krämer, J.A.; Wells, K.S.; Jones, L.J.; Hanzel, D.K.; Lugade, A.G.; Singer, V.L.; Haugland, R.P. Analysis of mitochondrial morphology and function with novel fixable fluorescent stains. J. Histochem. Cytochem. 1996, 44, 1363–1372. [Google Scholar] [CrossRef] [PubMed]
- Mitra, K.; Lippincott-Schwartz, J. Analysis of Mitochondrial Dynamics and Functions Using Imaging Approaches. Curr. Protoc. Cell Biol. 2010, 46, 4–25. [Google Scholar] [CrossRef] [PubMed]
- Iannetti, E.F.; Prigione, A.; Smeitink, J.A.M.; Koopman, W.J.H.; Beyrath, J.; Renkema, H. Live-Imaging Readouts and Cell Models for Phenotypic Profiling of Mitochondrial Function. Front. Genet. 2019, 10, 131. [Google Scholar] [CrossRef] [PubMed]
- Halliwell, B.; Chirico, S. Lipid peroxidation: Its mechanism, measurement, and significance. Am. J. Clin. Nutr. 1993, 57, 715S–725S. [Google Scholar] [CrossRef] [PubMed]
- Pap, E.; Drummen, G.; Winter, V.; Kooij, T.; Rijken, P.; Wirtz, K.; Kamp, J.O.D.; Hage, W.; Post, J. Ratio-fluorescence microscopy of lipid oxidation in living cells using C11-BODIPY581/591. FEBS Lett. 1999, 453, 278–282. [Google Scholar] [CrossRef]
- Carracedo, A.; Cantley, L.C.; Pandolfi, P.P. Cancer metabolism: Fatty acid oxidation in the limelight. Nat. Rev. Cancer 2013, 13, 227–232. [Google Scholar] [CrossRef]
- Ceccarelli, S.M.; Chomienne, O.; Gubler, M.; Arduini, A. Carnitine Palmitoyltransferase (CPT) Modulators: A Medicinal Chemistry Perspective on 35 Years of Research. J. Med. Chem. 2011, 54, 3109–3152. [Google Scholar] [CrossRef]
- El-Mir, M.-Y.; Nogueira, V.; Fontaine, E.; Avéret, N.; Rigoulet, M.; Leverve, X. Dimethylbiguanide Inhibits Cell Respiration via an Indirect Effect Targeted on the Respiratory Chain Complex I. J. Biol. Chem. 2000, 275, 223–228. [Google Scholar] [CrossRef]
- Owen, M.R.; Doran, E.; Halestrap, A.P. Evidence that metformin exerts its anti-diabetic effects through inhibition of complex 1 of the mitochondrial respiratory chain. Biochem. J. 2000, 348, 607–614. [Google Scholar] [CrossRef]
- Vial, G.; Detaille, D.; Guigas, B. Role of Mitochondria in the Mechanism(s) of Action of Metformin. Front. Endocrinol. 2019, 10, 294. [Google Scholar] [CrossRef] [PubMed]
- Ishiguro, T.; Ohata, H.; Sato, A.; Yamawaki, K.; Enomoto, T.; Okamoto, K. Tumor-derived spheroids: Relevance to cancer stem cells and clinical applications. Cancer Sci. 2017, 108, 283–289. [Google Scholar] [CrossRef] [PubMed]
- Mehta, P.; Novak, C.; Raghavan, S.; Ward, M.; Mehta, G. Self-Renewal and CSCs In Vitro Enrichment: Growth as Floating Spheres. In Bioinformatics in MicroRNA Research; Springer Science and Business Media LLC: Berlin, Germany, 2018; Volume 1692, pp. 61–75. [Google Scholar]
- Sancho, P.; Barneda, D.; Heeschen, C. Hallmarks of cancer stem cell metabolism. Br. J. Cancer 2016, 114, 1305–1312. [Google Scholar] [CrossRef] [PubMed]
- Sotgia, F.; Fiorillo, M.; Lisanti, M.P. Hallmarks of the cancer cell of origin: Comparisons with “energetic” cancer stem cells (e-CSCs). Aging 2019, 11, 1065–1068. [Google Scholar] [CrossRef]
- Fiorillo, M.; Lamb, R.; Tanowitz, H.B.; Mutti, L.; Krstic-Demonacos, M.; Cappello, A.R.; Martinez-Outschoorn, U.E.; Sotgia, F.; Lisanti, M.P. Repurposing atovaquone: Targeting mitochondrial complex III and OXPHOS to eradicate cancer stem cells. Oncotarget 2016, 7, 34084–34099. [Google Scholar] [CrossRef]
- Denise, C.; Paoli, P.; Calvani, M.; Taddei, M.L.; Giannoni, E.; Kopetz, S.; Kazmi, S.M.A.; Pia, M.M.; Pettazzoni, P.; Sacco, E.; et al. 5-Fluorouracil resistant colon cancer cells are addicted to OXPHOS to survive and enhance stem-like traits. Oncotarget 2015, 6, 41706–41721. [Google Scholar] [CrossRef]
- Ferlay, J.; Steliarova-Foucher, E.; Lortet-Tieulent, J.; Rosso, S.; Coebergh, J.; Comber, H.; Forman, D.; Bray, F. Cancer incidence and mortality patterns in Europe: Estimates for 40 countries in 2012. Eur. J. Cancer 2013, 49, 1374–1403. [Google Scholar] [CrossRef]
- Nielsen, J. Systems Biology of Metabolism: A Driver for Developing Personalized and Precision Medicine. Cell Metab. 2017, 25, 572–579. [Google Scholar] [CrossRef]
- Damiani, C.; Gaglio, D.; Sacco, E.; Alberghina, L.; Vanoni, M. Systems metabolomics: From metabolomic snapshots to design principles. Curr. Opin. Biotechnol. 2020, 63, 190–199. [Google Scholar] [CrossRef]
- Tan, G.; Wang, H.; Yuan, J.; Qin, W.; Dong, X.; Wu, H.; Meng, P. Three serum metabolite signatures for diagnosing low-grade and high-grade bladder cancer. Sci. Rep. 2017, 7, srep46176. [Google Scholar] [CrossRef]
- Mpanga, A.Y.; Siluk, D.; Jacyna, J.; Szerkus, O.; Wawrzyniak, R.; Markuszewski, M.; Kaliszan, R.; Markuszewski, M.J. Targeted metabolomics in bladder cancer: From analytical methods development and validation towards application to clinical samples. Anal. Chim. Acta 2018, 1037, 188–199. [Google Scholar] [CrossRef] [PubMed]
- Zuiverloon, T.C.; De Jong, F.C.; Costello, J.C.; Theodorescu, D. Systematic Review: Characteristics and Preclinical Uses of Bladder Cancer Cell Lines. Bladder Cancer 2018, 4, 169–183. [Google Scholar] [CrossRef] [PubMed]
- Warrick, J.I.; Walter, V.; Yamashita, H.; Chung, E.; Shuman, L.; Amponsa, V.O.; Zheng, Z.; Chan, W.; Whitcomb, T.L.; Yue, F.; et al. FOXA1, GATA3 and PPARɣ Cooperate to Drive Luminal Subtype in Bladder Cancer: A Molecular Analysis of Established Human Cell Lines. Sci. Rep. 2016, 6, 38531. [Google Scholar] [CrossRef] [PubMed]
- Rebouissou, S.; Bernard-Pierrot, I.; De Reyniès, A.; Lepage, M.-L.; Krucker, C.; Chapeaublanc, E.; Hérault, A.; Kamoun, A.; Caillault, A.; Letouzé, E.; et al. EGFR as a potential therapeutic target for a subset of muscle-invasive bladder cancers presenting a basal-like phenotype. Sci. Transl. Med. 2014, 6, 244ra91. [Google Scholar] [CrossRef] [PubMed]
- Turrens, J.F. Mitochondrial formation of reactive oxygen species. J. Physiol. 2003, 552, 335–344. [Google Scholar] [CrossRef]
- Zorov, D.B.; Juhaszova, M.; Sollott, S.J. Mitochondrial Reactive Oxygen Species (ROS) and ROS-Induced ROS Release. Physiol. Rev. 2014, 94, 909–950. [Google Scholar] [CrossRef]
- Vinogradov, A.; Grivennikova, V.G. Oxidation of NADH and ROS production by respiratory complex I. Biochim. Biophys. Acta (BBA) Bioenerg. 2016, 1857, 863–871. [Google Scholar] [CrossRef]
- Bleier, L.; Dröse, S. Superoxide generation by complex III: From mechanistic rationales to functional consequences. Biochim. Biophys. Acta (BBA) Bioenerg. 2013, 1827, 1320–1331. [Google Scholar] [CrossRef]
- Barrera, G.; Pizzimenti, S.; Dianzani, M.U. Lipid peroxidation: Control of cell proliferation, cell differentiation and cell death. Mol. Asp. Med. 2008, 29, 1–8. [Google Scholar] [CrossRef]
- Barrera, G. Oxidative Stress and Lipid Peroxidation Products in Cancer Progression and Therapy. ISRN Oncol. 2012, 2012, 1–21. [Google Scholar] [CrossRef]
- Ayala, A.; Muñoz, M.F.; Argüelles, S. Lipid Peroxidation: Production, Metabolism, and Signaling Mechanisms of Malondialdehyde and 4-Hydroxy-2-Nonenal. Oxidative Med. Cell. Longev. 2014, 2014, 1–31. [Google Scholar] [CrossRef] [PubMed]
- Black, W.; Chen, Y.; Matsumoto, A.; Thompson, D.C.; Lassen, N.; Pappa, A.; Vasiliou, V. Molecular mechanisms of ALDH3A1-mediated cellular protection against 4-hydroxy-2-nonenal. Free Radic. Biol. Med. 2012, 52, 1937–1944. [Google Scholar] [CrossRef] [PubMed]
- Singh, S.; Brocker, C.; Koppaka, V.; Chen, Y.; Jackson, B.C.; Matsumoto, A.; Thompson, D.C.; Vasiliou, V. Aldehyde dehydrogenases in cellular responses to oxidative/electrophilicstress. Free Radic. Biol. Med. 2013, 56, 89–101. [Google Scholar] [CrossRef] [PubMed]
- Corbet, C.; Feron, O. Cancer cell metabolism and mitochondria: Nutrient plasticity for TCA cycle fueling. Biochim. Biophys. Acta (BBA) Bioenerg. 2017, 1868, 7–15. [Google Scholar] [CrossRef] [PubMed]
- Bentebibel, A.; Sebastián, D.; Herrero, L.; López-Viñas, E.; Serra, D.; Asins, G.; Gómez-Puertas, P.; Hegardt, F.G. Novel Effect of C75 on Carnitine Palmitoyltransferase I Activity and Palmitate Oxidation. Biochemistry 2006, 45, 4339–4350. [Google Scholar] [CrossRef] [PubMed]
- Declercq, P.E.; Falck, J.R.; Kuwajima, M.; Tyminski, H.; Foster, D.W.; McGarry, J.D. Characterization of the mitochondrial carnitine palmitoyltransferase enzyme system. I. Use of inhibitors. J. Biol. Chem. 1987, 262, 9812–9821. [Google Scholar]
- Raud, B.; Roy, D.G.; Divakaruni, A.S.; Tarasenko, T.N.; Franke, R.; Ma, E.H.; Samborska, B.; Hsieh, W.Y.; Wong, A.H.; Stüve, P.; et al. Etomoxir Actions on Regulatory and Memory T Cells Are Independent of Cpt1a-Mediated Fatty Acid Oxidation. Cell Metab. 2018, 28, 504–515.e7. [Google Scholar] [CrossRef]
- LeBleu, V.S.; O’Connell, J.T.; Herrera, K.N.G.; Wikman-Kocher, H.; Pantel, K.; Haigis, M.C.; De Carvalho, F.M.; Damascena, A.; Chinen, L.T.D.; Rocha, R.M.; et al. PGC-1α mediates mitochondrial biogenesis and oxidative phosphorylation in cancer cells to promote metastasis. Nat. Cell Biol. 2014, 16, 992–1003. [Google Scholar] [CrossRef]
- Sotgia, F.; Whitaker-Menezes, D.; Martinez-Outschoorn, U.E.; Flomenberg, N.; Birbe, R.C.; Witkiewicz, A.K.; Howell, A.; Philp, N.J.; Pestell, R.G.; Lisanti, M.P. Mitochondrial metabolism in cancer metastasis. Cell Cycle 2012, 11, 1445–1454. [Google Scholar] [CrossRef]
- Sancho, P.; Burgos-Ramos, E.; Tavera, A.; Kheir, T.B.; Jagust, P.; Schoenhals, M.; Barneda, D.; Sellers, K.; Campos-Olivas, R.; Graña, O.; et al. MYC/PGC-1α Balance Determines the Metabolic Phenotype and Plasticity of Pancreatic Cancer Stem Cells. Cell Metab. 2015, 22, 590–605. [Google Scholar] [CrossRef]
- Lagadinou, E.D.; Sach, A.; Callahan, K.; Rossi, R.M.; Neering, S.J.; Minhajuddin, M.; Ashton, J.M.; Pei, S.; Grose, V.; O’Dwyer, K.M.; et al. BCL-2 Inhibition Targets Oxidative Phosphorylation and Selectively Eradicates Quiescent Human Leukemia Stem Cells. Cell Stem Cell 2013, 12, 329–341. [Google Scholar] [CrossRef] [PubMed]
- Invrea, F.; Rovito, R.; Torchiaro, E.; Petti, C.; Isella, C.; Medico, E. Patient-derived xenografts (PDXs) as model systems for human cancer. Curr. Opin. Biotechnol. 2020, 63, 151–156. [Google Scholar] [CrossRef] [PubMed]
- Reckzeh, E.S.; Karageorgis, G.; Schwalfenberg, M.; Ceballos, J.; Nowacki, J.; Stroet, M.C.; Binici, A.; Knauer, L.; Brand, S.; Choidas, A.; et al. Inhibition of Glucose Transporters and Glutaminase Synergistically Impairs Tumor Cell Growth. Cell Chem. Biol. 2019, 26, 1214–1228.e5. [Google Scholar] [CrossRef] [PubMed]
- Gaglio, D.; Bonanomi, M.; Valtorta, S.; Bharat, R.; Ripamonti, M.; Conte, F.; Fiscon, G.; Righi, N.; Napodano, E.; Papa, F.; et al. Disruption of redox homeostasis for combinatorial drug efficacy in K-Ras tumors as revealed by metabolic connectivity profiling. Cancer Metab. 2020, 8, 1–15. [Google Scholar] [CrossRef]


Publisher’s Note: MDPI stays neutral with regard to jurisdictional claims in published maps and institutional affiliations. |
© 2020 by the authors. Licensee MDPI, Basel, Switzerland. This article is an open access article distributed under the terms and conditions of the Creative Commons Attribution (CC BY) license (http://creativecommons.org/licenses/by/4.0/).
Share and Cite
Pasquale, V.; Ducci, G.; Campioni, G.; Ventrici, A.; Assalini, C.; Busti, S.; Vanoni, M.; Vago, R.; Sacco, E. Profiling and Targeting of Energy and Redox Metabolism in Grade 2 Bladder Cancer Cells with Different Invasiveness Properties. Cells 2020, 9, 2669. https://doi.org/10.3390/cells9122669
Pasquale V, Ducci G, Campioni G, Ventrici A, Assalini C, Busti S, Vanoni M, Vago R, Sacco E. Profiling and Targeting of Energy and Redox Metabolism in Grade 2 Bladder Cancer Cells with Different Invasiveness Properties. Cells. 2020; 9(12):2669. https://doi.org/10.3390/cells9122669
Chicago/Turabian StylePasquale, Valentina, Giacomo Ducci, Gloria Campioni, Adria Ventrici, Chiara Assalini, Stefano Busti, Marco Vanoni, Riccardo Vago, and Elena Sacco. 2020. "Profiling and Targeting of Energy and Redox Metabolism in Grade 2 Bladder Cancer Cells with Different Invasiveness Properties" Cells 9, no. 12: 2669. https://doi.org/10.3390/cells9122669
APA StylePasquale, V., Ducci, G., Campioni, G., Ventrici, A., Assalini, C., Busti, S., Vanoni, M., Vago, R., & Sacco, E. (2020). Profiling and Targeting of Energy and Redox Metabolism in Grade 2 Bladder Cancer Cells with Different Invasiveness Properties. Cells, 9(12), 2669. https://doi.org/10.3390/cells9122669