Comparative Study of Senescent Th Biomarkers in Healthy Donors and Early Arthritis Patients. Analysis of VPAC Receptors and Their Influence

 , , , , , ,
  , and
, and 
Abstract
1. Introduction
2. Materials and Methods
2.1. Study Population
2.2. BMD Measurements
2.3. Isolation of CD4+ T Cells Subsets
2.4. RNA Extraction and Semiquantitative Real-Time PCR
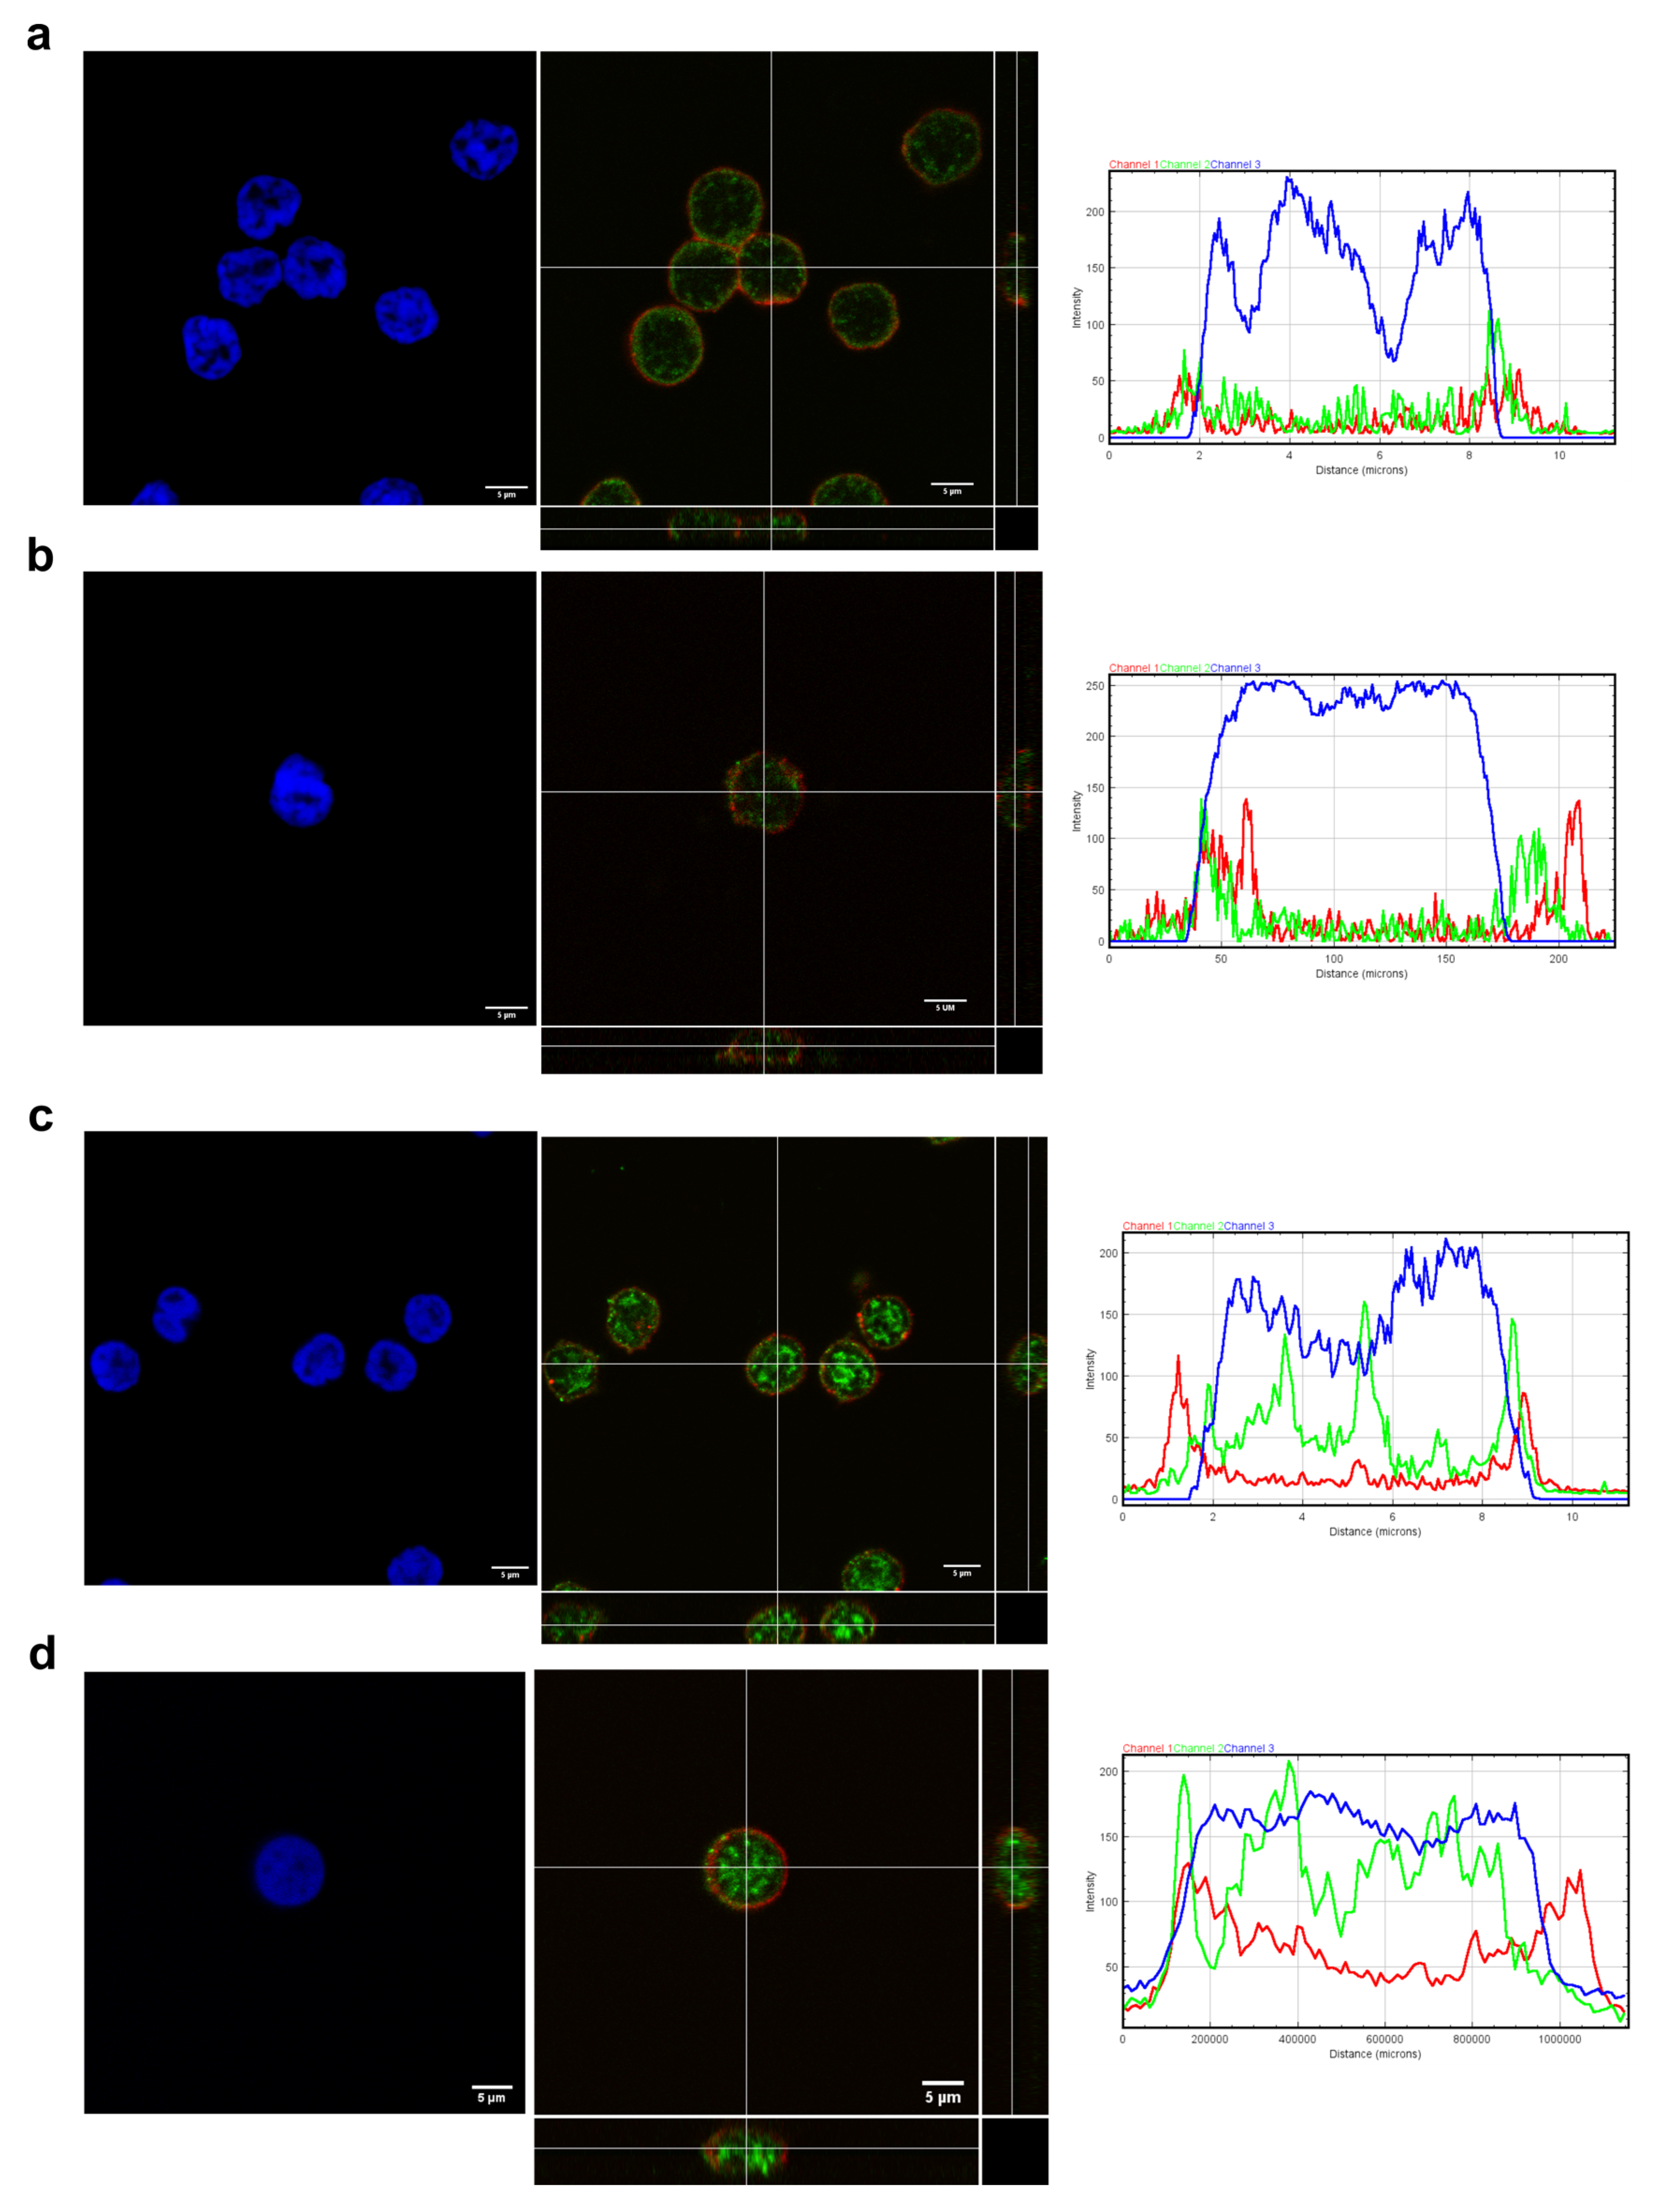
2.5. Immunocytochemistry Staining
2.6. In Vitro Expansion of CD4+CD28− T Cells
2.7. Statistical Analysis
3. Results
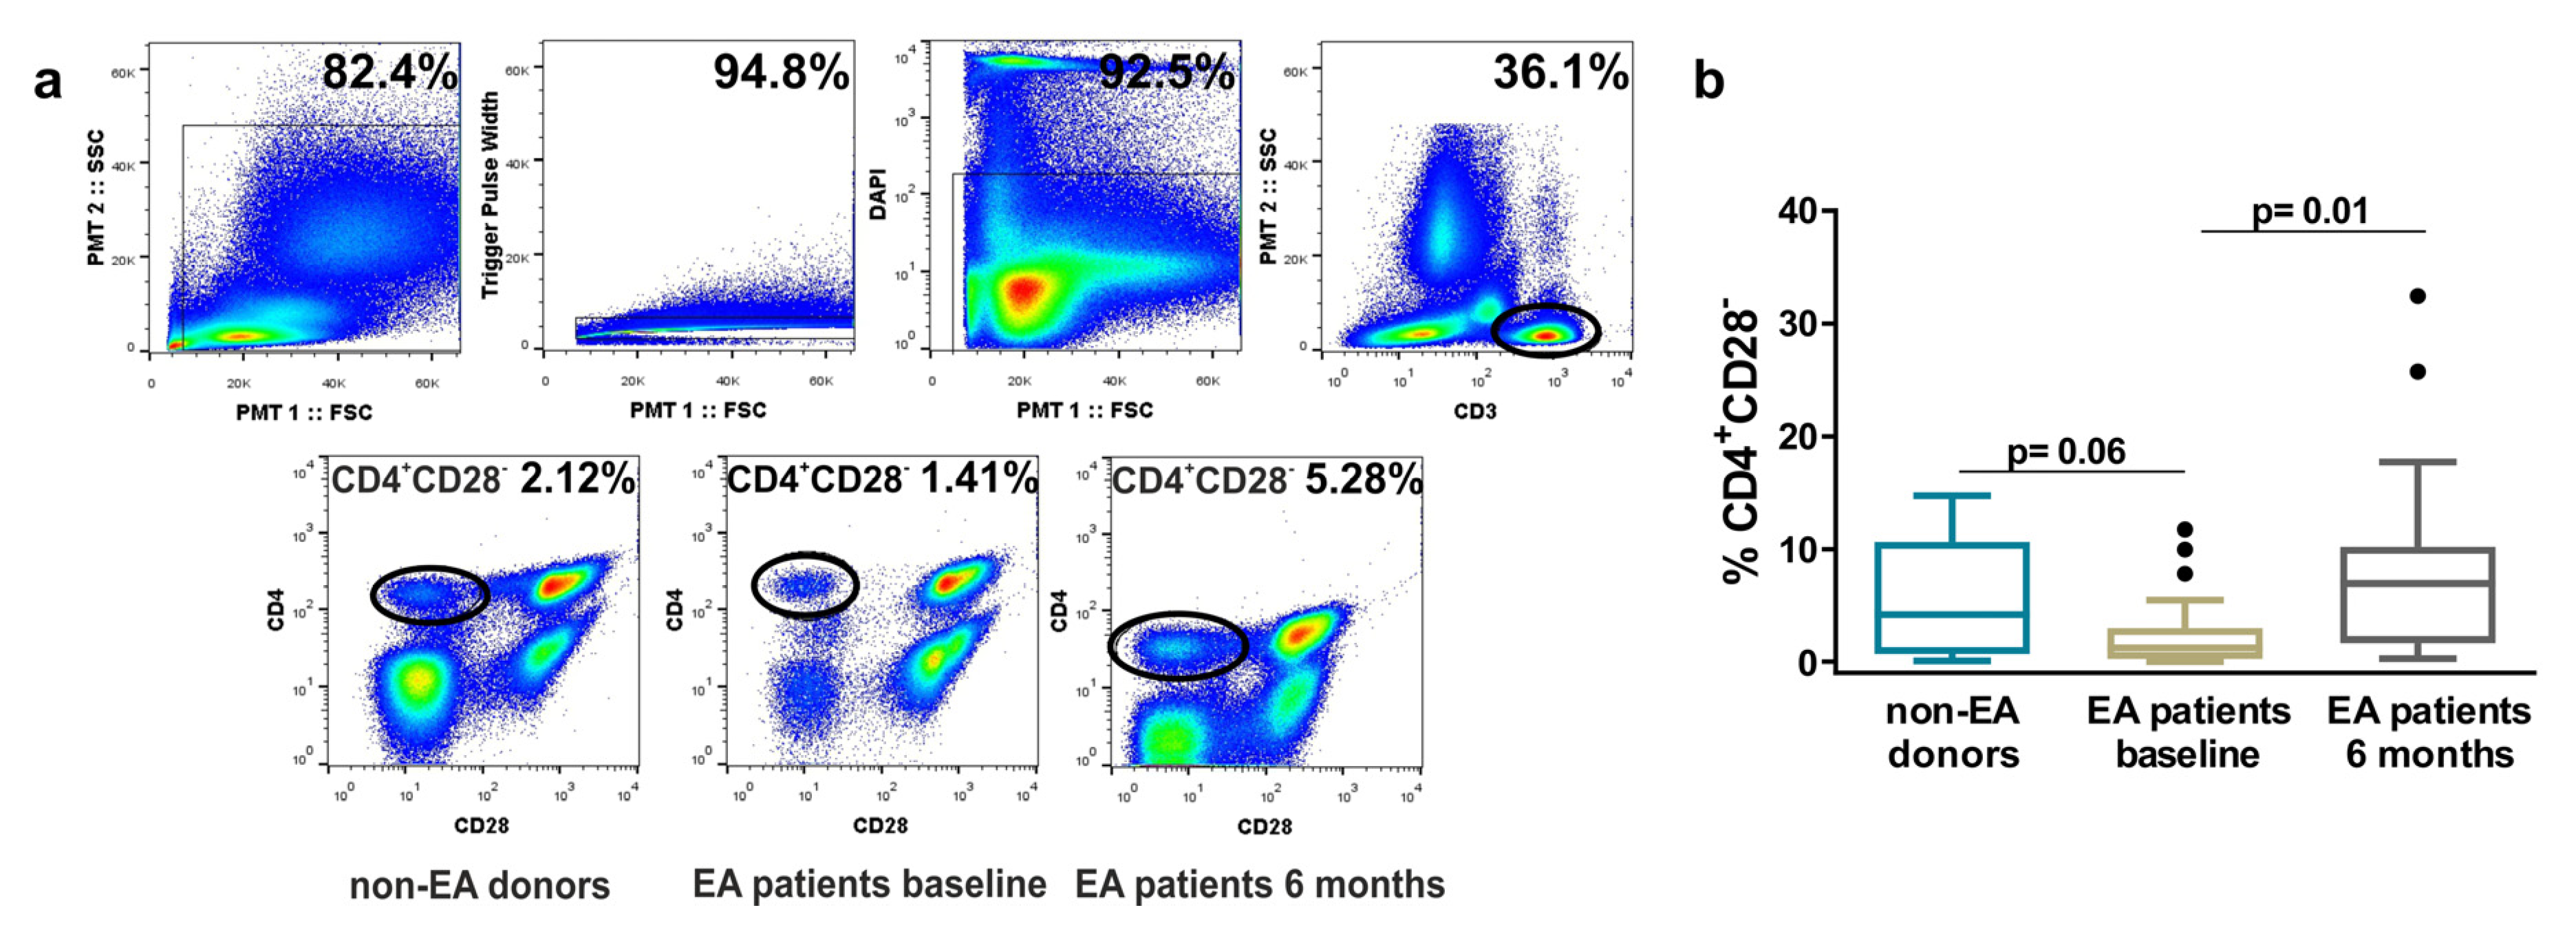
3.1. Frequency of Resting CD4+CD28− Cells in Non-EA Donors and EA Patients.
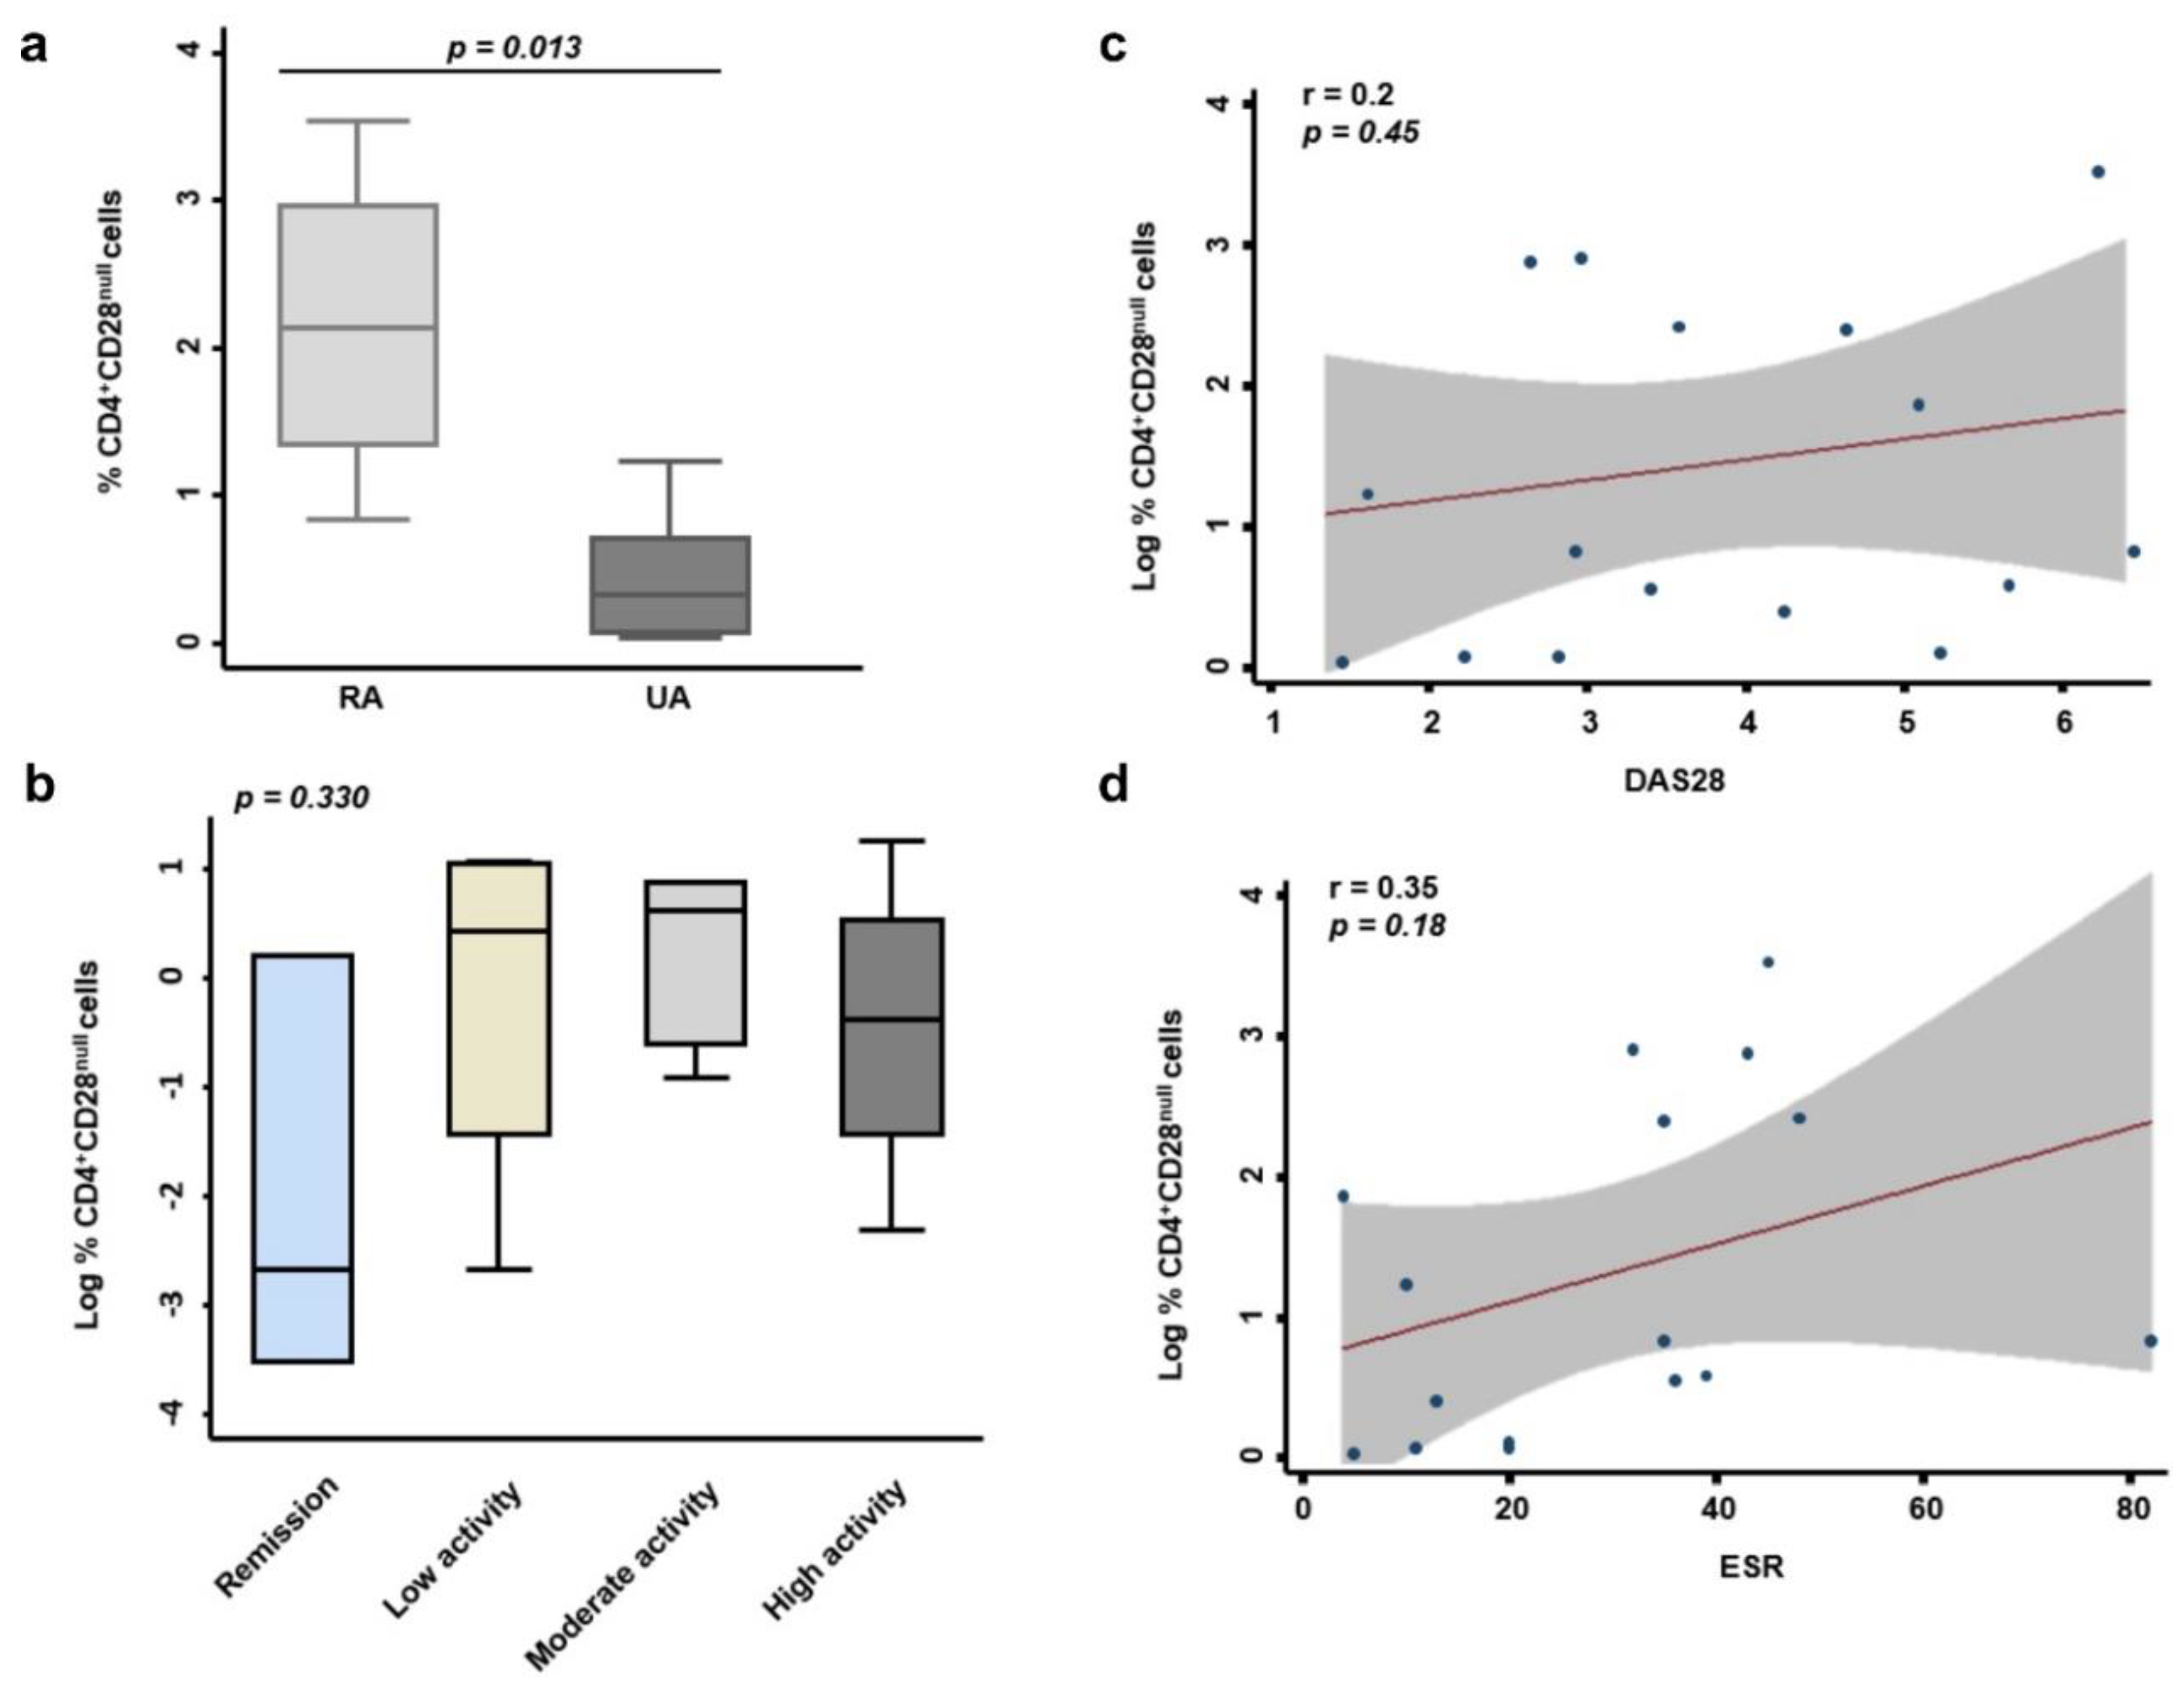
3.2. Correlation between the Percentage of Resting CD4+CD28− Cells and Clinical, Radiological, and Analytical Variables in EA Patients
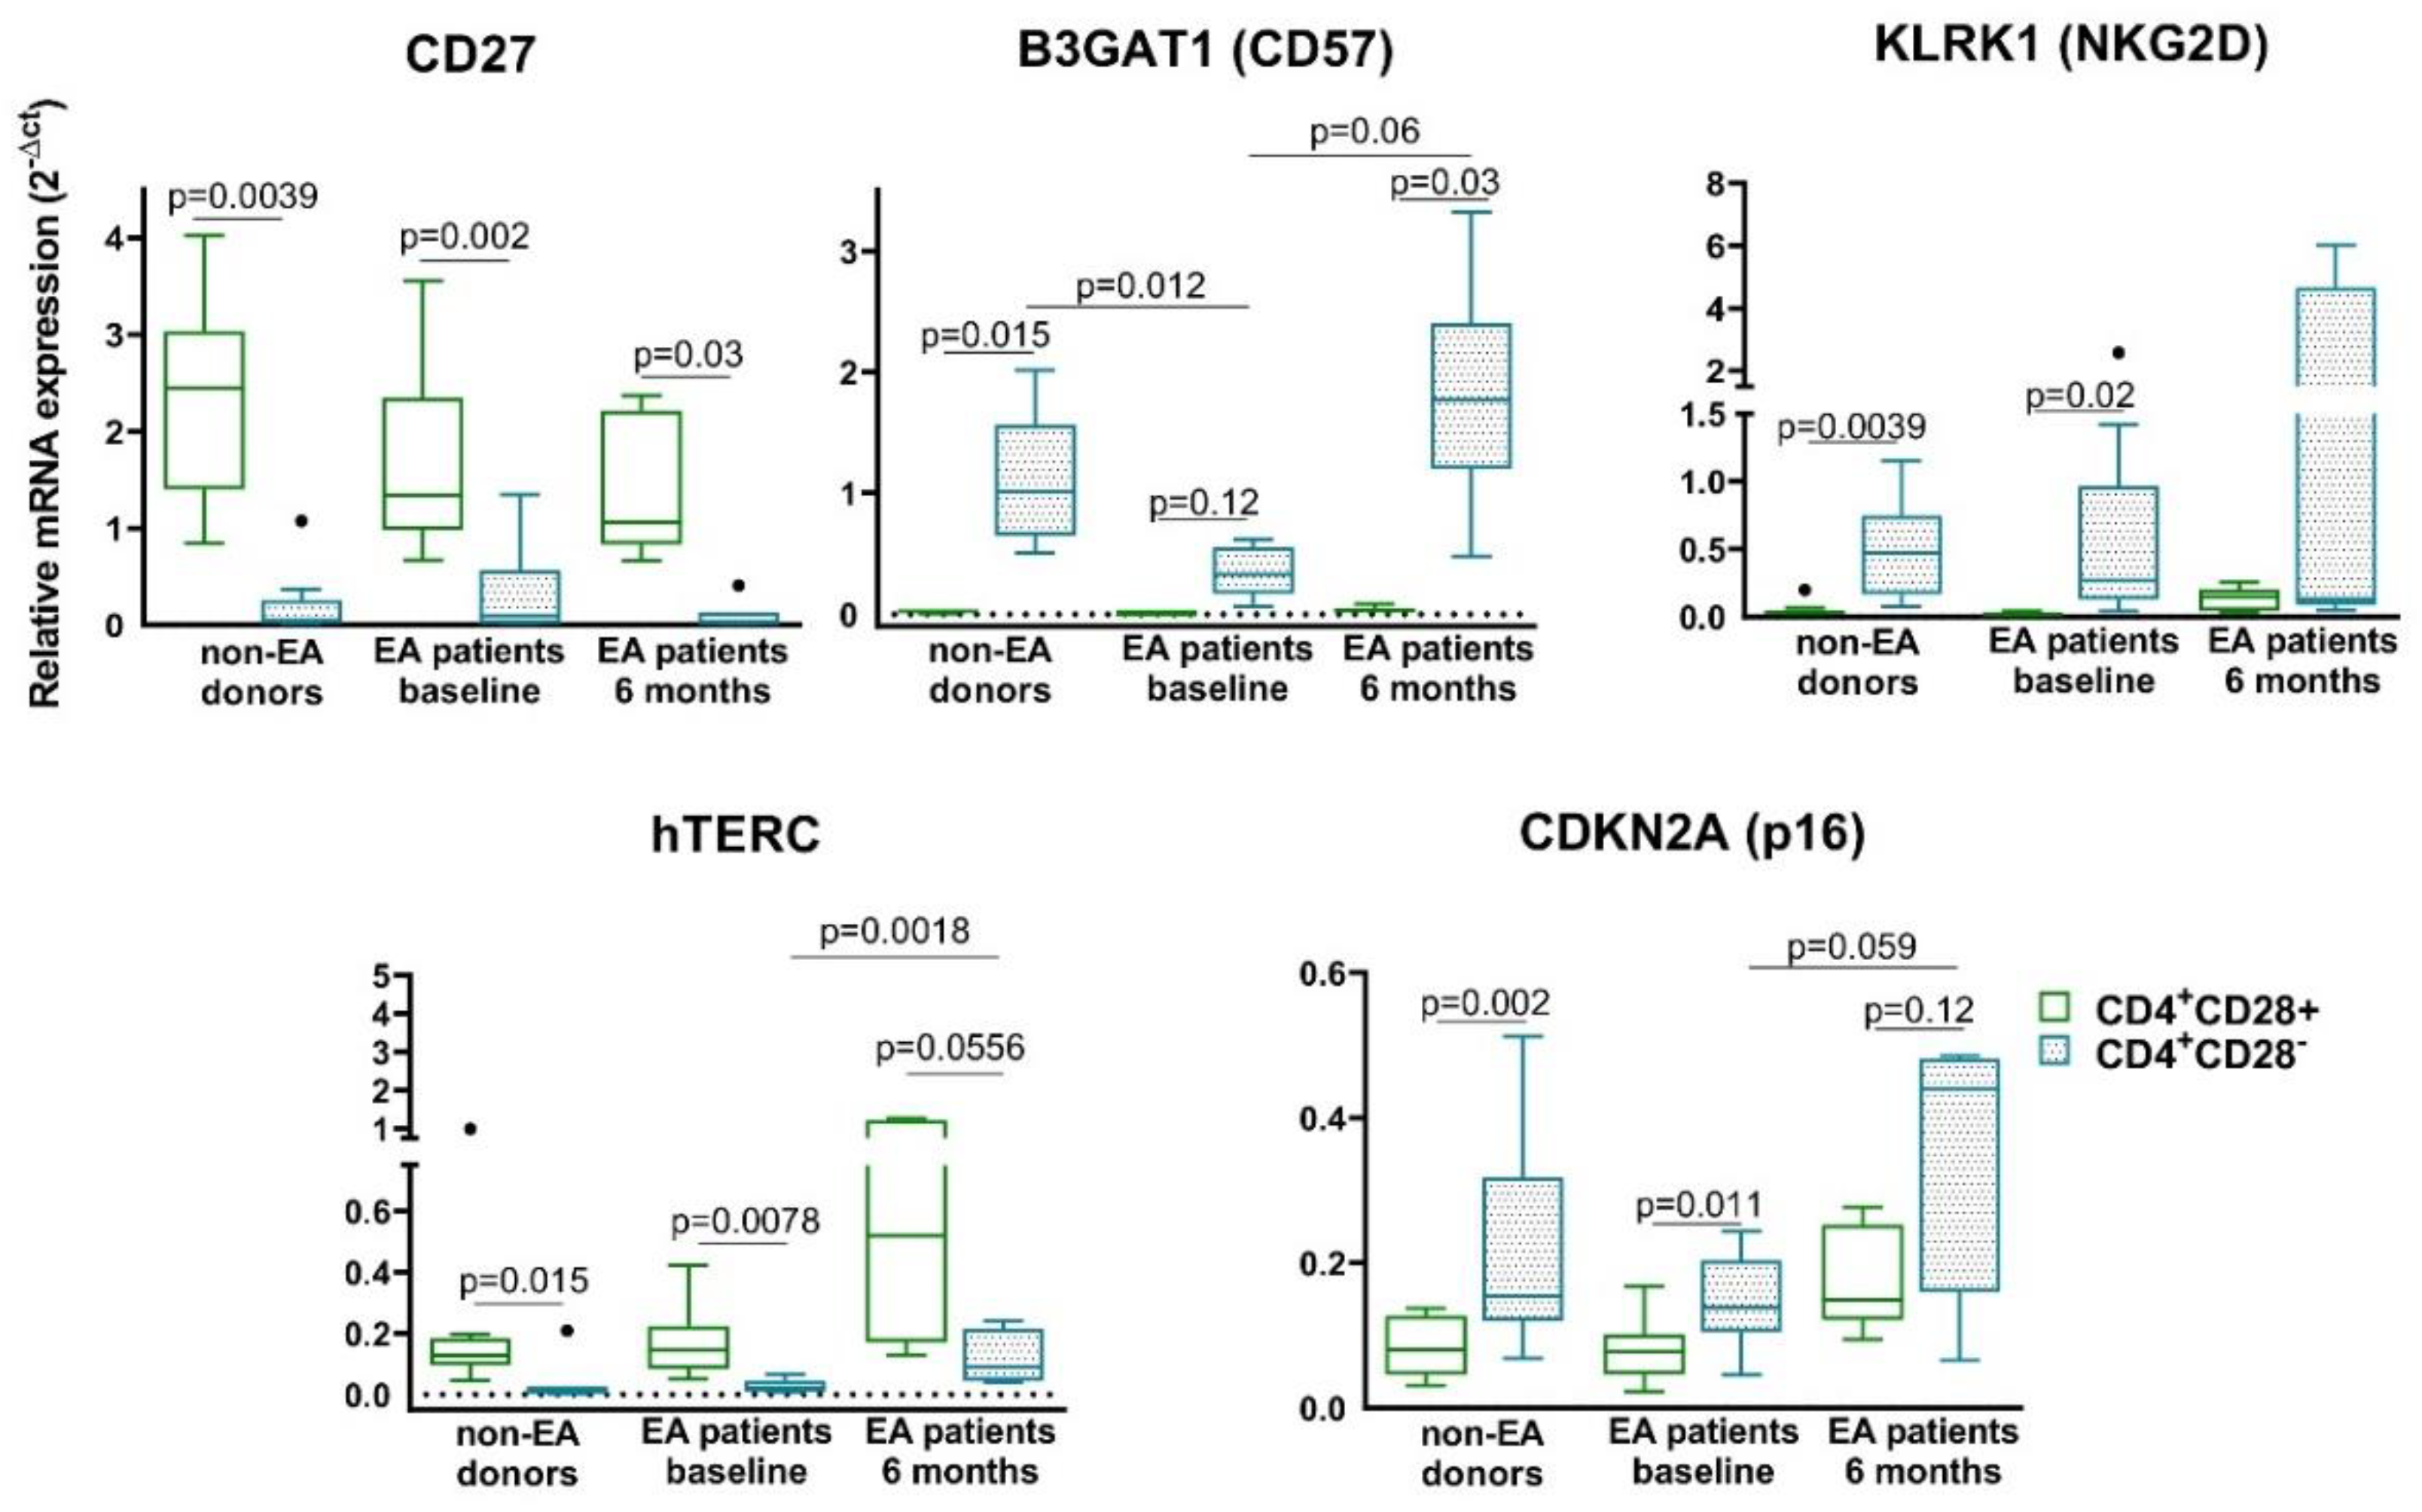
3.3. Characterization of Senescent Biomarkers in Resting CD4+CD28− Cells from Non-EA Donors and EA Patients
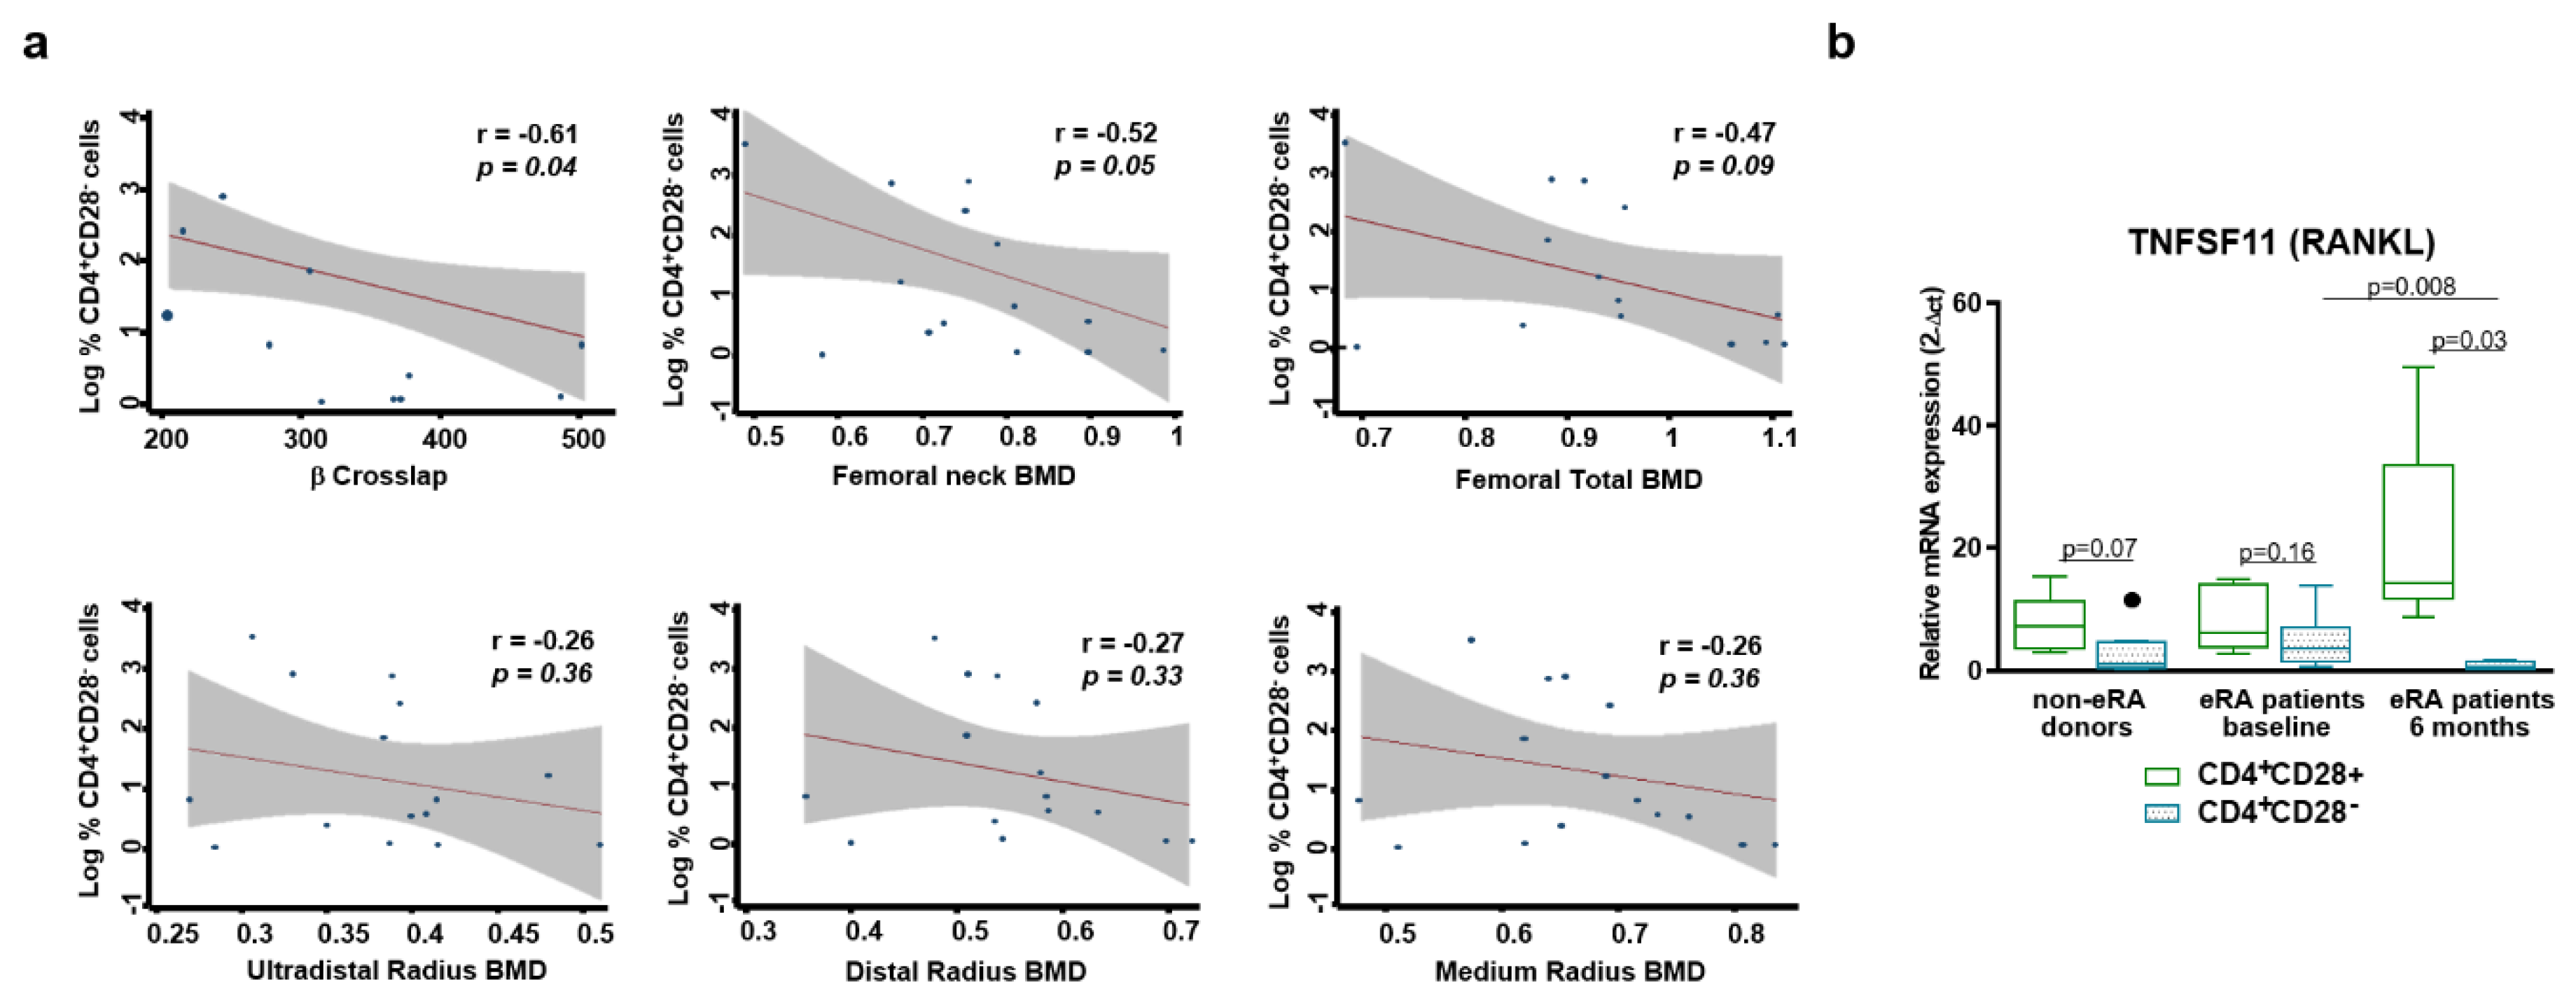
3.4. Relationship between Resting CD4+CD28− Cells and Bone Loss.
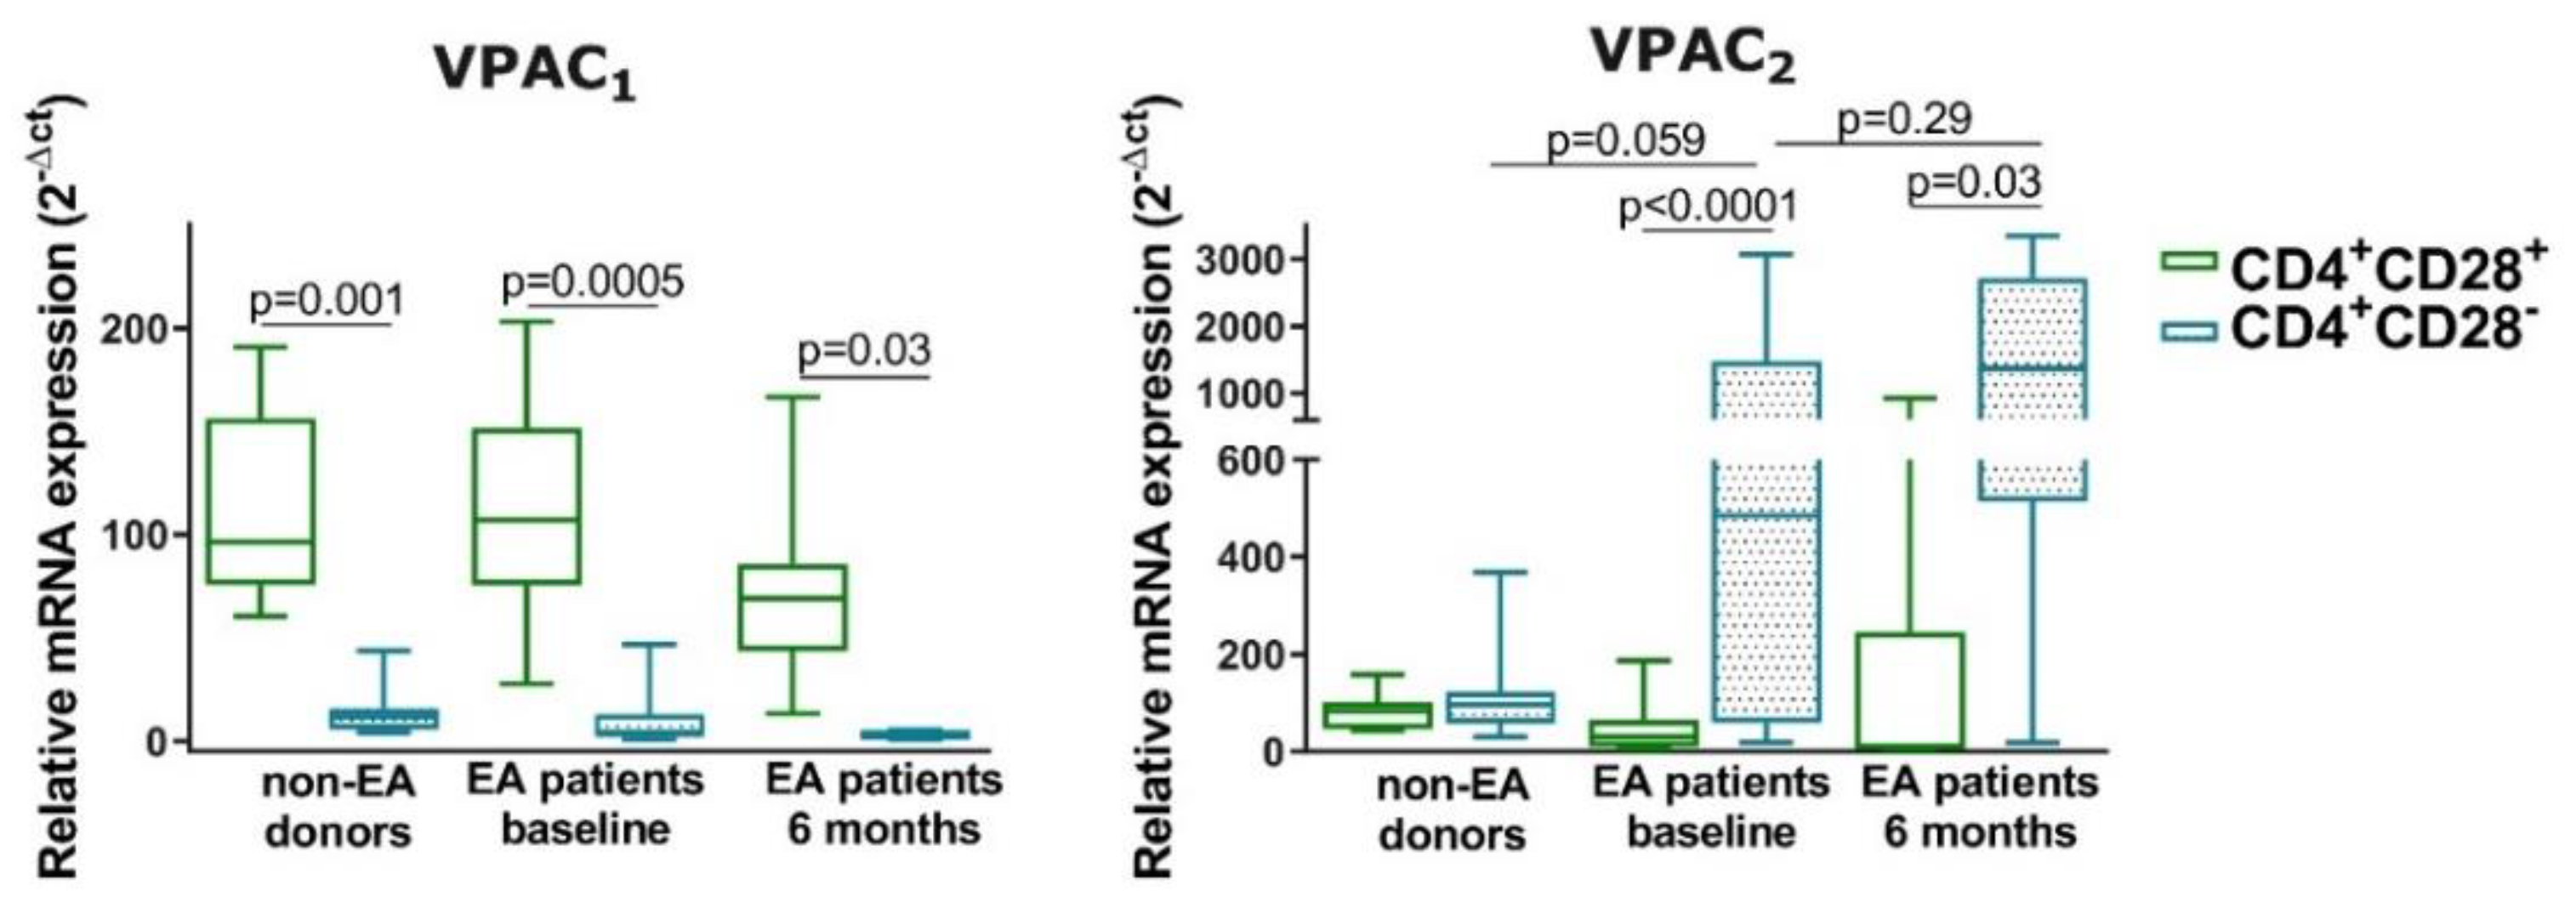
3.5. Expression of VPAC1 and VPAC2 in Resting CD4+CD28− Cells from Non-EA Donors and EA Patients
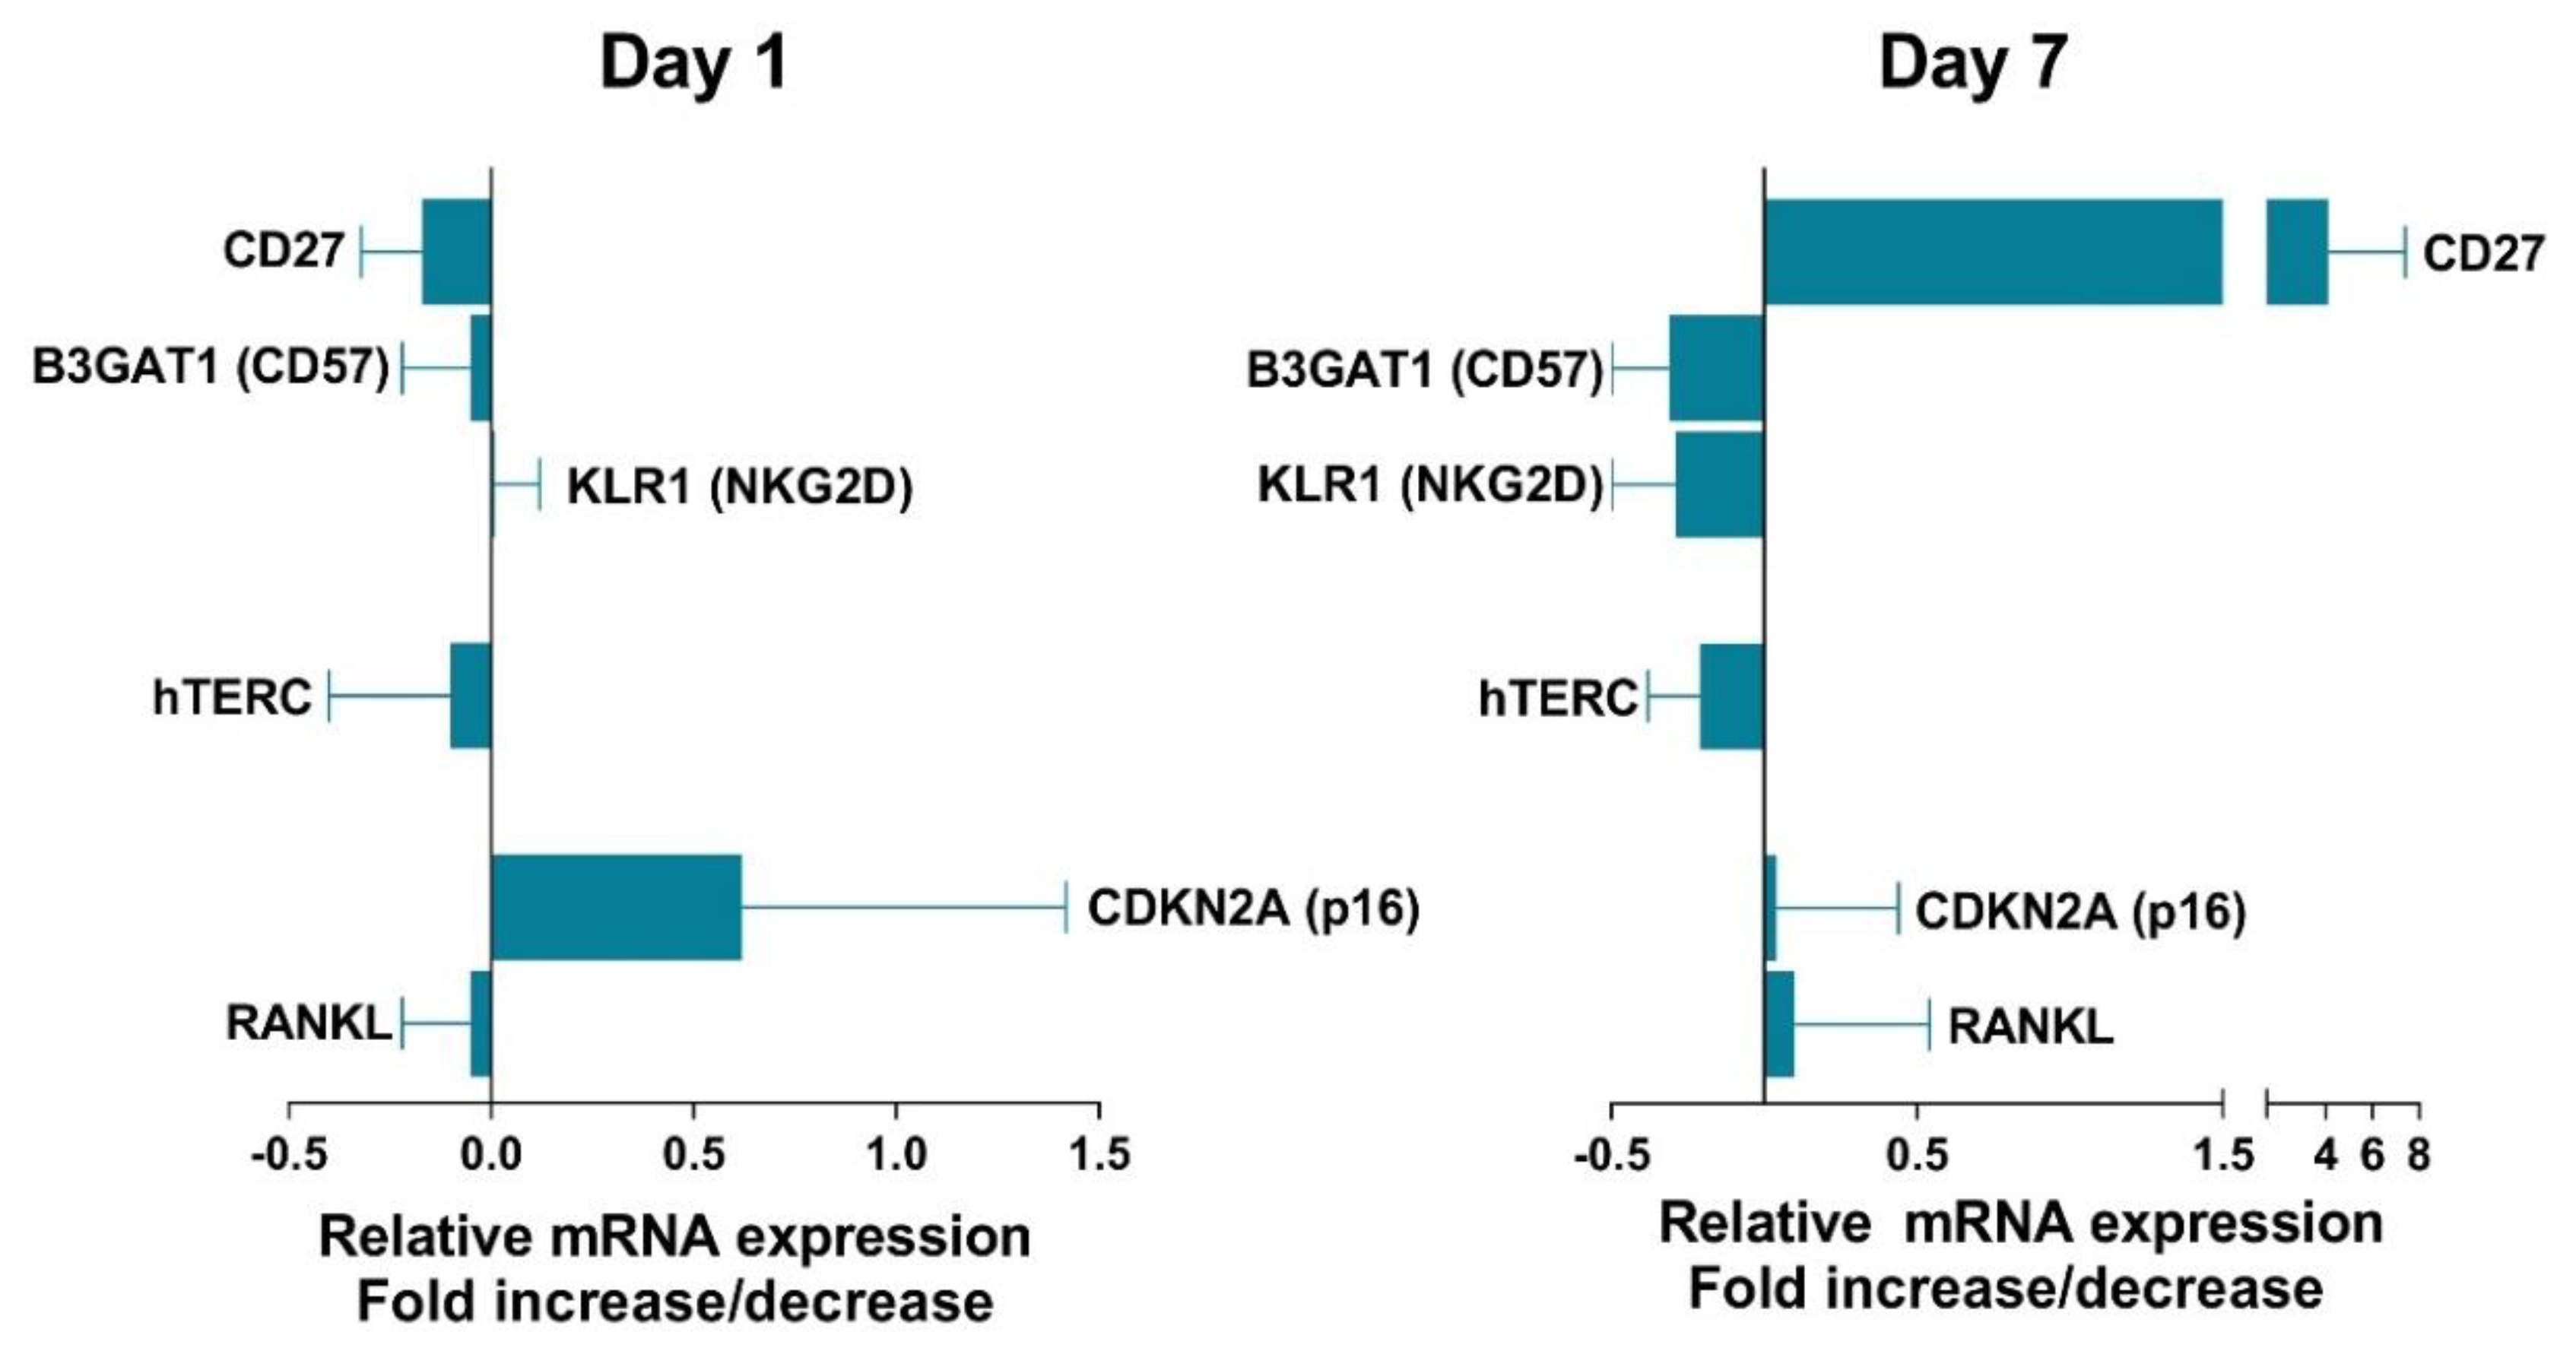
3.6. Effect of VIP on Senescent Biomarkers in Non-EA Donors CD4+CD28− Cells.
4. Discussion
5. Conclusions
- -
- Patients who meet classification criteria for RA have a percentage of CD4+CD28− higher than those with undifferentiated arthritis. In addition, patients who are classified in remission according to the disease activity defined by the DAS28 also present a percentage of CD4+CD28− lower than those who present low, moderate, or high activity.
- -
- Only a tendency to positive correlation between senescent Th cells and CRP or ESR and a negative correlation between these cells and bone mineral density were found in early arthritis patients.
- -
- The expression of Th senescent biomarkers, CD27, CD57, PD1, NKG2D, hTERC, or p16, in senescent Th cells from early arthritis patients was similar to those of donors, however, some of them showed an increase after 6 months of disease progression.
- -
- The senescence of Th cells induces a change in the mRNA pattern expression of VPAC receptors in a resting state, the loss of VPAC1 and gain of VPAC2 were greater in cells from early arthritis patients.
- -
- VIP modulates some senescent Th biomarkers as CD27, CD57, or NKG2D, trying to counteract the senescence in these cells.
Author Contributions
Funding
Acknowledgments
Conflicts of Interest
References
- Bektas, A.; Schurman, S.H.; Sen, R.; Ferrucci, L. Human T cell immunosenescence and inflammation in aging. J. Leukoc. Biol. 2017, 102, 977–988. [Google Scholar] [CrossRef] [PubMed]
- Nikolich-Zugich, J. The twilight of immunity: Emerging concepts in aging of the immune system. Nat. Immunol. 2018, 19, 10–19. [Google Scholar] [CrossRef] [PubMed]
- Kasakovski, D.; Xu, L.; Li, Y. T cell senescence and CAR-T cell exhaustion in hematological malignancies. J. Hematol. Oncol. 2018, 11, 91. [Google Scholar] [CrossRef]
- Lee, G.H.; Lee, W.W. Unusual CD4(+)CD28(−) T Cells and Their Pathogenic Role in Chronic Inflammatory Disorders. Immune Netw. 2016, 16, 322–329. [Google Scholar] [CrossRef]
- Maly, K.; Schirmer, M. The story of CD4+ CD28− T cells revisited: Solved or still ongoing? J. Immunol. Res. 2015, 2015, 348746. [Google Scholar] [CrossRef] [PubMed]
- Broux, B.; Markovic-Plese, S.; Stinissen, P.; Hellings, N. Pathogenic features of CD4+CD28− T cells in immune disorders. Trends Mol. Med. 2012, 18, 446–453. [Google Scholar] [CrossRef]
- Fukushima, Y.; Minato, N.; Hattori, M. The impact of senescence-associated T cells on immunosenescence and age-related disorders. Inflamm. Regen. 2018, 38, 24. [Google Scholar] [CrossRef]
- Goronzy, J.J.; Matteson, E.L.; Fulbright, J.W.; Warrington, K.J.; Chang-Miller, A.; Hunder, G.G.; Mason, T.G.; Nelson, A.M.; Valente, R.M.; Crowson, C.S.; et al. Prognostic markers of radiographic progression in early rheumatoid arthritis. Arthritis Rheum. 2004, 50, 43–54. [Google Scholar] [CrossRef]
- Martens, P.B.; Goronzy, J.J.; Schaid, D.; Weyand, C.M. Expansion of unusual CD4+ T cells in severe rheumatoid arthritis. Arthritis Rheum. 1997, 40, 1106–1114. [Google Scholar] [CrossRef]
- Pawlik, A.; Ostanek, L.; Brzosko, I.; Brzosko, M.; Masiuk, M.; Machalinski, B.; Gawronska-Szklarz, B. The expansion of CD4+CD28− T cells in patients with rheumatoid arthritis. Arthritis Res. Ther. 2003, 5, R210–R213. [Google Scholar] [CrossRef]
- Bryl, E.; Vallejo, A.N.; Matteson, E.L.; Witkowski, J.M.; Weyand, C.M.; Goronzy, J.J. Modulation of CD28 expression with anti-tumor necrosis factor alpha therapy in rheumatoid arthritis. Arthritis Rheum. 2005, 52, 2996–3003. [Google Scholar] [CrossRef] [PubMed]
- Scarsi, M.; Ziglioli, T.; Airo, P. Decreased circulating CD28-negative T cells in patients with rheumatoid arthritis treated with abatacept are correlated with clinical response. J. Rheumatol. 2010, 37, 911–916. [Google Scholar] [CrossRef] [PubMed]
- Airo, P.; Scarsi, M. Targeting CD4+CD28− T cells by blocking CD28 co-stimulation. Trends Mol. Med. 2013, 19, 1–2. [Google Scholar] [CrossRef] [PubMed]
- Pieper, J.; Johansson, S.; Snir, O.; Linton, L.; Rieck, M.; Buckner, J.H.; Winqvist, O.; van Vollenhoven, R.; Malmstrom, V. Peripheral and site-specific CD4(+) CD28(null) T cells from rheumatoid arthritis patients show distinct characteristics. Scand. J. Immunol. 2014, 79, 149–155. [Google Scholar] [CrossRef] [PubMed]
- Fessler, J.; Raicht, A.; Husic, R.; Ficjan, A.; Schwarz, C.; Duftner, C.; Schwinger, W.; Graninger, W.B.; Stradner, M.H.; Dejaco, C. Novel Senescent Regulatory T-Cell Subset with Impaired Suppressive Function in Rheumatoid Arthritis. Front. Immunol. 2017, 8, 300. [Google Scholar] [CrossRef] [PubMed]
- Fessler, J.; Husic, R.; Schwetz, V.; Lerchbaum, E.; Aberer, F.; Fasching, P.; Ficjan, A.; Obermayer-Pietsch, B.; Duftner, C.; Graninger, W.; et al. Senescent T-Cells Promote Bone Loss in Rheumatoid Arthritis. Front. Immunol. 2018, 9, 95. [Google Scholar] [CrossRef]
- Mocchegiani, E.; Malavolta, M. Possible new antiaging strategies related to neuroendocrine-immune interactions. Neuroimmunomodulation 2008, 15, 344–350. [Google Scholar] [CrossRef]
- Gomariz, R.P.; Juarranz, Y.; Abad, C.; Arranz, A.; Leceta, J.; Martínez, C. VIP-PACAP system in immunity: New insights for multitarget therapy. Ann. N. Y. Acad. Sci. 2006, 1070, 51–74. [Google Scholar] [CrossRef]
- Martínez, C.; Juarranz, Y.; Gutiérrez-Cañas, I.; Carrión, M.; Pérez-García, S.; Villanueva-Romero, R.; Castro, D.; Lamana, A.; Mellado, M.; González-Álvaro, I.; et al. A Clinical Approach for the Use of VIP Axis in Inflammatory and Autoimmune Diseases. Int. J. Mol. Sci. 2019, 21, 65. [Google Scholar] [CrossRef]
- Villanueva-Romero, R.; Gutiérrez-Cañas, I.; Carrión, M.; Pérez-García, S.; Seoane, I.V.; Martínez, C.; Gomariz, R.P.; Juarranz, Y. The Anti-Inflammatory Mediator, Vasoactive Intestinal Peptide, Modulates the Differentiation and Function of Th Subsets in Rheumatoid Arthritis. J. Immunol. Res. 2018, 2018, 6043710. [Google Scholar] [CrossRef]
- Couvineau, A.; Laburthe, M. VPAC receptors: Structure, molecular pharmacology and interaction with accessory proteins. Br. J. Pharm. 2012, 166, 42–50. [Google Scholar] [CrossRef] [PubMed]
- Gomariz, R.P.; Juarranz, Y.; Carrión, M.; Pérez-García, S.; Villanueva-Romero, R.; González-Álvaro, I.; Gutiérrez-Cañas, I.; Lamana, A.; Martínez, C. An Overview of VPAC Receptors in Rheumatoid Arthritis: Biological Role and Clinical Significance. Front. Endocrinol. 2019, 10, 729. [Google Scholar] [CrossRef] [PubMed]
- Harmar, A.J.; Fahrenkrug, J.; Gozes, I.; Laburthe, M.; May, V.; Pisegna, J.R.; Vaudry, D.; Vaudry, H.; Waschek, J.A.; Said, S.I. Pharmacology and functions of receptors for vasoactive intestinal peptide and pituitary adenylate cyclase-activating polypeptide: IUPHAR review 1. Br. J. Pharm. 2012, 166, 4–17. [Google Scholar] [CrossRef] [PubMed]
- Villanueva-Romero, R.; Gutiérrez-Cañas, I.; Carrión, M.; González-Álvaro, I.; Rodríguez-Frade, J.M.; Mellado, M.; Martínez, C.; Gomariz, R.P.; Juarranz, Y. Activation of Th lymphocytes alters pattern expression and cellular location of VIP receptors in healthy donors and early arthritis patients. Sci. Rep. 2019, 9, 7383. [Google Scholar] [CrossRef] [PubMed]
- Martínez, C.; Ortiz, A.M.; Juarranz, Y.; Lamana, A.; Seoane, I.V.; Leceta, J.; García-Vicuña, R.; Gomariz, R.P.; González-Álvaro, I. Serum levels of vasoactive intestinal peptide as a prognostic marker in early arthritis. PLoS ONE 2014, 9, e85248. [Google Scholar] [CrossRef] [PubMed]
- Seoane, I.V.; Martínez, C.; García-Vicuña, R.; Ortiz, A.M.; Juarranz, Y.; Talayero, V.C.; González-Álvaro, I.; Gomariz, R.P.; Lamana, A. Vasoactive intestinal peptide gene polymorphisms, associated with its serum levels, predict treatment requirements in early rheumatoid arthritis. Sci. Rep. 2018, 8, 2035. [Google Scholar] [CrossRef]
- Seoane, I.V.; Ortiz, A.M.; Piris, L.; Lamana, A.; Juarranz, Y.; García-Vicuña, R.; González-Álvaro, I.; Gomariz, R.P.; Martínez, C. Clinical Relevance of VPAC1 Receptor Expression in Early Arthritis: Association with IL-6 and Disease Activity. PLoS ONE 2016, 11, e0149141. [Google Scholar] [CrossRef]
- Castaneda, S.; Gonzalez-Alvaro, I.; Rodriguez-Salvanes, F.; Quintana, M.L.; Laffon, A.; Garcia-Vadillo, J.A. Reproducibility of metacarpophalangeal bone mass measurements obtained by dual-energy X-ray absorptiometry in healthy volunteers and patients with early arthritis. J. Clin. Densitom. 2007, 10, 298–305. [Google Scholar] [CrossRef]
- Chalan, P.; van den Berg, A.; Kroesen, B.J.; Brouwer, L.; Boots, A. Rheumatoid Arthritis, Immunosenescence and the Hallmarks of Aging. Curr. Aging Sci. 2015, 8, 131–146. [Google Scholar] [CrossRef]
- Larbi, A.; Fulop, T. From "truly naive" to "exhausted senescent" T cells: When markers predict functionality. Cytom. A 2014, 85, 25–35. [Google Scholar] [CrossRef]
- Bartosinska, J.; Zakrzewska, E.; Raczkiewicz, D.; Purkot, J.; Michalak-Stoma, A.; Kowal, M.; Krasowska, D.; Chodorowska, G.; Giannopoulos, K. Suppressed Programmed Death 1 Expression on CD4(+) and CD8(+) T Cells in Psoriatic Patients. Mediat. Inflamm. 2017, 2017, 5385102. [Google Scholar] [CrossRef] [PubMed]
- Petersen, L.E.; Schuch, J.B.; de Azeredo, L.A.; Baptista, T.S.A.; Motta, J.G.; do Prado, A.D.; Bauer, M.E. Characterization of senescence biomarkers in rheumatoid arthritis: Relevance to disease progression. Clin. Rheumatol. 2019, 38, 2909–2915. [Google Scholar] [CrossRef] [PubMed]
- Aiello, A.; Farzaneh, F.; Candore, G.; Caruso, C.; Davinelli, S.; Gambino, C.M.; Ligotti, M.E.; Zareian, N.; Accardi, G. Immunosenescence and Its Hallmarks: How to Oppose Aging Strategically? A Review of Potential Options for Therapeutic Intervention. Front. Immunol. 2019, 10, 2247. [Google Scholar] [CrossRef] [PubMed]
- Del Rey, M.J.; Valin, A.; Usategui, A.; Ergueta, S.; Martín, E.; Municio, C.; Cañete, J.D.; Blanco, F.J.; Criado, G.; Pablos, J.L. Senescent synovial fibroblasts accumulate prematurely in rheumatoid arthritis tissues and display an enhanced inflammatory phenotype. Immun. Ageing 2019, 16, 29. [Google Scholar] [CrossRef] [PubMed]
- Ventura, M.T.; Casciaro, M.; Gangemi, S.; Buquicchio, R. Immunosenescence in aging: Between immune cells depletion and cytokines up-regulation. Clin. Mol. Allergy 2017, 15, 21. [Google Scholar] [CrossRef] [PubMed]
- Puntus, T.; Schneider, B.; Meran, J.; Peterlik, M.; Kudlacek, S. Influence of age and gender on associations of body mass index with bone mineral density, bone turnover markers and circulating calcium-regulating and bone-active sex hormones. Bone 2011, 49, 824–829. [Google Scholar] [CrossRef] [PubMed]
- Shinoda, K.; Sugiyama, E.; Taki, H.; Harada, S.; Mino, T.; Maruyama, M.; Kobayashi, M. Resting T cells negatively regulate osteoclast generation from peripheral blood monocytes. Bone 2003, 33, 711–720. [Google Scholar] [CrossRef]
- Valenzuela, H.F.; Effros, R.B. Divergent telomerase and CD28 expression patterns in human CD4 and CD8 T cells following repeated encounters with the same antigenic stimulus. Clin. Immunol. 2002, 105, 117–125. [Google Scholar] [CrossRef]
- Focosi, D.; Bestagno, M.; Burrone, O.; Petrini, M. CD57+ T lymphocytes and functional immune deficiency. J. Leukoc. Biol. 2010, 87, 107–116. [Google Scholar] [CrossRef]
- Hyland, P.; Barnett, C.; Pawelec, G.; Barnett, Y. Age-related accumulation of oxidative DNA damage and alterations in levels of p16(INK4a/CDKN2a), p21(WAF1/CIP1/SDI1) and p27(KIP1) in human CD4+ T cell clones in vitro. Mech. Ageing Dev. 2001, 122, 1151–1167. [Google Scholar] [CrossRef]
- Onyema, O.O.; Njemini, R.; Bautmans, I.; Renmans, W.; De Waele, M.; Mets, T. Cellular aging and senescence characteristics of human T-lymphocytes. Biogerontology 2012, 13, 169–181. [Google Scholar] [CrossRef] [PubMed]
- Gutiérrez-Cañas, I.; Juarranz, Y.; Santiago, B.; Martínez, C.; Gomariz, R.P.; Pablos, J.L.; Leceta, J. Immunoregulatory properties of vasoactive intestinal peptide in human T cell subsets: Implications for rheumatoid arthritis. Brain Behav. Immun. 2008, 22, 312–317. [Google Scholar] [CrossRef] [PubMed]
- Jimeno, R.; Gomariz, R.P.; Garín, M.; Gutiérrez-Cañas, I.; González-Álvaro, I.; Carrión, M.; Galindo, M.; Leceta, J.; Juarranz, Y. The pathogenic Th profile of human activated memory Th cells in early rheumatoid arthritis can be modulated by VIP. J. Mol. Med. 2015, 93, 457–467. [Google Scholar] [CrossRef] [PubMed]
- Jimeno, R.; Leceta, J.; Garín, M.; Ortiz, A.M.; Mellado, M.; Rodríguez-Frade, J.M.; Martínez, C.; Pérez-García, S.; Gomariz, R.P.; Juarranz, Y. Th17 polarization of memory Th cells in early arthritis: The vasoactive intestinal peptide effect. J. Leukoc. Biol. 2015, 98, 257–269. [Google Scholar] [CrossRef]
- Jimeno, R.; Leceta, J.; Martínez, C.; Gutiérrez-Cañas, I.; Carrión, M.; Pérez-García, S.; Garín, M.; Mellado, M.; Gomariz, R.P.; Juarranz, Y. Vasoactive intestinal peptide maintains the nonpathogenic profile of human th17-polarized cells. J. Mol. Neurosci. 2014, 54, 512–525. [Google Scholar] [CrossRef]
- Carrion, M.; Ramos-Levi, A.M.; Seoane, I.V.; Martinez-Hernandez, R.; Serrano-Somavilla, A.; Castro, D.; Juarranz, Y.; Gonzalez-Alvaro, I.; Gomariz, R.P.; Marazuela, M. Vasoactive intestinal peptide axis is dysfunctional in patients with Graves’ disease. Sci. Rep. 2020, 10, 13018. [Google Scholar] [CrossRef]


| Non-EA Donors | EA Patients | Normal Range | ||
|---|---|---|---|---|
| Baseline | 6 Months | Normal Range | ||
| Number | 13 | 25 | ||
| Age (years) | 65.5 ± 16.5 | 51.6 ± 15.0 * | ||
| Female gender, n (%) | 5 (39%) | 19 (76%) | ||
| ACPA + (%) | n.d. | 45 | Negative: <20 U Grey zone: 20–39 U Positive: ≥40 U | |
| RF + (%) | n.d. | 52 | 0–14 U/mL | |
| BMI | 26.2 ± 3.57 | 26.4 ± 3.84 | ||
| DAS28 | n.d. | 3.92 ± 1.63 | 2.77 ± 1.35 #p = 0.016 | |
| HUPI | n.d. | 5.38 ± 3.50 | 3.49 ± 2.87 p= 0.06 | |
| ESR (mm/h) | n.d. | 28.6 ± 19.4 | 21.2 ± 18.2 | 0–25 U |
| CRP (mg/dL) | n.d. | 0.57 ± 0.53 | 0.29 ± 0.24 p= 0.059 | 0–0.5 mg/dL |
| AP (U/L) | n.d. | 72.8 ± 16.1 | 71.6 ± 18.5 | 35–105 U/L |
| β-Crosslap (β-CTX) | n.d. | 387 ± 133 | 379 ± 107 | Pr.W. 137–573 pg/mL Po.W. 226–1008 pg/mL Men 30–50 y.o. 142–584 pg/mL Men 50–70 y.o. 200–704 pg/mL Men > 70 y.o. 230–854 pg/mL |
| Non-EA Donors | EA Patients | |
|---|---|---|
| Treatment | ||
| None, n (%) | 13 (100) | 14 (56) |
| MTX, n (%) | - | 8 (32) |
| Antimalarial, n (%) | - | 2 (8) |
| MTX + antimalarial, n (%) | - | 1 (4) |
| Initial diagnosis | ||
| RA, n (%) | - | 6 (24) |
| UA, n (%) | - | 13 (52) |
| CSA, n (%) | - | 6 (24) |
| (A) | ||
| Gene | GenBank Accession no. | Assay ID (TaqMan®) |
| SDHA | NM_004168.3 | Hs00188166_m1 |
| CD27 | NM_001242.4 | Hs00154297_m1 |
| hTERC | NR_001566.1 | Hs03454202_s1 |
| CDKN2A (p16) | NM_000077.4 | Hs00923894_m1 |
| PDCD1 (PD1) | NM_005018.2 | Hs01550088_m1 |
| KLRK1 (NKG2D) | NM_013431.2 | Hs00255338_m1 |
| B3GAT1 (CD57) | NM_018644.3 | Hs01024500_m1 |
| TNFSF11(RANKL) | NM_003701.3 | Hs00243522_m1 |
| (B) | ||
| Gene | GenBank Accession No. | Assay ID (Roche) |
| GAPDH | NM_002046.7 | 141139 |
| VIPR1 (VPAC1) | NM_004624.4 | 104081 |
| VIPR2 (VPAC2) | NM_003382.5 | 148318 |
Publisher’s Note: MDPI stays neutral with regard to jurisdictional claims in published maps and institutional affiliations. |
© 2020 by the authors. Licensee MDPI, Basel, Switzerland. This article is an open access article distributed under the terms and conditions of the Creative Commons Attribution (CC BY) license (http://creativecommons.org/licenses/by/4.0/).
Share and Cite
Villanueva-Romero, R.; Lamana, A.; Flores-Santamaría, M.; Carrión, M.; Pérez-García, S.; Triguero-Martínez, A.; Tomero, E.; Criado, G.; Pablos, J.L.; González-Álvaro, I.; et al. Comparative Study of Senescent Th Biomarkers in Healthy Donors and Early Arthritis Patients. Analysis of VPAC Receptors and Their Influence. Cells 2020, 9, 2592. https://doi.org/10.3390/cells9122592
Villanueva-Romero R, Lamana A, Flores-Santamaría M, Carrión M, Pérez-García S, Triguero-Martínez A, Tomero E, Criado G, Pablos JL, González-Álvaro I, et al. Comparative Study of Senescent Th Biomarkers in Healthy Donors and Early Arthritis Patients. Analysis of VPAC Receptors and Their Influence. Cells. 2020; 9(12):2592. https://doi.org/10.3390/cells9122592
Chicago/Turabian StyleVillanueva-Romero, Raúl, Amalia Lamana, Marissa Flores-Santamaría, Mar Carrión, Selene Pérez-García, Ana Triguero-Martínez, Eva Tomero, Gabriel Criado, José L. Pablos, Isidoro González-Álvaro, and et al. 2020. "Comparative Study of Senescent Th Biomarkers in Healthy Donors and Early Arthritis Patients. Analysis of VPAC Receptors and Their Influence" Cells 9, no. 12: 2592. https://doi.org/10.3390/cells9122592
APA StyleVillanueva-Romero, R., Lamana, A., Flores-Santamaría, M., Carrión, M., Pérez-García, S., Triguero-Martínez, A., Tomero, E., Criado, G., Pablos, J. L., González-Álvaro, I., Martínez, C., Juarranz, Y., Gomariz, R. P., & Gutiérrez-Cañas, I. (2020). Comparative Study of Senescent Th Biomarkers in Healthy Donors and Early Arthritis Patients. Analysis of VPAC Receptors and Their Influence. Cells, 9(12), 2592. https://doi.org/10.3390/cells9122592