Deciphering Fatty Acid Synthase Inhibition-Triggered Metabolic Flexibility in Prostate Cancer Cells through Untargeted Metabolomics


Abstract
1. Introduction
2. Materials and Methods
2.1. Materials
2.2. Cell Culture
2.3. Cell Viability Assay
2.4. FAS Activity Assay
2.5. Metabolomics Study of FAS Inhibition
2.6. Metabolomics Study of FAS Inhibition in Fatty Acid Free Condition
2.7. Oil-Red O Staining
2.8. LC-MS/MS Instrumentation
2.9. Statistical Analysis and Metabolite Identification
3. Results
3.1. Effects of FAS Inhibitors on the Cell Viability and FAS Enzyme Activity of the Human Prostate Cancer LNCaP-LN3 Cell Line
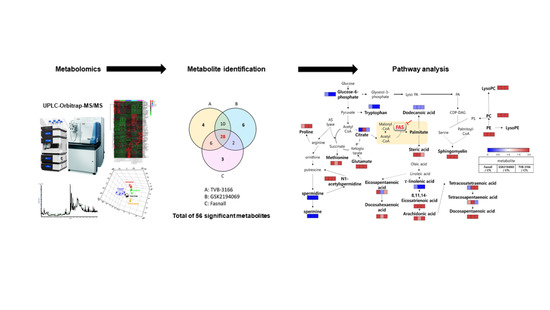
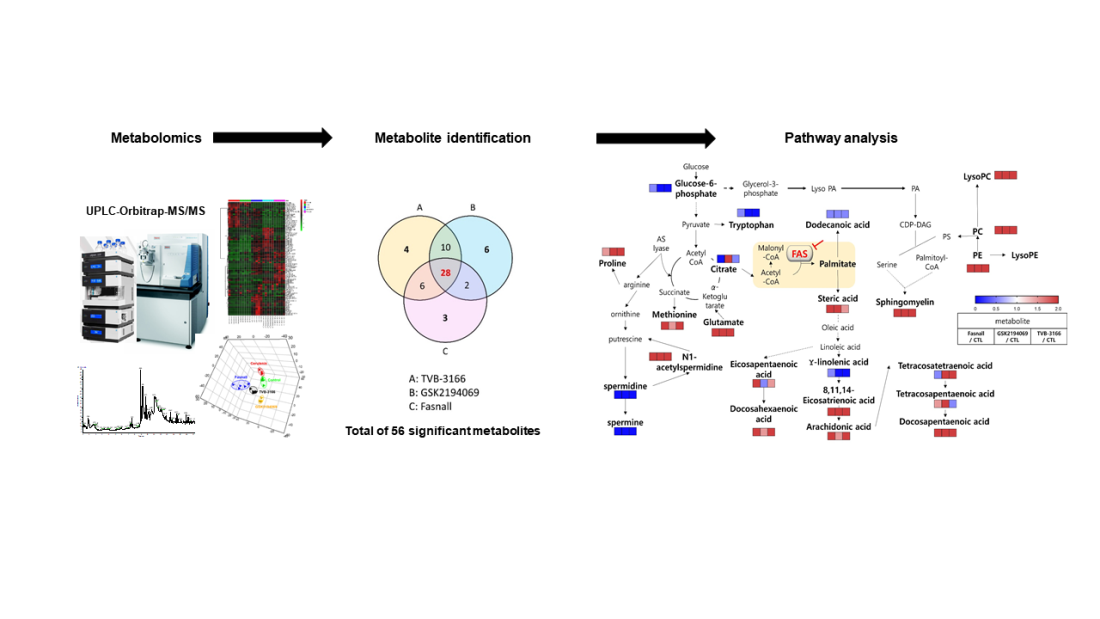
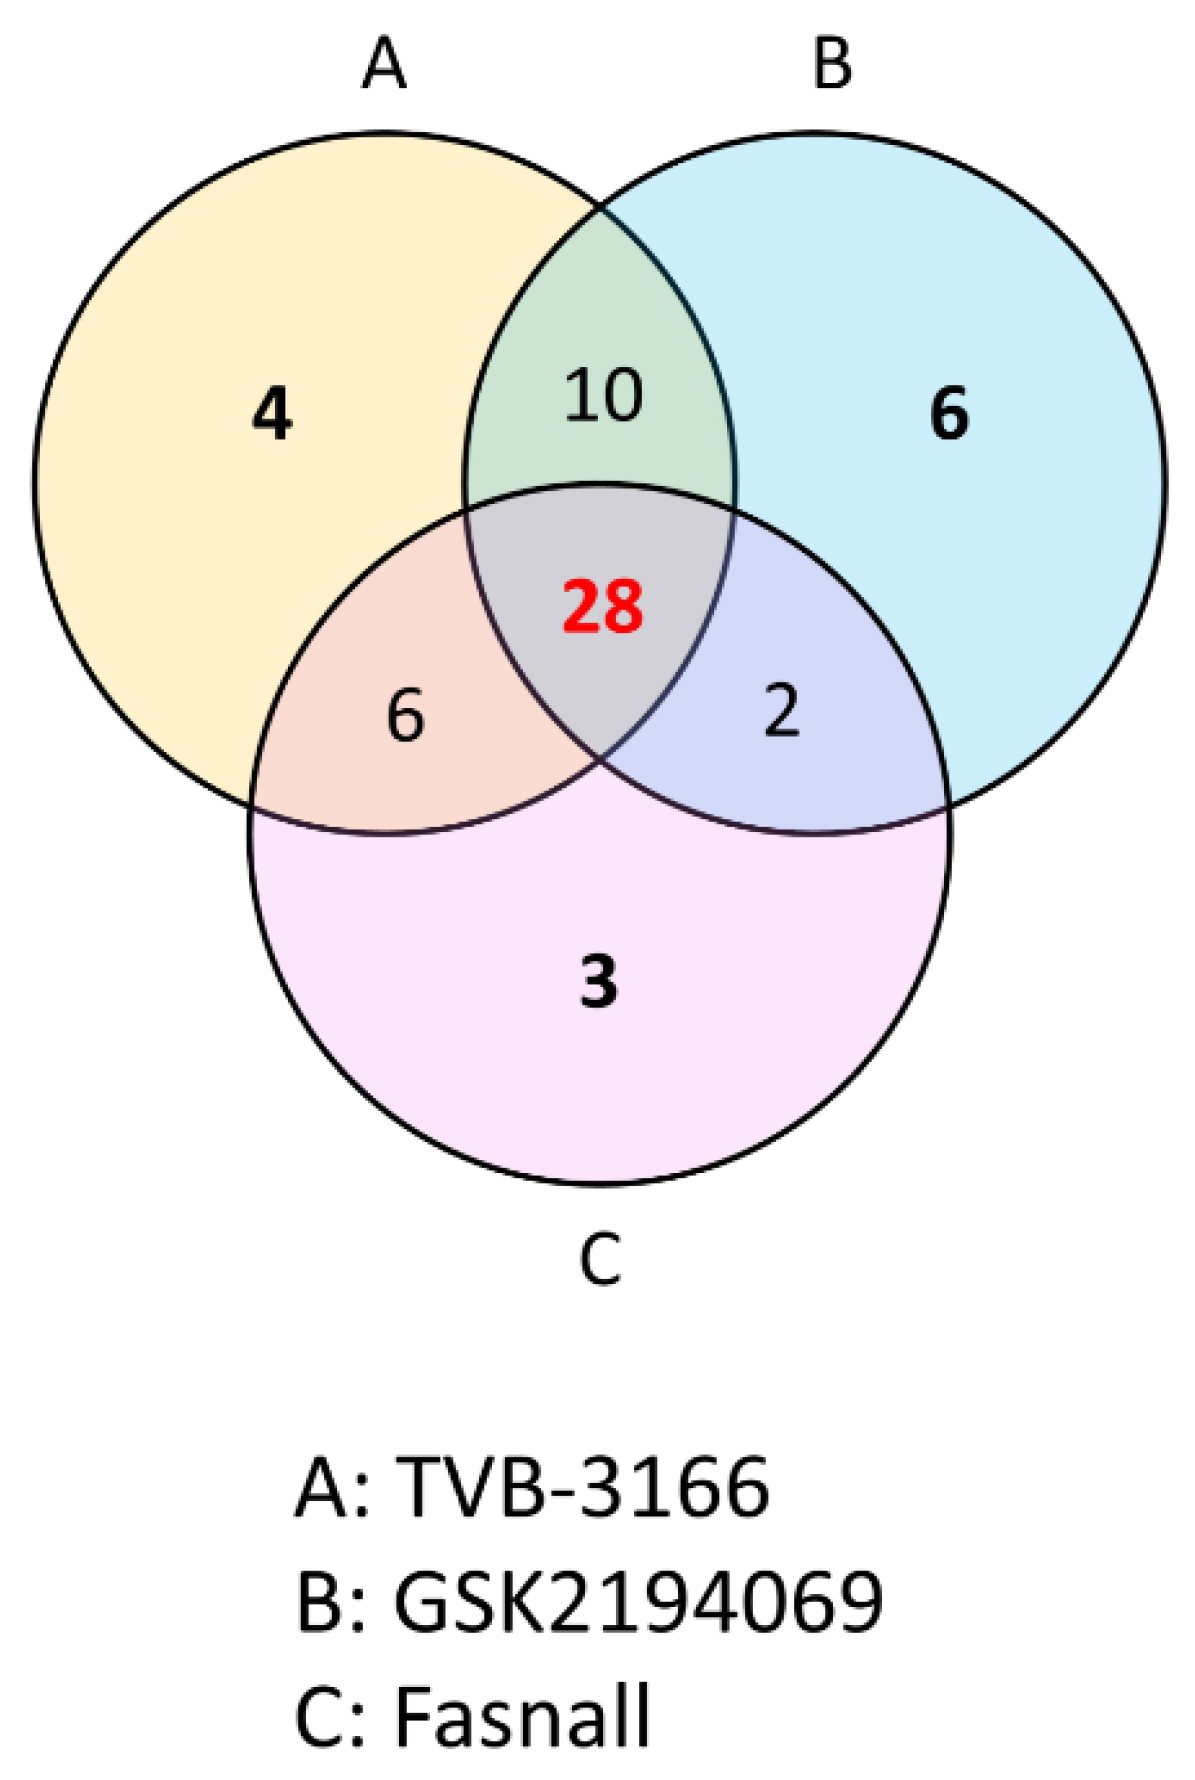
3.2. Metabolomics Changes Following Inhibition of FAS in Human LNCaP-LN3 Prostate Cancer Cells
3.3. Effects of Extracellular Palmitate on the Cell Viability during FAS Inhibition in Fatty Acid Free Media
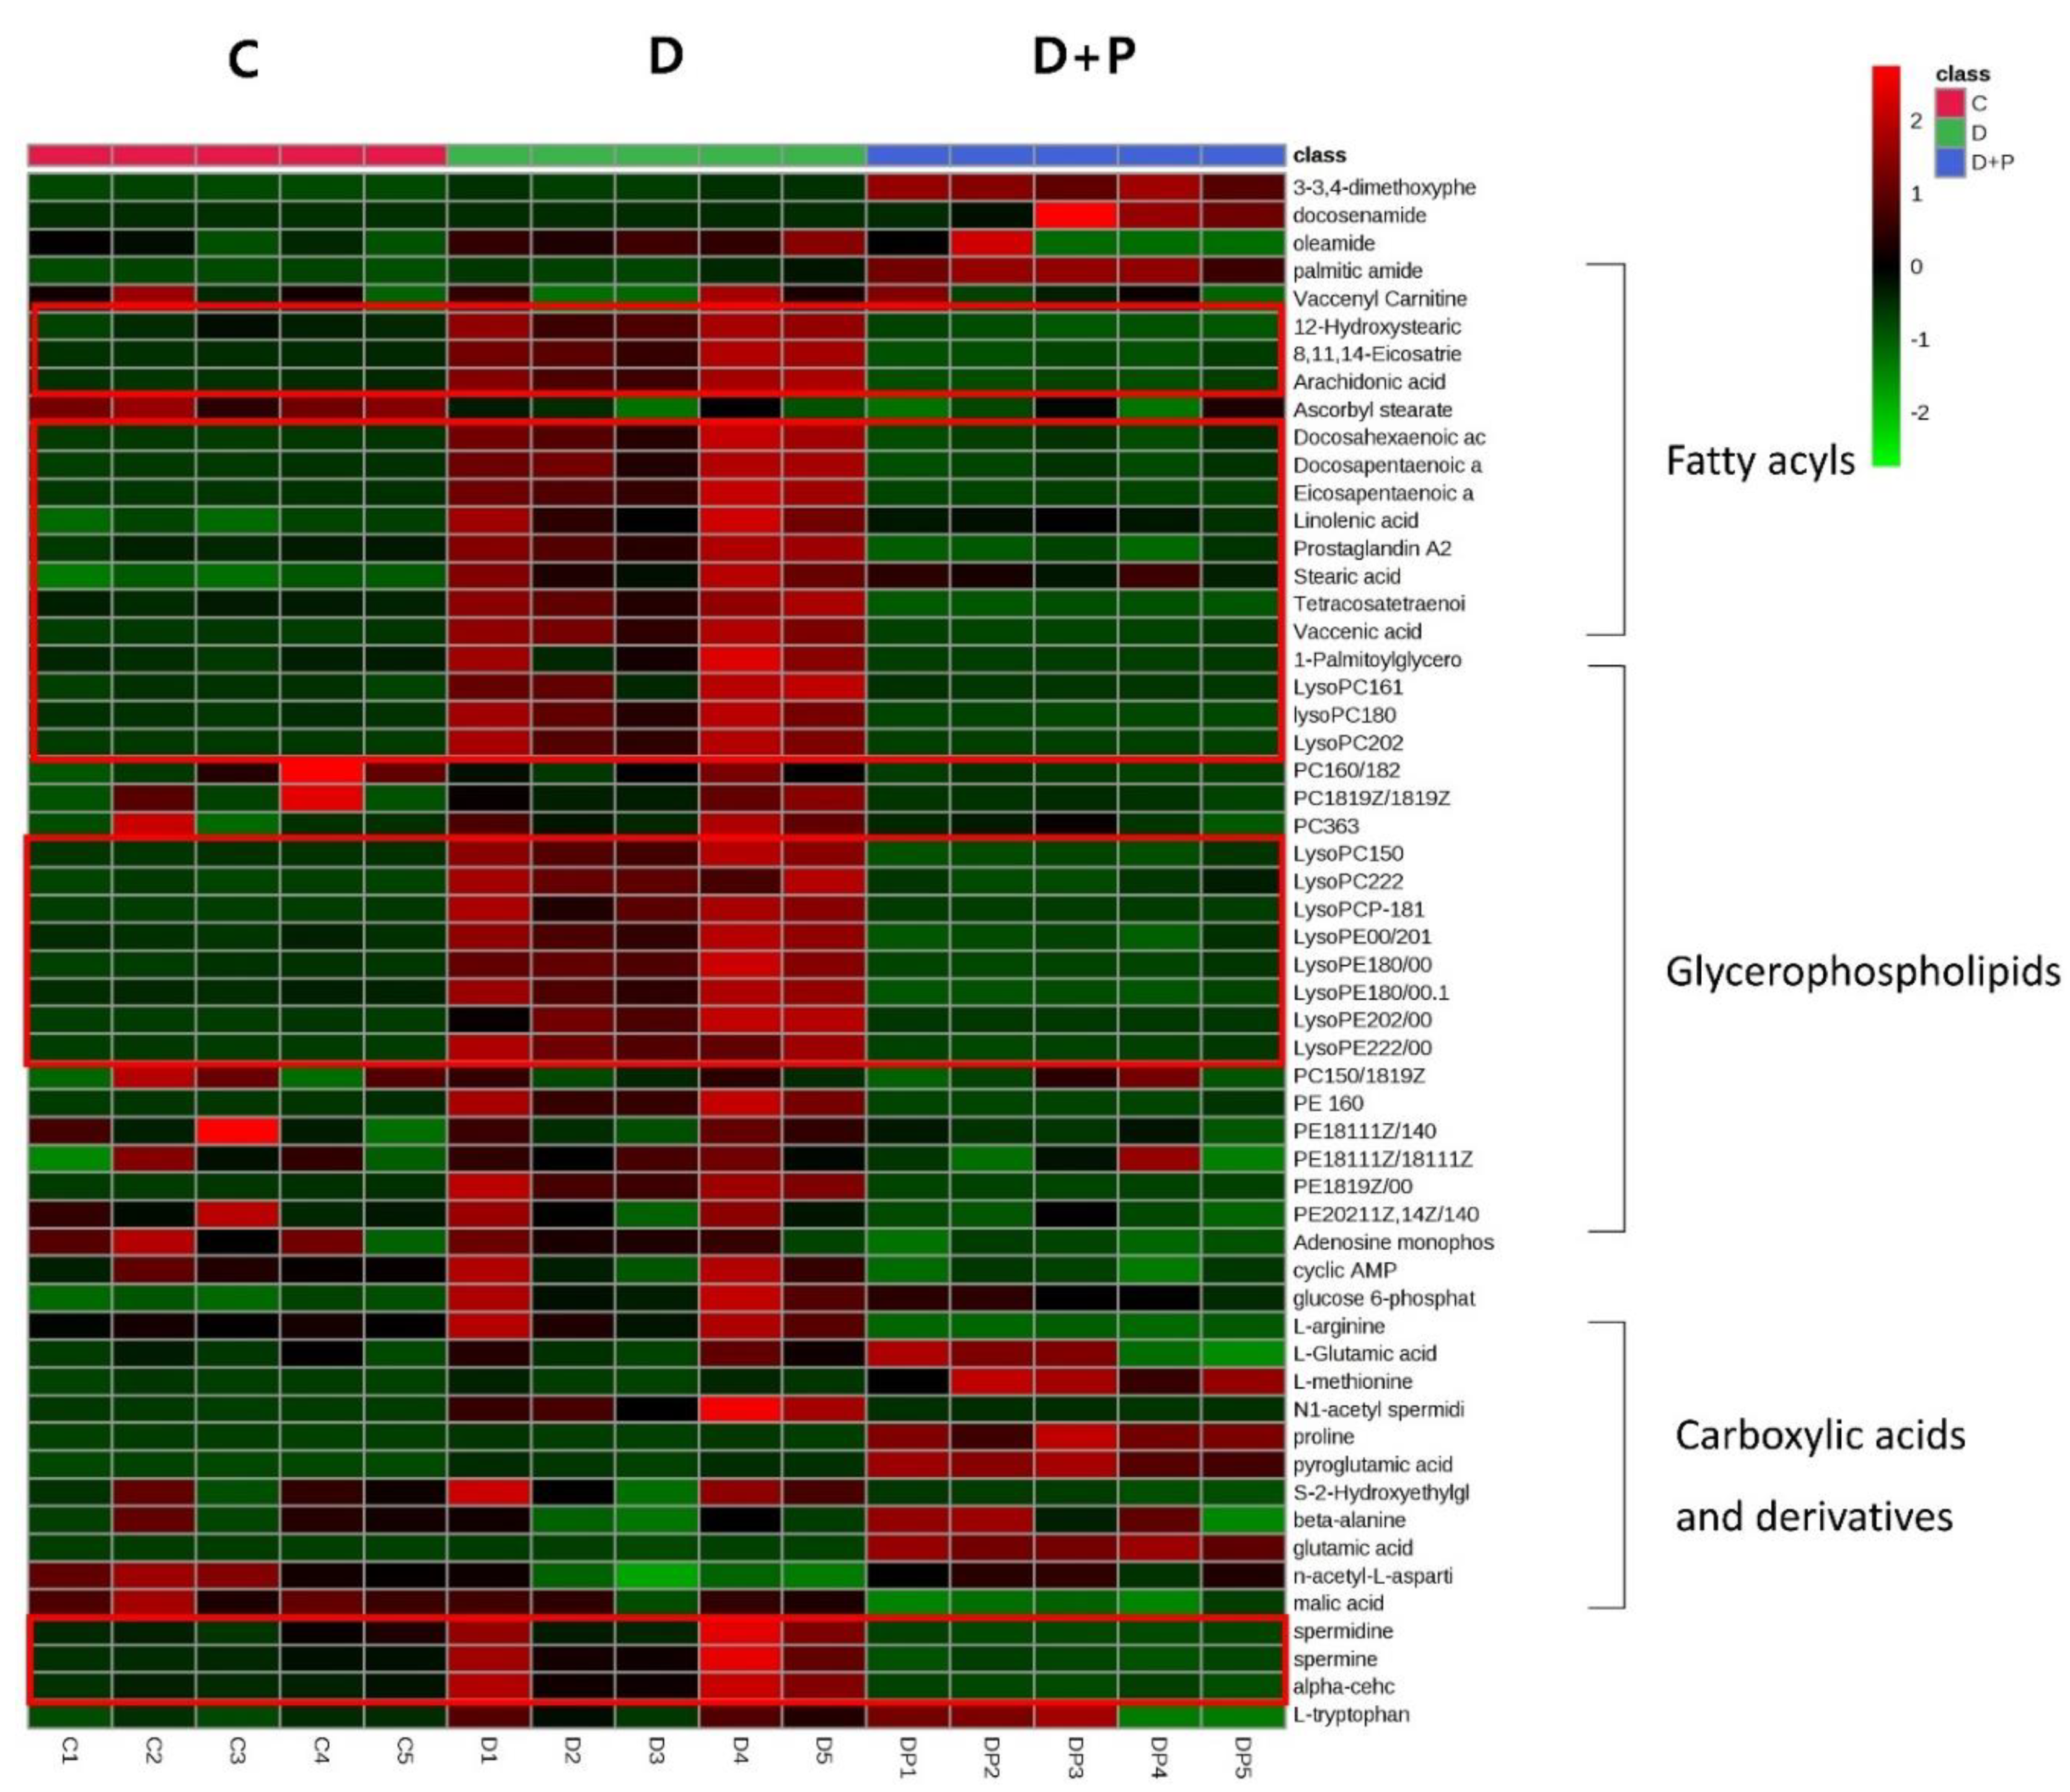
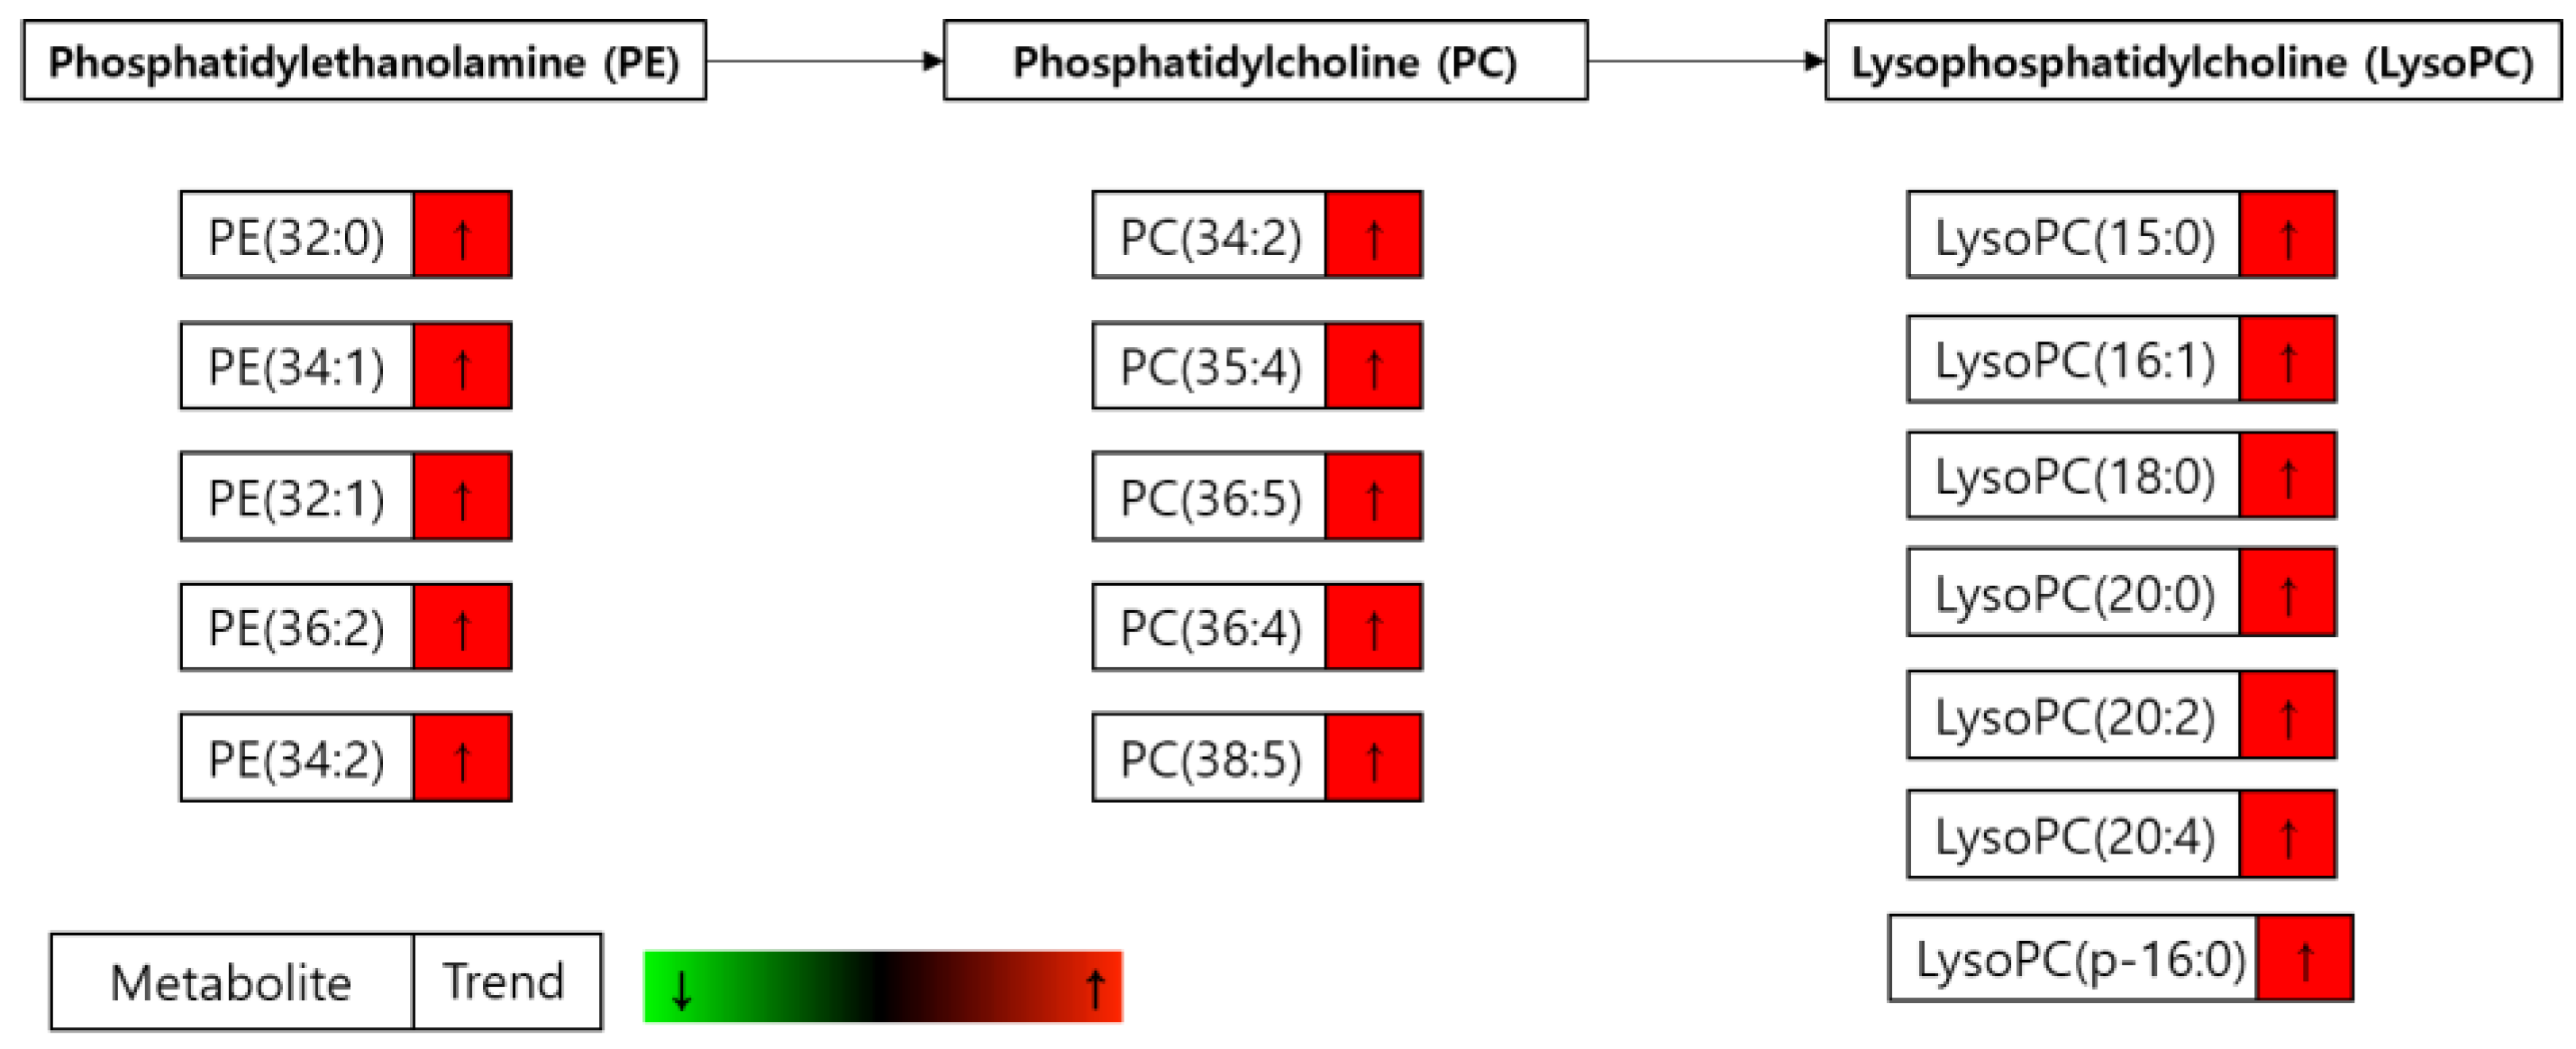
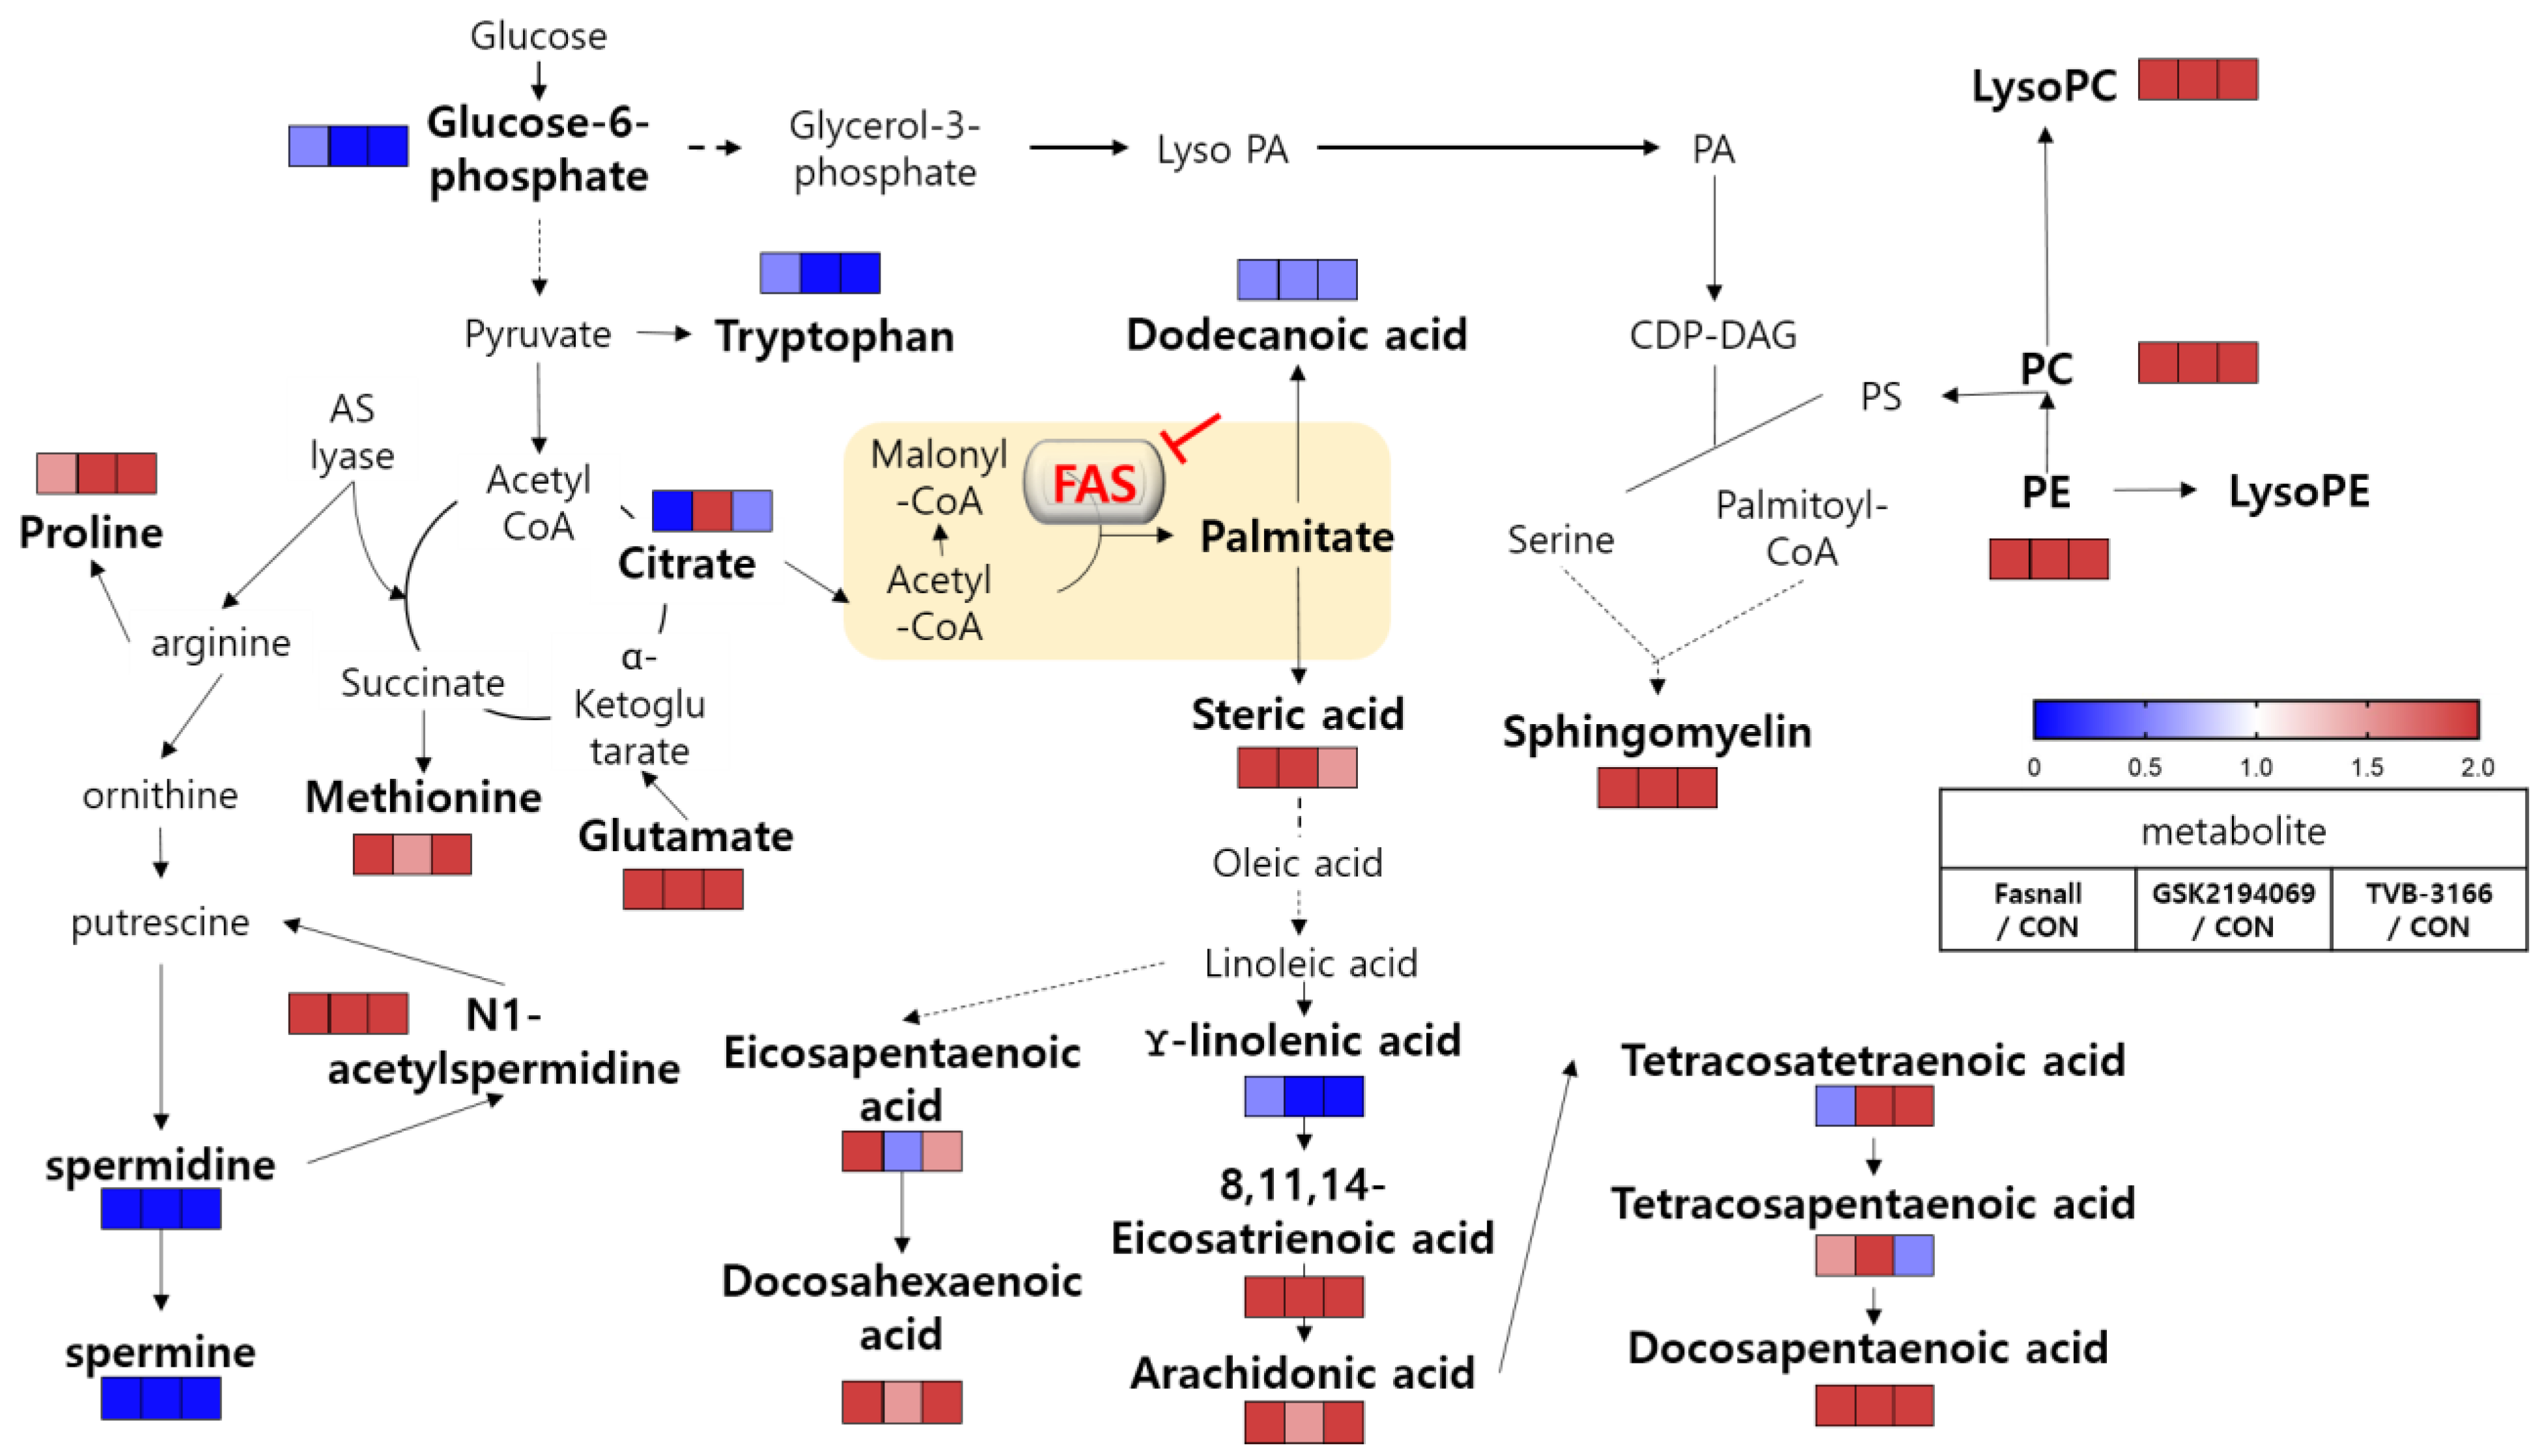
3.4. Metabolomics Analysis of FAS Inhibition with Extracellular Palmitate
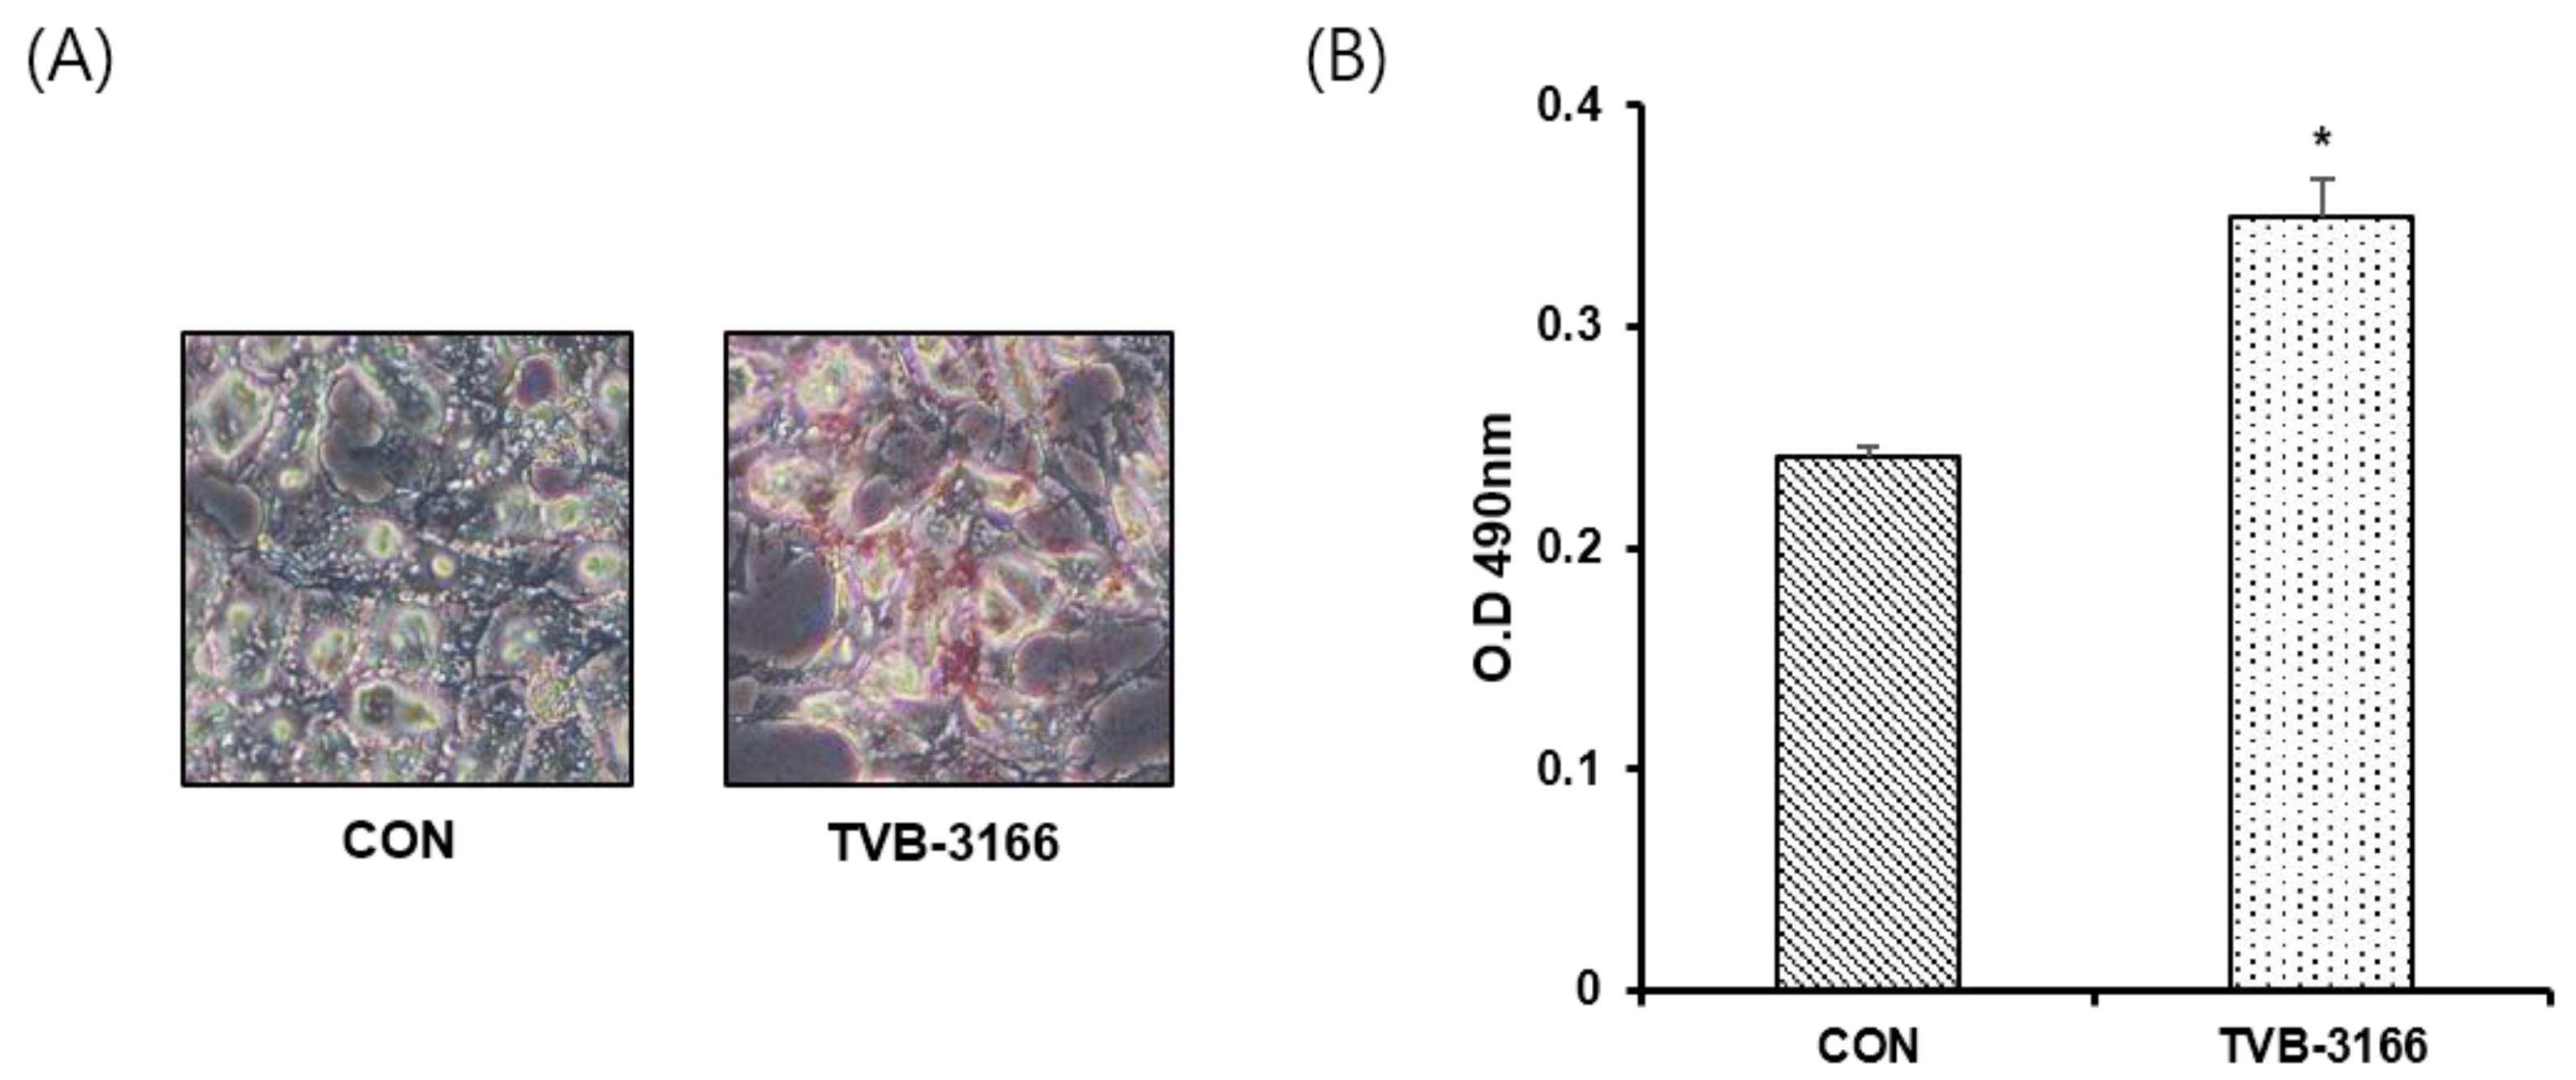
3.5. Oil-Red O Staining in a Fatty Acid Free Medium
4. Discussion
Supplementary Materials
Author Contributions
Funding
Acknowledgments
Conflicts of Interest
Appendix A

| Metabolite | MW | Fasnall | GSK2194069 | TVB-3166 | ||||||
|---|---|---|---|---|---|---|---|---|---|---|
| p-Value | Fold Change | Trend | p-Value | Fold Change | Trend | p-Value | Fold Change | Trend | ||
| 12-Hydroxystearic acid | 300.26 | 0.278 | 0.83 | 0.002 | 0.42 | ↓ | 0.019 | 0.62 | ↓ | |
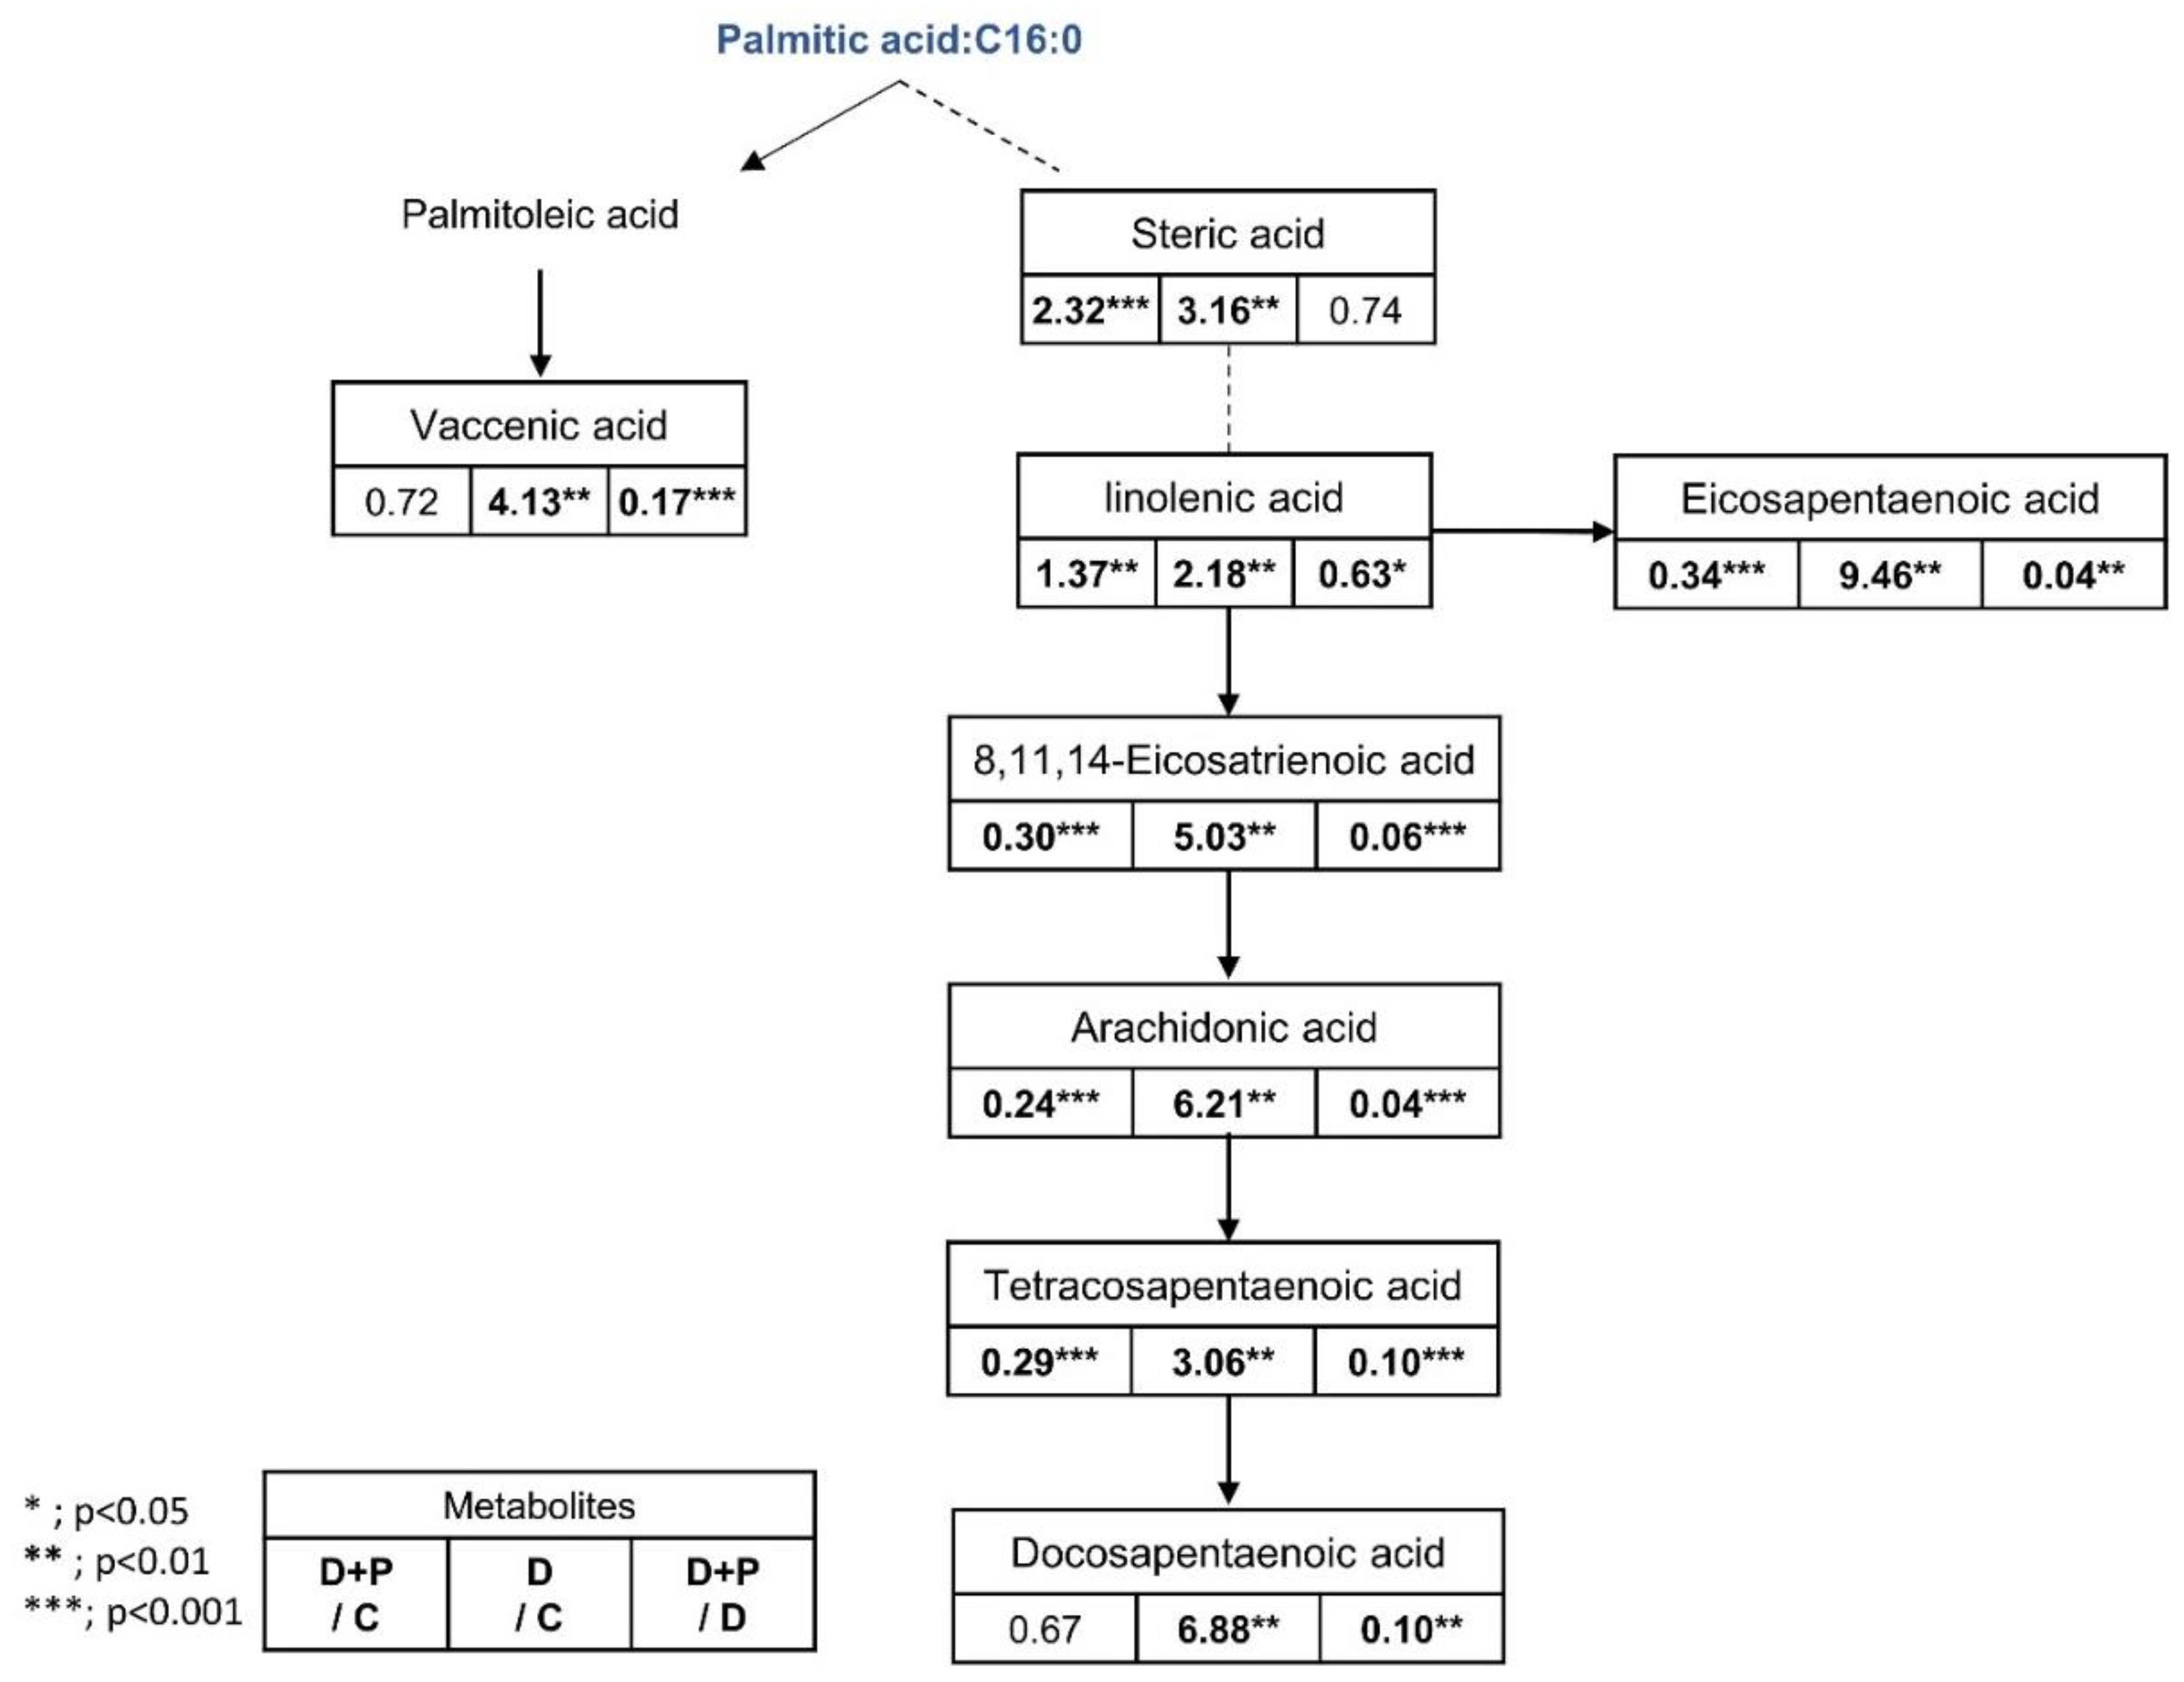
| 8,11,14-Eicosatrienoic acid | 306.25 | <0.000 | 3.73 | ↑ | 0.023 | 1.72 | ↑ | <0.000 | 5.97 | ↑ |
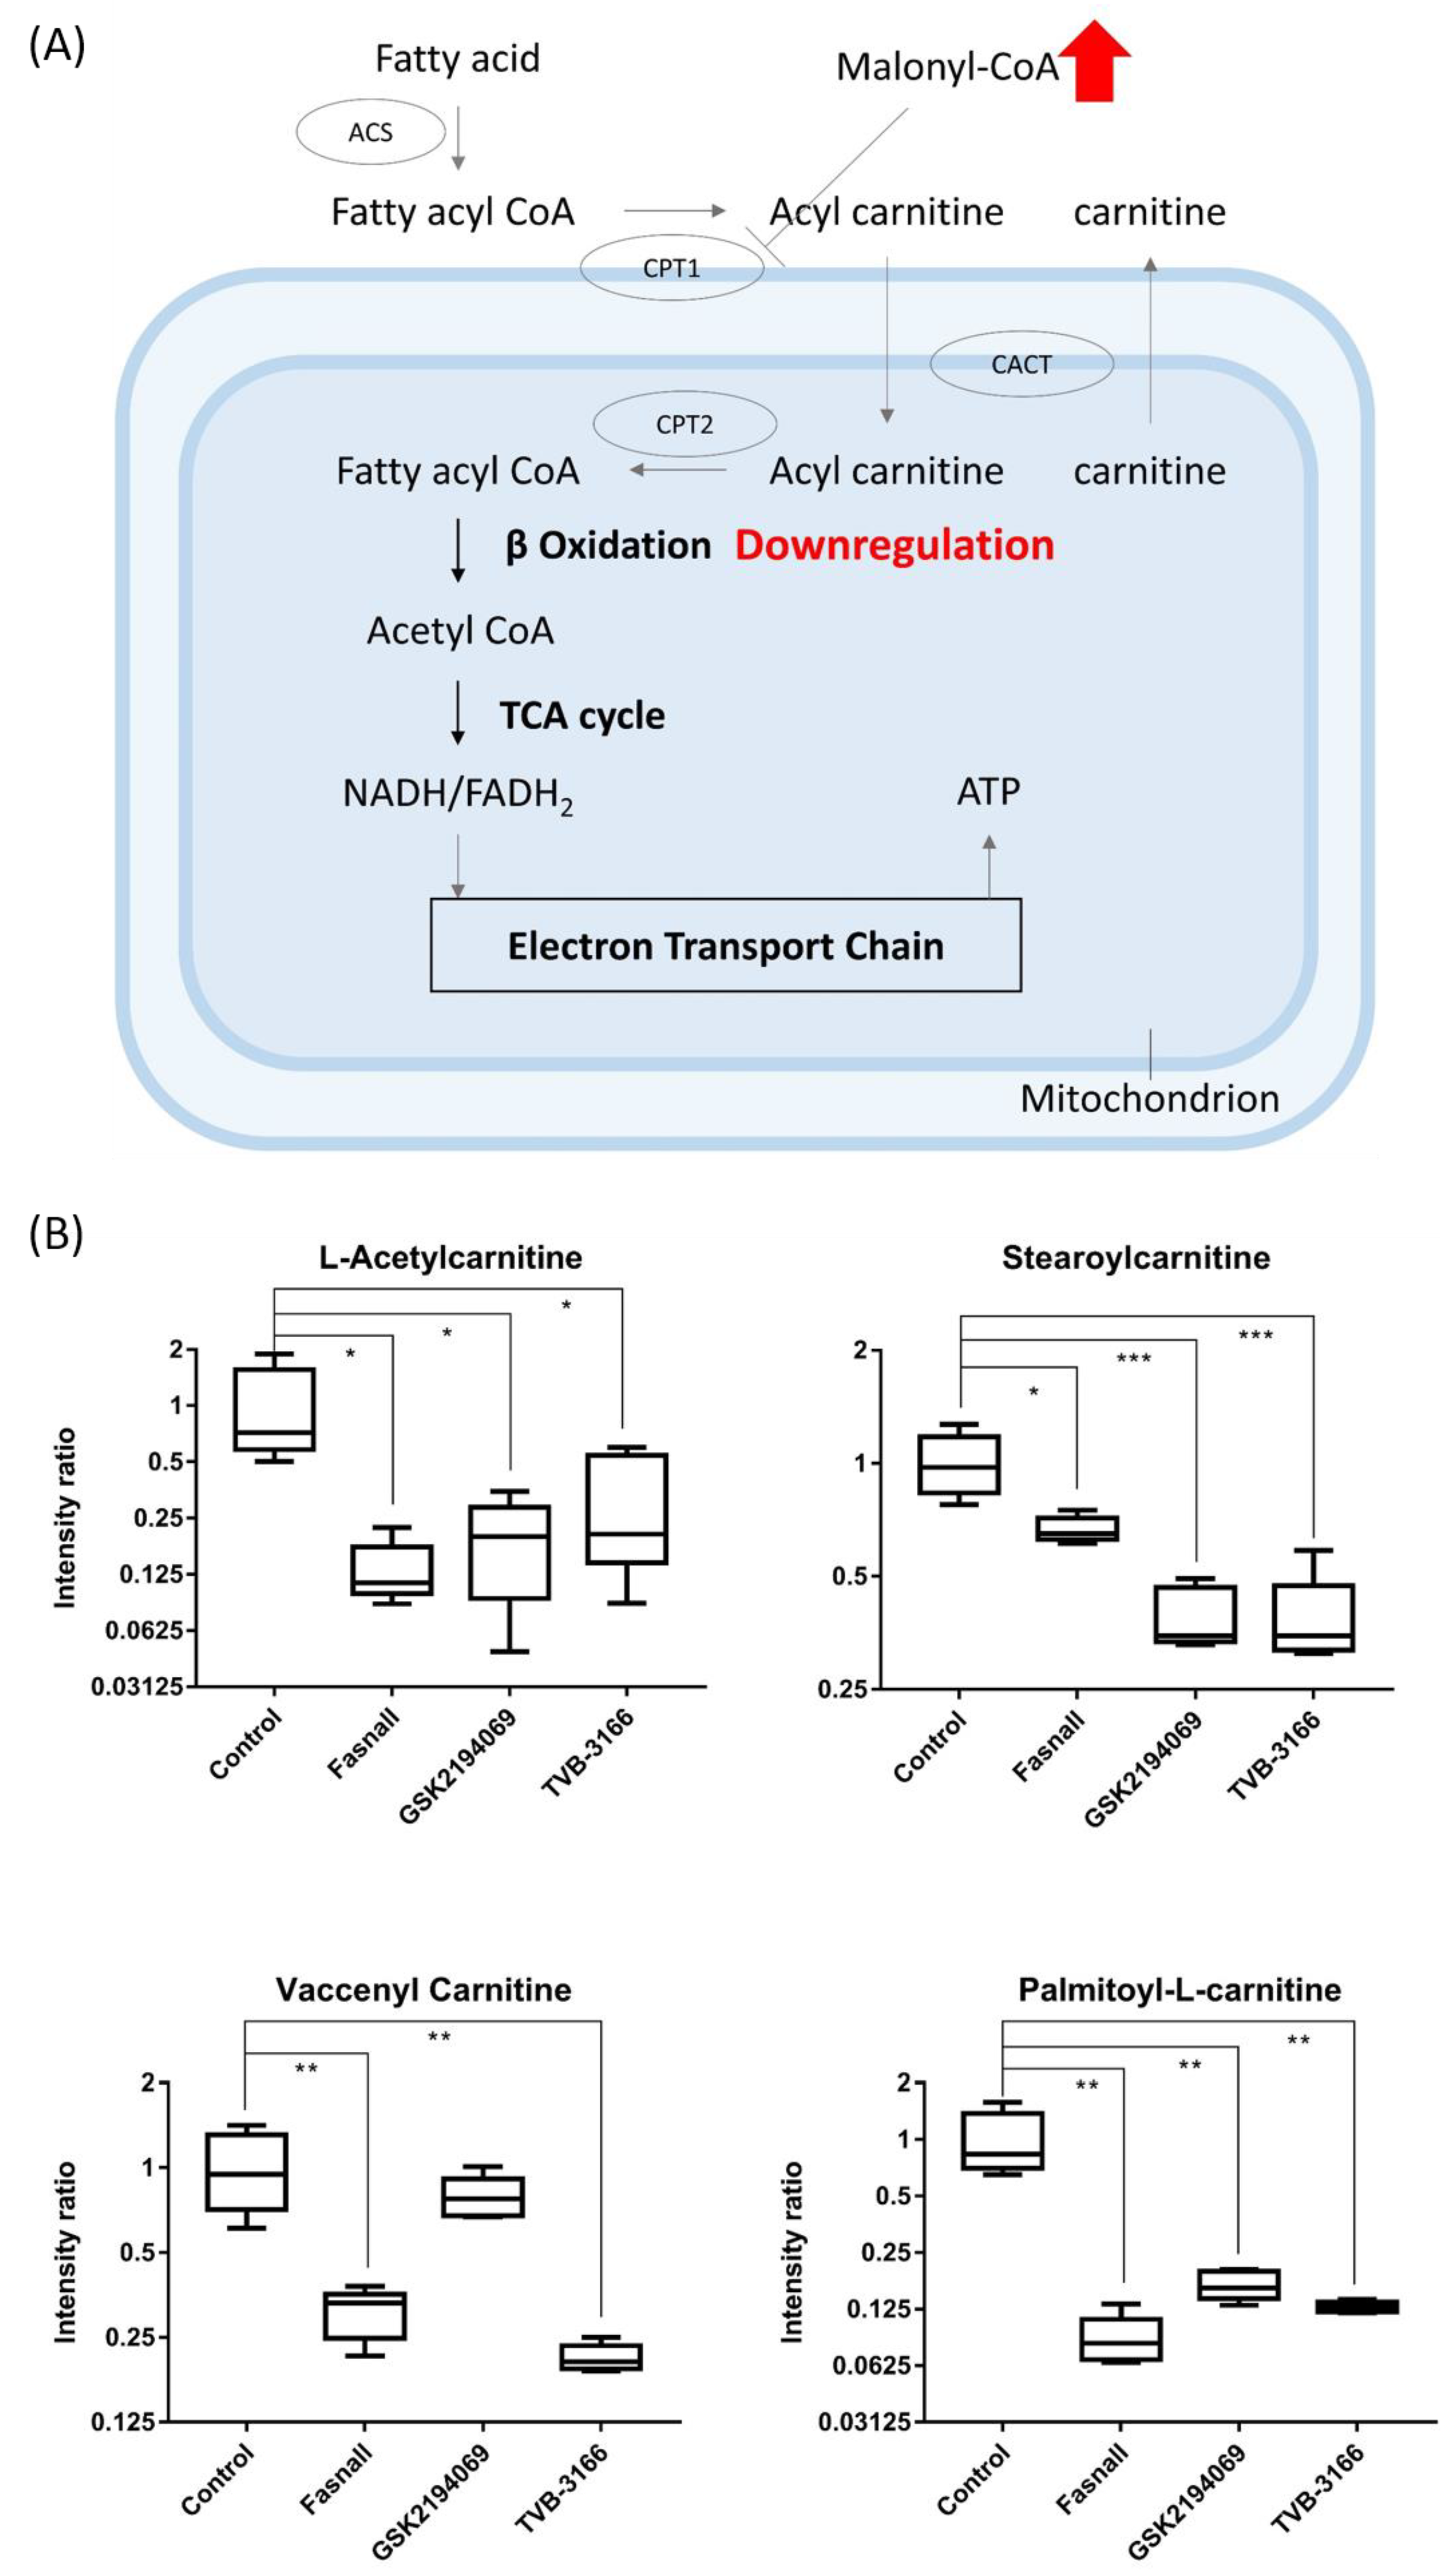
| Acetylcarnitine | 203.12 | 0.027 | 0.13 | ↓ | 0.032 | 0.19 | ↓ | 0.036 | 0.32 | ↓ |
| Adenosine monophosphate | 347.06 | 0.001 | 17.03 | ↑ | 0.010 | 3.04 | ↑ | <0.000 | 27.34 | ↑ |
| Alpha-Cehc | 278.15 | 0.570 | 0.93 | 0.005 | 0.47 | ↓ | 0.005 | 0.55 | ↓ | |
| Arachidonic acid | 304.24 | <0.000 | 3.41 | 0.151 | 1.33 | 0.025 | 2.00 | ↑ | ||
| Asparaginyl-Proline | 229.09 | 0.006 | 0.69 | <0.000 | 6.12 | ↑ | 0.003 | 1.44 | ↑ | |
| Citric acid | 192.03 | <0.000 | 0.21 | ↓ | <0.000 | 3.21 | ↑ | 0.058 | 0.77 | |
| Cyclic AMP | 329.07 | 0.055 | 2.04 | 0.021 | 2.86 | ↑ | 0.044 | 2.81 | ↑ | |
| Docosapentaenoic acid | 330.25 | <0.000 | 6.66 | ↑ | 0.015 | 1.23 | ↑ | 0.006 | 2.65 | ↑ |
| Elaidylphosphocholine | 433.33 | 0.032 | 1.45 | ↑ | 0.002 | 1.68 | ↑ | <0.000 | 30.41 | ↑ |
| Glutamic acid | 147.05 | 0.001 | 4.45 | ↑ | <0.000 | 4.30 | ↑ | 0.001 | 6.11 | ↑ |
| Grifolin | 328.24 | <0.000 | 2.70 | ↑ | 0.190 | 1.14 | 0.008 | 1.36 | ↑ | |
| Lauroyl diethanolamide | 287.25 | 0.124 | 0.76 | <0.000 | 0.28 | ↓ | 0.008 | 0.45 | ↓ | |
| Leucine | 131.07 | 0.393 | 1.17 | 0.965 | 1.01 | 0.011 | 1.64 | ↑ | ||
| Linolenic acid | 278.19 | 0.517 | 0.92 | 0.001 | 0.47 | ↓ | 0.007 | 0.56 | ↓ | |
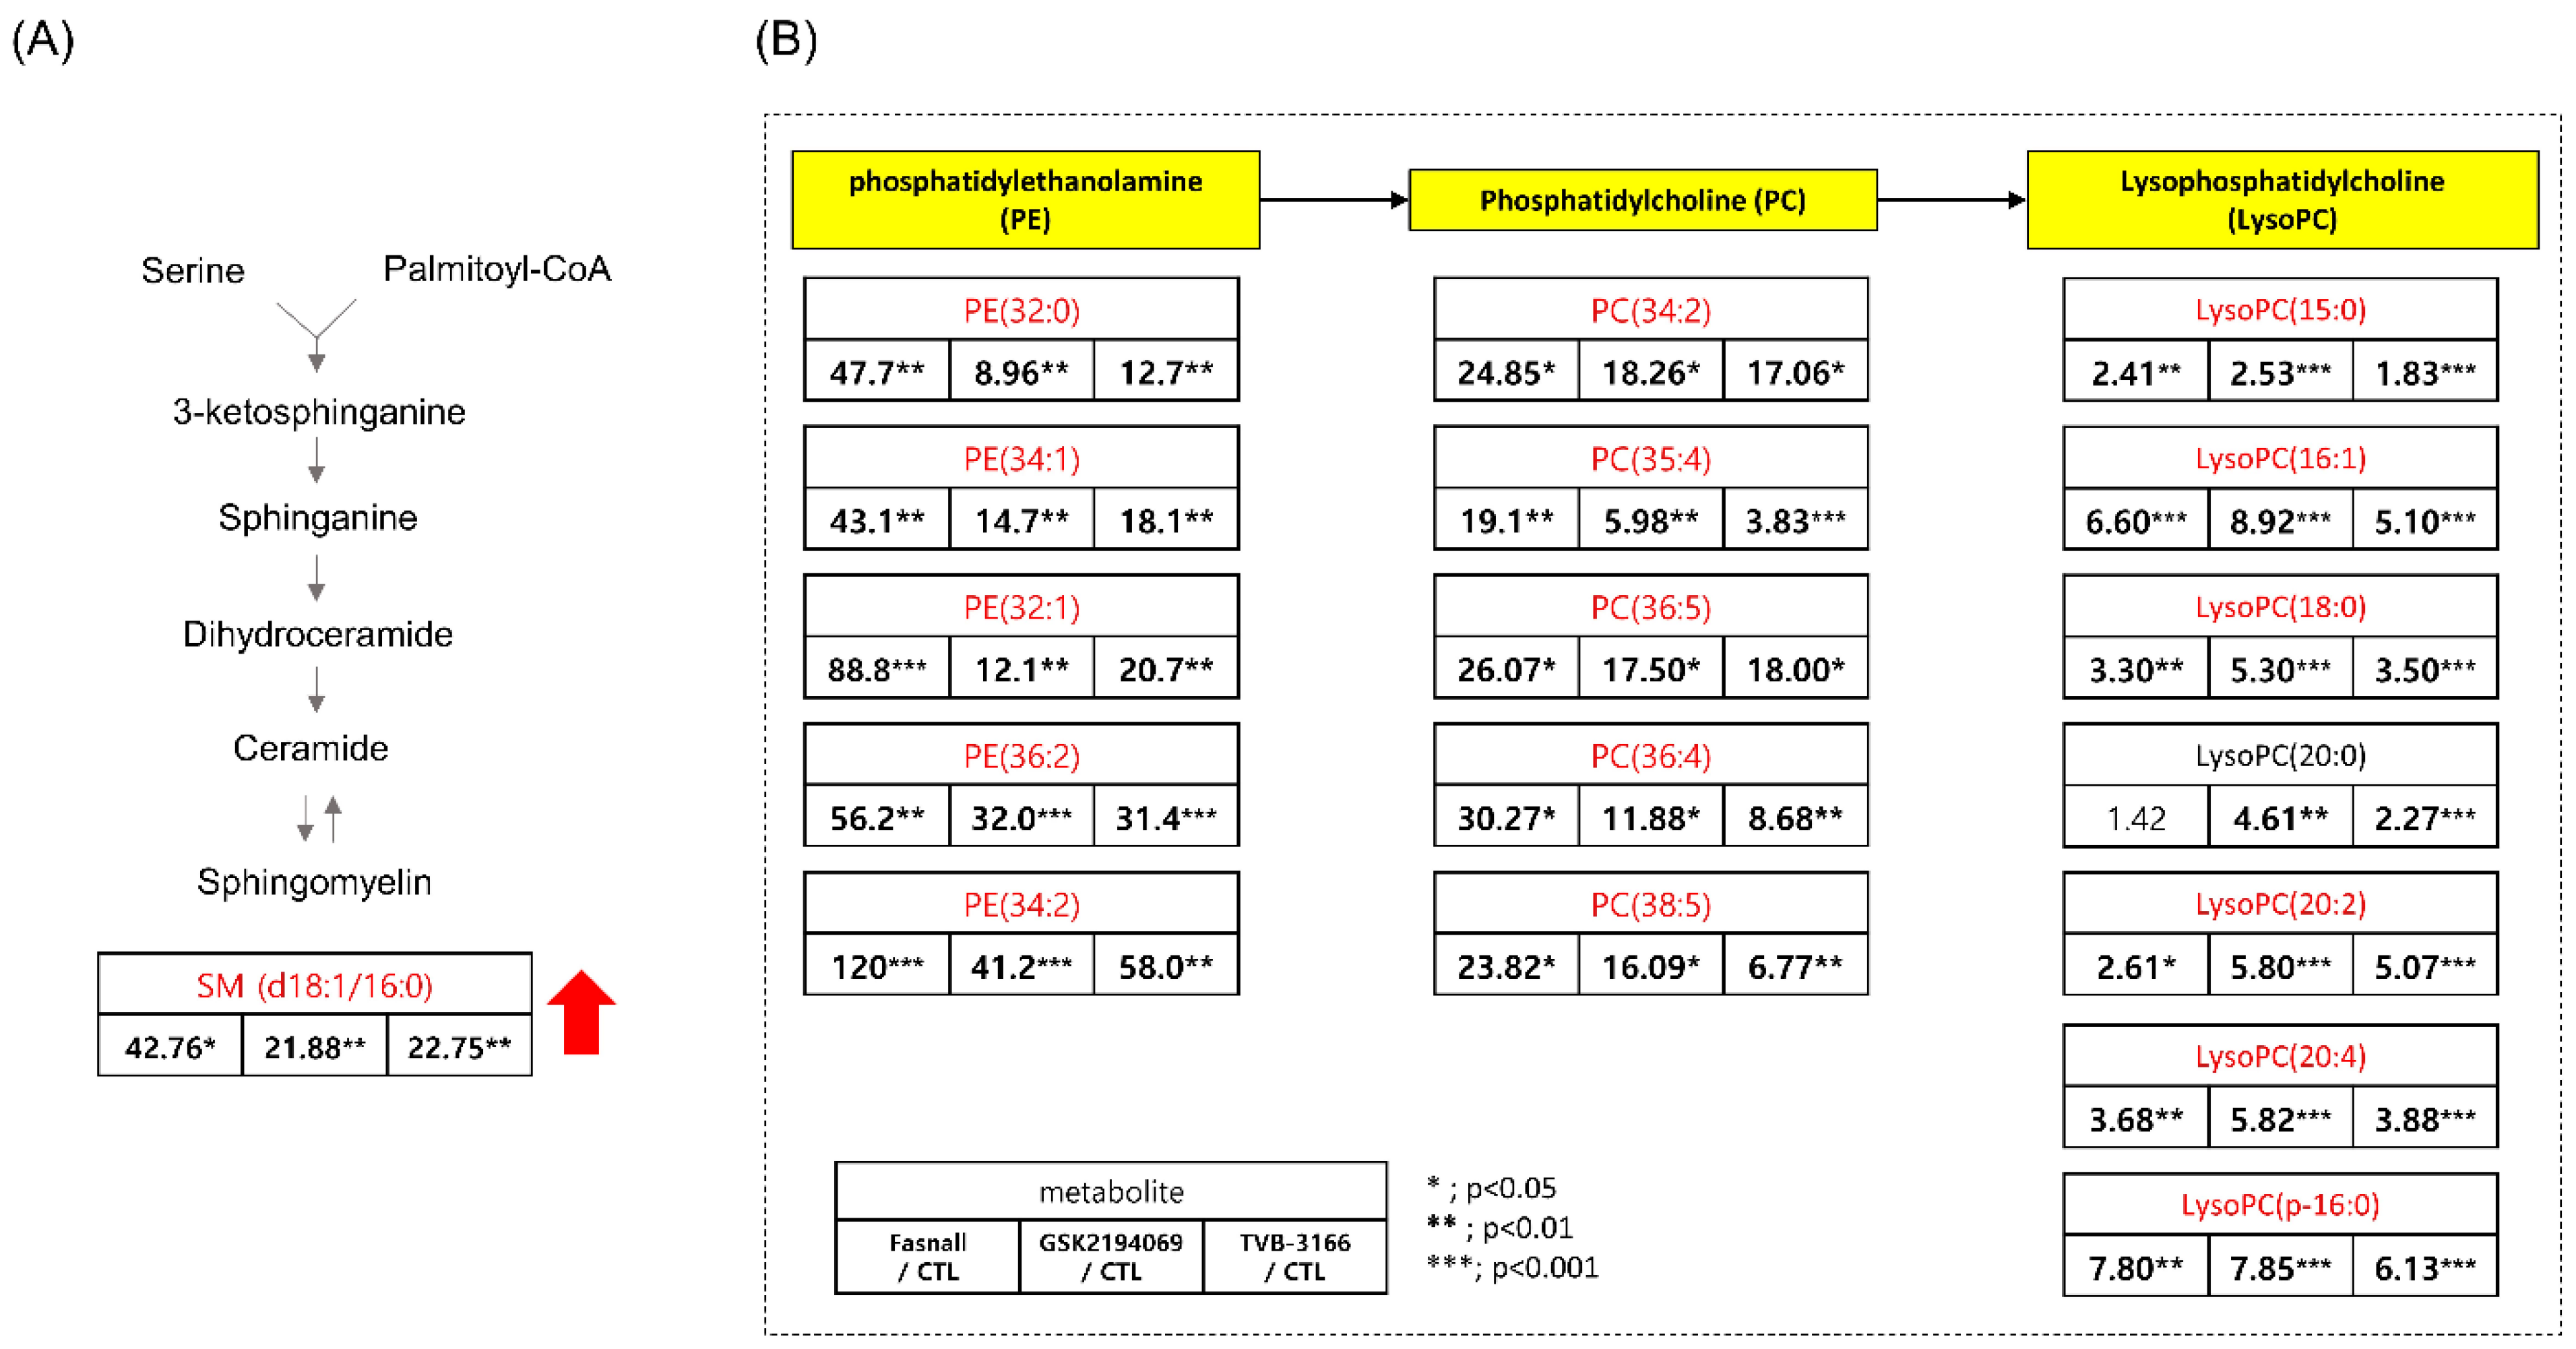
| LysoPC(15:0) | 481.31 | 0.001 | 2.41 | ↑ | <0.000 | 2.53 | ↑ | 0.009 | 1.83 | ↑ |
| LysoPC(16:0) | 495.33 | <0.000 | 2.27 | ↑ | 0.001 | 2.18 | ↑ | 0.002 | 1.76 | ↑ |
| LysoPC(16:1) | 493.32 | <0.000 | 6.60 | ↑ | <0.000 | 8.92 | ↑ | <0.000 | 5.10 | ↑ |
| LysoPC(20:2) | 547.36 | 0.011 | 2.61 | ↑ | <0.000 | 5.80 | ↑ | <0.000 | 5.07 | ↑ |
| LysoPC(20:4) | 543.33 | 0.002 | 3.68 | ↑ | <0.000 | 5.82 | ↑ | <0.000 | 3.88 | ↑ |
| LysoPC(22:2) | 635.34 | 0.075 | 1.35 | <0.000 | 2.04 | ↑ | 0.064 | 1.27 | ||
| LysoPC(P-16:0) | 539.32 | 0.001 | 7.80 | ↑ | <0.000 | 7.85 | ↑ | <0.000 | 6.13 | ↑ |
| LysoPC(P-18:1) | 565.33 | 0.116 | 1.56 | 0.011 | 1.74 | ↑ | 0.023 | 2.15 | ↑ | |
| LysoPE(0:0/20:1) | 567.35 | <0.000 | 3.19 | ↑ | <0.000 | 4.56 | ↑ | <0.000 | 2.93 | ↑ |
| LysoPE(0:0/24:6) | 613.33 | 0.018 | 1.83 | ↑ | <0.000 | 2.14 | ↑ | 0.048 | 1.37 | ↑ |
| LysoPE(20:2/0:0) | 505.31 | 0.657 | 0.92 | 0.001 | 1.48 | ↑ | 0.020 | 1.59 | ↑ | |
| LysoPE(22:2/0:0) | 593.37 | 0.007 | 2.27 | ↑ | <0.000 | 6.04 | ↑ | 0.001 | 6.00 | ↑ |
| Malic acid | 134.02 | <0.000 | 2.69 | ↑ | 0.641 | 1.09 | 0.004 | 4.67 | ↑ | |
| MG(0:0/20:4/0:0) | 378.27 | 0.001 | 2.97 | ↑ | 0.028 | 0.63 | ↓ | 0.001 | 5.61 | ↑ |
| N1-acetyl spermidine | 187.17 | 0.001 | 32.29 | ↑ | 0.019 | 2.20 | ↑ | <0.000 | 17.89 | ↑ |
| N-Acetyl-L-aspartic acid | 175.05 | 0.646 | 1.09 | 0.033 | 1.34 | ↑ | <0.000 | 2.14 | ↑ | |
| Palmitic amide | 255.26 | 0.194 | 1.18 | 0.029 | 0.64 | ↓ | 0.068 | 0.64 | ||
| Palmitoyl-L-carnitine | 399.33 | 0.006 | 0.09 | ↓ | 0.008 | 0.17 | ↓ | 0.007 | 0.13 | ↓ |
| PC(16:0/18:1) | 759.58 | 0.033 | 2.62 | ↑ | 0.409 | 1.53 | 0.270 | 1.55 | ||
| PC(16:0/18:2) | 757.56 | 0.030 | 24.85 | ↑ | 0.012 | 18.26 | ↑ | 0.028 | 17.06 | ↑ |
| PC(16:0/20:4) | 781.56 | 0.015 | 30.27 | ↑ | 0.012 | 11.88 | ↑ | 0.004 | 8.68 | ↑ |
| PC(18:0) | 523.36 | 0.001 | 2.40 | ↑ | 0.014 | 3.01 | ↑ | 0.071 | 1.86 | |
| PC(19:1(9Z)/0:0) | 595.38 | <0.000 | 4.97 | ↑ | <0.000 | 9.31 | ↑ | <0.000 | 5.06 | ↑ |
| PC(21:4(6Z,9Z,12Z,15Z)/0:0) | 617.36 | 0.232 | 1.38 | <0.000 | 4.46 | ↑ | 0.023 | 0.79 | ↓ | |
| PC(38:5) | 807.58 | 0.042 | 23.82 | ↑ | 0.010 | 16.09 | ↑ | 0.008 | 6.77 | ↑ |
| PE (16:0) | 453.28 | <0.000 | 3.22 | ↑ | <0.000 | 2.74 | ↑ | <0.000 | 3.44 | ↑ |
| PE(18:1(9Z)/0:0) | 479.30 | <0.000 | 3.24 | ↑ | <0.000 | 3.29 | ↑ | 0.001 | 2.64 | ↑ |
| PE(22:4(7Z,10Z,13Z,16Z)/15:0) | 753.53 | 0.023 | 73.19 | ↑ | 0.018 | 28.26 | ↑ | 0.013 | 34.66 | ↑ |
| PE(P-18:0/18:2(9Z,12Z)) | 727.51 | 0.025 | 32.51 | ↑ | 0.021 | 6.65 | ↑ | 0.005 | 9.13 | ↑ |
| Prostaglandin A2 | 334.29 | <0.000 | 3.97 | ↑ | 0.004 | 2.02 | ↑ | <0.000 | 6.86 | ↑ |
| PS(18:1(9Z)/0:0) | 523.29 | 0.171 | 1.49 | 0.120 | 1.48 | 0.006 | 0.50 | ↓ | ||
| S-(2-Hydroxyethyl)glutathione | 351.05 | 0.182 | 1.45 | 0.135 | 1.36 | 0.050 | 1.48 | ↑ | ||
| SM (d18:1/16:0) | 702.57 | 0.016 | 42.76 | ↑ | 0.009 | 21.88 | ↑ | 0.004 | 22.75 | ↑ |
| spermidine | 145.16 | <0.000 | 0.06 | ↓ | <0.000 | 0.02 | ↓ | <0.000 | 0.01 | ↓ |
| Stearic acid | 284.27 | 0.008 | 1.45 | ↑ | <0.000 | 1.76 | ↑ | 0.119 | 1.41 | |
| Stearoylcarnitine | 426.37 | 0.015 | 0.67 | ↓ | <0.000 | 0.39 | ↓ | <0.000 | 0.39 | ↓ |
| Tetracosapentaenoic acid | 358.28 | 0.241 | 1.16 | 0.001 | 3.59 | ↑ | 0.067 | 0.83 | ||
| Tetracosatetraenoic acid (24:4n-6) | 360.30 | 0.081 | 0.82 | 0.021 | 1.48 | ↑ | 0.002 | 2.29 | ↑ | |
| Vaccenic acid | 282.25 | 0.003 | 2.36 | ↑ | 0.128 | 1.46 | 0.001 | 2.39 | ↑ | |
| Vaccenyl Carnitine | 425.35 | 0.007 | 0.31 | ↓ | 0.215 | 0.79 | 0.005 | 0.21 | ↓ | |
References
- Maier, T.; Leibundgut, M.; Ban, N. The crystal structure of a mammalian fatty acid synthase. Science 2008, 321, 1315–1322. [Google Scholar] [CrossRef] [PubMed]
- Benjamin, D.I.; Li, D.S.; Lowe, W.; Heuer, T.; Kemble, G.; Nomura, D.K. Diacylglycerol Metabolism and Signaling Is a Driving Force Underlying FASN Inhibitor Sensitivity in Cancer Cells. ACS Chem. Biol. 2015, 10, 1616–1623. [Google Scholar] [CrossRef] [PubMed]
- Menendez, J.A.; Lupu, R. Fatty acid synthase and the lipogenic phenotype in cancer pathogenesis. Nat. Rev. Cancer 2007, 7, 763–777. [Google Scholar] [CrossRef] [PubMed]
- Ventura, R.; Mordec, K.; Waszczuk, J.; Wang, Z.; Lai, J.; Fridlib, M.; Buckley, D.; Kemble, G.; Heuer, T.S. Inhibition of de novo Palmitate Synthesis by Fatty Acid Synthase Induces Apoptosis in Tumor Cells by Remodeling Cell Membranes, Inhibiting Signaling Pathways, and Reprogramming Gene Expression. EBioMedicine 2015, 2, 808–824. [Google Scholar] [CrossRef] [PubMed]
- Pandey, P.R.; Liu, W.; Xing, F.; Fukuda, K.; Watabe, K. Anti-cancer drugs targeting fatty acid synthase (FAS). Recent Pat. Anticancer Drug Discov. 2012, 7, 185–197. [Google Scholar] [CrossRef] [PubMed]
- Epstein, J.I.; Carmichael, M.; Partin, A.W. OA-519 (fatty acid synthase) as an independent predictor of pathologic state in adenocarcinoma of the prostate. Urology 1995, 45, 81–86. [Google Scholar] [CrossRef]
- Gansler, T.S.; Hardman, W., 3rd; Hunt, D.A.; Schaffel, S.; Hennigar, R.A. Increased expression of fatty acid synthase (OA-519) in ovarian neoplasms predicts shorter survival. Hum. Pathol. 1997, 28, 686–692. [Google Scholar] [CrossRef]
- Kearney, K.E.; Pretlow, T.G.; Pretlow, T.P. Increased expression of fatty acid synthase in human aberrant crypt foci: Possible target for colorectal cancer prevention. Int. J. Cancer 2009, 125, 249–252. [Google Scholar] [CrossRef]
- Kusakabe, T.; Nashimoto, A.; Honma, K.; Suzuki, T. Fatty acid synthase is highly expressed in carcinoma, adenoma and in regenerative epithelium and intestinal metaplasia of the stomach. Histopathology 2002, 40, 71–79. [Google Scholar] [CrossRef]
- Pizer, E.S.; Jackisch, C.; Wood, F.D.; Pasternack, G.R.; Davidson, N.E.; Kuhajda, F.P. Inhibition of fatty acid synthesis induces programmed cell death in human breast cancer cells. Cancer Res. 1996, 56, 2745–2747. [Google Scholar]
- Flavin, R.; Peluso, S.; Nguyen, P.L.; Loda, M. Fatty acid synthase as a potential therapeutic target in cancer. Future Oncol. 2010, 6, 551–562. [Google Scholar] [CrossRef]
- Rohrig, F.; Schulze, A. The multifaceted roles of fatty acid synthesis in cancer. Nat. Rev. Cancer 2016, 16, 732–749. [Google Scholar] [CrossRef] [PubMed]
- Goodpaster, B.H.; Sparks, L.M. Metabolic Flexibility in Health and Disease. Cell Metab. 2017, 25, 1027–1036. [Google Scholar] [CrossRef] [PubMed]
- Berridge, M.V.; Herst, P.M.; Tan, A.S. Metabolic flexibility and cell hierarchy in metastatic cancer. Mitochondrion 2010, 10, 584–588. [Google Scholar] [CrossRef] [PubMed]
- Boroughs, L.K.; DeBerardinis, R.J. Metabolic pathways promoting cancer cell survival and growth. Nat. Cell Biol. 2015, 17, 351–359. [Google Scholar] [CrossRef]
- Obre, E.; Rossignol, R. Emerging concepts in bioenergetics and cancer research: Metabolic flexibility, coupling, symbiosis, switch, oxidative tumors, metabolic remodeling, signaling and bioenergetic therapy. Int. J. Biochem. Cell Biol. 2015, 59, 167–181. [Google Scholar] [CrossRef]
- Smith, R.L.; Soeters, M.R.; Wüst, R.C.I.; Houtkooper, R.H. Metabolic Flexibility as an Adaptation to Energy Resources and Requirements in Health and Disease. Endocr. Rev. 2018, 39, 489–517. [Google Scholar] [CrossRef]
- Fiehn, O. Metabolomics—The link between genotypes and phenotypes. Plant Mol. Biol. 2002, 48, 155–171. [Google Scholar] [CrossRef]
- Yeung, P.K. Metabolomics and Biomarkers for Drug Discovery. Metabolites 2018, 8, 11. [Google Scholar] [CrossRef]
- Rankin, N.J.; Preiss, D.; Welsh, P.; Sattar, N. Applying metabolomics to cardiometabolic intervention studies and trials: Past experiences and a roadmap for the future. Int. J. Epidemiol. 2016, 45, 1351–1371. [Google Scholar] [CrossRef]
- Wishart, D.S. Emerging applications of metabolomics in drug discovery and precision medicine. Nat. Rev. Drug Discov. 2016, 15, 473–484. [Google Scholar] [CrossRef] [PubMed]
- Kell, D.B. Systems biology, metabolic modelling and metabolomics in drug discovery and development. Drug Discov. Today 2006, 11, 1085–1092. [Google Scholar] [CrossRef] [PubMed]
- Menendez, J.A.; Lupu, R. Fatty acid synthase (FASN) as a therapeutic target in breast cancer. Expert Opin. Ther. Targets 2017, 21, 1001–1016. [Google Scholar] [CrossRef] [PubMed]
- Hardwicke, M.A.; Rendina, A.R.; Williams, S.P.; Moore, M.L.; Wang, L.; Krueger, J.A.; Plant, R.N.; Totoritis, R.D.; Zhang, G.; Briand, J.; et al. A human fatty acid synthase inhibitor binds beta-ketoacyl reductase in the keto-substrate site. Nat. Chem. Biol. 2014, 10, 774–779. [Google Scholar] [CrossRef] [PubMed]
- Alwarawrah, Y.; Hughes, P.; Loiselle, D.; Carlson, D.A.; Darr, D.B.; Jordan, J.L.; Xiong, J.; Hunter, L.M.; Dubois, L.G.; Thompson, J.W.; et al. Fasnall, a Selective FASN Inhibitor, Shows Potent Anti-tumor Activity in the MMTV-Neu Model of HER2(+) Breast Cancer. Cell Chem. Biol. 2016, 23, 678–688. [Google Scholar] [CrossRef] [PubMed]
- Alsabeeh, N.; Chausse, B.; Kakimoto, P.A.; Kowaltowski, A.J.; Shirihai, O. Cell culture models of fatty acid overload: Problems and solutions. Biochim. Biophys. Acta Mol. Cell Biol. Lipids 2018, 1863, 143–151. [Google Scholar] [CrossRef]
- Lee, H.; Choi, J.M.; Cho, J.-Y.; Kim, T.-E.; Lee, H.J.; Jung, B.H. Regulation of endogenic metabolites by rosuvastatin in hyperlipidemia patients: An integration of metabolomics and lipidomics. Chem. Phys. Lipids 2018, 214, 69–83. [Google Scholar] [CrossRef]
- Chong, J.; Wishart, D.S.; Xia, J. Using MetaboAnalyst 4.0 for Comprehensive and Integrative Metabolomics Data Analysis. Curr. Protoc. Bioinform. 2019, 68, e86. [Google Scholar] [CrossRef]
- Mashima, T.; Seimiya, H.; Tsuruo, T. De novo fatty-acid synthesis and related pathways as molecular targets for cancer therapy. Br. J. Cancer 2009, 100, 1369–1372. [Google Scholar] [CrossRef]
- McGarry, J.D.; Brown, N.F. The mitochondrial carnitine palmitoyltransferase system. From concept to molecular analysis. Eur. J. Biochem. 1997, 244, 1–14. [Google Scholar] [CrossRef]
- Qu, Q.; Zeng, F.; Liu, X.; Wang, Q.J.; Deng, F. Fatty acid oxidation and carnitine palmitoyltransferase I: Emerging therapeutic targets in cancer. Cell Death Dis. 2016, 7, e2226. [Google Scholar] [CrossRef]
- Jin, Y.J.; Li, S.Z.; Zhao, Z.S.; An, J.J.; Kim, R.Y.; Kim, Y.M.; Baik, J.H.; Lim, S.K. Carnitine palmitoyltransferase-1 (CPT-1) activity stimulation by cerulenin via sympathetic nervous system activation overrides cerulenin’s peripheral effect. Endocrinology 2004, 145, 3197–3204. [Google Scholar] [CrossRef] [PubMed]
- Houten, S.M.; Wanders, R.J. A general introduction to the biochemistry of mitochondrial fatty acid beta-oxidation. J. Inherit. Metab Dis. 2010, 33, 469–477. [Google Scholar] [CrossRef]
- Sun, Y.; Jia, X.; Hou, L.; Liu, X.; Gao, Q. Involvement of apoptotic pathways in docosahexaenoic acid-induced benefit in prostate cancer: Pathway-focused gene expression analysis using RT(2) Profile PCR Array System. Lipids Health Dis. 2017, 16, 59. [Google Scholar] [CrossRef]
- Goto, T.; Terada, N.; Inoue, T.; Kobayashi, T.; Nakayama, K.; Okada, Y.; Yoshikawa, T.; Miyazaki, Y.; Uegaki, M.; Utsunomiya, N.; et al. Decreased expression of lysophosphatidylcholine (16:0/OH) in high resolution imaging mass spectrometry independently predicts biochemical recurrence after surgical treatment for prostate cancer. Prostate 2015, 75, 1821–1830. [Google Scholar] [CrossRef] [PubMed]
- Mullen, T.D.; Obeid, L.M. Ceramide and apoptosis: Exploring the enigmatic connections between sphingolipid metabolism and programmed cell death. Anticancer Agents Med. Chem. 2012, 12, 340–363. [Google Scholar] [CrossRef] [PubMed]
- Von Holtz, R.L.; Fink, C.S.; Awad, A.B. beta-Sitosterol activates the sphingomyelin cycle and induces apoptosis in LNCaP human prostate cancer cells. Nutr. Cancer 1998, 32, 8–12. [Google Scholar] [CrossRef] [PubMed]
- Huang, W.C.; Chen, C.L.; Lin, Y.S.; Lin, C.F. Apoptotic sphingolipid ceramide in cancer therapy. J. Lipids 2011, 2011, 565316. [Google Scholar] [CrossRef]
- Nowotarski, S.L.; Woster, P.M.; Casero, R.A., Jr. Polyamines and cancer: Implications for chemotherapy and chemoprevention. Expert Rev. Mol. Med. 2013, 15, e3. [Google Scholar] [CrossRef]
- Persson, L.; Rosengren, E. Increased formation of N1-acetylspermidine in human breast cancer. Cancer Lett. 1989, 45, 83–86. [Google Scholar] [CrossRef]
- Takenoshita, S.; Matsuzaki, S.; Nakano, G.; Kimura, H.; Hoshi, H.; Shoda, H.; Nakamura, T. Selective elevation of the N1-acetylspermidine level in human colorectal adenocarcinomas. Cancer Res. 1984, 44, 845–847. [Google Scholar] [PubMed]
- Blankenship, J.; Walle, T. Acetylation of spermidine and spermine by rat liver and kidney chromatin. Arch. Biochem. Biophys. 1977, 179, 235–242. [Google Scholar] [CrossRef]
- Casero, R.A., Jr.; Murray Stewart, T.; Pegg, A.E. Polyamine metabolism and cancer: Treatments, challenges and opportunities. Nat. Rev. Cancer 2018, 18, 681–695. [Google Scholar] [CrossRef] [PubMed]
- Tkachenko, A.; Nesterova, L.; Pshenichnov, M. The role of the natural polyamine putrescine in defense against oxidative stress in Escherichia coli. Arch. Microbiol. 2001, 176, 155–157. [Google Scholar] [CrossRef] [PubMed]
- Danzin, C.; Bolkenius, F.N.; Claverie, N.; Wagner, J.; Grove, J. Secretin-induced accumulation of N1-acetylspermidine and putrescine in the rat pancreas. Biochem. Biophys. Res. Commun. 1982, 109, 1234–1239. [Google Scholar] [CrossRef]
- Ioannidis, N.E.; Sfichi, L.; Kotzabasis, K. Putrescine stimulates chemiosmotic ATP synthesis. Biochim. Biophys. Acta 2006, 1757, 821–828. [Google Scholar] [CrossRef]
- Bardocz, S.; Grant, G.; Brown, D.S.; Pusztai, A. Putrescine as a source of instant energy in the small intestine of the rat. Gut 1998, 42, 24–28. [Google Scholar] [CrossRef]
- Dolce, V.; Cappello, A.R.; Lappano, R.; Maggiolini, M. Glycerophospholipid synthesis as a novel drug target against cancer. Curr. Mol. Pharmacol. 2011, 4, 167–175. [Google Scholar] [CrossRef]
- Kennedy, E.P.; Weiss, S.B. The function of cytidine coenzymes in the biosynthesis of phospholipides. J. Biol. Chem. 1956, 222, 193–214. [Google Scholar]
- Van der Veen, J.N.; Kennelly, J.P.; Wan, S.; Vance, J.E.; Vance, D.E.; Jacobs, R.L. The critical role of phosphatidylcholine and phosphatidylethanolamine metabolism in health and disease. Biochim. Biophys. Acta Biomembr. 2017, 1859, 1558–1572. [Google Scholar] [CrossRef]
- Cheng, M.; Bhujwalla, Z.M.; Glunde, K. Targeting Phospholipid Metabolism in Cancer. Front. Oncol. 2016, 6, 266. [Google Scholar] [CrossRef] [PubMed]
- Müller, S.A.; Holzapfel, K.; Seidl, C.; Treiber, U.; Krause, B.J.; Senekowitsch-Schmidtke, R. Characterization of choline uptake in prostate cancer cells following bicalutamide and docetaxel treatment. Eur. J. Nucl. Med. Mol. Imaging 2009, 36, 1434–1442. [Google Scholar] [CrossRef] [PubMed]
- Saiki, I.; Yara, M.; Yamanaka, T.; Uchino, H.; Inazu, M. Functional Expression of Choline Transporter-Like Protein 1 in LNCaP Prostate Cancer Cells: A Novel Molecular Target. Biomol. Ther. 2020, 28, 195–201. [Google Scholar] [CrossRef] [PubMed]
- Lands, W.E. Metabolism of glycerolipides; a comparison of lecithin and triglyceride synthesis. J. Biol. Chem. 1958, 231, 883–888. [Google Scholar] [PubMed]
- Balsinde, J.; Winstead, M.V.; Dennis, E.A. Phospholipase A2 regulation of arachidonic acid mobilization. FEBS Lett. 2002, 531, 2–6. [Google Scholar] [CrossRef]
- Walther, T.C.; Farese, R.V., Jr. Lipid Droplets and Cellular Lipid Metabolism. Annu. Rev. Biochem. 2012, 81, 687–714. [Google Scholar] [CrossRef] [PubMed]
- Dennis, E.A.; Norris, P.C. Eicosanoid storm in infection and inflammation. Nat. Rev. Immunol. 2015, 15, 511–523. [Google Scholar] [CrossRef]
- Sołtysik, K.; Ohsaki, Y.; Tatematsu, T.; Cheng, J.; Fujimoto, T. Nuclear lipid droplets derive from a lipoprotein precursor and regulate phosphatidylcholine synthesis. Nat. Commun. 2019, 10, 473. [Google Scholar] [CrossRef]
- Tan, Z.; Xiao, L.; Tang, M.; Bai, F.; Li, J.; Li, L.; Shi, F.; Li, N.; Li, Y.; Du, Q.; et al. Targeting CPT1A-mediated fatty acid oxidation sensitizes nasopharyngeal carcinoma to radiation therapy. Theranostics 2018, 8, 2329–2347. [Google Scholar] [CrossRef]
- Lundsgaard, A.M.; Fritzen, A.M.; Nicolaisen, T.S.; Carl, C.S.; Sjoberg, K.A.; Raun, S.H.; Klein, A.B.; Sanchez-Quant, E.; Langer, J.; Orskov, C.; et al. Glucometabolic consequences of acute and prolonged inhibition of fatty acid oxidation. J. Lipid Res. 2020, 61, 10–19. [Google Scholar] [CrossRef]


Publisher’s Note: MDPI stays neutral with regard to jurisdictional claims in published maps and institutional affiliations. |
© 2020 by the authors. Licensee MDPI, Basel, Switzerland. This article is an open access article distributed under the terms and conditions of the Creative Commons Attribution (CC BY) license (http://creativecommons.org/licenses/by/4.0/).
Share and Cite
Oh, J.E.; Jung, B.H.; Park, J.; Kang, S.; Lee, H. Deciphering Fatty Acid Synthase Inhibition-Triggered Metabolic Flexibility in Prostate Cancer Cells through Untargeted Metabolomics. Cells 2020, 9, 2447. https://doi.org/10.3390/cells9112447
Oh JE, Jung BH, Park J, Kang S, Lee H. Deciphering Fatty Acid Synthase Inhibition-Triggered Metabolic Flexibility in Prostate Cancer Cells through Untargeted Metabolomics. Cells. 2020; 9(11):2447. https://doi.org/10.3390/cells9112447
Chicago/Turabian StyleOh, Ju Eun, Byung Hwa Jung, Jinyoung Park, Soosung Kang, and Hyunbeom Lee. 2020. "Deciphering Fatty Acid Synthase Inhibition-Triggered Metabolic Flexibility in Prostate Cancer Cells through Untargeted Metabolomics" Cells 9, no. 11: 2447. https://doi.org/10.3390/cells9112447
APA StyleOh, J. E., Jung, B. H., Park, J., Kang, S., & Lee, H. (2020). Deciphering Fatty Acid Synthase Inhibition-Triggered Metabolic Flexibility in Prostate Cancer Cells through Untargeted Metabolomics. Cells, 9(11), 2447. https://doi.org/10.3390/cells9112447