Intragenic MicroRNAs Autoregulate Their Host Genes in Both Direct and Indirect Ways—A Cross-Species Analysis


Abstract
1. Introduction
2. Materials and Methods
2.1. Annotation and Mapping of MicroRNAs and Genes
2.2. Protein-Protein Interactions, Functional Enrichment and Pathway Analyses of Host Genes
2.3. Intragenic miRNA Target Prediction
2.4. Iterative Randomized Model (IRM)
2.5. Essentiality of Host Genes
2.6. Community Detection
2.7. Data Analysis and Graphical Representation
3. Results
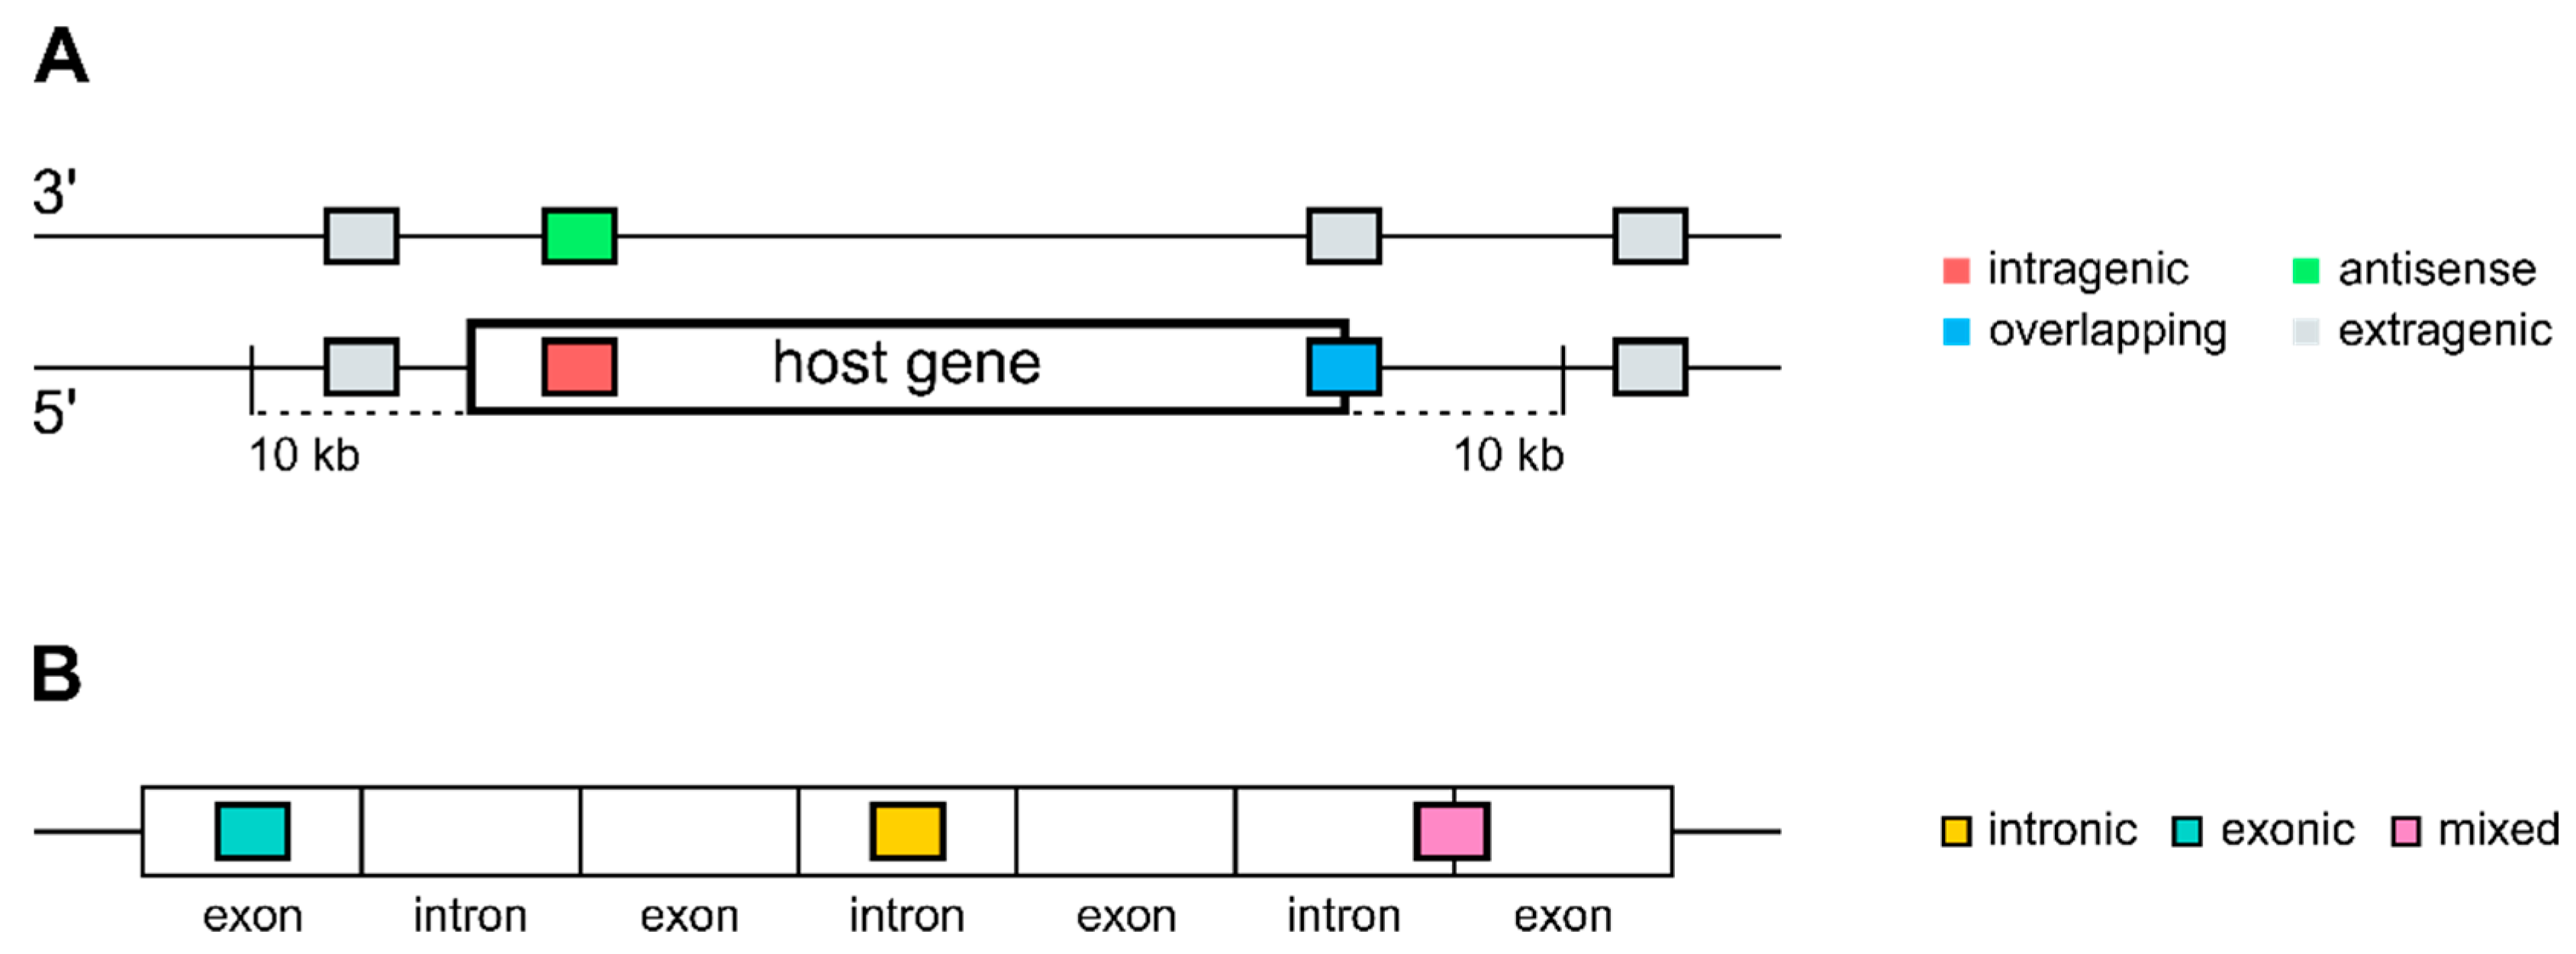
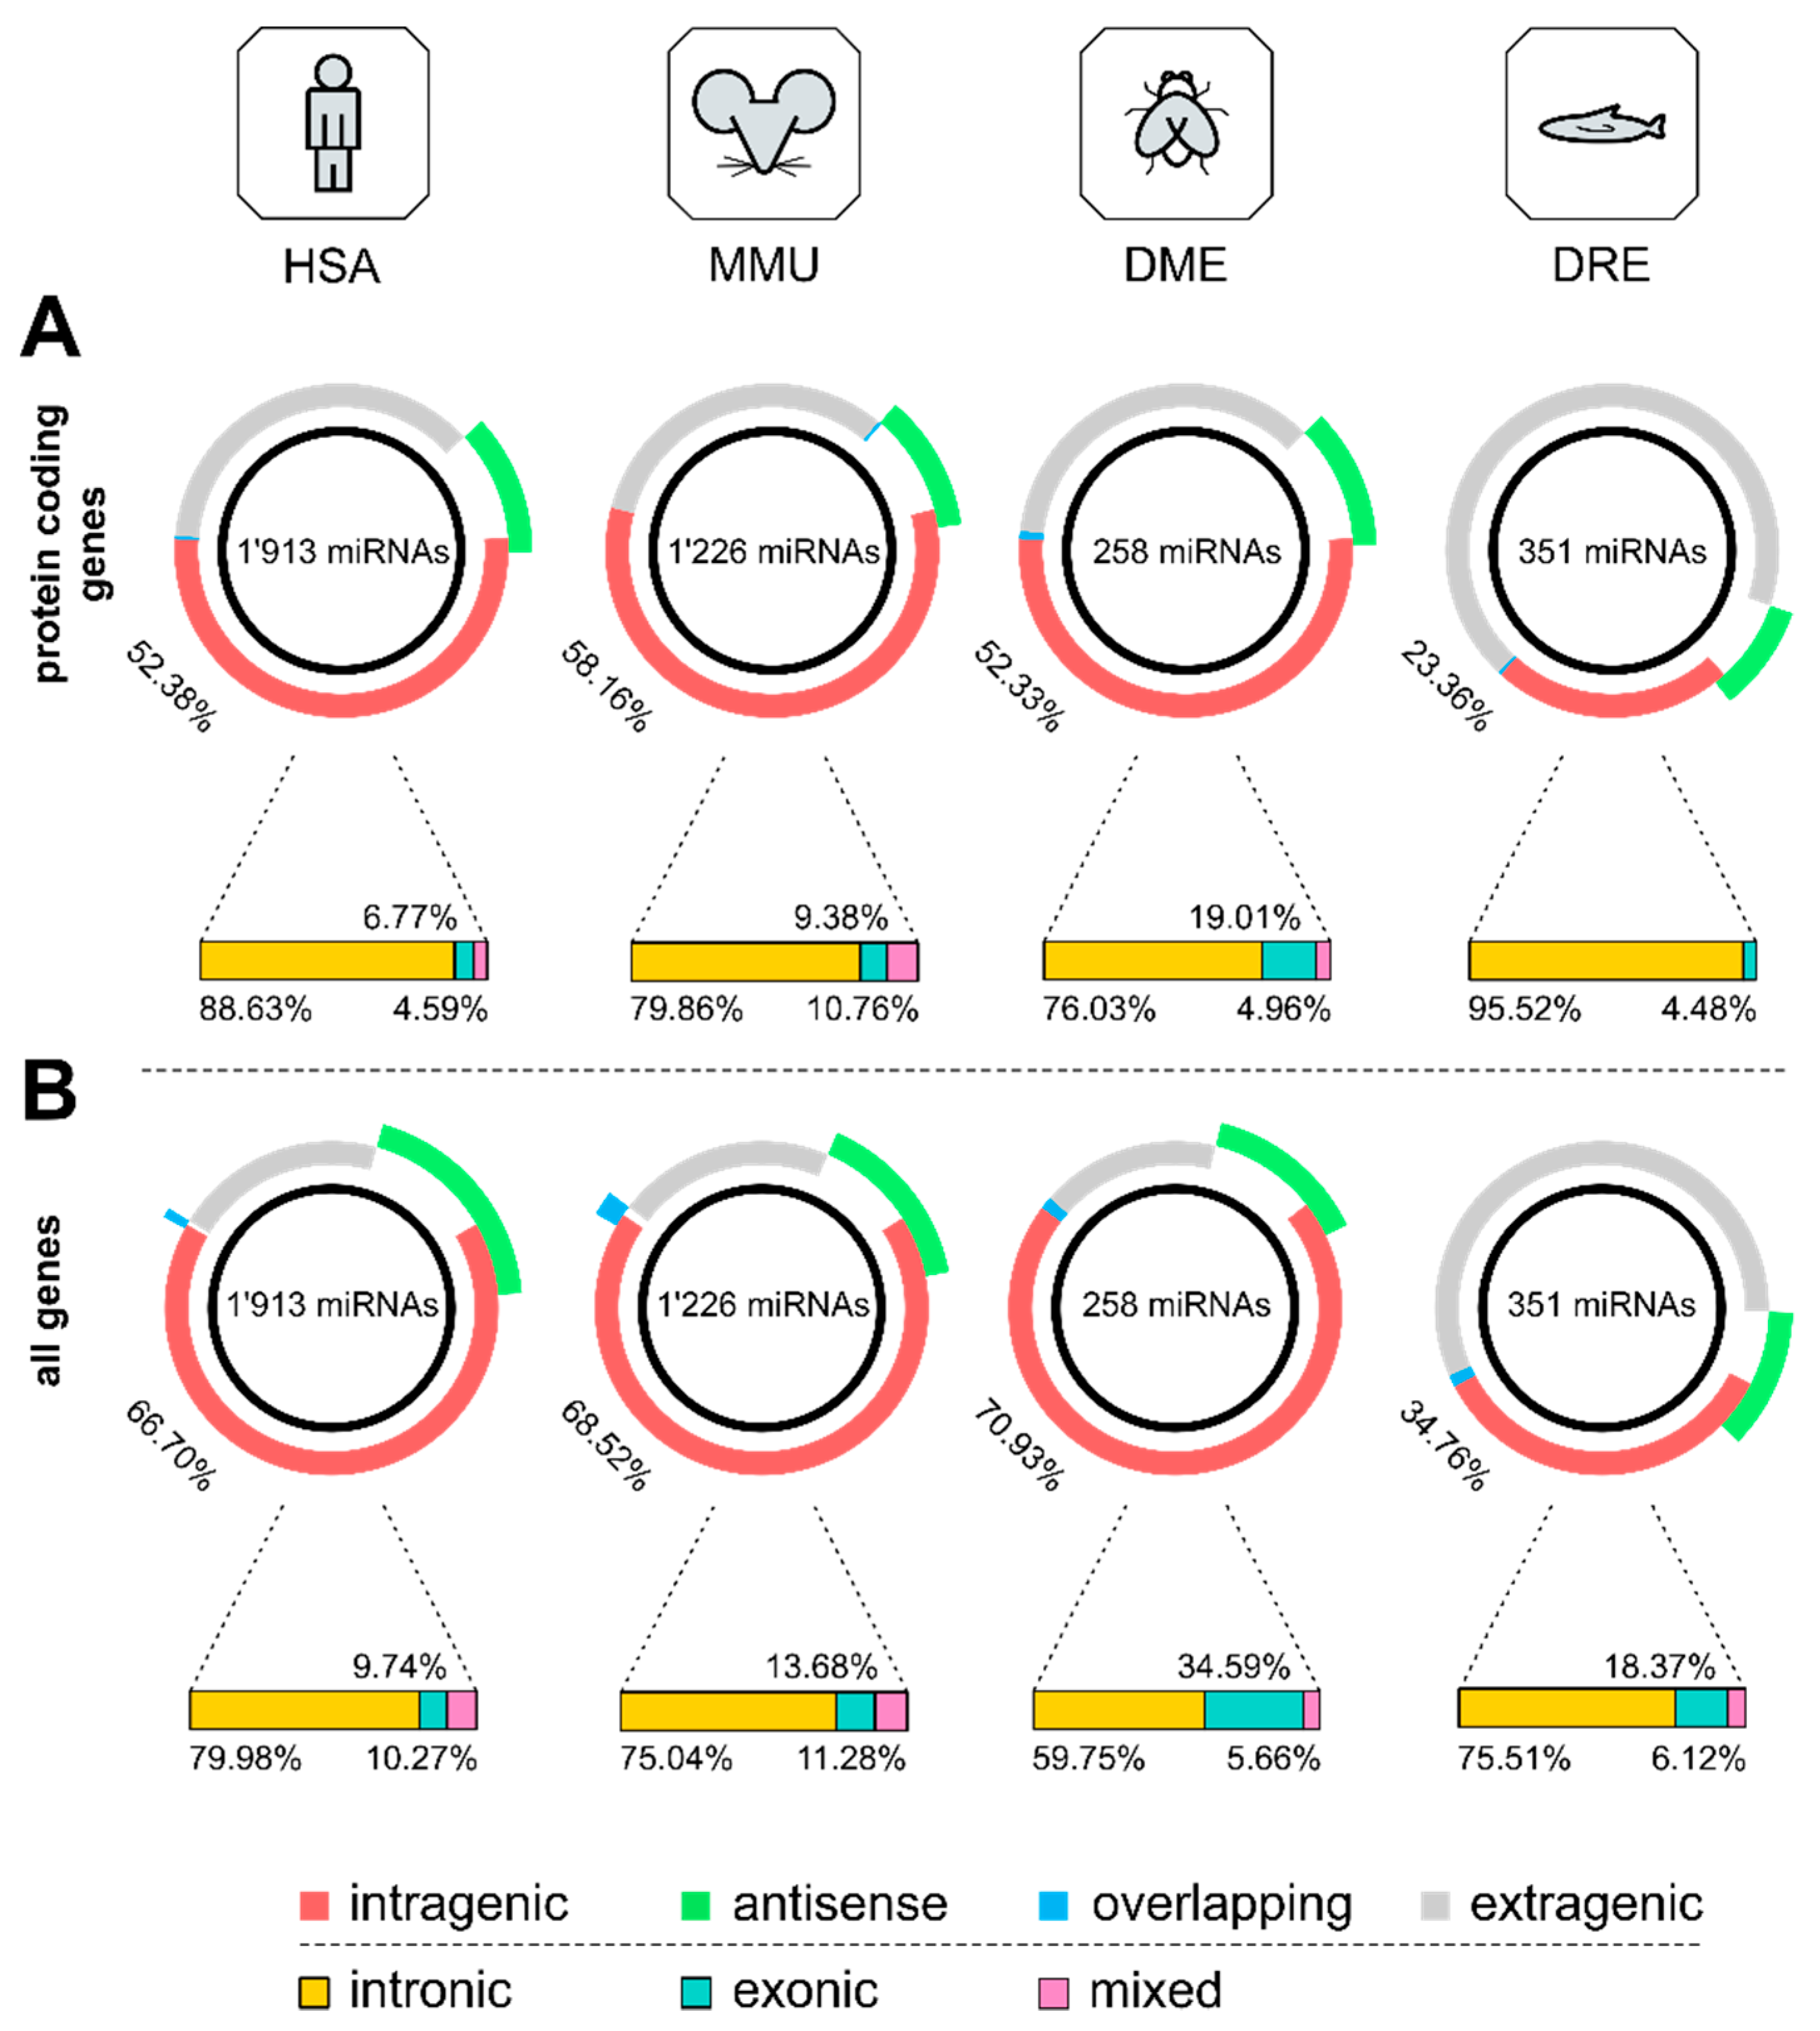
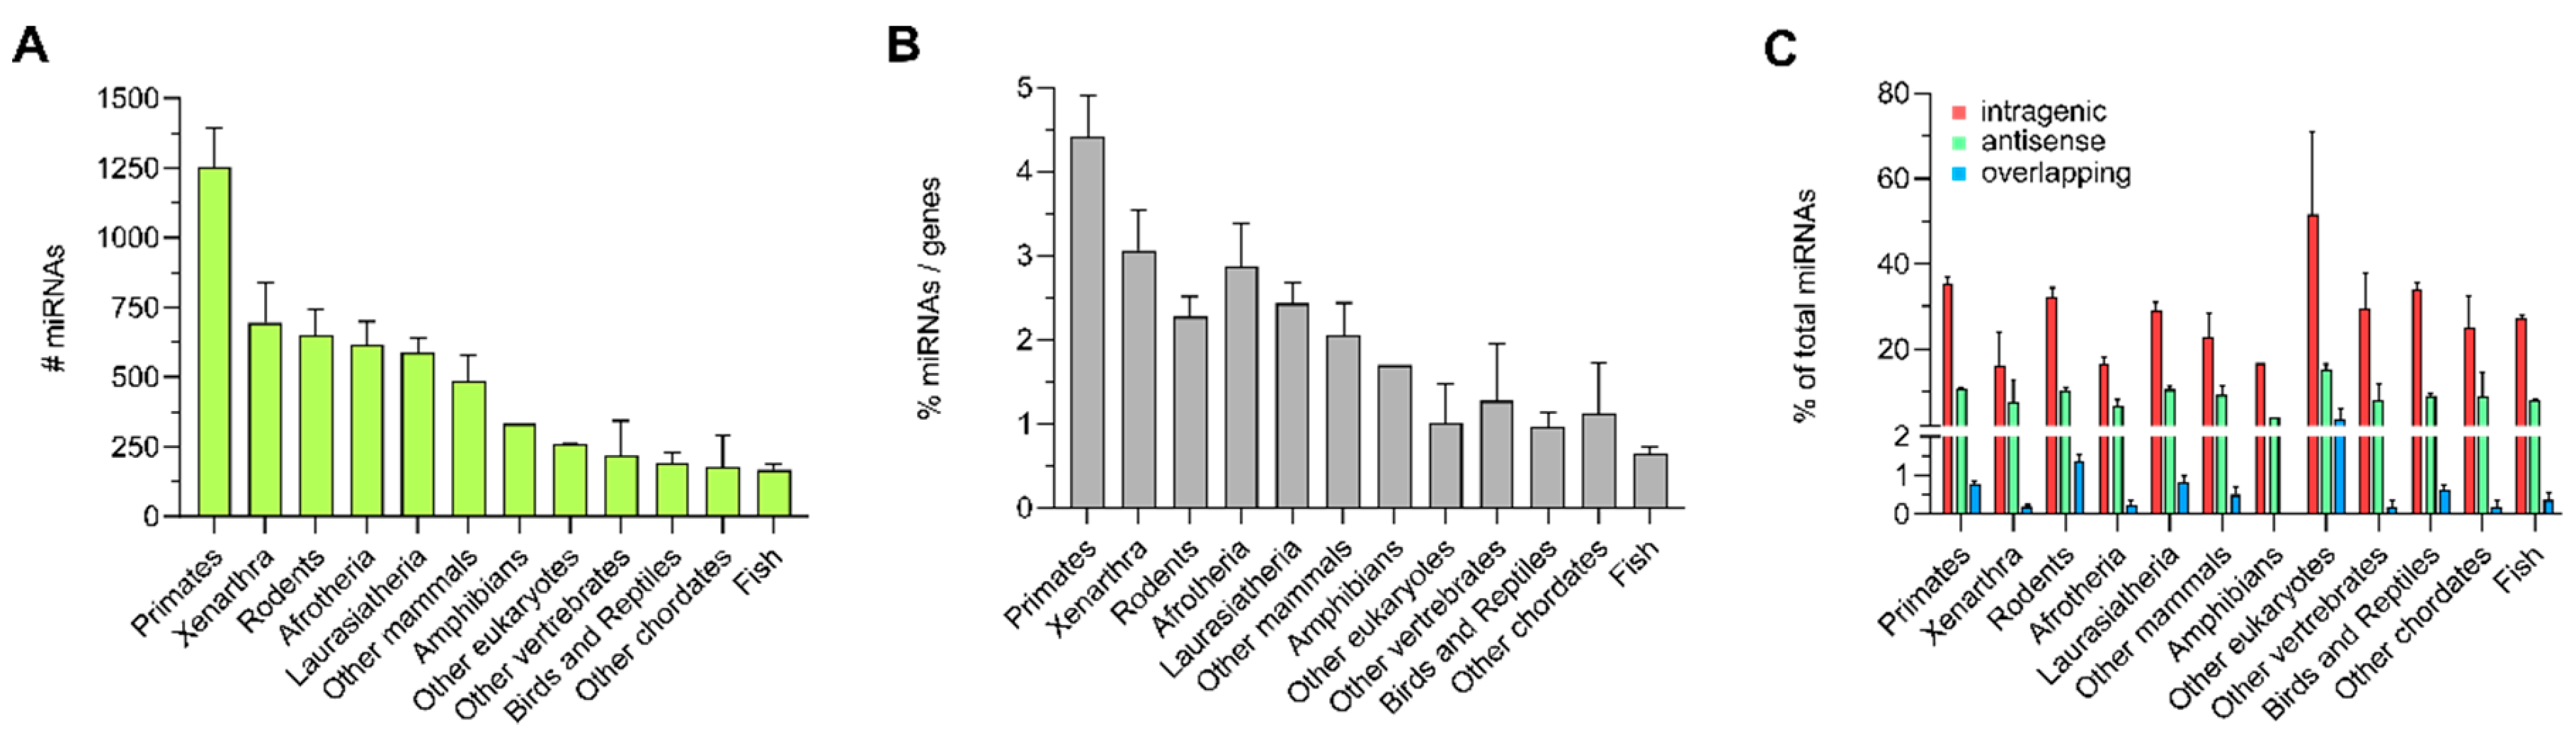
3.1. Distribution of Intragenic miRNAs Across Different Species
3.2. miRNA Host Genes Show Functional Clusters and Pathway Enrichment
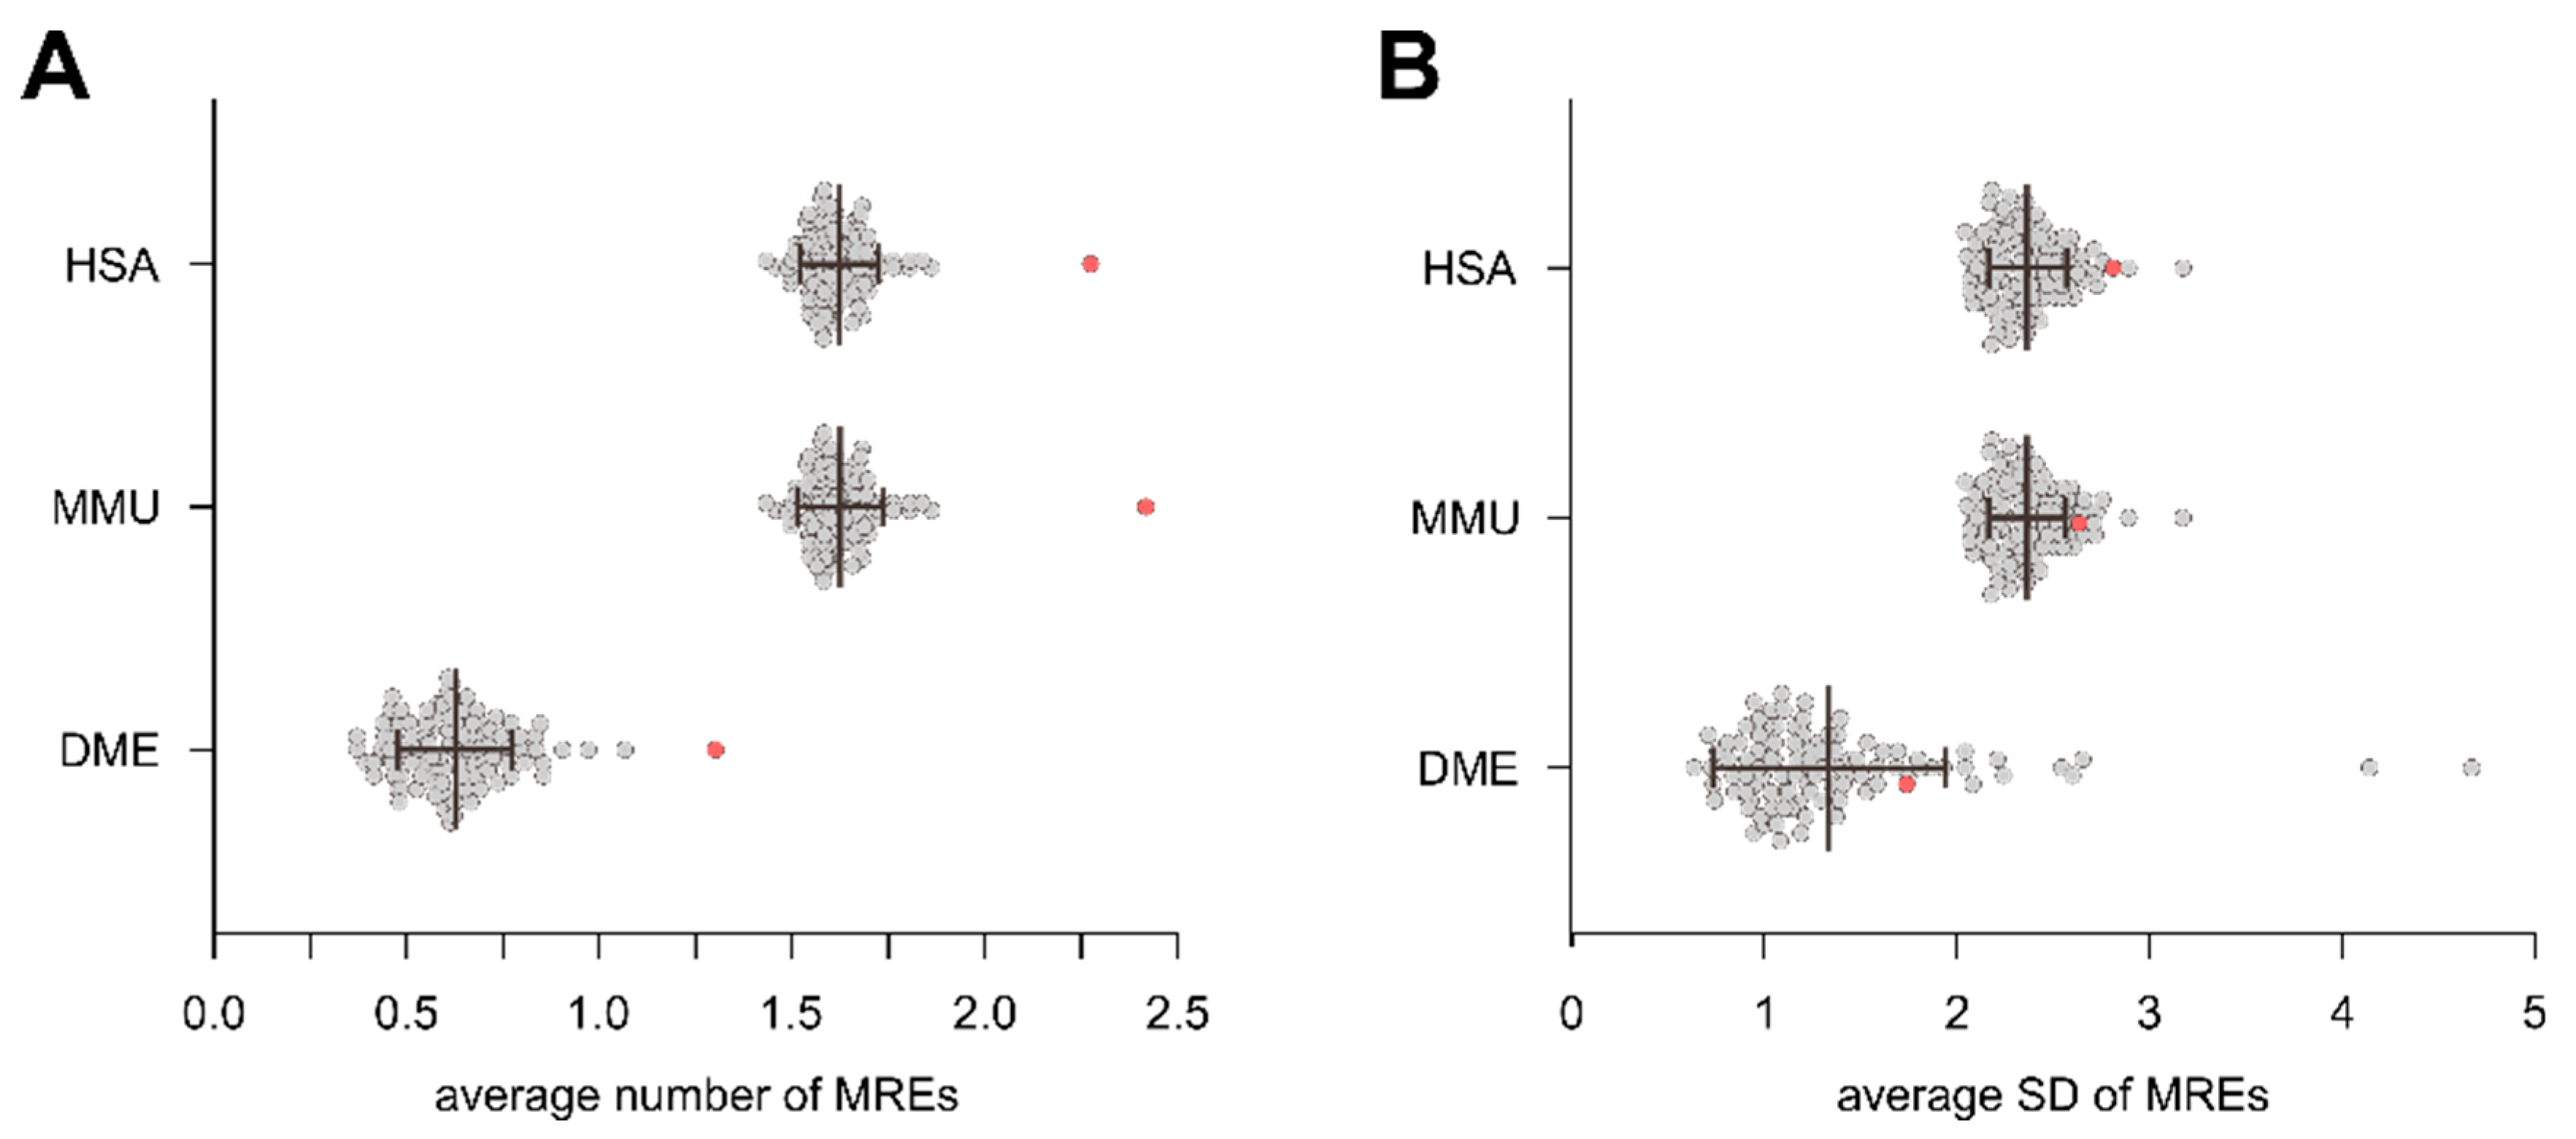
3.3. Intragenic miRNAs Target Their Host Genes
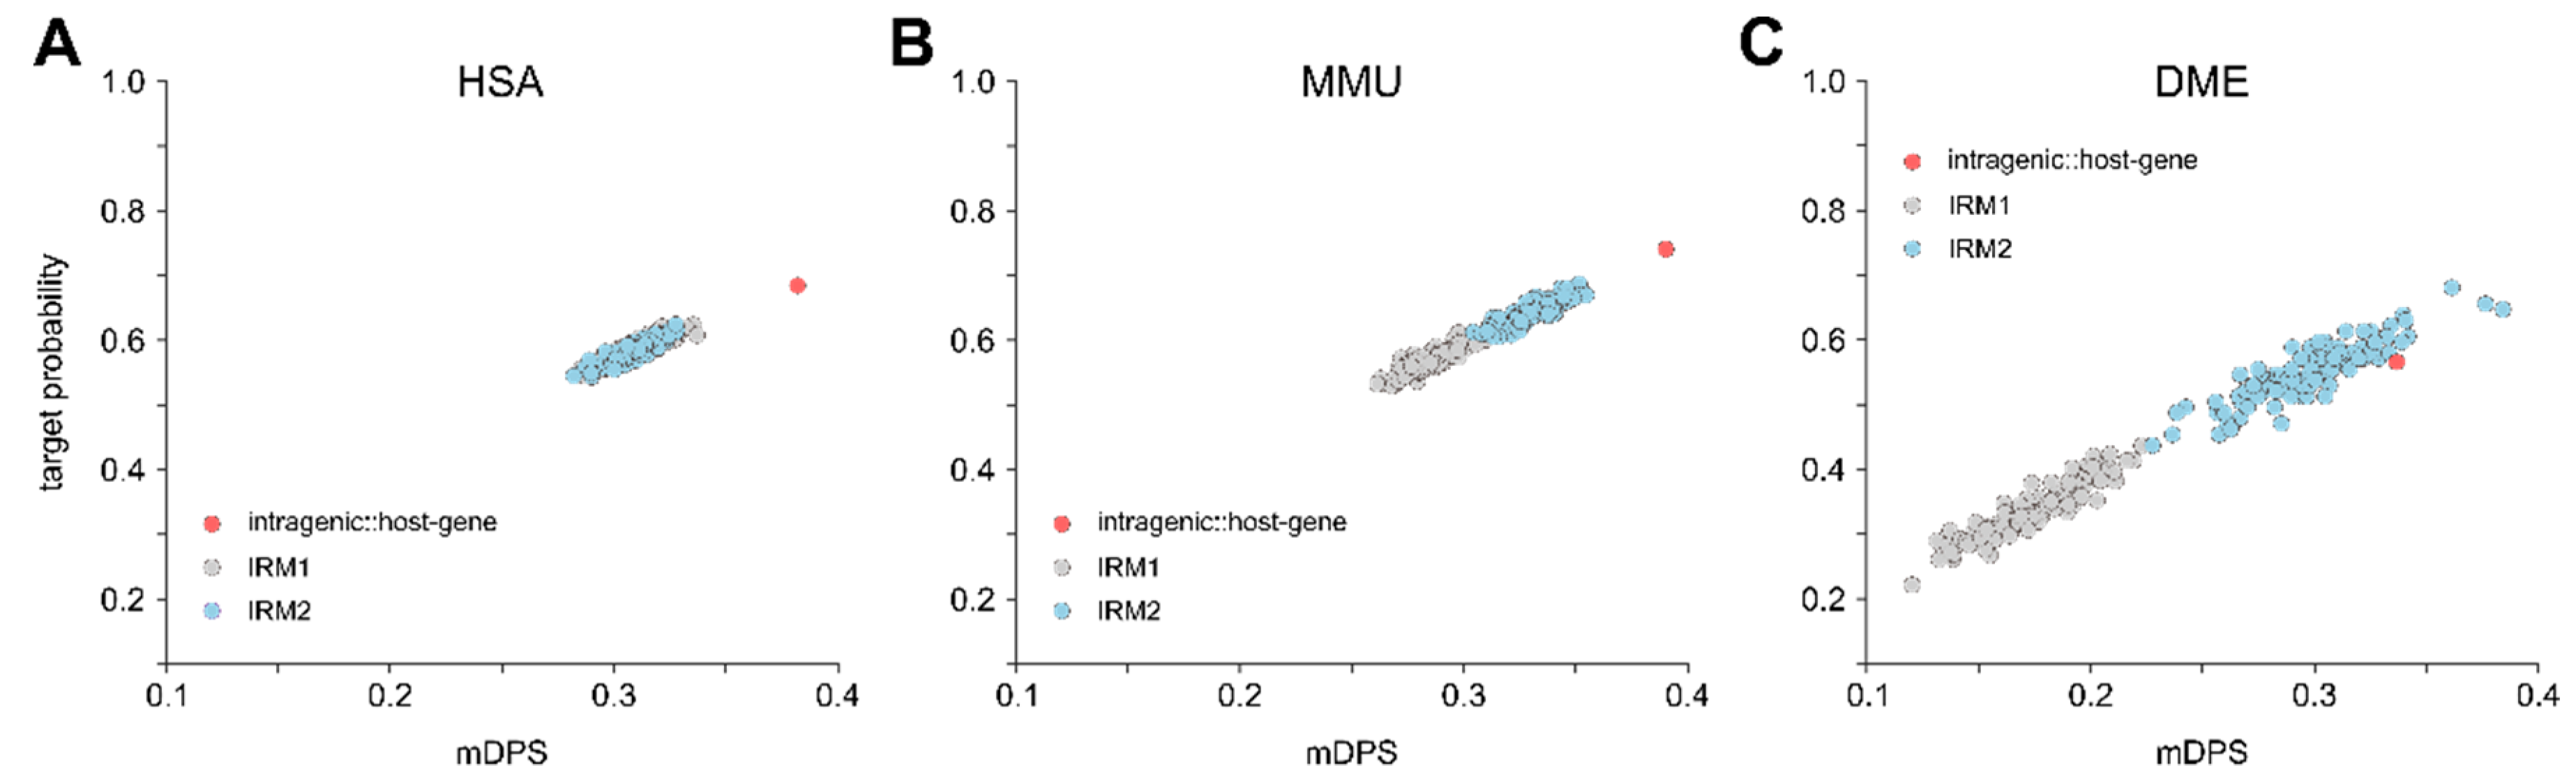
3.4. Relation between Proximity to Gene and Target Probability
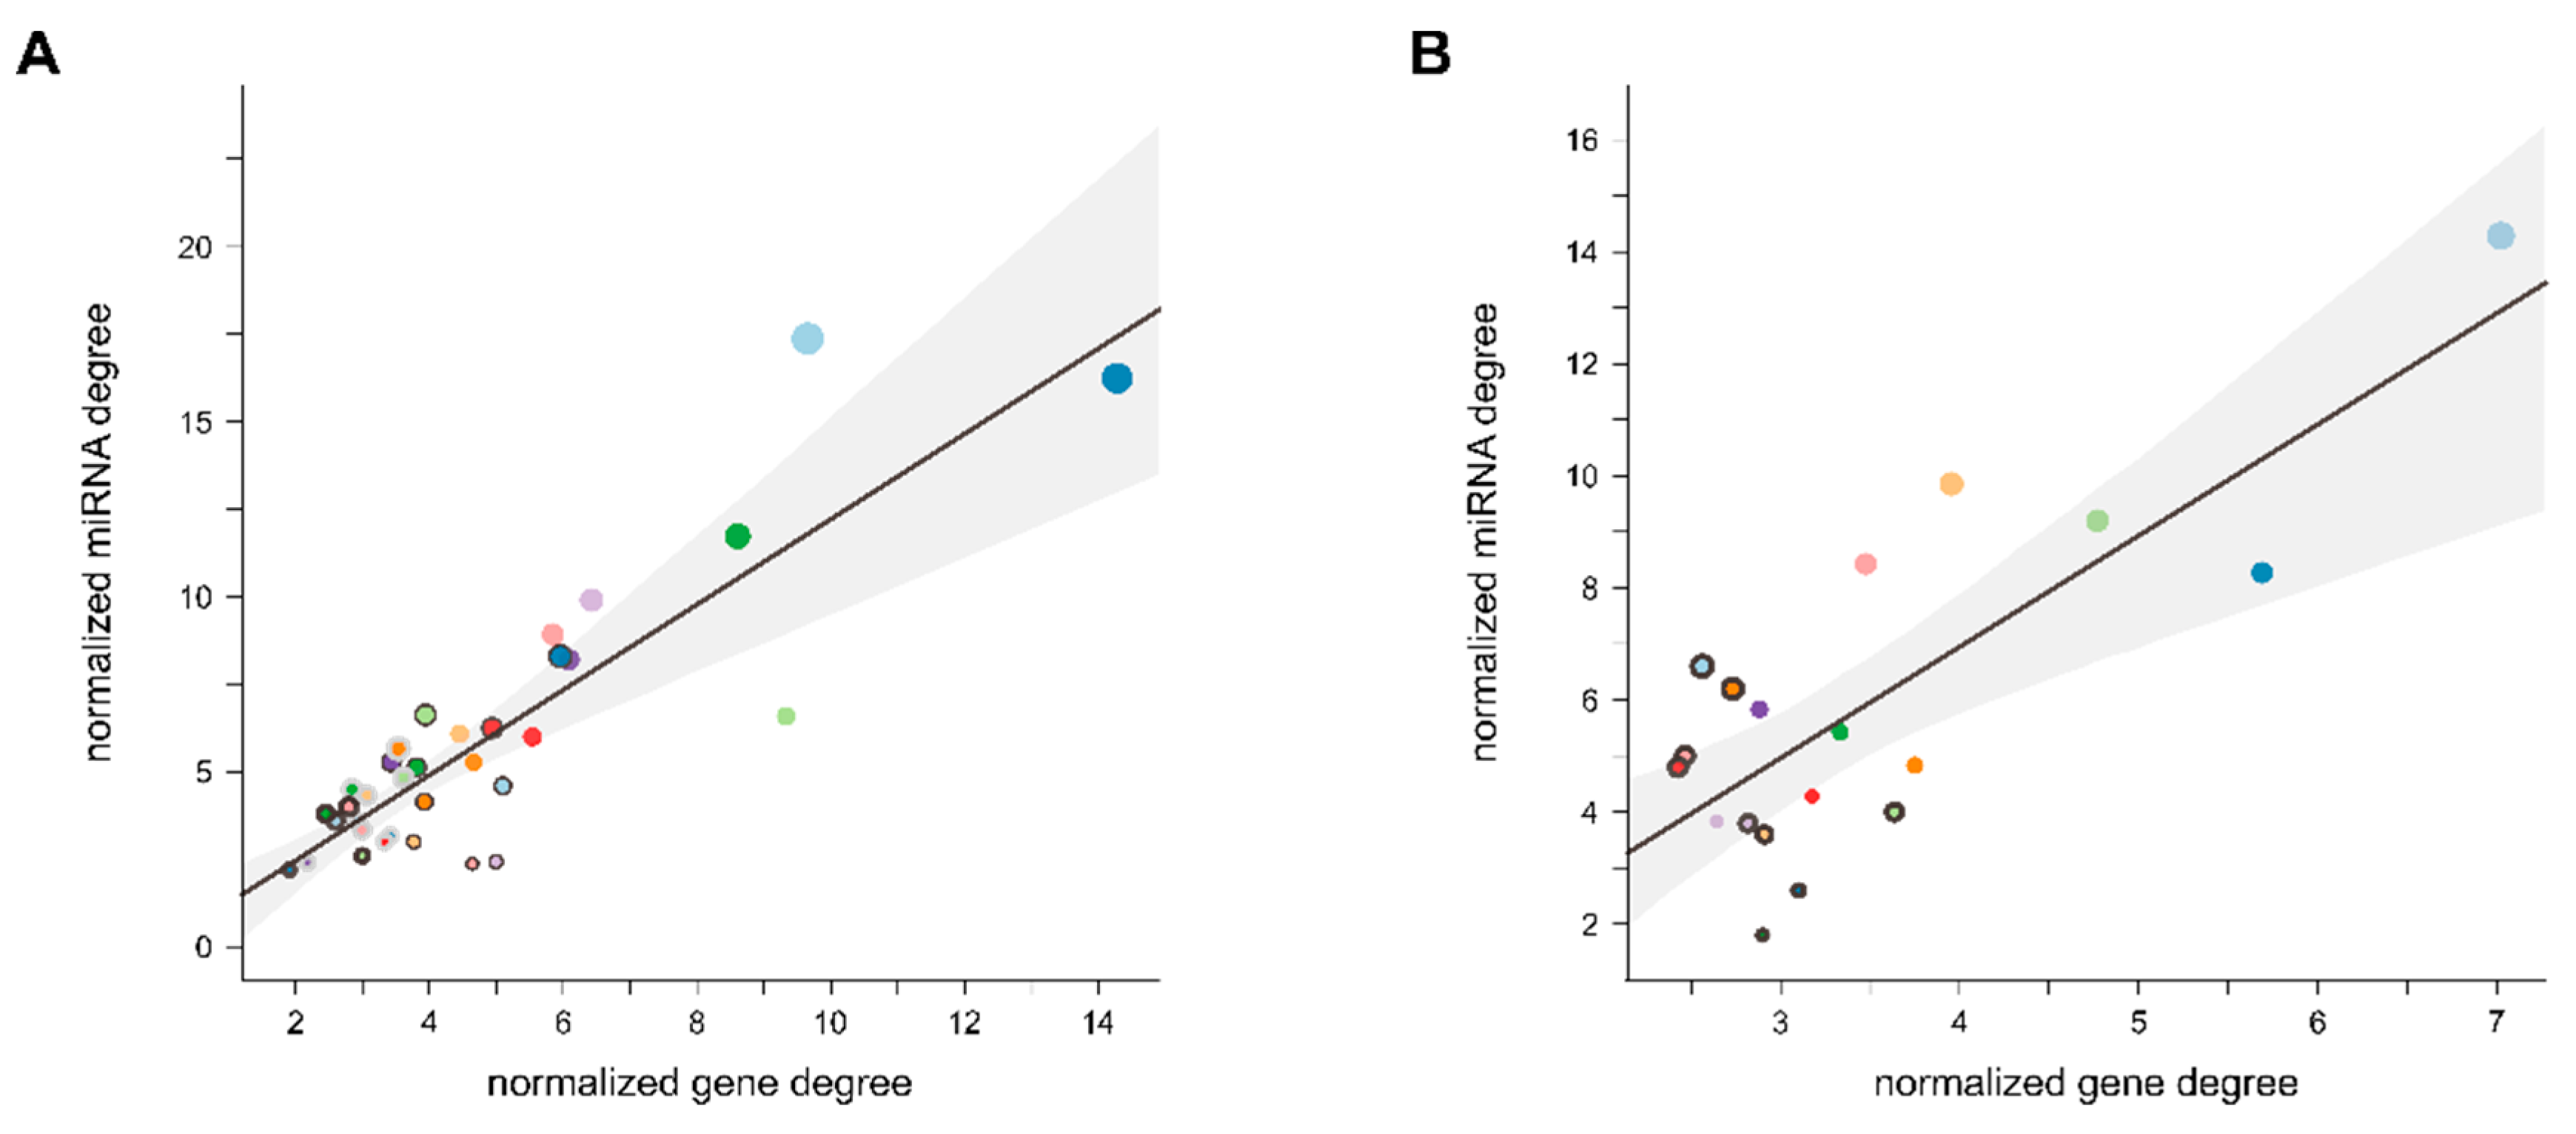
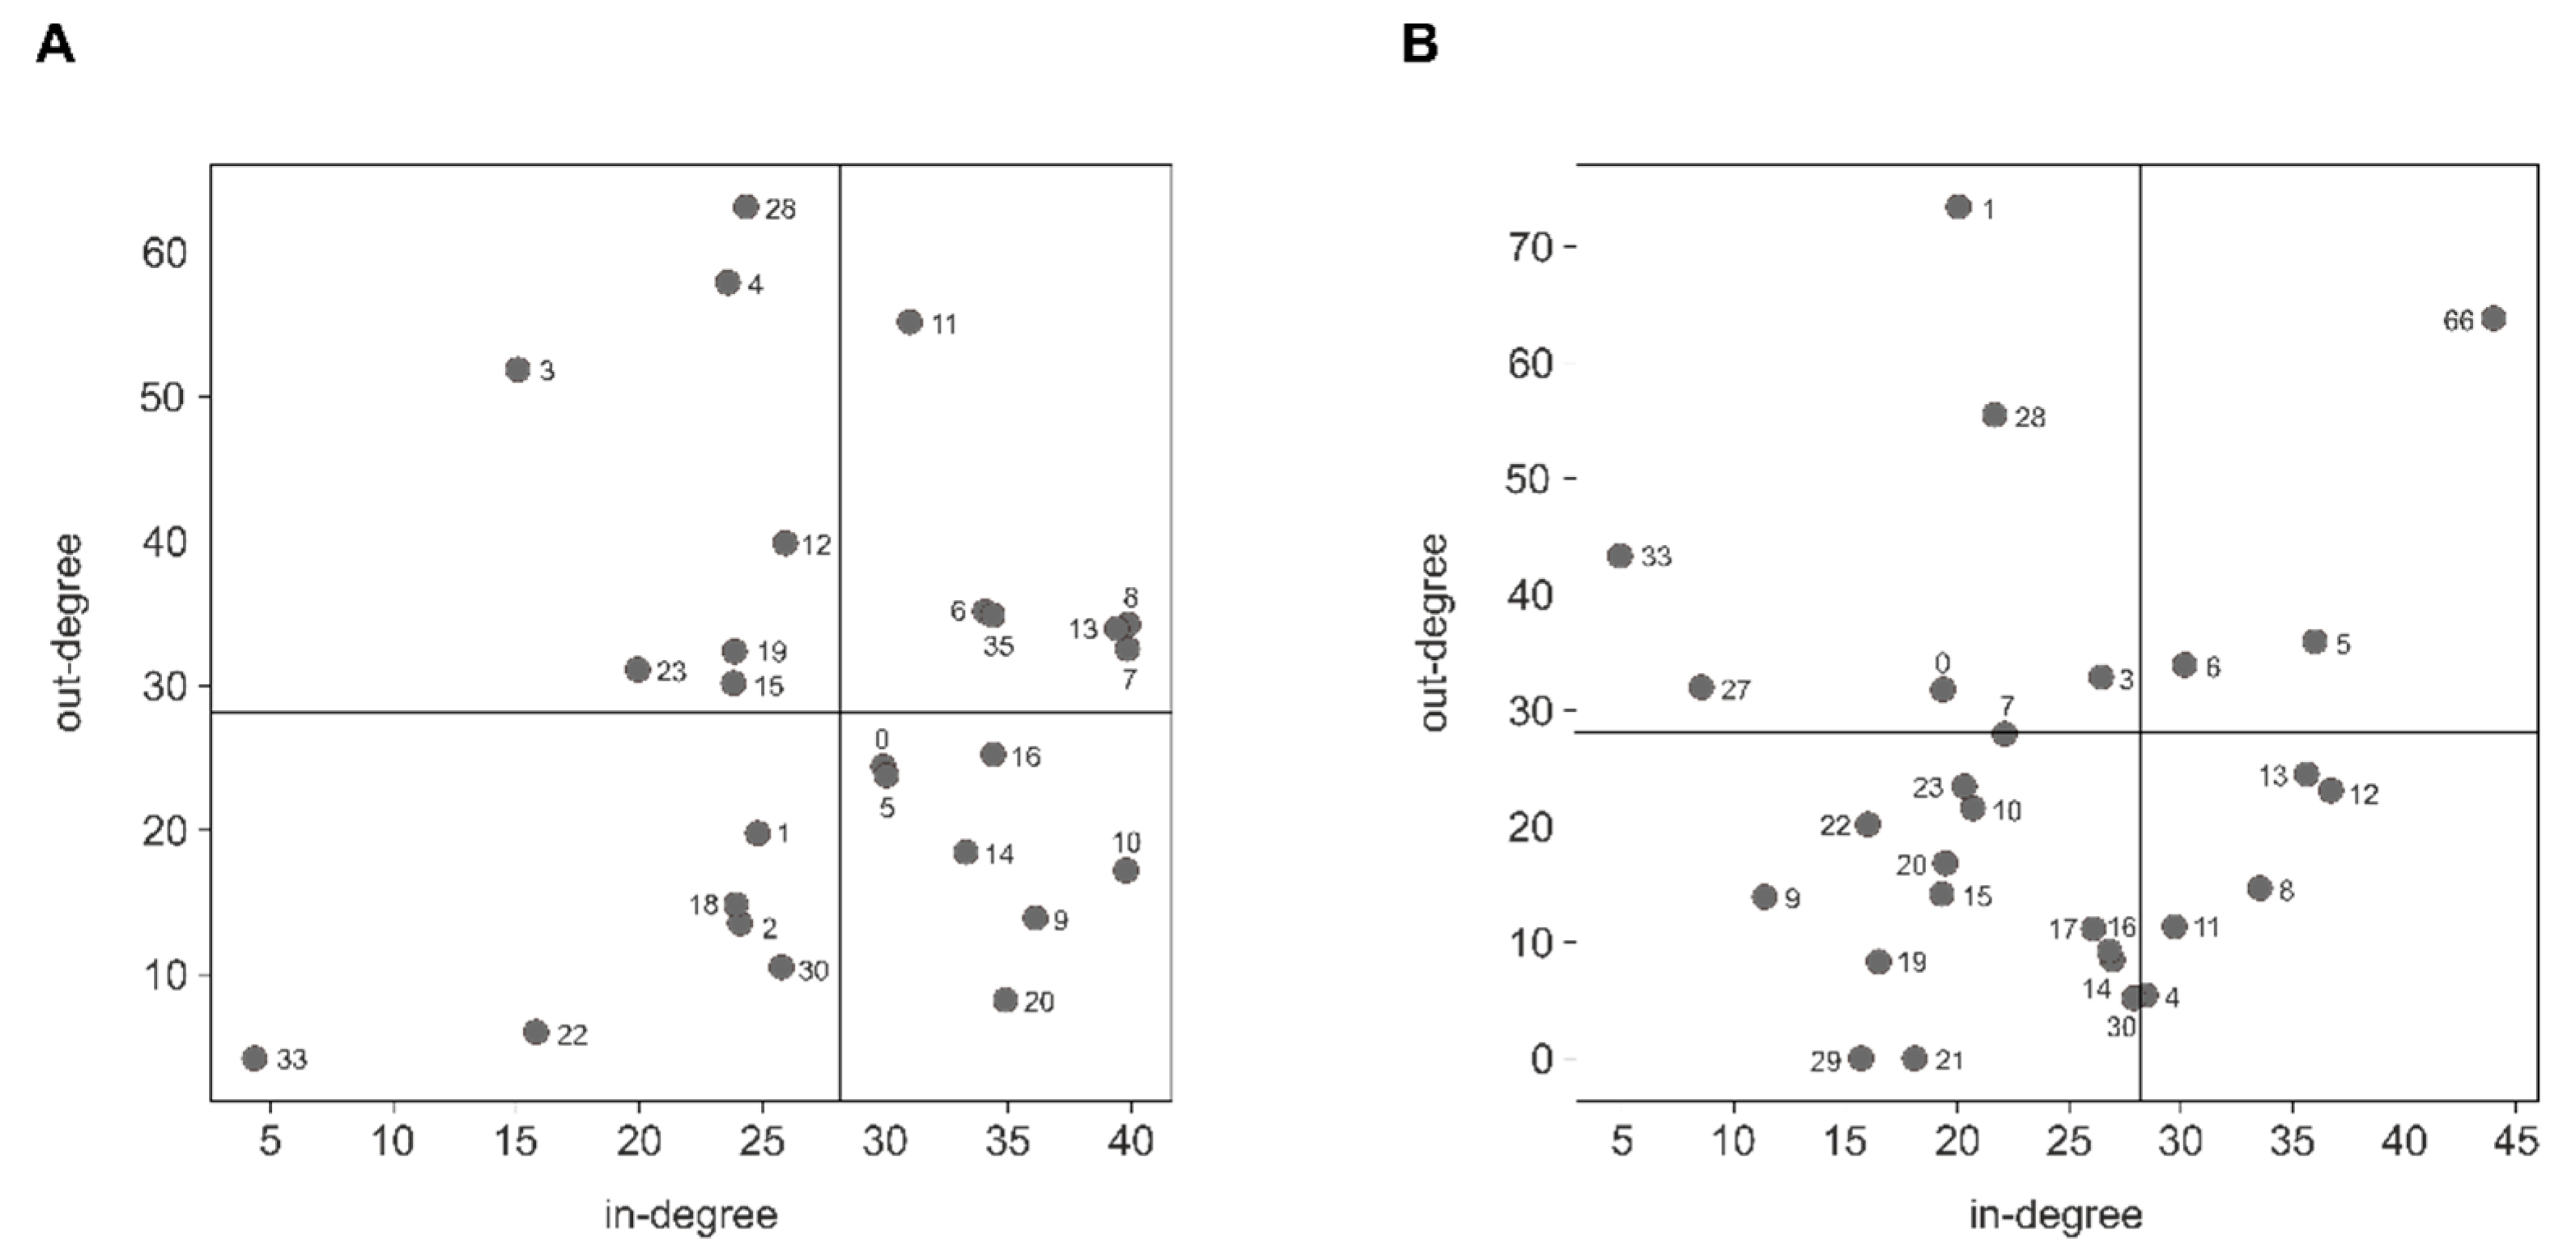
3.5. Indirect Host Gene Regulation by Modulation of Functional Pathways
4. Discussion
4.1. Distribution of Intragenic miRNAs Across Different Species
4.2. miRNA Host Genes Show Functional Clusters and Pathway Enrichment
4.3. Intragenic miRNAs Target Their Host Genes
4.4. Indirect Host Gene Regulation by Modulation of Functional Pathways
5. Conclusions
Supplementary Materials
Author Contributions
Funding
Acknowledgments
Conflicts of Interest
Data Availability
References
- National Library of Medicine (US). Genetics Home Reference—Cells and DNA Bethesda (MD): National Institutes of Health. Available online: https://ghr.nlm.nih.gov/primer/basics/noncodingdna (accessed on 6 December 2019).
- Kim, Y.K.; Kim, V.N. Processing of intronic microRNAs. EMBO J. 2007, 26, 775–783. [Google Scholar] [CrossRef]
- Hinske, L.C.; Dos Santos, F.R.C.; Ohara, D.T.; Ohno-Machado, L.; Kreth, S.; Galante, P.A.F. MiRIAD update: Using alternative polyadenylation, protein interaction network analysis and additional species to enhance exploration of the role of intragenic miRNAs and their host genes. Database 2017, 2017, 8. [Google Scholar] [CrossRef]
- Hinske, L.C.; Franca, G.S.; Torres, H.A.; Ohara, D.T.; Lopes-Ramos, C.M.; Heyn, J.; Reis, L.F.; Ohno-Machado, L.; Kreth, S.; Galante, P.A. miRIAD-integrating microRNA inter- and intragenic data. Database 2014, 1, 9. [Google Scholar] [CrossRef]
- Baskerville, S.; Bartel, D.P. Microarray profiling of microRNAs reveals frequent coexpression with neighboring miRNAs and host genes. RNA 2005, 11, 241–247. [Google Scholar] [CrossRef]
- Mandemakers, W.; Abuhatzira, L.; Xu, H.; Caromile, L.A.; Hebert, S.S.; Snellinx, A.; Morais, V.A.; Matta, S.; Cai, T.; Notkins, A.L.; et al. Co-regulation of intragenic microRNA miR-153 and its host gene Ia-2 beta: Identification of miR-153 target genes with functions related to IA-2beta in pancreas and brain. Diabetologia 2013, 56, 1547–1556. [Google Scholar] [CrossRef]
- Qian, J.; Tu, R.; Yuan, L.; Xie, W. Intronic miR-932 targets the coding region of its host gene, Drosophila neuroligin2. Exp. Cell Res. 2016, 344, 183–193. [Google Scholar] [CrossRef]
- Rodriguez, A.; Griffiths-Jones, S.; Ashurst, J.L.; Bradley, A. Identification of mammalian microRNA host genes and transcription units. Genome Res. 2004, 14, 1902–1910. [Google Scholar] [CrossRef]
- Ronchetti, D.; Lionetti, M.; Mosca, L.; Agnelli, L.; Andronache, A.; Fabris, S.; Deliliers, G.L.; Neri, A. An integrative genomic approach reveals coordinated expression of intronic miR-335, miR-342, and miR-561 with deregulated host genes in multiple myeloma. BMC Med. Genom. 2008, 1, 37. [Google Scholar] [CrossRef]
- Tessema, M.; Yingling, C.M.; Picchi, M.A.; Wu, G.; Ryba, T.; Lin, Y.; Bungum, A.O.; Edell, E.S.; Spira, A.; Belinsky, S.A. ANK1 Methylation regulates expression of MicroRNA-486-5p and discriminates lung tumors by histology and smoking status. Cancer Lett. 2017, 410, 191–200. [Google Scholar] [CrossRef]
- Yuva-Aydemir, Y.; Xu, X.L.; Aydemir, O.; Gascon, E.; Sayin, S.; Zhou, W.; Hong, Y.; Gao, F.B. Downregulation of the Host Gene jigr1 by miR-92 Is Essential for Neuroblast Self-Renewal in Drosophila. PLoS Genet. 2015, 11, e1005264. [Google Scholar] [CrossRef]
- Barik, S. An intronic microRNA silences genes that are functionally antagonistic to its host gene. Nucleic Acids Res. 2008, 36, 5232–5241. [Google Scholar] [CrossRef]
- Lin, S.L.; Miller, J.D.; Ying, S.Y. Intronic microRNA (miRNA). J. Biomed. Biotechnol. 2006, 2006, 26818. [Google Scholar] [CrossRef] [PubMed]
- Morlando, M.; Ballarino, M.; Gromak, N.; Pagano, F.; Bozzoni, I.; Proudfoot, N.J. Primary microRNA transcripts are processed co-transcriptionally. Nat. Struct. Mol. Biol. 2008, 15, 902–909. [Google Scholar] [CrossRef]
- Saini, H.K.; Griffiths-Jones, S.; Enright, A.J. Genomic analysis of human microRNA transcripts. Proc. Natl. Acad. Sci. USA 2007, 104, 17719–17724. [Google Scholar] [CrossRef]
- Shomron, N.; Levy, C. MicroRNA-biogenesis and Pre-mRNA splicing crosstalk. J. Biomed. Biotechnol. 2009, 2009, 594678. [Google Scholar] [CrossRef]
- Smalheiser, N.R. EST analyses predict the existence of a population of chimeric microRNA precursor-mRNA transcripts expressed in normal human and mouse tissues. Genome Biol. 2003, 4, 403. [Google Scholar] [CrossRef]
- Ying, S.Y.; Chang, D.C.; Lin, S.L. The microRNA (miRNA): Overview of the RNA genes that modulate gene function. Mol. Biotechnol. 2008, 38, 257–268. [Google Scholar] [CrossRef]
- Ying, S.Y.; Lin, S.L. Current perspectives in intronic micro RNAs (miRNAs). J. Biomed. Sci. 2006, 13, 5–15. [Google Scholar] [CrossRef]
- Galatenko, V.V.; Galatenko, A.V.; Samatov, T.R.; Turchinovich, A.A.; Shkurnikov, M.Y.; Makarova, J.A.; Tonevitsky, A.G. Comprehensive network of miRNA-induced intergenic interactions and a biological role of its core in cancer. Sci. Rep. 2018, 8, 2418. [Google Scholar] [CrossRef]
- Tan, H.; Huang, S.; Zhang, Z.; Qian, X.; Sun, P.; Zhou, X. Pan-cancer analysis on microRNA-associated gene activation. EBioMedicine 2019, 43, 82–97. [Google Scholar] [CrossRef]
- Wang, J.; Xiang, G.; Zhang, K.; Zhou, Y. Expression signatures of intragenic miRNAs and their corresponding host genes in myeloid leukemia cells. Biotechnol. Lett. 2012, 34, 2007–2015. [Google Scholar] [CrossRef]
- Godnic, I.; Zorc, M.; Jevsinek Skok, D.; Calin, G.A.; Horvat, S.; Dovc, P.; Kovac, M.; Kunej, T. Genome-wide and species-wide in silico screening for intragenic MicroRNAs in human, mouse and chicken. PLoS ONE 2013, 8, e65165. [Google Scholar] [CrossRef]
- Franca, G.S.; Vibranovski, M.D.; Galante, P.A. Host gene constraints and genomic context impact the expression and evolution of human microRNAs. Nat. Commun. 2016, 7, 11438. [Google Scholar] [CrossRef]
- Gennarino, V.A.; Sardiello, M.; Mutarelli, M.; Dharmalingam, G.; Maselli, V.; Lago, G.; Banfi, S. HOCTAR database: A unique resource for microRNA target prediction. Gene 2011, 480, 51–58. [Google Scholar] [CrossRef]
- He, C.; Li, Z.; Chen, P.; Huang, H.; Hurst, L.D.; Chen, J. Young intragenic miRNAs are less coexpressed with host genes than old ones: Implications of miRNA-host gene coevolution. Nucleic Acids Res. 2012, 40, 4002–4012. [Google Scholar] [CrossRef]
- Kozomara, A.; Birgaoanu, M.; Griffiths-Jones, S. miRBase: From microRNA sequences to function. Nucleic Acids Res. 2018, 47, D155–D162. [Google Scholar] [CrossRef]
- Londin, E.; Loher, P.; Telonis, A.G.; Quann, K.; Clark, P.; Jing, Y.; Hatzimichael, E.; Kirino, Y.; Honda, S.; Lally, M.; et al. Analysis of 13 cell types reveals evidence for the expression of numerous novel primate- and tissue-specific microRNAs. Proc. Natl. Acad. Sci. USA 2015, 112, E1106–E1115. [Google Scholar] [CrossRef]
- Bartel, D.P. Metazoan MicroRNAs. Cell 2018, 173, 20–51. [Google Scholar] [CrossRef]
- Hwang, H.W.; Wentzel, E.A.; Mendell, J.T. A hexanucleotide element directs microRNA nuclear import. Science 2007, 315, 97–100. [Google Scholar] [CrossRef]
- Filipowicz, W.; Bhattacharyya, S.N.; Sonenberg, N. Mechanisms of post-transcriptional regulation by microRNAs: Are the answers in sight? Nat. Rev. Genet. 2008, 9, 102–114. [Google Scholar] [CrossRef]
- Griffiths-Jones, S. The microRNA Registry. Nucleic Acids Res. 2004, 32, D109–D111. [Google Scholar] [CrossRef]
- Griffiths-Jones, S.; Grocock, R.J.; van Dongen, S.; Bateman, A.; Enright, A.J. miRBase: microRNA sequences, targets and gene nomenclature. Nucleic Acids Res. 2006, 34, D140–D144. [Google Scholar] [CrossRef]
- Griffiths-Jones, S.; Saini, H.K.; van Dongen, S.; Enright, A.J. miRBase: Tools for microRNA genomics. Nucleic Acids Res. 2008, 36, D154–D158. [Google Scholar] [CrossRef]
- Kozomara, A.; Griffiths-Jones, S. miRBase: Annotating high confidence microRNAs using deep sequencing data. Nucleic Acids Res. 2014, 42, D68–D73. [Google Scholar] [CrossRef]
- Zerbino, D.R.; Achuthan, P.; Akanni, W.; Amode, M.R.; Barrell, D.; Bhai, J.; Billis, K.; Cummins, C.; Gall, A.; Girón, C.G.; et al. Ensembl 2018. Nucleic Acids Res. 2018, 46, D754–D761. [Google Scholar] [CrossRef]
- Szklarczyk, D.; Morris, J.H.; Cook, H.; Kuhn, M.; Wyder, S.; Simonovic, M.; Santos, A.; Doncheva, N.T.; Roth, A.; Bork, P.; et al. The STRING database in 2017: Quality-controlled protein–protein association networks, made broadly accessible. Nucleic Acids Res. 2017, 45, D362–D368. [Google Scholar] [CrossRef]
- Reimand, J.; Arak, T.; Adler, P.; Kolberg, L.; Reisberg, S.; Peterson, H.; Vilo, J. g:Profiler-a web server for functional interpretation of gene lists (2016 update). Nucleic Acids Res. 2016, 44, W83–W89. [Google Scholar] [CrossRef]
- Reimand, J.; Kull, M.; Peterson, H.; Hansen, J.; Vilo, J. g:Profiler—A web-based toolset for functional profiling of gene lists from large-scale experiments. Nucleic Acids Res. 2007, 35, W193–W200. [Google Scholar] [CrossRef]
- Paraskevopoulou, M.D.; Georgakilas, G.; Kostoulas, N.; Vlachos, I.S.; Vergoulis, T.; Reczko, M.; Filippidis, C.; Dalamagas, T.; Hatzigeorgiou, A.G. DIANA-microT web server v5.0: Service integration into miRNA functional analysis workflows. Nucleic Acids Res. 2013, 41, W169–W173. [Google Scholar] [CrossRef]
- Chi, S.W.; Zang, J.B.; Mele, A.; Darnell, R.B. Argonaute HITS-CLIP decodes microRNA-mRNA interaction maps. Nature 2009, 460, 479–486. [Google Scholar] [CrossRef]
- Fridrich, A.; Hazan, Y.; Moran, Y. Too Many False Targets for MicroRNAs: Challenges and Pitfalls in Prediction of miRNA Targets and Their Gene Ontology in Model and Non-model Organisms. Bioessays 2019, 41, e1800169. [Google Scholar] [CrossRef]
- Karagkouni, D.; Paraskevopoulou, M.D.; Chatzopoulos, S.; Vlachos, I.S.; Tastsoglou, S.; Kanellos, I.; Papadimitriou, D.; Kavakiotis, I.; Maniou, S.; Skoufos, G.; et al. DIANA-TarBase v8: A decade-long collection of experimentally supported miRNA-gene interactions. Nucleic Acids Res. 2018, 46, D239–D245. [Google Scholar] [CrossRef]
- Chou, C.H.; Shrestha, S.; Yang, C.D.; Chang, N.W.; Lin, Y.L.; Liao, K.W.; Huang, W.C.; Sun, T.H.; Tu, S.J.; Lee, W.H.; et al. miRTarBase update 2018: A resource for experimentally validated microRNA-target interactions. Nucleic Acids Res. 2018, 46, D296–D302. [Google Scholar] [CrossRef]
- Li, J.H.; Liu, S.; Zhou, H.; Qu, L.H.; Yang, J.H. starBase v2.0: Decoding miRNA-ceRNA, miRNA-ncRNA and protein-RNA interaction networks from large-scale CLIP-Seq data. Nucleic Acids Res. 2014, 42, D92–D97. [Google Scholar] [CrossRef]
- Chen, W.H.; Lu, G.; Chen, X.; Zhao, X.M.; Bork, P. OGEE v2: An update of the online gene essentiality database with special focus on differentially essential genes in human cancer cell lines. Nucleic Acids Res. 2017, 45, D940–D944. [Google Scholar] [CrossRef]
- Hinske, L.C.; Galante, P.A.; Kuo, W.P.; Ohno-Machado, L. A potential role for intragenic miRNAs on their hosts’ interactome. BMC Genom. 2010, 11, 533. [Google Scholar] [CrossRef]
- Aken, B.L.; Ayling, S.; Barrell, D.; Clarke, L.; Curwen, V.; Fairley, S.; Fernandez Banet, J.; Billis, K.; García Girón, C.; Hourlier, T.; et al. The Ensembl gene annotation system. Database 2016, 2016, baw093. [Google Scholar] [CrossRef]
- Ramalingam, P.; Palanichamy, J.K.; Singh, A.; Das, P.; Bhagat, M.; Kassab, M.A.; Sinha, S.; Chattopadhyay, P. Biogenesis of intronic miRNAs located in clusters by independent transcription and alternative splicing. RNA 2014, 20, 76–87. [Google Scholar] [CrossRef]
- Yuan, X.; Liu, C.; Yang, P.; He, S.; Liao, Q.; Kang, S.; Zhao, Y. Clustered microRNAs’ coordination in regulating protein–protein interaction network. BMC Syst. Biol. 2009, 3, 65. [Google Scholar] [CrossRef]
- Agarwal, V.; Bell, G.W.; Nam, J.W.; Bartel, D.P. Predicting effective microRNA target sites in mammalian mRNAs. Elife 2015, 4, e05005. [Google Scholar] [CrossRef]
- Enright, A.J.; John, B.; Gaul, U.; Tuschl, T.; Sander, C.; Marks, D.S. MicroRNA targets in Drosophila. Genome Biol. 2003, 5, R1. [Google Scholar] [CrossRef]
- Krek, A.; Grun, D.; Poy, M.N.; Wolf, R.; Rosenberg, L.; Epstein, E.J.; MacMenamin, P.; Da Piedade, I.; Gunsalus, K.C.; Stoffel, M.; et al. Combinatorial microRNA target predictions. Nat. Genet. 2005, 37, 495–500. [Google Scholar] [CrossRef]
- Miranda, K.C.; Huynh, T.; Tay, Y.; Ang, Y.S.; Tam, W.L.; Thomson, A.M.; Lim, B.; Rigoutsos, I. A pattern-based method for the identification of MicroRNA binding sites and their corresponding heteroduplexes. Cell 2006, 126, 1203–1217. [Google Scholar] [CrossRef]
- Kertesz, M.; Iovino, N.; Unnerstall, U.; Gaul, U.; Segal, E. The role of site accessibility in microRNA target recognition. Nat. Genet. 2007, 39, 1278–1284. [Google Scholar] [CrossRef]
- Xiao, F.; Zuo, Z.; Cai, G.; Kang, S.; Gao, X.; Li, T. miRecords: An integrated resource for microRNA-target interactions. Nucleic Acids Res. 2009, 37, D105–D110. [Google Scholar] [CrossRef]
- Laczny, C.; Leidinger, P.; Haas, J.; Ludwig, N.; Backes, C.; Gerasch, A.; Kaufmann, M.; Vogel, B.; Katus, H.A.; Meder, B.; et al. miRTrail--a comprehensive webserver for analyzing gene and miRNA patterns to enhance the understanding of regulatory mechanisms in diseases. BMC Bioinform. 2012, 13, 36. [Google Scholar] [CrossRef]
- Subhra Das, S.; James, M.; Paul, S.; Chakravorty, N. miRnalyze: An interactive database linking tool to unlock intuitive microRNA regulation of cell signaling pathways. Database (Oxford) 2017, 2017, bax015. [Google Scholar] [CrossRef]
- Vlachos, I.S.; Zagganas, K.; Paraskevopoulou, M.D.; Georgakilas, G.; Karagkouni, D.; Vergoulis, T.; Dalamagas, T.; Hatzigeorgiou, A.G. DIANA-miRPath v3.0: Deciphering microRNA function with experimental support. Nucleic Acids Res. 2015, 43, W460–W466. [Google Scholar] [CrossRef]
- Backes, C.; Kehl, T.; Stockel, D.; Fehlmann, T.; Schneider, L.; Meese, E.; Lenhof, H.P.; Keller, A. miRPathDB: A new dictionary on microRNAs and target pathways. Nucleic Acids Res. 2017, 45, D90–D96. [Google Scholar] [CrossRef]
- Preusse, M.; Theis, F.J.; Mueller, N.S. miTALOS v2: Analyzing Tissue Specific microRNA Function. PLoS ONE 2016, 11, e0151771. [Google Scholar] [CrossRef]
- Han, J.; Liu, S.; Zhang, Y.; Xu, Y.; Jiang, Y.; Zhang, C.; Li, C.; Li, X. MiRSEA: Discovering the pathways regulated by dysfunctional MicroRNAs. Oncotarget 2016, 7, 55012–55025. [Google Scholar] [CrossRef]
- Feng, L.; Xu, Y.; Zhang, Y.; Sun, Z.; Han, J.; Zhang, C.; Yang, H.; Shang, D.; Su, F.; Shi, X.; et al. Subpathway-GMir: Identifying miRNA-mediated metabolic subpathways by integrating condition-specific genes, microRNAs, and pathway topologies. Oncotarget 2015, 6, 39151–39164. [Google Scholar] [CrossRef]
- Huang, Z.; Shi, J.; Gao, Y.; Cui, C.; Zhang, S.; Li, J.; Zhou, Y.; Cui, Q. HMDD v3.0: A database for experimentally supported human microRNA-disease associations. Nucleic Acids Res. 2019, 47, D1013–D1017. [Google Scholar] [CrossRef]
- Das, S.S.; Saha, P.; Chakravorty, N. miRwayDB: A database for experimentally validated microRNA-pathway associations in pathophysiological conditions. Database (Oxford) 2018, 2018. [Google Scholar] [CrossRef]
- Ruepp, A.; Kowarsch, A.; Theis, F. PhenomiR: microRNAs in human diseases and biological processes. Methods Mol. Biol. 2012, 822, 249–260. [Google Scholar]
- Ballarino, M.; Morlando, M.; Pagano, F.; Fatica, A.; Bozzoni, I. The cotranscriptional assembly of snoRNPs controls the biosynthesis of H/ACA snoRNAs in Saccharomyces cerevisiae. Mol. Cell. Biol. 2005, 25, 5396–5403. [Google Scholar] [CrossRef]
- Lykke-Andersen, S.; Ardal, B.K.; Hollensen, A.K.; Damgaard, C.K.; Jensen, T.H. Box C/D snoRNP Autoregulation by a cis-Acting snoRNA in the NOP56 Pre-mRNA. Mol. Cell 2018, 72, 99–111. [Google Scholar] [CrossRef]
- Richard, P.; Kiss, A.M.; Darzacq, X.; Kiss, T. Cotranscriptional recognition of human intronic box H/ACA snoRNAs occurs in a splicing-independent manner. Mol. Cell. Biol. 2006, 26, 2540–2549. [Google Scholar] [CrossRef]
- Boivin, V.; Deschamps-Francoeur, G.; Scott, M.S. Protein coding genes as hosts for noncoding RNA expression. Semin. Cell. Dev. Biol. 2018, 75, 3–12. [Google Scholar] [CrossRef]
- Chong, M.M.; Zhang, G.; Cheloufi, S.; Neubert, T.A.; Hannon, G.J.; Littman, D.R. Canonical and alternate functions of the microRNA biogenesis machinery. Genes Dev. 2010, 24, 1951–1960. [Google Scholar] [CrossRef]
- Han, J.; Pedersen, J.S.; Kwon, S.C.; Belair, C.D.; Kim, Y.K.; Yeom, K.H.; Yang, W.Y.; Haussler, D.; Blelloch, R.; Kim, V.N.; et al. Posttranscriptional crossregulation between Drosha and DGCR8. Cell 2009, 136, 75–84. [Google Scholar] [CrossRef]
- Karginov, F.V.; Cheloufi, S.; Chong, M.M.; Stark, A.; Smith, A.D.; Hannon, G.J. Diverse endonucleolytic cleavage sites in the mammalian transcriptome depend upon microRNAs, Drosha, and additional nucleases. Mol. Cell 2010, 38, 781–788. [Google Scholar] [CrossRef]
- Macias, S.; Plass, M.; Stajuda, A.; Michlewski, G.; Eyras, E.; Caceres, J.F. DGCR8 HITS-CLIP reveals novel functions for the Microprocessor. Nat. Struct. Mol. Biol. 2012, 19, 760–766. [Google Scholar] [CrossRef]
- Kadener, S.; Rodriguez, J.; Abruzzi, K.C.; Khodor, Y.L.; Sugino, K.; Marr, M.T.; Nelson, S.; Rosbash, M. Genome-wide identification of targets of the drosha-pasha/DGCR8 complex. RNA 2009, 15, 537–545. [Google Scholar] [CrossRef]
- Melamed, Z.; Levy, A.; Ashwal-Fluss, R.; Lev-Maor, G.; Mekahel, K.; Atias, N.; Gilad, S.; Sharan, R.; Levy, C.; Kadener, S.; et al. Alternative splicing regulates biogenesis of miRNAs located across exon-intron junctions. Mol. Cell 2013, 50, 869–881. [Google Scholar] [CrossRef]
- Agranat-Tamir, L.; Shomron, N.; Sperling, J.; Sperling, R. Interplay between pre-mRNA splicing and microRNA biogenesis within the supraspliceosome. Nucleic Acids Res. 2014, 42, 4640–4651. [Google Scholar] [CrossRef]
- Janas, M.M.; Khaled, M.; Schubert, S.; Bernstein, J.G.; Golan, D.; Veguilla, R.A.; Fisher, D.E.; Shomron, N.; Levy, C.; Novina, C.D. Feed-forward microprocessing and splicing activities at a microRNA-containing intron. PLoS Genet. 2011, 7, e1002330. [Google Scholar] [CrossRef]
- Liang, H.; Li, W.H. MicroRNA regulation of human protein protein interaction network. RNA 2007, 13, 1402–1408. [Google Scholar] [CrossRef]
- Satoh, J. Molecular network analysis of human microRNA targetome: From cancers to Alzheimer’s disease. BioData Min. 2012, 5, 17. [Google Scholar] [CrossRef]
- Fiscon, G.; Conte, F.; Farina, L.; Paci, P. Network-Based Approaches to Explore Complex Biological Systems towards Network Medicine. Genes 2018, 9, 437. [Google Scholar] [CrossRef]
- Zhu, W.; Chen, Y.P. Computational developments in microRNA-regulated protein–protein interactions. BMC Syst. Biol. 2014, 8, 14. [Google Scholar] [CrossRef][Green Version]
- Yosef, N.; Zalckvar, E.; Rubinstein, A.D.; Homilius, M.; Atias, N.; Vardi, L.; Berman, I.; Zur, H.; Kimchi, A.; Ruppin, E.; et al. ANAT: A tool for constructing and analyzing functional protein networks. Sci. Signal. 2011, 4, pl1. [Google Scholar] [CrossRef]
- Adinolfi, M.; Pietrosanto, M.; Parca, L.; Ausiello, G.; Ferre, F.; Helmer-Citterich, M. Discovering sequence and structure landscapes in RNA interaction motifs. Nucleic Acids Res. 2019, 47, 4958–4969. [Google Scholar] [CrossRef]
- Ben-Hamo, R.; Efroni, S. MicroRNA regulation of molecular pathways as a generic mechanism and as a core disease phenotype. Oncotarget 2015, 6, 1594–1604. [Google Scholar] [CrossRef]


| HSA | MMU | DME | DRE | |
|---|---|---|---|---|
| Protein Coding Genes | ||||
| intragenic | 52.38 | 58.16 | 52.33 | 23.36 |
| antisense | 12.08 | 11.66 | 12.02 | 9.12 |
| overlapping | 0.31 | 0.33 | 0.78 | 0.28 |
| intronic | 88.63 | 79.86 | 76.03 | 95.52 |
| exonic | 6.77 | 9.38 | 19.01 | 4.48 |
| mixed | 4.59 | 10.76 | 4.96 | 0.00 |
| All Genes | ||||
| intragenic | 66.70 | 68.52 | 70.93 | 34.76 |
| antisense | 19.45 | 15.58 | 13.95 | 11.97 |
| overlapping | 0.84 | 2.20 | 1.16 | 1.42 |
| intronic | 79.98 | 75.04 | 59.75 | 75.51 |
| exonic | 9.74 | 13.68 | 34.59 | 18.37 |
| mixed | 10.27 | 11.28 | 5.66 | 6.12 |
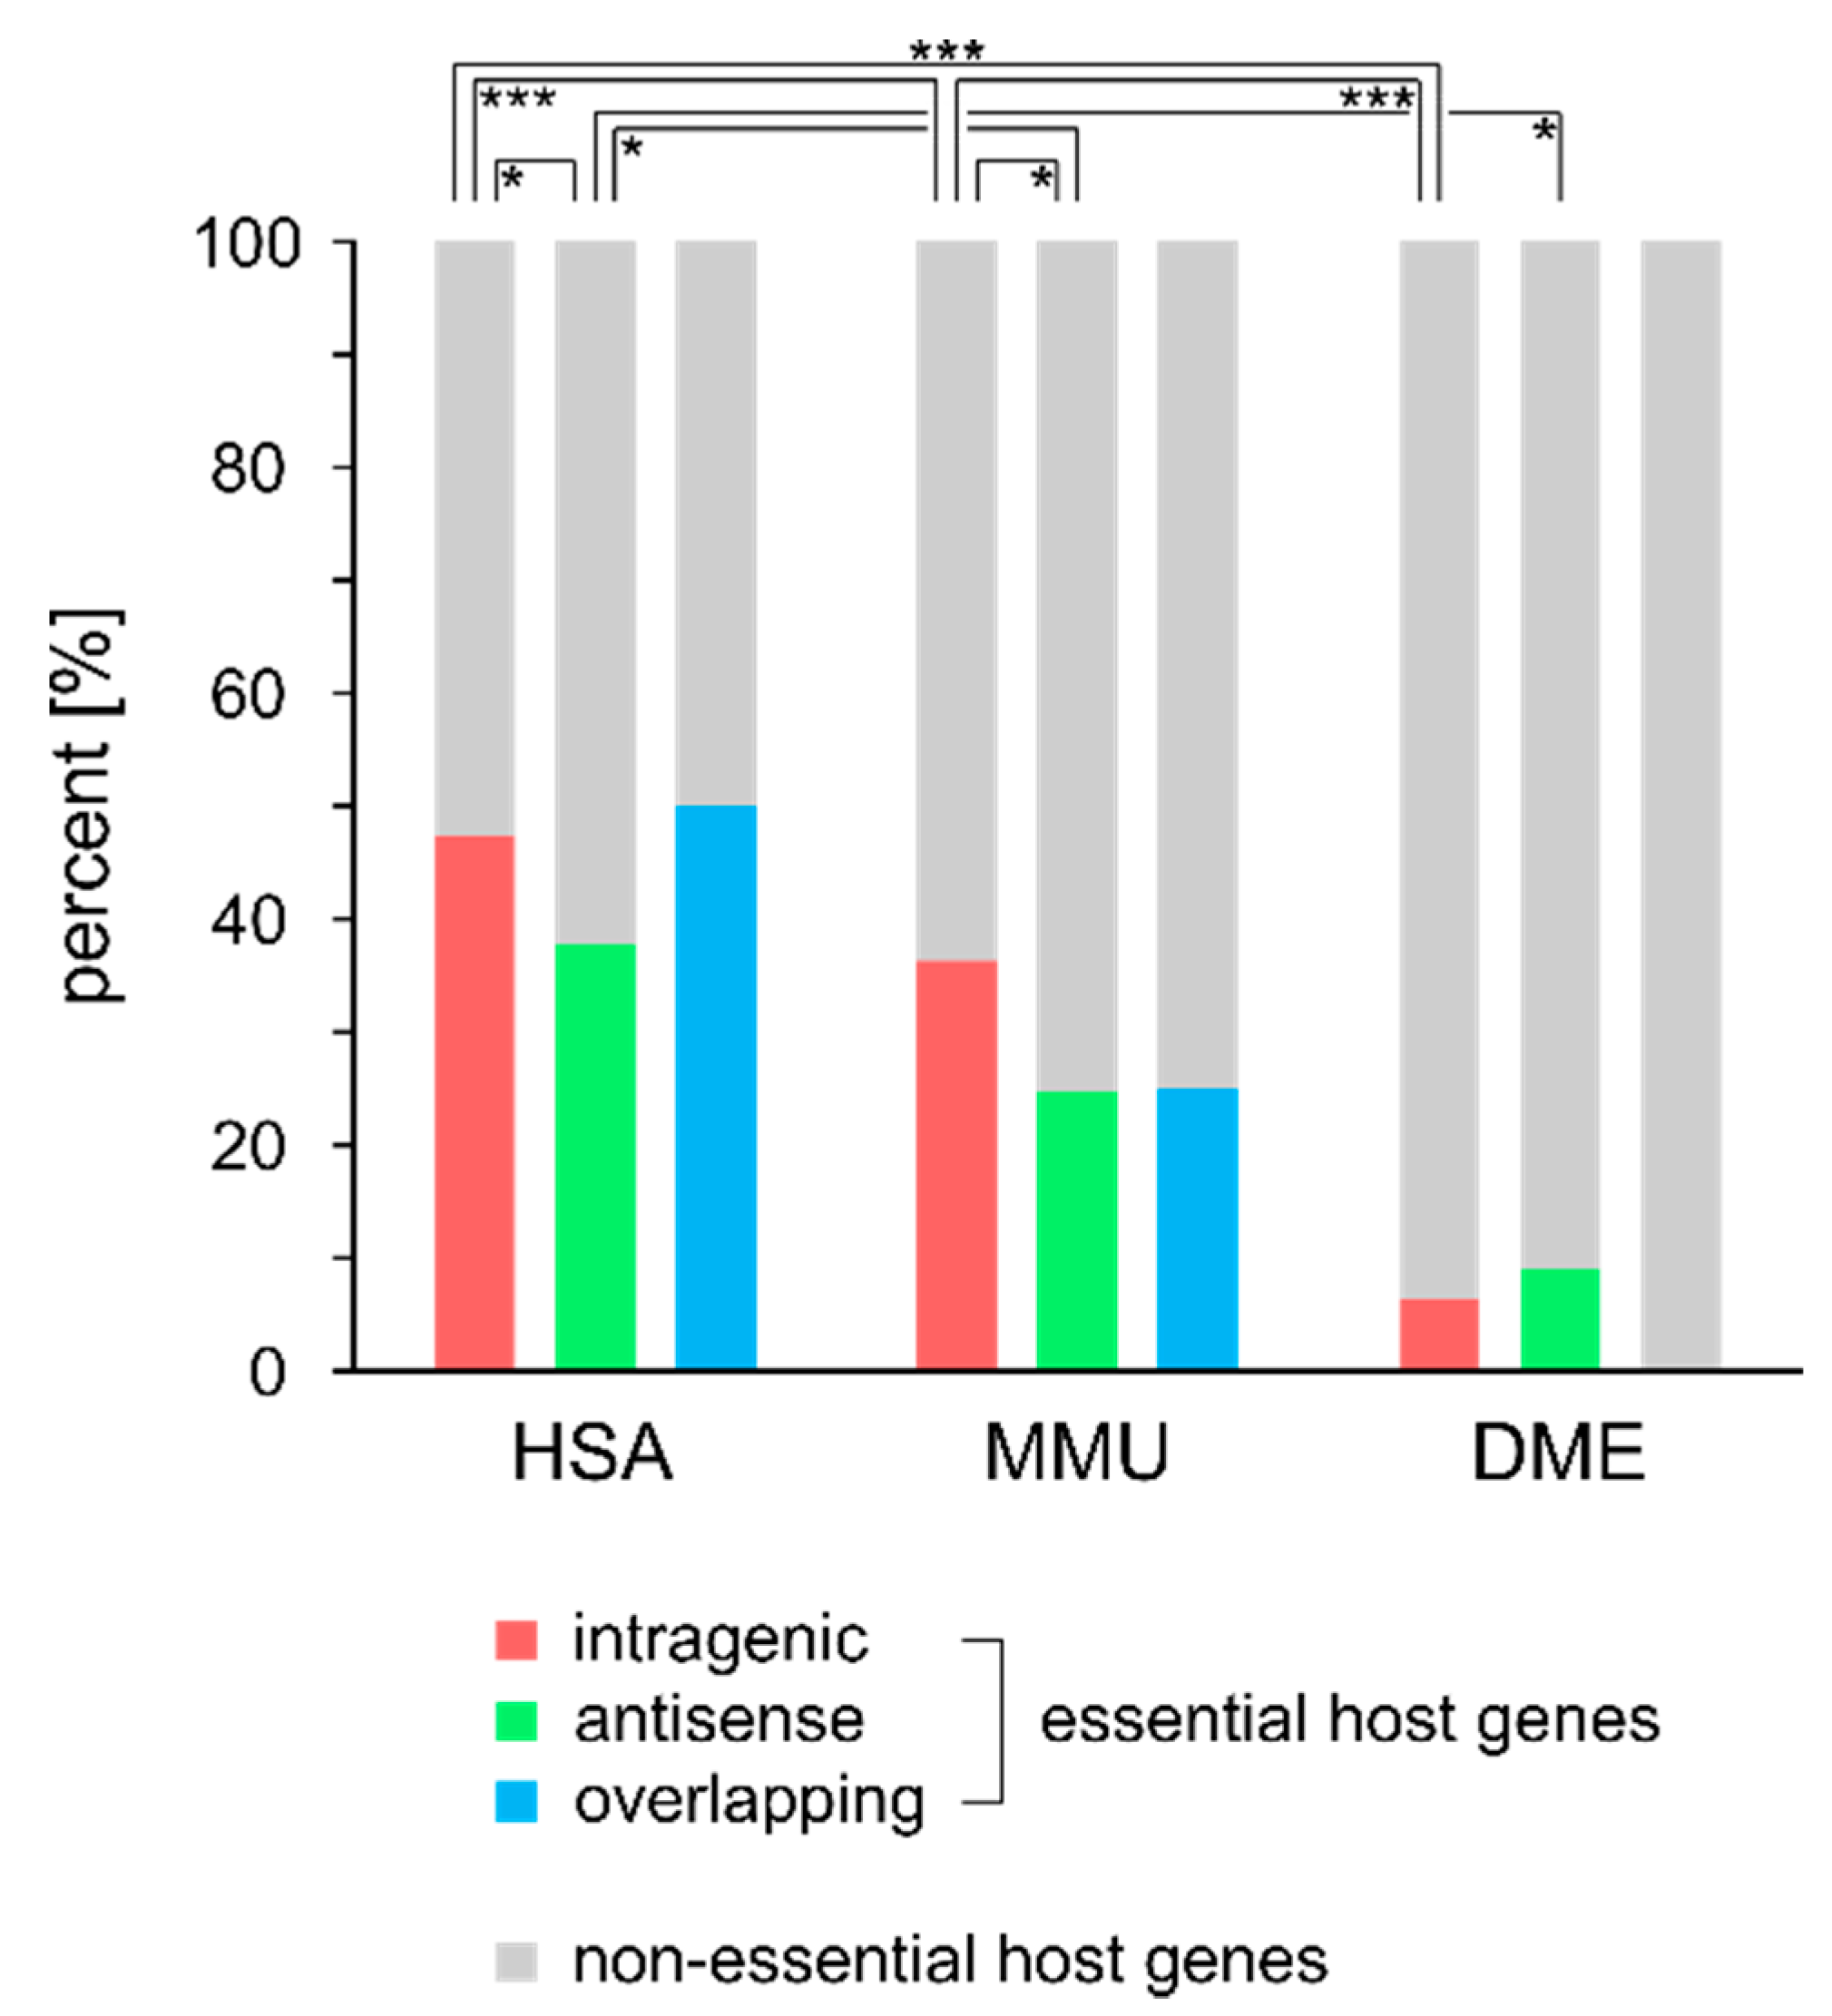
| Essential | Non-Essential | OGEE Essential | OGEE Non-Essential | Chi2 | p-Value | ||
|---|---|---|---|---|---|---|---|
| HSA | intragenic | 444 | 493 | 7168 | 14,398 | 79.47 | <0.0001 |
| antisense | 81 | 133 | 7168 | 14,398 | 1.82 | >0.05 | |
| overlapping | 3 | 3 | 7168 | 14,398 | - | - | |
| MMU | intragenic | 223 | 391 | 4341 | 4701 | 31.06 | <0.001 |
| antisense | 30 | 91 | 4341 | 4701 | 24.87 | <0.001 | |
| overlapping | 1 | 3 | 4341 | 4701 | - | - | |
| DME | intragenic | 8 | 119 | 408 | 13,810 | 4.11 | 0.043 |
| antisense | 2 | 20 | 408 | 13,810 | 1.22 | 0.27 | |
| overlapping | 0 | 3 | 408 | 13,810 | - | - |
| HSA | MMU | DME | |
|---|---|---|---|
| Average mDPS | |||
| intragenic | 0.38 | 0.39 | 0.34 |
| antisense | 0.35 | 0.33 | 0.39 |
| overlapping | 0.23 | 0.21 | 0.00 |
| near-gene | 0.28 | 0.26 | 0.20 |
| Target Probability | |||
| intragenic | 68.41 | 74.07 | 56.59 |
| antisense | 66.09 | 67.20 | 67.86 |
| overlapping | 46.15 | 50.00 | 0.00 |
| near-gene | 55.51 | 51.44 | 38.83 |
| miRNA Name | # Edges | Average miTG Score | |
|---|---|---|---|
| HSA | hsa-miR-766-3p | 748 | 0.53 |
| hsa-miR-5193 | 743 | 0.56 | |
| hsa-miR-761 | 738 | 0.57 | |
| hsa-miR-4731-5p | 735 | 0.55 | |
| hsa-miR-6512-3p | 733 | 0.53 | |
| hsa-miR-338-3p | 730 | 0.51 | |
| hsa-miR-6764-5p | 730 | 0.53 | |
| hsa-miR-1237-3p | 727 | 0.53 | |
| hsa-miR-942-5p | 725 | 0.57 | |
| hsa-miR-6736-3p | 719 | 0.56 | |
| MMU | mmu-miR-7033-5p | 512 | 0.56 |
| mmu-miR-330-5p | 489 | 0.51 | |
| mmu-miR-6904-5p | 484 | 0.52 | |
| mmu-miR-1968-5p | 481 | 0.51 | |
| mmu-miR-6914-5p | 478 | 0.51 | |
| mmu-miR-6945-5p | 476 | 0.51 | |
| mmu-miR-6958-3p | 476 | 0.52 | |
| mmu-miR-7064-5p | 474 | 0.52 | |
| mmu-miR-6937-3p | 473 | 0.51 | |
| mmu-miR-6946-3p | 472 | 0.61 |
© 2020 by the authors. Licensee MDPI, Basel, Switzerland. This article is an open access article distributed under the terms and conditions of the Creative Commons Attribution (CC BY) license (http://creativecommons.org/licenses/by/4.0/).
Share and Cite
Zeidler, M.; Hüttenhofer, A.; Kress, M.; Kummer, K.K. Intragenic MicroRNAs Autoregulate Their Host Genes in Both Direct and Indirect Ways—A Cross-Species Analysis. Cells 2020, 9, 232. https://doi.org/10.3390/cells9010232
Zeidler M, Hüttenhofer A, Kress M, Kummer KK. Intragenic MicroRNAs Autoregulate Their Host Genes in Both Direct and Indirect Ways—A Cross-Species Analysis. Cells. 2020; 9(1):232. https://doi.org/10.3390/cells9010232
Chicago/Turabian StyleZeidler, Maximilian, Alexander Hüttenhofer, Michaela Kress, and Kai K. Kummer. 2020. "Intragenic MicroRNAs Autoregulate Their Host Genes in Both Direct and Indirect Ways—A Cross-Species Analysis" Cells 9, no. 1: 232. https://doi.org/10.3390/cells9010232
APA StyleZeidler, M., Hüttenhofer, A., Kress, M., & Kummer, K. K. (2020). Intragenic MicroRNAs Autoregulate Their Host Genes in Both Direct and Indirect Ways—A Cross-Species Analysis. Cells, 9(1), 232. https://doi.org/10.3390/cells9010232