Genetic Associations with Aging Muscle: A Systematic Review


Abstract
1. Introduction
2. Materials and Methods
2.1. Literature Search and Eligibility Criteria
2.1.1. Inclusion and Exclusion Criteria
- Published between January 2004 and March 2019.
- Full English text available.
- Participants must be non-institutionalised human adults, aged 50 years or above.
- Subjects must have been free from any significant cardiovascular, metabolic or musculoskeletal disorders at the time of the study.
- Candidate gene association study or genome wide association study (GWAS).
2.1.2. Search Strategy
2.2. Study Selection and Data Extraction
2.3. Phenotypes
2.4. Quality Assessment
3. Results
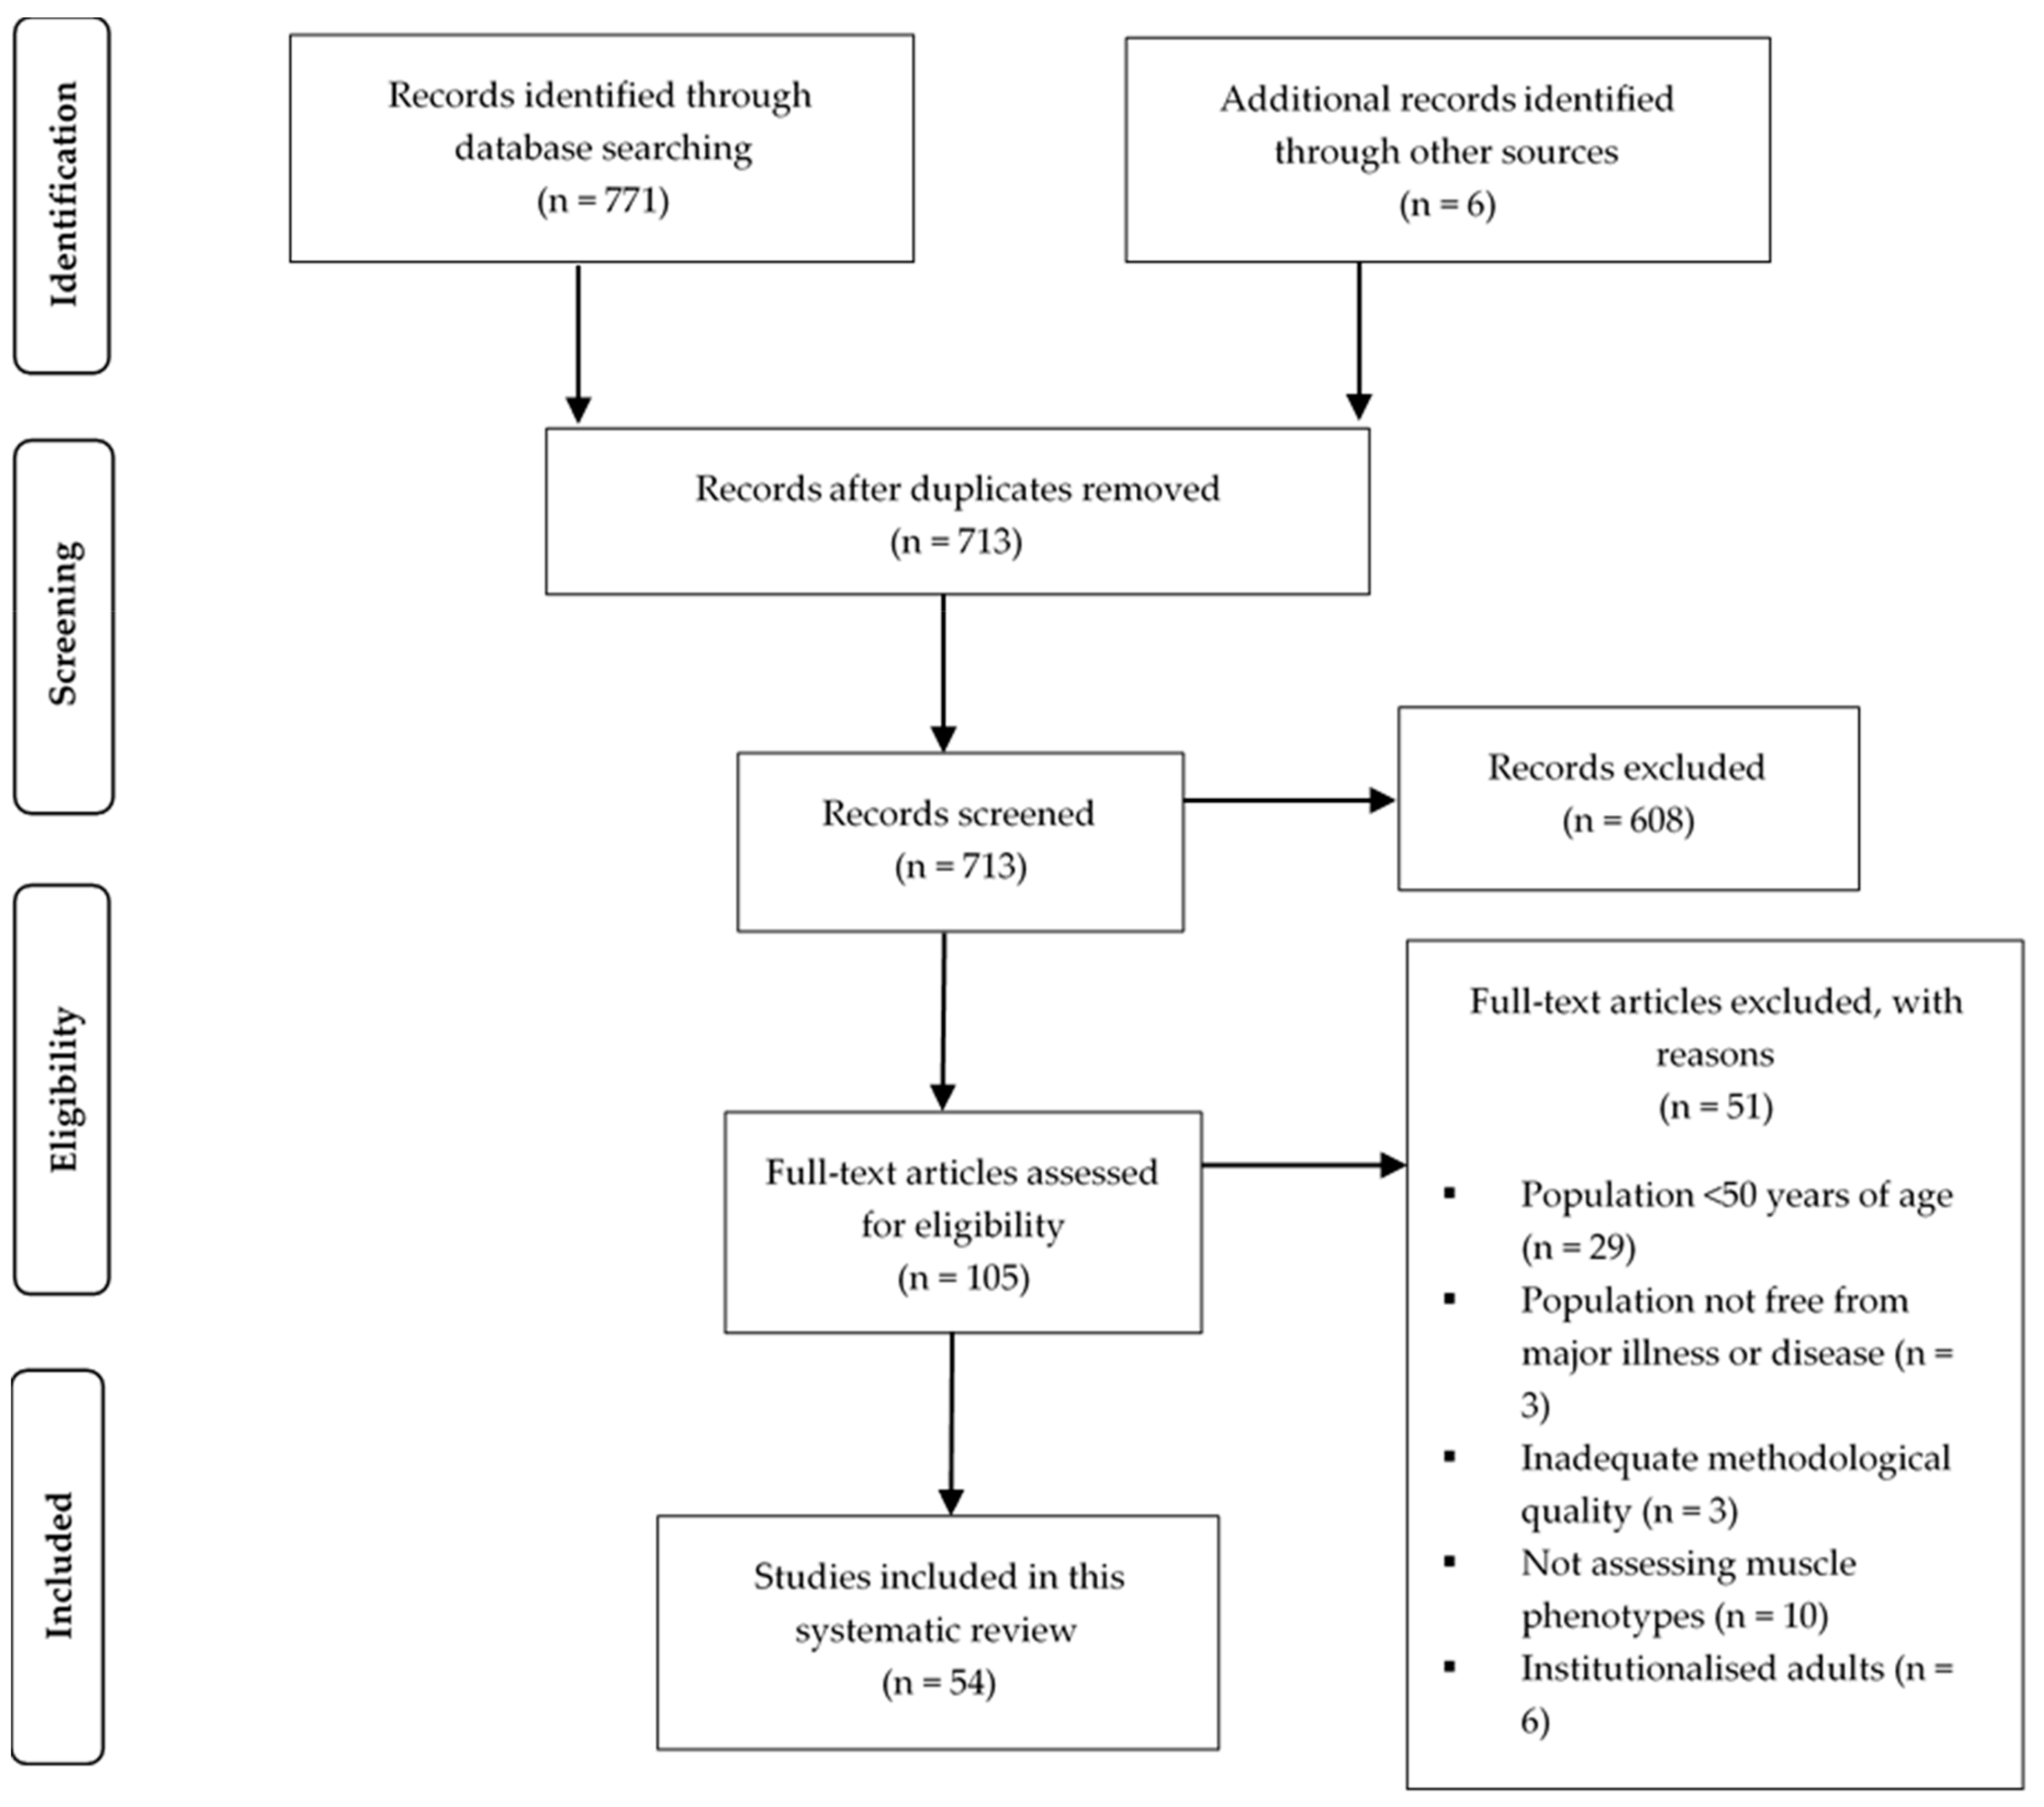
3.1. Search Strategy
3.2. Quality Assessment
3.3. Study and Subject Characteristics
3.4. Phenotypes and Genotypes
3.5. Synthesis of Results
3.5.1. Hormone Genes
VDR
Other Genes
3.5.2. Growth Factor and Cytokine Genes
IGF1 and IGFBP3
CNTF and CNTFR
TNFα
Other Genes
3.5.3. Structural and Metabolic Genes
ACTN3 (The Sprint Gene)
ACE
APOE
UCP2 and UCP3
Genome-wide Studies
4. Discussion
4.1. Summary of Findings
4.1.1. ACTN3 (The Sprint Gene)
4.1.2. ACE
4.1.3. VDR
4.1.4. Other Genes of Interest
4.1.5. IGF1 and IGFBP3
4.1.6. TNFα
4.1.7. APOE
4.1.8. CNTF and CNTFR
4.1.9. UCP2 and UCP3
4.2. Strengths and Limitations
5. Conclusions
Author Contributions
Funding
Conflicts of Interest
References
- Rosenburg, I.H. Sarcopenia: Origins and clinical relevance. J. Nutr. 1997, 127, 990S–S991S. [Google Scholar] [CrossRef] [PubMed]
- Cruz-Jentoft, A.J.; Bahat, G.; Bauer, J.; Boirie, Y.; Bruyère, O.; Cederholm, T.; Cooper, C.; Landi, F.; Rolland, Y.; Sayer, A.A.; et al. Sarcopenia: Revised European consensus on definition and diagnosis. Age Ageing 2019, 48, 16–31. [Google Scholar] [CrossRef] [PubMed]
- Chin, S.O.; Rhee, S.Y.; Chon, S.; Hwang, Y.C.; Jeong, I.K.; Oh, S.; Ahn, K.J.; Chung, H.Y.; Woo, J.T.; Kim, S.W.; et al. Sarcopenia Is independently associated with cardiovascular disease in older Korean adults: The Korea national health and nutrition examination survey (KNHANES) from 2009. PLoS ONE 2013, 8, e60119. [Google Scholar] [CrossRef] [PubMed]
- Janssen, I.; Heymsfield, S.B.; Ross, R. Low relative skeletal muscle mass (sarcopenia) in older persons is associated with functional impairment and physical disability. J. Am. Geriatr. Soc. 2002, 50, 889–896. [Google Scholar] [CrossRef] [PubMed]
- Landi, F.; Liperoti, R.; Russo, A.; Giovannini, S.; Tosato, M.; Capoluongo, E. Sarcopenia as a risk factor for falls in elderly individuals: Results from the ilSIRENTE study. Clin. Nutr. 2012, 31, 652–658. [Google Scholar] [CrossRef] [PubMed]
- Zhang, X.; Zhang, W.; Wang, C.; Tao, W.; Dou, Q.; Yang, Y. Sarcopenia as a predictor of hospitalization among older people: A systematic review and meta-analysis. BMC Geriatr. 2018, 18, 188. [Google Scholar] [CrossRef]
- Kim, T.N.; Choi, K.M. The implications of sarcopenia and sarcopenic obesity on cardiometabolic disease. J. Cell Biochem. 2015, 116, 1171–1178. [Google Scholar] [CrossRef]
- Brown, J.C.; Harhay, M.O.; Harhay, M.N. Sarcopenia and mortality among a population based sample of community-dwelling older adults. J. Cachexia Sarcopenia Muscle 2016, 7, 290–298. [Google Scholar] [CrossRef]
- Shafiee, G.; Keshtkar, A.; Soltani, A.; Ahadi, Z.; Larijani, B.; Heshmat, R. Prevalence of sarcopenia in the world: A systematic review and meta- analysis of general population studies. J. Diabetes Metab. Disord. 2017, 16, 16–21. [Google Scholar] [CrossRef]
- Melton, L.J.; Khosla, S.; Crowson, C.S.; O’Connor, M.K.; O’Fallon, W.M.; Riggs, B.L. Epidemiology of sarcopenia. J. Am. Geriatr. Soc. 2000, 48, 625–630. [Google Scholar] [CrossRef]
- Ethgen, O.; Beaudart, C.; Buckinx, F.; Bruyère, O.; Reginster, J.Y. The future prevalence of sarcopenia in Europe: A claim for public health action. Calcif. Tissue Int. 2017, 100, 229–234. [Google Scholar] [CrossRef] [PubMed]
- Keller, K.; Engelhardt, M. Strength and muscle mass loss with aging process. Age and strength loss. Muscles Ligaments Tendons J. 2014, 3, 346–350. [Google Scholar] [CrossRef] [PubMed]
- Deschenes, M.R. Effects of aging on muscle fibre type and size. Sports Med. 2004, 34, 809–824. [Google Scholar] [CrossRef] [PubMed]
- Doherty, T.J. The influence of aging and sex on skeletal muscle mass and strength. Curr. Opin. Clin. Nutr. Metab. Care 2001, 4, 503–508. [Google Scholar] [CrossRef]
- Prior, S.J.; Roth, S.M.; Wang, X.; Kammerer, C.; Miljkovic-Gacic, I.; Bunker, C.H.; Wheeler, V.W.; Patrick, A.L.; Zmuda, J.M. Genetic and environmental influences on skeletal muscle phenotypes as a function of age and sex in large, multigenerational families of African heritage. J. Appl. Physiol. 2007, 103, 1121–1127. [Google Scholar] [CrossRef]
- Kemp, G.J.; Birrell, F.; Clegg, P.D.; Cuthbertson, D.J.; De Vito, G.; Van Dieën, J.H.; Del Din, S.; Eastell, R.; Garnero, P.; Goljanek–Whysall, K.; et al. Developing a toolkit for the assessment and monitoring of musculoskeletal ageing. Age Ageing 2018, 47, 1–19. [Google Scholar] [CrossRef]
- Franzke, B.; Neubauer, O.; Cameron-Smith, D.; Wagner, K.H. Dietary protein, muscle and physical function in the very old. Nutrients 2018, 10, 935. [Google Scholar] [CrossRef]
- Buchmann, N.; Spira, D.; Norman, K.; Demuth, I.; Eckardt, R.; Steinhagen-Thiessen, E. Sleep, muscle mass and muscle function in older people. Dtsch. Arzteblatt Int. 2016, 113, 253–260. [Google Scholar] [CrossRef]
- Yoo, J.I.; Ha, Y.C.; Lee, Y.K.; Hana-Choi; Yoo, M.J.; Koo, K.H. High prevalence of sarcopenia among binge drinking elderly women: A nationwide population-based study. BMC Geriatr. 2017, 17, 114. [Google Scholar] [CrossRef]
- Abney, M.; McPeek, M.S.; Ober, C. Broad and narrow heritabilities of quantitative traits in a founder population. Am. J. Hum. Genet. 2001, 68, 1302–1307. [Google Scholar] [CrossRef]
- Zempo, H.; Miyamoto-Mikami, E.; Kikuchi, N.; Fuku, N.; Miyachi, M.; Murakami, H. Heritability estimates of muscle strength-related phenotypes: A systematic review and meta-analysis. Scand. J. Med. Sci. Sports 2017, 27, 1537–1546. [Google Scholar] [CrossRef] [PubMed]
- Zhai, G.; Ding, C.; Stankovich, J.; Cicuttini, F.; Jones, G. The genetic contribution to longitudinal changes in knee structure and muscle strength: A sibpair study. Arthritis Rheum. 2005, 52, 2830–2834. [Google Scholar] [CrossRef] [PubMed]
- Liberati, A.; Altman, D.; Tetzlaff, J.; Mulrow, C.; Gøtzsche, P.; Ioannidis, J.; Clarke, M.; Devereaux, P.; Kleijnen, J.; Moher, D. The PRISMA statement for reporting systematic reviews and meta-analyses of studies that evaluate health care interventions: Explanation and elaboration. BMJ 2009, 339, b2700. [Google Scholar] [CrossRef] [PubMed]
- Sohani, Z.N.; Meyre, D.; de Souza, R.J.; Joseph, P.G.; Gandhi, M.; Dennis, B.B.; Norman, G.; Anand, S.S. Assessing the quality of published genetic association studies in meta-analyses: The quality of genetic studies (Q-Genie) tool. BMC Genet. 2015, 16, 50. [Google Scholar] [CrossRef] [PubMed]
- Arking, D.E.; Fallin, D.M.; Fried, L.P.; Li, T.; Beamer, B.A.; Xue, Q.L.; Chakravarti, A.; Walston, J. Variation in the ciliary neurotrophic factor gene and muscle strength in older Caucasian women. J. Am. Geriatr. Soc. 2006, 54, 823–826. [Google Scholar] [CrossRef]
- Bahat, G.; Saka, B.; Erten, N.; Ozbek, U.; Coskunpinar, E.; Yildiz, S.; Sahinkaya, T.; Karan, M.A. BsmI polymorphism in the vitamin D receptor gene is associated with leg extensor muscle strength in elderly men. Aging Clin. Exp. Res. 2010, 22, 198–205. [Google Scholar] [CrossRef]
- Barr, R.; Macdonald, H.; Stewart, A.; McGuigan, F.; Rogers, A.; Eastell, R.; Felsenberg, D.; Glüer, C.; Roux, C.; Reid, D.M. Association between vitamin D receptor gene polymorphisms, falls, balance and muscle power: Results from two independent studies (APOSS and OPUS). Osteoporos. Int. 2010, 21, 457–466. [Google Scholar] [CrossRef]
- Björk, A.; Ribom, E.; Johansson, G.; Scragg, R.; Mellström, D.; Grundberg, E.; Ohlsson, C.; Karlsson, M.; Ljunggren, Ö.; Kindmark, A. Variations in the vitamin D receptor gene are not associated with measures of muscle strength, physical performance, or falls in elderly men. Data from MrOS Sweden. J. Steroid Biochem. Mol. Biol. 2019, 187, 160–165. [Google Scholar] [CrossRef]
- Buford, T.W.; Hsu, F.C.; Brinkley, T.E.; Carter, C.S.; Church, T.S.; Dodson, J.A.; Goodpaster, B.H.; McDermott, M.M.; Nicklas, B.J.; Yank, V.; et al. Genetic influence on exercise-induced changes in physical function among mobility-limited older adults. Physiol. Genomics 2014, 46, 149–158. [Google Scholar] [CrossRef]
- Bustamante-Ara, N.; Santiago, C.; Verde, Z.; Yvert, T.; Gómez-Gallego, F.; Rodríguez-Romo, G.; González-Gil, P.; Serra-Rexach, J.A.; Ruiz, J.R.; Lucia, A. ACE and ACTN3 genes and muscle phenotypes in nonagenarians. Int. J. Sports Med. 2010, 31, 221–224. [Google Scholar] [CrossRef]
- Charbonneau, D.E.; Hanson, E.D.; Ludlow, A.T.; Delmonico, M.J.; Hurley, B.F.; Roth, S.M. ACE genotype and the muscle hypertrophic and strength responses to strength training. Med. Sci. Sports Exerc. 2008, 40, 677–683. [Google Scholar] [CrossRef] [PubMed]
- Cho, J.; Lee, I.; Kang, H. ACTN3 Gene and susceptibility to sarcopenia and osteoporotic status in older Korean adults. Biomed. Res. Int. 2017, 2017, 4239648. [Google Scholar] [CrossRef] [PubMed]
- Crocco, P.; Montesanto, A.; Passarino, G.; Rose, G. A common polymorphism in the UCP3 promoter influences hand grip strength in elderly people. Biogerontology 2011, 12, 265–271. [Google Scholar] [CrossRef] [PubMed]
- Da Silva, J.R.D.; Freire, I.V.; Ribeiro, Í.J.; dos Santos, C.S.; Casotti, C.A.; dos Santos, D.B.; Barbosa, A.A.L.; Pereira, R. Improving the comprehension of sarcopenic state determinants: An multivariate approach involving hormonal, nutritional, lifestyle and genetic variables. Mech. Ageing Dev. 2018, 173, 21–28. [Google Scholar] [CrossRef] [PubMed]
- Dato, S.; Soerensen, M.; Montesanto, A.; Lagani, V.; Passarino, G.; Christensen, K.; Christiansen, L. UCP3 polymorphisms, hand grip performance and survival at old age: Association analysis in two Danish middle aged and elderly cohorts. Mech. Ageing Dev. 2012, 133, 530–537. [Google Scholar] [CrossRef]
- De Mars, G.; Windelinckx, A.; Beunen, G.; Delecluse, C.; Lefevre, J.; Thomis, M.A. Polymorphisms in the CNTF and CNTF receptor genes are associated with muscle strength in men and women. J. Appl. Physiol. 2007, 102, 1824–1831. [Google Scholar] [CrossRef]
- Delmonico, M.J.; Kostek, M.C.; Doldo, N.A.; Hand, B.D.; Walsh, S.; Conway, J.M.; Carignan, C.R.; Roth, S.M.; Hurley, B.F. Alpha-actinin-3 (ACTN3) R577X polymorphism influences knee extensor peak power response to strength training in older men and women. J. Gerontol. A Biol. Sci. Med. Sci. 2007, 62, 206–212. [Google Scholar] [CrossRef]
- Delmonico, M.J.; Zmuda, J.M.; Taylor, B.C.; Cauley, J.A.; Harris, T.B.; Manini, T.M.; Schwartz, A.; Li, R.; Roth, S.M.; Hurley, B.F.; et al. Association of the ACTN3 genotype and physical functioning with age in older adults. J. Gerontol. A Biol. Sci. Med. Sci. 2008, 63, 1227–1234. [Google Scholar] [CrossRef]
- Garatachea, N.; Fiuza-Luces, C.; Torres-Luque, G.; Yvert, T.; Santiago, C.; Gómez-Gallego, F.; Ruiz, J.R.; Lucia, A. Single and combined influence of ACE and ACTN3 genotypes on muscle phenotypes in octogenarians. Eur. J. Appl. Physiol. 2012, 112, 2409–2420. [Google Scholar] [CrossRef]
- Giaccaglia, V.; Nicklas, B.; Kritchevsky, S.; Mychalecky, J.; Messier, S.; Bleecker, E.; Pahor, M. Interaction between angiotensin converting enzyme insertion/deletion genotype and exercise training on knee extensor strength in older individuals. Int. J. Sports Med. 2008, 29, 40–44. [Google Scholar] [CrossRef]
- González-Freire, M.; Rodríguez-Romo, G.; Santiago, C.; Bustamante-Ara, N.; Yvert, T.; Gómez-Gallego, F.; Rexach, J.A.S.; Ruiz, J.R.; Lucia, A. The K153R variant in the myostatin gene and sarcopenia at the end of the human lifespan. Age 2010, 32, 405–409. [Google Scholar] [CrossRef] [PubMed][Green Version]
- Gussago, C.; Arosio, B.; Guerini, F.R.; Ferri, E.; Costa, A.S.; Casati, M.; Bollini, E.M.; Ronchetti, F.; Colombo, E.; Bernardelli, G.; et al. Impact of vitamin D receptor polymorphisms in centenarians. Endocrine 2016, 53, 558–564. [Google Scholar] [CrossRef] [PubMed]
- Hand, B.D.; Kostek, M.C.; Ferrell, R.E.; Delmonico, M.J.; Douglass, L.W.; Roth, S.M.; Hagberg, J.M.; Hurley, B.F. Influence of promoter region variants of insulin-like growth factor pathway genes on the strength-training response of muscle phenotypes in older adults. J. Appl. Physiol. 2007, 103, 1678–1687. [Google Scholar] [CrossRef] [PubMed]
- Heckerman, D.; Traynor, B.J.; Picca, A.; Calvani, R.; Marzetti, E.; Hernandez, D.; Nalls, M.; Arepali, S.; Ferrucci, L.; Landi, F. Genetic variants associated with physical performance and anthropometry in old age: A genome-wide association study in the ilSIRENTE cohort. Sci. Rep. 2017, 7, 15879. [Google Scholar] [CrossRef] [PubMed]
- Hopkinson, N.S.; Li, K.W.; Kehoe, A.; Humphries, S.E.; Roughton, M.; Moxham, J.; Montgomery, H.; Polkey, M.I. Vitamin D receptor genotypes influence quadriceps strength in chronic obstructive pulmonary disease. Am. J. Clin. Nutr. 2008, 87, 385–390. [Google Scholar] [CrossRef]
- Judson, R.N.; Wackerhage, H.; Hughes, A.; Mavroeidi, A.; Barr, R.J.; Macdonald, H.M.; Ratkevicius, A.; Reid, D.M.; Hocking, L.J. The functional ACTN3 577X variant increases the risk of falling in older females: Results from two large independent cohort studies. J. Gerontol. A Biol. Sci. Med. Sci. 2011, 66, 130–135. [Google Scholar] [CrossRef]
- Keogh, J.W.L.; Palmer, B.R.; Taylor, D.; Kilding, A.E. ACE and UCP2 gene polymorphisms and their association with baseline and exercise-related changes in the functional performance of older adults. PeerJ 2015, 3, e980. [Google Scholar] [CrossRef]
- Kikuchi, N.; Yoshida, S.; Min, S.K.; Lee, K.; Sakamaki-Sunaga, M.; Okamoto, T.; Nakazato, K. The ACTN3 R577X genotype is associated with muscle function in a Japanese population. Appl. Physiol. Nutr. Metab. 2015, 40, 316–322. [Google Scholar] [CrossRef]
- Klimentidis, Y.C.; Bea, J.W.; Thompson, P.; Klimecki, W.T.; Hu, C.; Wu, G.; Nicholas, S.; Ryckman, K.K.; Chen, Z. Genetic variant in ACVR2B is associated with lean mass. Med. Sci. Sports Exerc. 2016, 48, 1270–1275. [Google Scholar] [CrossRef][Green Version]
- Kostek, M.C.; Delmonico, M.J.; Reichel, J.B.; Roth, S.M.; Douglass, L.; Ferrell, R.E.; Hurley, B.F. Muscle strength response to strength training is influenced by insulin-like growth factor 1 genotype in older adults. J. Appl. Physiol. 2005, 98, 2147–2154. [Google Scholar] [CrossRef]
- Kostek, M.C.; Devaney, J.M.; Gordish-Dressman, H.; Harris, T.B.; Thompson, P.D.; Clarkson, P.M.; Angelopoulos, T.J.; Gordon, P.M.; Moyna, N.M.; Pescatello, L.S.; et al. A polymorphism near IGF1 is associated with body composition and muscle function in women from the Health, Aging, and Body Composition Study. Eur. J. Appl. Physiol. 2010, 110, 315–324. [Google Scholar] [CrossRef] [PubMed]
- Kritchevsky, S.B.; Nicklas, B.J.; Visser, M.; Simonsick, E.M.; Newman, A.B.; Harris, T.B.; Lange, E.M.; Penninx, B.W.; Goodpaster, B.H.; Satterfield, S.; et al. Angiotensin-converting enzyme insertion/deletion genotype, exercise, and physical decline. Jama 2005, 294, 691–698. [Google Scholar] [CrossRef] [PubMed][Green Version]
- Li, C.I.; Li, T.C.; Liao, L.N.; Liu, C.S.; Yang, C.W.; Lin, C.H.; Hsiao, J.H.; Meng, N.H.; Lin, W.Y.; Wu, F.Y.; et al. Joint effect of gene-physical activity and the interactions among CRP, TNF-alpha, and LTA polymorphisms on serum CRP, TNF-alpha levels, and handgrip strength in community-dwelling elders in Taiwan-TCHS-E. Age 2016, 38, 46. [Google Scholar] [CrossRef] [PubMed][Green Version]
- Lima, R.M.; Leite, T.K.; Pereira, R.W.; Rabelo, H.T.; Roth, S.M.; Oliveira, R.J. ACE and ACTN3 genotypes in older women: Muscular phenotypes. Int. J. Sports Med. 2011, 32, 66–72. [Google Scholar] [CrossRef] [PubMed]
- Lin, C.C.; Wu, F.Y.; Liao, L.N.; Li, C.I.; Lin, C.H.; Yang, C.W.; Meng, N.H.; Chang, C.K.; Lin, W.Y.; Liu, C.S.; et al. Association of CRP gene polymorphisms with serum CRP level and handgrip strength in community-dwelling elders in Taiwan: Taichung Community Health Study for Elders (TCHS-E). Exp. Gerontol. 2014, 57, 141–148. [Google Scholar] [CrossRef] [PubMed]
- Lin, C.H.; Lin, C.C.; Tsai, C.W.; Chang, W.S.; Yang, M.D.; Bau, D.T. A novel caveolin-1 biomarker for clinical outcome of sarcopenia. In Vivo 2014, 28, 383–389. [Google Scholar]
- Lunardi, C.C.; Lima, R.M.; Pereira, R.W.; Leite, T.K.; Siqueira, A.B.; Oliveira, R.J. Association between polymorphisms in the TRHR gene, fat-free mass, and muscle strength in older women. Age 2013, 35, 2477–2483. [Google Scholar] [CrossRef]
- Ma, T.; Lu, D.; Zhu, Y.S.; Chu, X.F.; Wang, Y.; Shi, G.P.; Wang, Z.D.; Yu, L.; Jiang, X.Y.; Wang, X.F. ACTN3 genotype and physical function and frailty in an elderly Chinese population: The rugao longevity and ageing study. Age Ageing 2018, 47, 416–422. [Google Scholar] [CrossRef]
- McCauley, T.; Mastana, S.S.; Folland, J.P. ACE I/D and ACTN3 R/X polymorphisms and muscle function and muscularity of older Caucasian men. Eur. J. Appl. Physiol. 2010, 109, 269–277. [Google Scholar] [CrossRef]
- Melzer, D.; Dik, M.G.; van Kamp, G.J.; Jonker, C.; Deeg, D.J. The apolipoprotein E e4 polymorphism is strongly associated with poor mobility performance test results but not self-reported limitation in older people. J. Gerontol. A Biol. Sci. Med. Sci. 2005, 60, 1319–1323. [Google Scholar] [CrossRef]
- Mora, M.; Perales, M.J.; Serra-Prat, M.; Palomera, E.; Buquet, X.; Oriola, J.; Puig-Domingo, M.; Mataró Ageing Study Group. Aging phenotype and its relationship with IGF-I gene promoter polymorphisms in elderly people living in Catalonia. Growth Horm. IGF Res. 2011, 21, 174–180. [Google Scholar] [CrossRef] [PubMed]
- Onder, G.; Capoluongo, E.; Danese, P.; Settanni, S.; Russo, A.; Concolino, P.; Bernabei, R.; Landi, F. Vitamin D receptor polymorphisms and falls among older adults living in the community: Results from the ilSIRENTE study. J. Bone Miner. Res. 2008, 23, 1031–1036. [Google Scholar] [CrossRef] [PubMed]
- Pereira, A.; Costa, A.M.; Izquierdo, M.; Silva, A.J.; Bastos, E.; Marques, M.C. ACE I/D and ACTN3 R/X polymorphisms as potential factors in modulating exercise-related phenotypes in older women in response to a muscle power training stimuli. Age 2013, 35, 1949–1959. [Google Scholar] [CrossRef] [PubMed]
- Pereira, A.; Costa, A.M.; Leitão, J.C.; Monteiro, A.M.; Izquierdo, M.; Silva, A.J.; Bastos, E.; Marques, M.C. The influence of ACE ID and ACTN3 R577X polymorphisms on lower-extremity function in older women in response to high-speed power training. BMC Geriatr. 2013, 13, 131. [Google Scholar] [CrossRef]
- Pereira, D.S.; Mateo, E.C.C.; de Queiroz, B.Z.; Assumpção, A.M.; Miranda, A.S.; Felício, D.C.; Rocha, N.P.; dos Anjos, D.M.D.C.; Pereira, D.A.G.; Teixeira, A.L.; et al. TNF-alpha, IL6, and IL10 polymorphisms and the effect of physical exercise on inflammatory parameters and physical performance in elderly women. Age 2013, 35, 2455–2463. [Google Scholar] [CrossRef]
- Prakash, J.; Herlin, M.; Kumar, J.; Garg, G.; Akesson, K.E.; Grabowski, P.S.; Skerry, T.M.; Richards, G.O.; McGuigan, F.E. Analysis of RAMP3 gene polymorphism with body composition and bone density in young and elderly women. Gene X 2019, 2, 100009. [Google Scholar] [CrossRef]
- Roth, S.M.; Zmuda, J.M.; Cauley, J.A.; Shea, P.R.; Ferrell, R.E. Vitamin D receptor genotype is associated with fat-free mass and sarcopenia in elderly men. J. Gerontol. A Biol. Sci. Med. Sci. 2004, 59, 10–15. [Google Scholar] [CrossRef]
- Skoog, I.; Hörder, H.; Frändin, K.; Johansson, L.; Östling, S.; Blennow, K.; Zetterberg, H.; Zettergren, A. Association between APOE genotype and change in physical function in a population-based swedish cohort of older individuals followed over four years. Front. Aging Neurosci. 2016, 8, 225. [Google Scholar] [CrossRef]
- Tiainen, K.; Thinggaard, M.; Jylha, M.; Bladbjerg, E.; Christensen, K.; Christiansen, L. Associations between inflammatory markers, candidate polymorphisms and physical performance in older Danish twins. Exp. Gerontol. 2012, 47, 109–115. [Google Scholar] [CrossRef]
- Urano, T.; Shiraki, M.; Sasaki, N.; Ouchi, Y.; Inoue, S. Large-scale analysis reveals a functional single-nucleotide polymorphism in the 5’-flanking region of PRDM16 gene associated with lean body mass. Aging Cell 2014, 13, 739–743. [Google Scholar] [CrossRef]
- Verghese, J.; Holtzer, R.; Wang, C.; Katz, M.J.; Barzilai, N.; Lipton, R.B. Role of APOE genotype in gait decline and disability in aging. J. Gerontol. A Biol. Sci. Med. Sci. 2013, 68, 1395–1401. [Google Scholar] [CrossRef] [PubMed]
- Walsh, S.; Zmuda, J.M.; Cauley, J.A.; Shea, P.R.; Metter, E.J.; Hurley, B.F.; Ferrell, R.E.; Roth, S.M. Androgen receptor CAG repeat polymorphism is associated with fat-free mass in men. J. Appl. Physiol. 2005, 98, 132–137. [Google Scholar] [CrossRef] [PubMed]
- Wu, F.Y.; Liu, C.S.; Liao, L.N.; Li, C.I.; Lin, C.H.; Yang, C.W.; Meng, N.H.; Lin, W.Y.; Chang, C.K.; Hsiao, J.H.; et al. Vitamin D receptor variability and physical activity are jointly associated with low handgrip strength and osteoporosis in community-dwelling elderly people in Taiwan: The Taichung Community Health Study for Elders (TCHS-E). Osteoporos. Int. 2014, 25, 1917–1929. [Google Scholar] [CrossRef] [PubMed]
- Xia, Z.; Man, Q.; Li, L.; Song, P.; Jia, S.; Song, S.; Meng, L.; Zhang, J. Vitamin D receptor gene polymorphisms modify the association of serum 25-hydroxyvitamin D levels with handgrip strength in the elderly in Northern China. Nutrition 2019, 57, 202–207. [Google Scholar] [CrossRef]
- Yang, C.W.; Li, T.C.; Li, C.I.; Liu, C.S.; Lin, C.H.; Lin, W.Y.; Lin, C.C. Insulin like growth factor-1 and its binding protein-3 polymorphisms predict circulating IGF-1 level and appendicular skeletal muscle mass in Chinese elderly. J. Am. Med. Dir. Assoc. 2015, 16, 365–370. [Google Scholar] [CrossRef]
- Yoshihara, A.; Tobina, T.; Yamaga, T.; Ayabe, M.; Yoshitake, Y.; Kimura, Y.; Shimada, M.; Nishimuta, M.; Nakagawa, N.; Ohashi, M.; et al. Physical function is weakly associated with angiotensin-converting enzyme gene I/D polymorphism in elderly Japanese subjects. Gerontology 2009, 55, 387–392. [Google Scholar] [CrossRef]
- Zempo, H.; Tanabe, K.; Murakami, H.; Iemitsu, M.; Maeda, S.; Kuno, S. ACTN3 polymorphism affects thigh muscle area. Int. J. Sports Med. 2010, 31, 138–142. [Google Scholar] [CrossRef]
- Zempo, H.; Tanabe, K.; Murakami, H.; Iemitsu, M.; Maeda, S.; Kuno, S. Age differences in the relation between ACTN3 R577X polymorphism and thigh-muscle cross-sectional area in women. Genet. Test. Mol. Biomark. 2011, 15, 639–643. [Google Scholar] [CrossRef]
- Montgomery, H.E.; Marshall, R.; Hemingway, H.; Myerson, S.; Clarkson, P.; Dollery, C.; Hayward, M.; Holliman, D.E.; Jubb, M.; World, M.; et al. Human gene for physical performance. Nature 1998, 393, 221–222. [Google Scholar] [CrossRef]
- Cordero, A.I.H.; Gonzales, N.M.; Parker, C.C.; Sokoloff, G.; Vandenbergh, D.J.; Cheng, R.; Abney, M.; Skol, A.; Douglas, A.; Palmer, A.A.; et al. Genome-wide associations reveal human-mouse genetic convergence and modifiers of myogenesis, CPNE1 and STC2. Am. J. Hum. Genet. 2019, 105, 1222–1236. [Google Scholar] [CrossRef]
- Zillikens, M.C.; Demissie, S.; Hsu, Y.H.; Yerges-Armstrong, L.M.; Chou, W.C.; Stolk, L.; Livshits, G.; Broer, L.; Johnson, T.; Koller, D.L.; et al. Large meta-analysis of genome-wide association studies identifies five loci for lean body mass. Nat. Commun. 2017, 8, 80. [Google Scholar] [CrossRef] [PubMed]
- Houweling, P.J.; North, K.N. Sarcomeric α-actinins and their role in human muscle disease. Future Neurol. 2009, 4, 731–741. [Google Scholar] [CrossRef]
- Blanchard, A.; Ohanian, V.; Critchley, D. The structure and function of α-actinin. J. Muscle Res. Cell Motil. 1989, 10, 280–289. [Google Scholar] [CrossRef] [PubMed]
- North, K.N.; Yang, N.; Wattanasirichaigoon, D.; Mills, M.; Easteal, S.; Beggs, A.H. A common nonsense mutation results in alpha-actinin-3 deficiency in the general population. Nat. Genet. 1999, 21, 353–354. [Google Scholar] [CrossRef]
- Yang, N.; MacArthur, D.G.; Gulbin, J.P.; Hahn, A.G.; Beggs, A.H.; Easteal, S.; North, K. ACTN3 genotype is associated with human elite athletic performance. Am. J. Hum. Genet. 2003, 73, 627–631. [Google Scholar] [CrossRef]
- Druzhevskaya, A.M.; Ahmetov, I.I.; Astratenkova, I.V.; Rogozkin, V.A. Association of the ACTN3 R577X polymorphism with power athlete status in Russians. Eur. J. Appl. Physiol. 2008, 103, 631–634. [Google Scholar] [CrossRef]
- Papadimitriou, I.D.; Lucia, A.; Pitsiladis, Y.P.; Pushkarev, V.P.; Dyatlov, D.A.; Orekhov, E.F.; Artioli, G.G.; Guilherme, J.P.L.; Lancha, A.H.; Ginevičienė, V.; et al. ACTN3 R577X and ACE I/D gene variants influence performance in elite sprinters: A multi-cohort study. BMC Genomics 2016, 17, 285. [Google Scholar] [CrossRef]
- Tieland, M.; Trouwborst, I.; Clark, B.C. Skeletal muscle performance and ageing. J. Cachexia Sarcopenia Muscle 2018, 9, 3–19. [Google Scholar] [CrossRef]
- Pickering, C.; Kiely, J. ACTN3: More than just a gene for speed. Front. Physiol. 2017, 8, 1080. [Google Scholar] [CrossRef]
- Kumagai, H.; Tobina, T.; Ichinoseki-Sekine, N.; Kakigi, R.; Tsuzuki, T.; Zempo, H.; Shiose, K.; Yoshimura, E.; Kumahara, H.; Ayabe, M.; et al. Role of selected polymorphisms in determining muscle fiber composition in Japanese men and women. J. Appl. Physiol. 2018, 124, 1377–1384. [Google Scholar] [CrossRef]
- Nielsen, J.; Christensen, D.L. Glucose intolerance in the West African Diaspora: A skeletal muscle fibre type distribution hypothesis. Acta Physiol. 2011, 202, 605–616. [Google Scholar] [CrossRef] [PubMed]
- Ama, P.F.; Simoneau, J.A.; Boulay, M.R.; Serresse, O.; Thériault, G.; Bouchard, C. Skeletal muscle characteristics in sedentary black and Caucasian males. J. Appl. Physiol. 1986, 61, 1758–1761. [Google Scholar] [CrossRef] [PubMed]
- Jeng, C.; Zhao, L.; Wu, K.; Zhou, Y.; Chen, T.; Deng, H.W. Race and socioeconomic effect on sarcopenia and sarcopenic obesity in the Louisiana Osteoporosis Study (LOS). JCSM Clin. Rep. 2018, 3, e00027. [Google Scholar] [CrossRef] [PubMed]
- Rigat, B.; Hubert, C.; Alhenc-Gelas, F.; Cambien, F.; Corvol, P.; Soubrier, F. An insertion/deletion polymorphism in the angiotensin I-converting enzyme gene accounting for half the variance of serum enzyme levels. J. Clin. Invest. 1990, 86, 1343–1346. [Google Scholar] [CrossRef]
- Gordon, S.E.; Davis, B.S.; Carlson, C.J.; Booth, F.W. ANG II is required for optimal overload-induced skeletal muscle hypertrophy. Am. J. Physiol. Endocrinol. Metab. 2001, 280, E150–E159. [Google Scholar] [CrossRef]
- Danser, A.J.; Schalekamp, M.A.; Bax, W.A.; van den Brink, A.M.; Saxena, P.R.; Riegger, G.A.; Schunkert, H. Angiotensin-converting enzyme in the human heart. Effect of the deletion/insertion polymorphism. Circulation 1995, 92, 1387–1388. [Google Scholar] [CrossRef]
- Tiret, L.; Rigat, B.; Visvikis, S.; Breda, C.; Corvol, P.; Cambien, F.; Soubrier, F. Evidence, from combined segregation and linkage analysis, that a variant of the angiotensin I-converting enzyme (ACE) gene controls plasma ACE levels. Am. J. Hum. Genet. 1992, 51, 197–205. [Google Scholar]
- Williams, A.G.; Day, S.H.; Folland, J.P.; Gohlke, P.; Dhamrait, S.; Montgomery, H.E. Circulating angiotensin converting enzyme activity is correlated with muscle strength. Med. Sci. Sports Exerc. 2005, 37, 944–948. [Google Scholar] [CrossRef]
- Myerson, S.; Hemingway, H.; Budget, R.; Martin, J.; Humphries, S.; Montgomery, H. Human angiotensin I-converting enzyme gene and endurance performance. J. Appl. Physiol. 1999, 87, 1313–1316. [Google Scholar] [CrossRef]
- Puthucheary, Z.; Skipworth, J.R.; Rawal, J.; Loosemore, M.; Van Someren, K.; Montgomery, H.E. The ACE gene and human performance: 12 Years on. Sports Med. 2011, 41, 433–448. [Google Scholar] [CrossRef]
- Al-Hinai, A.T.; Hassan, M.O.; Simsek, M.; Al-Barwani, H.; Bayoumi, R. Genotypes and allele frequencies of angiotensin converting enzyme (ACE) insertion/deletion polymorphism among Omanis. J. Sci. Res. Med. Sci. 2002, 4, 25–27. [Google Scholar] [PubMed]
- Wishart, J.M.; Horowitz, M.; Need, A.G.; Scopacasa, F.; Morris, H.A.; Clifton, P.M. Relations between calcium intake, calcitriol, polymorphisms of the vitamin D receptor gene, and calcium absorption in premenopausal women. Am. J. Clin. Nutr. 1997, 65, 798–802. [Google Scholar] [CrossRef] [PubMed]
- Pfeifer, M.; Begerow, B.; Minne, H.W. Vitamin D and muscle function. Osteoporos. Int. 2002, 13, 187–194. [Google Scholar] [CrossRef] [PubMed]
- Whitfield, G.K.; Remus, L.S.; Jurutka, P.W.; Zitzer, H.; Oza, A.K.; Dang, H.T.; Haussler, C.A.; Galligan, M.A.; Thatcher, M.L.; Dominguez, C.E.; et al. Functionally relevant polymorphisms in the human nuclear vitamin D receptor gene. Mol. Cell Endocrinol. 2001, 177, 145–159. [Google Scholar] [CrossRef]
- Baker, A.R.; McDonnell, D.P.; Hughes, M.; Crisp, T.M.; Mangelsdorf, D.J.; Haussler, M.R.; Pike, J.W.; Shine, J.; O’Malley, B.W. Cloning and expression of full-length cDNA encoding human vitamin D receptor. Proc. Natl. Acad. Sci. USA 1988, 85, 3294–3298. [Google Scholar] [CrossRef]
- Arai, H.; Miyamoto, K.I.; Taketani, Y.; Yamamoto, H.; Iemori, Y.; Morita, K.; Tonai, T.; Nishisho, T.; Mori, S.; Takeda, E. A vitamin D receptor gene polymorphism in the translation initiation codon: Effect on protein activity and relation to bone mineral density in Japanese women. J. Bone Miner. Res. 1997, 12, 915–921. [Google Scholar] [CrossRef]
- Moreno Lima, R.; De Abreu, B.S.; Gentil, P.; de Lima Lins, T.C.; Grattapaglia, D.; Pereira, R.W.; De Oliveira, R.J. Lack of association between vitamin D receptor genotypes and haplotypes with fat-free mass in postmenopausal Brazilian women. J. Gerontol. A Biol. Sci. Med. Sci. 2007, 62, 966–972. [Google Scholar] [CrossRef]
- Iki, M.; Saito, Y.; Dohi, Y.; Kajita, E.; Nishino, H.; Yonemasu, K.; Kusaka, Y. Greater trunk muscle torque reduces postmenopausal bone loss at the spine independently of age, body size, and vitamin D receptor genotype in Japanese women. Calcif. Tissue Int. 2002, 71, 300–307. [Google Scholar] [CrossRef]
- Nelson, D.A.; Vande-Vord, P.J.; Wooley, P.H. Polymorphism in the vitamin D receptor gene and bone mass in African-American and white mothers and children: A preliminary report. Ann. Rheum. Dis. 2000, 59, 626–630. [Google Scholar] [CrossRef]
- Fleet, J.C.; Harris, S.S.; Wood, R.J.; Dawson-Hughes, B. The BsmI vitamin D receptor restriction fragment length polymorphism (BB) predicts low bone density in premenopausal black and white women. J. Bone Miner. Res. 1995, 10, 985–990. [Google Scholar] [CrossRef]
- O’Dell, S.D.; Day, I.N. Insulin-like growth factor II (IGF-II). Int. J. Biochem. Cell Biol. 1998, 30, 767–771. [Google Scholar] [CrossRef]
- Stewart, C.E.; Rotwein, P. Growth, differentiation, and survival: Multiple physiological functions for insulin-like growth factors. Physiol. Rev. 1996, 76, 1005–1026. [Google Scholar] [CrossRef] [PubMed]
- Junnila, R.K.; List, E.O.; Berryman, D.E.; Murrey, J.W.; Kopchick, J.J. The GH/IGF-1 axis in ageing and longevity. Nat. Rev. Endocrinol. 2013, 9, 366–376. [Google Scholar] [CrossRef] [PubMed]
- Jones, J.I.; Clemmons, D.R. Insulin-like growth factors and their binding proteins: Biological actions. Endocr. Rev. 1995, 16, 3–34. [Google Scholar] [CrossRef]
- Baxter, G.T.; Kuo, R.C.; Jupp, O.J.; Vandenabeele, P.; MacEwan, D.J. Tumor necrosis factor-alpha mediates both apoptotic cell death and cell proliferation in a human hematopoietic cell line dependent on mitotic activity and receptor subtype expression. J. Biol. Chem. 1999, 274, 9539–9547. [Google Scholar] [CrossRef]
- Bradley, J.R. TNF-mediated inflammatory disease. J. Pathol. 2008, 214, 149–160. [Google Scholar] [CrossRef]
- Costamagna, D.; Costelli, P.; Sampaolesi, M.; Penna, F. Role of inflammation in muscle homeostasis and myogenesis. Mediat. Inflamm. 2015, 2015, 805172. [Google Scholar] [CrossRef]
- Smith, J.D. Apolipoproteins and aging: Emerging mechanisms. Ageing Res. Rev. 2002, 1, 345–365. [Google Scholar] [CrossRef]
- Bertram, L.; McQueen, M.B.; Mullin, K.; Blacker, D.; Tanzi, R.E. Systematic meta-analyses of Alzheimer disease genetic association studies: The AlzGene database. Nat. Genet. 2007, 39, 17–23. [Google Scholar] [CrossRef]
- Fullerton, S.M.; Clark, A.G.; Weiss, K.M.; Nickerson, D.A.; Taylor, S.L.; Stengård, J.H.; Salomaa, V.; Vartiainen, E.; Perola, M.; Boerwinkle, E.; et al. Apolipoprotein E variation at the sequence haplotype level: Implications for the origin and maintenance of a major human polymorphism. Am. J. Hum. Genet. 2000, 67, 881–900. [Google Scholar] [CrossRef]
- Kami, K.; Morikawa, Y.; Sekimoto, M.; Senba, E. Gene expression of receptors for IL-6, LIF, and CNTF in regenerating skeletal muscles. J. Histochem. Cytochem. 2000, 48, 1203–1213. [Google Scholar] [CrossRef] [PubMed]
- Sendtner, M.; Kreutzberg, G.W.; Thoenen, H. Ciliary neurotrophic factor prevents the degeneration of motor neurons after axotomy. Nature 1990, 345, 440–441. [Google Scholar] [CrossRef] [PubMed]
- Sleeman, M.W.; Anderson, K.D.; Lambert, P.D.; Yancopoulos, G.D.; Wiegand, S.J. The ciliary neurotrophic factor and its receptor, CNTFR alpha. Pharm. Acta Helv. 2000, 74, 265–272. [Google Scholar] [CrossRef]
- Schrauwen, P.; Hesselink, M. UCP2 and UCP3 in muscle controlling body metabolism. J. Exp. Biol. 2002, 205, 2275–2285. [Google Scholar]
- Schrauwen, P.; Hoeks, J.; Hesselink, M.K. Putative function and physiological relevance of the mitochondrial uncoupling protein-3: Involvement in fatty acid metabolism? Prog. Lipid Res. 2006, 45, 17–41. [Google Scholar] [CrossRef]
- Dhamrait, S.S.; Williams, A.G.; Day, S.H.; Skipworth, J.; Payne, J.R.; World, M.; Humphries, S.E.; Montgomery, H.E. Variation in the uncoupling protein 2 and 3 genes and human performance. J. Appl. Physiol. 2012, 112, 1122–1127. [Google Scholar] [CrossRef]
- Brand, M.D.; Pamplona, R.; Portero-Otín, M.; Requena, J.R.; Roebuck, S.J.; Buckingham, J.A.; Clapham, J.C.; Cadenas, S. Oxidative damage and phospholipid fatty acyl composition in skeletal muscle mitochondria from mice underexpressing or overexpressing uncoupling protein 3. Biochem. J. 2002, 368, 597–603. [Google Scholar] [CrossRef]
- Seo, D.Y.; Lee, S.R.; Kim, N.; Ko, K.S.; Rhee, B.D.; Han, J. Age-related changes in skeletal muscle mitochondria: The role of exercise. Integr. Med. Res. 2016, 5, 182–186. [Google Scholar] [CrossRef]
- Brand, M.D.; Affourtit, C.; Esteves, T.C.; Green, K.; Lambert, A.J.; Miwa, S.; Pakay, J.L.; Parker, N. Mitochondrial superoxide: Production, biological effects, and activation of uncoupling proteins. Free Radic. Biol. Med. 2004, 37, 755–767. [Google Scholar] [CrossRef]
- Colhoun, H.M.; McKeigue, P.M.; Smith, D.G. Problems of reporting genetic associations with complex outcomes. Lancet 2003, 361, 865–872. [Google Scholar] [CrossRef]
- Duncan, L.E.; Ostacher, M.; Ballon, J. How genome-wide association studies (GWAS) made traditional candidate gene studies obsolete. Neuropsychopharmacology 2019, 44, 1518–1523. [Google Scholar] [CrossRef] [PubMed]
- Visscher, P.M.; Wray, N.R.; Zhang, Q.; Sklar, P.; McCarthy, M.I.; Brown, M.A.; Yang, J. 10 Years of GWAS discovery: Biology, function, and translation. Am. J. Hum. Genet. 2017, 101, 5–22. [Google Scholar] [CrossRef] [PubMed]
- Sawcer, S. The complex genetics of multiple sclerosis: Pitfalls and prospects. Brain 2008, 131, 3118–3131. [Google Scholar] [CrossRef] [PubMed]


| Studies | Items | Total | ||||||||||
|---|---|---|---|---|---|---|---|---|---|---|---|---|
| 1 | 2 | 3 | 4 | 5 | 6 | 7 | 8 | 9 | 10 | 11 | ||
| Arkin, et al., 2006. [25] | 4 | 4 | N/A | 4 | 4 | 3 | 3 | 5 | 4 | 5 | 4 | 40 |
| Bahat, et al., 2010. [26] | 4 | 4 | 3 | 4 | 3 | 3 | 3 | 4 | 5 | 4 | 4 | 41 |
| Barr, et al., 2010. [27] | 5 | 3 | N/A | 4 | 5 | 2 | 4 | 5 | 5 | 4 | 5 | 42 |
| Bjork, et al., 2019. [28] | 4 | 4 | N/A | 5 | 4 | 3 | 5 | 5 | 5 | 4 | 4 | 43 |
| Buford, et al., 2014. [29] | 5 | 4 | 3 | 4 | 5 | 3 | 3 | 4 | 6 | 4 | 6 | 47 |
| Bustamante-Ara, et al., 2010. [30] | 6 | 5 | N/A | 6 | 5 | 4 | 2 | 4 | 5 | 3 | 5 | 45 |
| Charbonneau, et al., 2008. [31] | 5 | 5 | N/A | 6 | 5 | 4 | 2 | 5 | 5 | 3 | 4 | 44 |
| Cho, et al., 2017. [32] | 4 | 4 | N/A | 5 | 4 | 3 | 3 | 3 | 4 | 3 | 4 | 37 |
| Crocco, et al., 2011. [33] | 5 | 5 | N/A | 5 | 4 | 3 | 5 | 5 | 5 | 4 | 3 | 44 |
| Da Silva, et al., 2018. [34] | 5 | 4 | 3 | 5 | 4 | 3 | 2 | 4 | 4 | 3 | 5 | 42 |
| Dato, et al., 2012. [35] | 6 | 5 | N/A | 5 | 4 | 3 | 4 | 5 | 4 | 4 | 5 | 45 |
| De Mars, et al., 2007. [36] | 6 | 5 | N/A | 5 | 4 | 3 | 3 | 5 | 5 | 4 | 5 | 45 |
| Delmonico, et al., 2007. [37] | 4 | 4 | N/A | 2 | 3 | 3 | 2 | 4 | 4 | 3 | 4 | 33 |
| Delmonico, et al., 2008. [38] | 5 | 3 | N/A | 3 | 4 | 3 | 5 | 4 | 5 | 3 | 4 | 39 |
| Garatachea, et al., 2012. [39] | 6 | 5 | N/A | 7 | 6 | 4 | 2 | 3 | 5 | 3 | 5 | 46 |
| Giaccaglia, et al., 2008. [40] | 5 | 5 | 5 | 5 | 4 | 5 | 3 | 4 | 5 | 5 | 4 | 50 |
| Gonzalez-Freire, et al., 2010. [41] | 5 | 5 | N/A | 5 | 4 | 3 | 2 | 3 | 4 | 4 | 5 | 40 |
| Gussago, et al., 2016. [42] | 5 | 6 | 4 | 5 | 4 | 3 | 3 | 5 | 4 | 4 | 5 | 48 |
| Hand, et al., 2007. [43] | 5 | 4 | N/A | 6 | 5 | 3 | 3 | 4 | 6 | 3 | 5 | 44 |
| Heckerman, et al., 2017. [44] | 5 | 4 | N/A | 5 | 5 | 4 | 2 | 4 | 5 | 5 | 4 | 43 |
| Hopkinson, et al., 2008. [45] | 4 | 5 | 3 | 4 | 4 | 3 | 3 | 3 | 4 | 4 | 4 | 41 |
| Judson, et al., 2010. [46] | 5 | 4 | N/A | 5 | 5 | 2 | 4 | 3 | 4 | 4 | 4 | 40 |
| Keogh, et al., 2015. [47] | 5 | 4 | N/A | 5 | 4 | 3 | 2 | 4 | 3 | 4 | 5 | 39 |
| Klimentidis, et al., 2016. [48] | 4 | 4 | N/A | 2 | 4 | 4 | 5 | 5 | 5 | 4 | 4 | 41 |
| Kikuchi, et al., 2015. [49] | 5 | 4 | 3 | 4 | 4 | 4 | 5 | 5 | 5 | 4 | 5 | 48 |
| Kostek, et al., 2005. [50] | 5 | 5 | N/A | 5 | 5 | 3 | 3 | 4 | 5 | 4 | 5 | 44 |
| Kostek, et al., 2010. [51] | 5 | 3 | 3 | 5 | 4 | 2 | 3 | 5 | 5 | 4 | 5 | 44 |
| Kritchevsky, et al., 2005. [52] | 5 | 3 | N/A | 5 | 4 | 4 | 5 | 4 | 5 | 4 | 5 | 44 |
| Li, et al., 2016. [53] | 5 | 6 | N/A | 4 | 4 | 3 | 5 | 4 | 5 | 3 | 4 | 43 |
| Lima, et al., 2011. [54] | 5 | 3 | 4 | 5 | 3 | 4 | 3 | 4 | 5 | 4 | 5 | 45 |
| Lin, et al., 2014. [55] | 5 | 4 | 3 | 5 | 3 | 4 | 4 | 5 | 5 | 4 | 5 | 47 |
| Lin, et al., 2014. [56] | 5 | 5 | 4 | 5 | 4 | 3 | 3 | 5 | 5 | 5 | 4 | 48 |
| Lunardi, et al., 2013. [57] | 4 | 6 | N/A | 4 | 3 | 3 | 4 | 5 | 4 | 3 | 5 | 41 |
| Ma, et al., 2018. [58] | 6 | 5 | N/A | 5 | 5 | 4 | 5 | 4 | 5 | 3 | 4 | 46 |
| McCauley, et al., 2010. [59] | 5 | 5 | N/A | 5 | 3 | 4 | 3 | 4 | 3 | 3 | 5 | 40 |
| Melzer, et al., 2005. [60] | 5 | 5 | N/A | 4 | 2 | 3 | 4 | 4 | 4 | 4 | 5 | 40 |
| Mora, et al., 2011. [61] | 4 | 3 | N/A | 4 | 4 | 4 | 3 | 4 | 5 | 4 | 5 | 40 |
| Onder, et al., 2008. [62] | 5 | 4 | N/A | 4 | 4 | 3 | 2 | 5 | 3 | 4 | 4 | 38 |
| Pereira, et al., 2013. [63] | 5 | 3 | N/A | 4 | 4 | 4 | 4 | 3 | 4 | 3 | 5 | 39 |
| Pereira, et al., 2013. [64] | 6 | 4 | N/A | 6 | 4 | 4 | 4 | 5 | 5 | 4 | 5 | 47 |
| Pereira, et al., 2013. [65] | 6 | 5 | N/A | 6 | 5 | 3 | 3 | 5 | 5 | 4 | 5 | 47 |
| Prakash, et al., 2019. [66] | 4 | 4 | 3 | 5 | 5 | 3 | 4 | 5 | 4 | 5 | 4 | 46 |
| Roth, et al., 2004. [67] | 5 | 5 | N/A | 4 | 3 | 3 | 5 | 4 | 5 | 4 | 5 | 43 |
| Skoog, et al., 2016. [68] | 6 | 5 | N/A | 4 | 3 | 3 | 3 | 4 | 4 | 3 | 5 | 40 |
| Tiainen, et al., 2012. [69] | 6 | 5 | N/A | 4 | 3 | 4 | 2 | 3 | 3 | 3 | 4 | 37 |
| Urano, et al., 2014. [70] | 5 | 4 | N/A | 5 | 3 | 4 | 4 | 4 | 5 | 4 | 5 | 43 |
| Verghese, et al., 2013. [71] | 5 | 4 | N/A | 4 | 3 | 3 | 5 | 4 | 4 | 4 | 5 | 41 |
| Walsh, et al., 2005. [72] | 5 | 5 | N/A | 5 | 4 | 4 | 2 | 4 | 5 | 4 | 4 | 42 |
| Wu, et al., 2014. [73] | 5 | 5 | N/A | 4 | 4 | 3 | 4 | 4 | 5 | 3 | 4 | 41 |
| Xia, et al., 2019. [74] | 5 | 5 | N/A | 4 | 3 | 4 | 4 | 4 | 5 | 3 | 6 | 43 |
| Yang, et al., 2015. [75] | 5 | 4 | N/A | 4 | 3 | 4 | 3 | 4 | 5 | 4 | 5 | 41 |
| Yoshihara, et al., 2009. [76] | 3 | 4 | N/A | 3 | 3 | 3 | 4 | 3 | 4 | 3 | 3 | 33 |
| Zempo, et al., 2010. [77] | 4 | 4 | N/A | 3 | 3 | 4 | 3 | 4 | 5 | 4 | 4 | 38 |
| Zempo, et al., 2011. [78] | 5 | 4 | N/A | 3 | 3 | 3 | 4 | 4 | 5 | 4 | 4 | 39 |
| Gene | Polymorphism | Population Data | N | Muscle Phenotype | Results | Reference |
|---|---|---|---|---|---|---|
| Hormone Genes | ||||||
| VDR | rs2228570 (Fok1) rs1544410 (Bsm1) | Caucasians 46 males and 58 females Mean age 61.8 ± 8.5 years | 104 | Muscle strength (KE strength) | Individuals homozygous for the F allele of the rs2228570 polymorphism displayed significantly lower KE strength than carriers of ≥ 1 f allele (p = 0.007). KE strength did not differ significantly across rs1544410 genotypes. | Hopkinson, et al., 2008. [45] |
| VDR | rs2228570 rs1544410 | Caucasians (Italians) 87 males and 172 females Aged ≥ 80 years Mean age 85.0 ± 4.5 years | 259 | Physical function (fall incidence) | Participants homozygous for the b allele of the rs1544410 polymorphism were significantly less likely to fall than carriers of ≥ 1 B allele (p = 0.02). Fall incidence did not differ significantly across rs2228570 genotypes. | Onder, et al., 2008. [62] |
| VDR | rs2228570 rs1544410 | Caucasian females (OPUS cohort) Mean age 66.9 ± 7.0 years | 2363 | Muscle strength (lower limb power) Physical function (fall incidence, rise from chair) | Individuals with a bb genotype of the rs1544410 polymorphism were significantly less likely to fall than carriers of ≥ 1 B allele (p = 0.025). These individuals also performed significantly better in rise from chair and lower limb power tests (p = 0.03, 0.044 respectively). Fall incidence, muscle power did not differ significantly across rs2228570 genotypes. | Barr, et al., 2010. [27] |
| VDR | rs2228570 rs1544410 rs731236 (Taq1) | Males living in Turkey Aged 65–93 years Mean age 69 ± 6.9 years | 120 | Muscle strength (KE and KF peak torque) | KE strength was significantly higher in BB homozygotes compared to carriers of ≥ 1 b allele of the rs1544410 polymorphism (p = 0.038). No significant associations were found for rs2228570 and rs731236 genotypes. | Bahat, et al., 2010. [26] |
| Hormone Genes | ||||||
| VDR | rs2228570 (Fok1) rs1544410 (Bsm1) rs731236 (Taq1) rs7975232 (Apa1) | Caucasian male centenarians (Italian) Mean age 102.3 ± 0.3 years | 120 | Muscle strength (HG strength) | FF homozygotes displayed significantly greater HG than individuals with ≥ 1 f allele of the rs2228570 polymorphism (p = 0.021). HG did not differ significantly between rs1544410, rs7975232 and rs731236 genotypes. | Gussago, et al., 2016. [42] |
| VDR | rs7136534 rs9729 rs17882106 rs10735810 rs4516035 rs11568820 rs11574024 | Males living in Sweden Aged 69–81 years Mean age 75.4 ± 3.2 years | 2844 | Muscle strength (HG strength) Physical function (fall incidence, 6 m walk test, 20 cm narrow walk test, timed-stand test) | AA homozygotes were significantly less likely to fall compared to carriers of ≥ 1 G allele of rs7136534 (p = 0.002). No other significant associations were found between polymorphism and muscle strength or function tasks. | Bjork, et al., 2019. [28] |
| VDR | rs2228570 rs1544410 | Caucasian males Aged 58–93 years | 302 | Body composition (FFM, AFFM, SMI) Muscle Strength (KE torque) Sarcopenia (SMI < 7.26 kg/m2) | Men homozygous for the F allele of the rs2228570 polymorphism had significantly less FFM, AFFM and SMI compared to Ff/ff genotypes (p = 0.002, 0.009, 0.001 respectively). FF homozygotes also had 2.17-fold higher risk of sarcopenia than carriers of ≥ 1 f allele (p = 0.03). No similar associations were found between rs1544410 genotypes. | Roth, et al., 2004. [67] |
| Hormone Genes | ||||||
| VDR | rs7975232 (Apa1) rs1544410 (Bsm1) rs2239185 rs3782905 | Taiwanese 215 males and 154 females Mean age 74.4 ± 6.3 years (males) and 71.7 ± 4.7 years (females) | 369 | Muscle strength (HG strength) | Females carrying the AC genotype of rs7975232 polymorphism had significantly lower HG than CC homozygotes (p < 0.05). In both men and women, physical inactivity and the minor allele of each polymorphism were jointly associated with increased risk of low HG. | Wu, et al., 2014. [73] |
| VDR | rs2228570 (Fok1) | Chinese 275 males and 510 females Aged 63.2–72.5 years (males) and 63.1–71.9 years (females) | 785 | Muscle strength (HG strength) Physical function (4 m gait speed) Body composition (FFM, AFFM, SMI) Sarcopenia (SMI < 7.0 kg/m2 for men and < 5.4 kg/m2 for women and either low HG < 26 kg for men and < 18 kg for women or low gait speed < 0.8 m/s for both sexes) | Males who were homozygous for the f allele of the rs2228570 polymorphism had significantly greater HG and SMI when compared to carriers of ≥1 F allele (p = 0.03, 0.04 respectively). These individuals also had a significantly lower risk of sarcopenia (p = 0.03). No similar association was found in the female population. | Xia, et al., 2019. [74] |
| AR | rs3032358 (CAG repeat) | Caucasian males (STORM cohort) Aged 55-93 years Subjects grouped by repeat number (120 males had < 22 and 174 had ≥ 22) | 294 | Body composition (total FFM and SMI) Muscle strength (KE isometric strength and HG strength) | Men who had ≥22 repeats exhibited significantly greater total FFM and SMI than men with < 22 repeats (p < 0.027, < 0.019 respectively). A similar association was not found in females. No significant association was observed between repeat number and muscle strength phenotypes. | Walsh, et al., 2005. [72] |
| TRHR | rs16892496 rs7832552 | Brazilian females Aged between 60–82 years Mean age 66.6 ± 5.5 years | 241 | Body composition (FFM, AFFM and SMI) Muscle strength (KE peak torque) Sarcopenia (SMI < 5.45 kg/m2) | Subjects who carried the CC variant of rs16892496 had significantly less AFFM and SMI than AA/AC carriers (p < 0.05). No significant differences were observed for rs7832552 variants. | Lunardi, et al., 2013. [57] |
| Growth Factor and Cytokine Genes | ||||||
| IGF1 | rs35767 | Health ABC study cohort Blacks (533 males and 705 females) Whites (925 males and 836 females) Aged 70–79 years | 2999 | Body composition (FFM) Muscle volume (quadriceps CSA) Muscle strength (KE and HG strength, elbow flexor MVC and 1RM) Physical function (gait speed and single leg chair stands) | Black females with a CC genotype had significantly less FFM and quadriceps CSA compared to TT counterparts (both p < 0.05). White males with a CC genotype performed significantly worse in the single leg chair stands compared to CT counterparts (p < 0.05). | Kostek, et al., 2010. [51] |
| IGF1 | 192 bp allele | Caucasians (Spanish) 144 males and 148 females Mean age 76.7 ± 5.4 years (males) and 77.3 ± 6.4 years (females) | 292 | Muscle strength (KE isometric strength and HG strength) | No significant associations were observed in either males or females with relation to homozygosity, heterozygosity or non-carrier condition of the 192 bp allele (p = 0.24). | Mora, et al., 2011. [61] |
| IGF1 IGFBP3 IGFBP5 | rs6214 rs35767 rs3110697 rs2854744 rs11977526 rs1978346 rs12474719 | Taiwanese 251 males and 221 females Aged ≥ 65 years Mean age 74.7 ± 6.4 years (males) and 72.8 ± 5.5 years (females) | 472 | Body composition (SMI) | Individuals carrying the CC genotype of rs2854744 had a 4.3-fold risk of having low SMI compared with those with the AA genotype (p < 0.05). No other significant associations were observed for the other polymorphisms. | Yang, et al., 2015. [75] |
| Growth Factor and Cytokine Genes | ||||||
| CNTF | rs948562 rs1800169 rs550942 rs4319530 rs1944055 rs2510559 rs2275993 rs1938596 | Caucasian females (North American) Aged 70–79 years | 363 | Muscle strength (KE, HE and HG strength) | 5 polymorphisms (rs948562, rs1800169, rs550942, rs4319530, rs1938596) were associated with HG (p <0.05). Haplotype analysis revealed rs1800169 null allele to fully explain relationship with the haplotype and HG under a recessive model, with homozygotes for the null allele exhibiting 3.80kg lower HG (p<0.01). | Arking, et al., 2006. [25] |
| CNTF CNTFR | rs1800169 rs3808871 rs2070802 C-174T | Caucasians 99 males and 102 females Aged 60–78 years (males) and 60–80 years (females) | 201 | Body composition (FFM) Muscle strength (isometric and concentric KE and KF at 60°, 120°, 150°, 180°, 240°) | Females who were G/A heterozygotes for the rs1800169 polymorphism produced significantly lower KE at 150° than both G/G and A/A homozygotes (p = 0.0229). Males who carried the T allele of the rs3808871 polymorphism produced significantly higher KE and KF isometric torque at 120° when compared to CC homozygotes (p < 0.05). Females who carried the T allele of the rs2070802 polymorphism performed better on KF concentric torques at 60°, 180° and 240° than the A/A homozygotes (p = 0.03, 0.04, 0.04 respectively). No significant associations were observed between polymorphisms and FFM. | De Mars, et al. 2007. [36] |
| Growth Factor and Cytokine Genes | ||||||
| CRP IL6 TNFα ICAM1 | rs1800947 rs2069829 rs361525 rs5498 | Danish twins 200 males and 400 females Aged 73–95 years | 600 | Physical function (self-reported during a 2-hour interview using a 11-item checklist) | Males who carried ≥1 A allele of the TNFα rs361525 polymorphism had a significantly better physical performance level compared to GG homozygotes (p < 0.001). No other associations were observed between polymorphisms and physical performance. | Tiainen, et al., 2012. [69] |
| CRP TNFα LTA | rs2794520 rs1205 rs1130864 rs1800947 rs3093059 rs1799964 rs1800629 rs3093662 rs2239704 rs909253 rs1041981 | Taiwanese 251 males and 221 females Aged ≥ 65 years Mean age 74.7 ± 6.4 years (males) and 72.8 ± 5.5 years (females) | 472 | Muscle strength (HG strength) | In females, the main effect of polymorphisms (rs1800947, rs3093059, rs1799964, rs1800629, rs909253, rs1041981) reflected lower HG. In the male population, polymorphisms (rs1130864, rs2239704) produced the same effect. | Li, et al., 2016. [53] |
| CRP | rs2794520 rs1205 rs1130864 rs1800947 rs3093059 | Taiwanese 251 males and 221 females Aged ≥ 65 years Mean age 74.7 ± 6.4 years (males) and 72.8 ± 5.5 years (females) | 472 | Muscle strength (HG strength) | HG of subjects carrying the CC variant of polymorphisms rs2794520 and rs1205 was lower by 1.24 kg and 1.28 kg, respectively, compared with TT homozygotes. HG was 1.01 kg lower for every additional C allele of rs3093059 polymorphism. Haplotype C-C-C-C-C was significantly associated with lower HG than any other haplotypic formation (p = 0.015). | Lin, et al., 2014. [55] |
| Growth Factor and Cytokine Genes | ||||||
| CAV1 | rs1997623 rs3807987 rs12672038 rs3757733 rs7804372 rs3807992 | Taiwanese 265 males and 237 females Aged ≥ 65 years 327 controls, 56 pre-sarcopenic, 63 sarcopenic, 56 severely sarcopenic | 502 | Body composition (FFM, AFFM, SMI) Muscle strength (HG strength) Muscle function (15 ft walk test) Sarcopenia (SMI < 6.87 kg/m2 and 5.46 kg/m2 for males and females, respectively and lowest quintile for muscle strength and function tests) | Subjects carrying ≥ 1 A allele of rs3807987 were at a significantly higher risk of sarcopenia than GG homozygotes (p = 0.0235). No other significant associations were observed between the remaining polymorphisms. | Lin, et al., 2014. [56] |
| MSTN | rs1805065 rs35781413 rs1805086 rs368949692 rs143242500 | Caucasian nonagenarians 8 males and 33 females Aged 90–97 years | 41 | Muscle strength (1RM leg press) Physical function (Tinetti scale measured gait and balance, Barthel index) Body Composition (FFM estimated) | Carriers of the rs1805086 KR genotype were associated with lower FFM compared to KK carriers. The RR homozygote was below the 25th sex specific percentile for FFM and functional capacity. | Gonzalez-Freire, et al., 2010. [41] |
| ACVR2B | rs2276541 | Hispanic (354) and Non-Hispanic (2406) females Mean age 64.1 ± 7.4 years | 2760 | Body composition (FFM, AFFM) | Subjects carrying the A allele of rs2276541 had significantly more FFM than G allele carriers (p = 0.006). | Klimentidis, et al., 2016. [49] |
| Structural and Metabolic Genes | ||||||
| ACTN3 ACE | rs1815739 (R577X) rs1799752 (I/D) | Caucasians (Spanish) 8 males and 33 females Aged 90–97 years Mean age 92 ± 2 years | 41 | Muscle strength (HG strength and 6–7 RM leg press) Physical function (8 m walk test and 4 step stairs test) | Study phenotypes did not differ significantly between ACE or ACTN3 genotypes (all p > 0.05). | Bustamante, et al., 2010. [30] |
| Structural and Metabolic Genes | ||||||
| ACTN3 | rs1815739 (R577X) | Japanese 183 males and 238 females Aged ≥ 55 years | 421 | Muscle strength (HG strength) Physical function (chair stand test, 8 ft walking test) | XX homozygotes performed significantly worse in the chair stand test than RR/RX carriers (p = 0.024, 0.005 respectively). No significant association was found between ACTN3 genotype and 8 ft walk test or HG. | Kikuchi, et al., 2014. [48] |
| ACTN3 | rs1815739 | Koreans 62 males and 270 females Aged ≥ 65 years Mean age 74.4 ± 4.6 years (males) and 74.4 ± 6.6 years (females) | 332 | Body composition (FFM, AFFM, SMI) Sarcopenia (SMI < 7.0 kg/m2 and < 5.4 kg/m2 for men and women respectively) | Sarcopenia prevalence was significantly associated with RX/XX genotypes (p = 0.037, 0.038 respectively). This association remained significant under both a dominant and recessive model (p = 0.043, 0.029 respectively). | Cho, et al., 2017. [32] |
| ACE | rs1799752 (I/D) | Brazilians 38 males and 53 females Aged 60–95 years Mean age 70.6 ± 7.2 years | 91 | Body composition (FFM, AFFM, SMI) Muscle strength (HG strength) Physical function (TUG test) Sarcopenia (based off FFM, muscle strength and physical function) | Sarcopenia prevalence was significantly higher in II genotype carriers compared to individuals with ≥ 1 D allele (p = 0.015). | Da Silva, et al., 2018. [34] |
| ACTN3 ACE | rs1815739 rs1799752 | Caucasians (Spanish) 22 males and 59 females Aged 71–93 years Mean age 82.8 ± 4.8 years | 81 | Muscle strength (HG strength) Physical function (30s chair stand test, Barthel index) Muscle volume (thigh muscle CSA and muscle quality) | No significant associations were noted between any ACE rs1799752 or ACTN3 rs1815739 genotypes and the tested phenotypes in either males or females (p > 0.05). | Garatachea, et al., 2012. [39] |
| Structural and Metabolic Genes | ||||||
| ACTN3 | rs1815739 (R577X) | Chinese 686 males and 777 females Aged 70–87 years 2 age groups (70–79 years and 80–87 years) | 1463 | Muscle strength (HG strength) Physical function (TUG, 5m walk test) Frailty measure (frailty index containing 23 variables) | In the 70–79 age group, male XX homozygotes performed significantly worse than RR carriers in HG, 5 m walk test and TUG (p = 0.012, 0.011 and 0.039 respectively). Females in this age group who carried the XX genotype had a significantly higher frailty index than RR carriers (p = 0.004). | Ma, et al., 2018. [58] |
| ACTN3 ACE | rs1815739 rs1799752 (I/D) | Caucasian males (British) Aged 60–70 years Mean age 65 ± 3 years | 100 | Body composition (FFM and thigh FFM) Muscle strength (isometric and isokinetic KE strength) Contractile properties (time to peak tension, half-relaxation time, peak rate of force development) | There were no significant associations between either ACE or ACTN3 genotypes and the studied phenotypes. | McCauley, et al., 2010. [59] |
| ACE | rs1799752 | Japanese 228 males and 203 females Aged 76 years | 431 | Muscle strength (HG strength, isokinetic KE) Physical function (10 s maximal stepping rate, single leg standing time with eyes open, maximum walking speed over 10 m) | Individuals homozygous for the I allele had significantly lower HG than carriers of the D allele (p = 0.004). Although not significant, the ACE rs1799752 polymorphism was also positively associated with 10 m maximum walking speed. | Yoshihara, et al., 2009. [76] |
| ACTN3 | rs1815739 | Japanese females Aged 50–78 years Mean age 64.1 ± 6 years | 109 | Body composition (mid-thigh CSA) Physical function (physical activity was measured using an uniaxial accelerometer) | Thigh muscle CSA was significantly lower in XX homozygotes compared to RX/RR carriers (p = 0.04). Physical activity did not significantly differ between genotypes. | Zempo, et al., 2010. [77] |
| Structural and Metabolic Genes | ||||||
| ACTN3 | rs1815739 (R577X) | Japanese females Middle aged group (n = 82) mean age 50.6 ± 0.9 years Older group (n = 80) mean age 66.8 ± 0.5 years | 162 | Body composition (mid-thigh CSA) Physical activity (physical activity was measured using an uniaxial accelerometer) | In the middle-aged group, no association was observed between ACTN3 genotypes and thigh muscle CSA or physical activity. In the older group, XX homozygotes had significantly lower thigh muscle CSA than RX/RR carriers (p < 0.05). | Zempo, et al., 2010. [78] |
| UCP3 | rs1800849 rs15763 | Caucasians (Italians) 221 males and 211 females Aged 65–105 years Mean age 73.37 ± 7.46 years (males) and 73.37 ± 7.69 years (females) | 432 | Muscle strength (HG strength) | Carriers of the CC genotype of rs1800849 exhibited significantly lower HG than CT/TT genotypes (p = 0.010). No significant association was observed between rs15763 genotypes and HG. | Crocco, et al., 2011. [33] |
| UCP3 | rs11235972 rs1685354 rs3781907 rs647126 | Caucasians (Danish 1905 cohort) 265 males and 643 females Aged 93 years | 908 | Muscle strength (HG strength) | Individuals carrying the AA genotype of rs11235972 showed significantly lower HG than GG homozygotes (p < 0.001). Subjects carrying a GA genotype of rs1685354 displayed significantly greater HG than AA homozygotes (p = 0.016). | Dato, et al., 2012. [35] |
| PRDM16 | rs12409277 | Japanese females Mean age 65.1 ± 9.4 years | 1081 | Body composition (total FFM%) | Individuals who carried CT/CC variants of rs12409277 had a significantly greater FFM% compared to TT homozygotes (p = 0.003). | Urano, et al., 2014. [70] |
| Gene | Polymorphism | Study Design | Population Data | N | Muscle Phenotype | Results | Reference |
|---|---|---|---|---|---|---|---|
| Hormone Genes | |||||||
| RAMP3 | rs3757575 rs2074654 rs1294935 rs11982639 rs12702121 | 5- and 10-year follow-up | Swedish females (OPRA cohort) Aged 75 years Mean age 75.2 ± 0.1 years | 1044 | Body composition (total, legs and trunk FFM) | At baseline, C allele carriers of rs2074654 had significantly greater amounts of total and leg FFM (p = 0.041, 0.038 respectively) when compared to TT homozygotes. There were no significant associations at follow up. | Prakash, et al., 2019. [66] |
| Growth Factor and Cytokine Genes | |||||||
| IGF1 | 192 bp allele | 10-week intervention of single leg KE RT | Caucasians 32 males and 35 females Mean age 70 ± 6 years (males) and 67 ± 8 years (females) | 67 | Muscle strength (KE 1RM) Muscle volume (using CT) Muscle quality (1RM/muscle volume) | Carriers of the 192 allele achieved significantly greater KE 1RM improvements than non-carriers (p = 0.02). Although not significant, a trend towards greater muscle volume was noted between 192 carriers and non-carriers (p = 0.08). | Kostek, et al., 2005. [50] |
| IGF1 | 192 bp allele | 10-week intervention of single leg KE RT | Blacks (12 males and 21 females) Whites (46 males and 49 females) Aged 50–85 years | 128 | Muscle strength (KE 1RM) Muscle volume (using CT) Muscle quality (1RM/muscle volume) | Significantly greater KE 1RM improvements were observed in individuals with ≥ 1 192 allele compared to non-carriers (p < 0.01). No significant differences in muscle volume or quality were noted. | Hand, et al., 2007. [43] |
| Growth Factor and Cytokine Genes | |||||||
| TNFα IL6 IL10 | rs1800629 rs1800795 rs1800896 | 10-week intervention of either RT or AE | Brazilian females Aged ≥ 65 years 229 RT group and 222 AE group | 451 | Physical function (TUG and 10 m walking speed test) | Individuals homozygous for the G allele of polymorphism rs1800629 of TNFα achieved significantly greater TUG improvements with exercise compared to AA/AG genotypes (p < 0.001). A significant interaction was displayed between the 3 polymorphisms and TUG performance post exercise (p < 0.001). No significant interaction was observed between polymorphisms and 10 m walking speed test. | Pereira, et al., 2013. [65] |
| Structural and Metabolic Genes | |||||||
| ACE | rs1799752 (I/D) | 10-week intervention of unilateral KE RT | North Americans Whites (65%) and Blacks (35%) 86 males and 139 females Aged 50–85 years (mean age 62 years) | 225 | Body composition (FFM) Muscle volume (quadriceps) Muscle strength (KE 1RM) | At baseline, carriers of the DD genotype had significantly greater FFM than II homozygotes (p < 0.05). DD homozygotes also had greater baseline muscle volume in both the trained and untrained leg than II carriers (p = 0.02, 0.01 respectively). No significant associations were observed between genotypes and either 1RM or muscle volume adaptations to RT in either males or females. | Charbonneau, et al., 2008. [31] |
| ACE | rs1799752 | 12-month intervention of either PA or health education | Caucasians 97 males and 186 females Aged 70–89 years Mean age 77.2 ± 4.3 years | 283 | Physical function (400 m gait speed test and SPPB) | A significant difference was observed in gait speed and SPPB post PA in carriers of ≥ 1 D allele (p = 0.018, 0.015 respectively), but not in II homozygotes (p = 0.930, 0.275 respectively). | Buford, et al., 2014. [29] |
| Structural and Metabolic Genes | |||||||
| ACTN3 | rs1815739 (R577X) | 10-week intervention of unilateral KE RT | Caucasians 71 males and 86 females Aged 50–85 years Mean age 65 ± 8 years (males) and 64 ± 9 years (females) | 157 | Body composition (FFM) Muscle volume (quadriceps) Muscle strength (KE 1RM, peak power and velocity) | At baseline, female XX homozygotes had significantly higher absolute and relative KE peak power and peak velocity than carriers of ≥ 1 R allele (p < 0.05). In males, change in absolute KE peak power post RT approached significance in RR homozygotes compared to XX carriers (p = 0.07). In females, change in relative KE peak power post RT was significantly higher in RR homozygotes compared to XX carriers (p = 0.02). | Delmonico, et al., 2007. [37] |
| ACTN3 | rs1815739 | 5-year follow-up | White North Americans 726 males and 641 females (Health ABC cohort) Aged 70–79 years Loss to follow-up (372) | 1367 | Muscle volume (thigh muscle CSA) Muscle strength (KE isokinetic torque) Physical function (400 m walk test, SPPB, self-reported functional limitation) | At follow-up, male XX homozygotes had a significantly greater increase in 400 m walk time when compared to RX/RR carriers (p = 0.03). Female XX carriers had a 35% greater risk of functional limitation compared to RR homozygotes. No significant associations were noted between genotype and phenotypes at baseline in either males or females (p > 0.05). | Delmonico, et al., 2008. [38] |
| Structural and Metabolic Genes | |||||||
| ACE | rs1799752 (I/D) | 18-month intervention of exercise training (AE and RT) | Caucasians (75%), African-American (22%), Native American, Asian/Pacific Islander, Hispanic (3%)63 males and 150 femalesAged ≥ 65 yearsLoss to follow-up (37) | 213 | Muscle strength (concentric KE isokinetic strength) Physical function (6 min walk test, self-reported FAST) | Carriers of the DD genotype showed significantly greater improvements in concentric KE strength in response to exercise training than II homozygotes (p < 0.05). At baseline, no significant associations were noted between genotypes and measures of muscle strength and physical performance. | Giaccaglia, et al., 2008. [40] |
| ACTN3 | rs1815739 (R577X) | Follow-up (NOSOS 1 year follow up, APOSS 2 year follow up) | Caucasian females (Scottish) NOSOS cohort (n = 1245) APOSS cohort (n = 2918) Mean age (NOSOS 69.6 ± 5.5 years and APOSS 54.8 ± 2.2 years) | 4163 | Fall incidences (self-reported for previous year) | In both NOSO and APOSS cohorts, baseline falls were significantly associated with carrying RX/XX genotypes (p = 0.049, 0.02 respectively). In a pooled analysis, follow-up fall incidences in the previous year were associated with X allele carriers (p = 0.01). | Judson, et al., 2011. [46] |
| Structural and Metabolic Genes | |||||||
| ACE | rs1799752 (I/D) | Follow-up (4.1 year average) | Whites and Blacks 1439 males and 1527 females Aged 70–79 years | 2966 | Muscle volume (thigh muscle CSA) Muscle strength (maximal and mean isokinetic KE strength) Physical function (physical activity questionnaire, self-reported mobility limitations) | Among individuals with high levels of physical activity II homozygotes developed limitation at a 45% faster rate when compared to ID/DD carriers (p = 0.01). ACE genotype did not affect mobility limitation in inactive individuals, nor did it affect any other phenotype in either active or inactive individuals. | Kritchevsky, et al., 2005. [52] |
| ACTN3 ACE | rs1815739 (R577X) rs1799752 | 24-week intervention of RT | Brazilian females Mean age 66.7 ± 5.5 years | 246 | Body composition (FFM, relative total FFM, AFFM and SMI) Muscle strength (KE isokinetic peak torque at 60°s) | At baseline, ACE DD homozygotes had significantly greater SMI than I/ID carriers (p = 0.044). ACTN3 X allele carriers had significantly more relative total FFM at baseline than RR homozygotes (p = 0.04). In response to RT, only ACE II homozygotes significantly increased AFFM (p < 0.001). | Lima, et al., 2011. [54] |
| Structural and Metabolic Genes | |||||||
| ACTN3 ACE | rs1815739 (R577X) rs1799752 (I/D) | 12-week intervention of high-speed power training | Caucasian females Mean age 65.5 ± 8.2 years | 139 | Muscle strength (1RM bench press and leg extension and vertical jump) Physical function (sit-to-stand test) | Post intervention, ACE DD homozygotes showed significantly greater improvements in 1RM bench press and sit-to-stand tests (p = 0.019, 0.013 respectively) than II carriers. The same interaction approached significance for vertical jump (p = 0.052). ACTN3 RR homozygotes displayed significantly greater improvements across all measures than XX carriers (p < 0.05). At baseline, there were no significant differences between ACE or ACTN3 genotype for any phenotype. | Pereira, et al., 2013. [63] |
| ACTN3 ACE | rs1815739 rs1799752 | 12-week intervention of high-speed power training | Caucasian females Mean age 65.5 ± 8.2 years | 139 | Muscle function (10 m maximal effort sprints, TUG test) | ACE DD homozygotes displayed significantly greater improvements in 10 m sprint time (p = 0.012) than II carriers, but not in GUG performance (p = 0.331). Similarly, ACTN3 RR homozygotes improved significantly more than XX carriers in 10m sprint time (p = 0.044) but not in TUG performance (p = 0.477). At baseline, there were no significant differences between ACE or ACTN3 genotype for any phenotype. | Pereira, et al., 2013 [64] |
| Structural and Metabolic Genes | |||||||
| ACEUCP2 | rs1799752 (I/D) rs659366 | 12-week intervention of RT, balance and cardiovascular exercises | Caucasians 18 males and 40 females Aged > 60 years Mean age 70.0 ± 5.9 years (males) and 69.7 ± 5.3 years (females) | 58 | Muscle strength (HG strength) Physical function (30 s sit to stand, 30 s bicep curls, 8 ft TUG, 6 min walk, Purdue pegboard test) | At baseline, ACE II homozygotes performed significantly worse than ID/DD carriers in the 6 min walk and 8 ft TUG tests (p = 0.008, p < 0.001 respectively). GG carriers of rs659366 performed significantly worse in the 8 ft TUG test compared with AA/GA genotypes (p = 0.045). Post intervention, GG carriers of rs659366 had the greatest improvements in 8 ft TUG performance compared to AA/GA carriers (p = 0.023), while a trend for greater improvements in bicep strength was noted for ID/DD carriers compared to II carriers (p = 0.099). | Keogh, et al., 2015. [47] |
| APOE | rs7412 rs429358 (e4 status) | 6-year follow-up | Caucasians (Dutch) 553 males and 709 females Aged > 65 years Mean age 74.9 ± 5.8 years Loss to follow-up (449) | 1262 | Physical function (5 chair stand test, 3 m gait speed, self-reported mobility) | At baseline, e4 carriers displayed significantly worse gait speed and chair stand performance (p = 0.006, 0.015 respectively) than the e3 group. At follow-up, e4 status was associated with significantly worse chair stand performance (p = 0.034) compared to e3 carriers. | Melzer, et al., 2005. [60] |
| Structural and Metabolic Genes | |||||||
| APOE | rs7412 rs429358 (e4 status) | 4-year follow-up | Swedish 245 males and 364 females Aged 75 years Loss to follow-up (28) | 609 | Muscle strength (HG strength) Physical function (20 m maximum gait speed, 5 chair stand test, 30 s single leg stand) | Subjects who carried the APOE e4 allele had a significantly larger decline in HG between age 75 and 79 compared to non-carriers (p = 0.015). Carriers of the APOE e4 allele had significantly lower HG at age 79 compared to non-carriers (p = 0.006). The effect of e4 allele on HG was significantly larger at age 79 than age 75 (p = 0.033). | Skoog, et al., 2016. [68] |
| APOE | rs7412 rs429358 (e4 status) | Follow-up (3-year average) | North Americans (67.8% White and Blacks 27.1%) 235 males and 392 females Mean age 79.4 ± 5.2 years | 627 | Physical function (15 ft and 20 ft gait speed, disability scale examining ability to perform ADL’s) | Males carrying the ε4 allele showed a significantly more rapid decline in gait speed than male non-carriers (p = 0.04). This was most significant in white males only (p = 0.007). Similarly, males who carried the e4 allele had a significantly greater risk of disability than non-carriers (p = 0.007). | Verghese, et al., 2013. [71] |
| Structural and Metabolic Genes | |||||||
| ZNF295 C2CD2 | rs928874 rs1788355 | GWAS 2-year follow-up | Italians ilSIRENTE cohort (n = 286) 116 males and 170 females Mean age 86.1 ± 4.9 years Replication cohort inCHIANTI (n = 1055) 440 males and 615 females Mean age 67.8 ± 15.7 years | 1341 | Body composition (calf circumference, mid-arm muscle circumference) Muscle strength (HG strength) Physical function (4 m walk test, SPPB, ADL) | In the ilSIRENTE cohort, rs928874 and rs1788355 were significantly associated with 4 m gait speed (p = 5.61 × 10⁻⁸, 5.73 × 10⁻⁸ respectively). This association was not replicated in the inCHIANTI cohort. | Heckerman, et al., 2017. [44] |
© 2019 by the authors. Licensee MDPI, Basel, Switzerland. This article is an open access article distributed under the terms and conditions of the Creative Commons Attribution (CC BY) license (http://creativecommons.org/licenses/by/4.0/).
Share and Cite
Pratt, J.; Boreham, C.; Ennis, S.; Ryan, A.W.; De Vito, G. Genetic Associations with Aging Muscle: A Systematic Review. Cells 2020, 9, 12. https://doi.org/10.3390/cells9010012
Pratt J, Boreham C, Ennis S, Ryan AW, De Vito G. Genetic Associations with Aging Muscle: A Systematic Review. Cells. 2020; 9(1):12. https://doi.org/10.3390/cells9010012
Chicago/Turabian StylePratt, Jedd, Colin Boreham, Sean Ennis, Anthony W. Ryan, and Giuseppe De Vito. 2020. "Genetic Associations with Aging Muscle: A Systematic Review" Cells 9, no. 1: 12. https://doi.org/10.3390/cells9010012
APA StylePratt, J., Boreham, C., Ennis, S., Ryan, A. W., & De Vito, G. (2020). Genetic Associations with Aging Muscle: A Systematic Review. Cells, 9(1), 12. https://doi.org/10.3390/cells9010012