Systematic Assessment of Blood-Borne MicroRNAs Highlights Molecular Profiles of Endurance Sport and Carbohydrate Uptake

 , , , , , , , and
Abstract
1. Introduction
2. Results
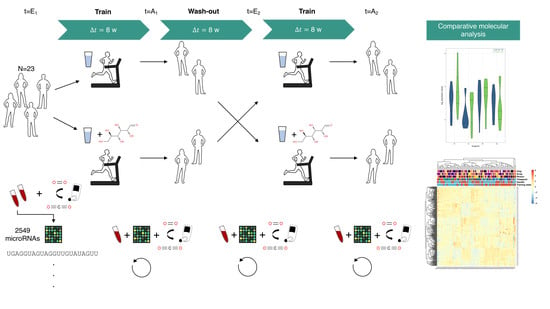
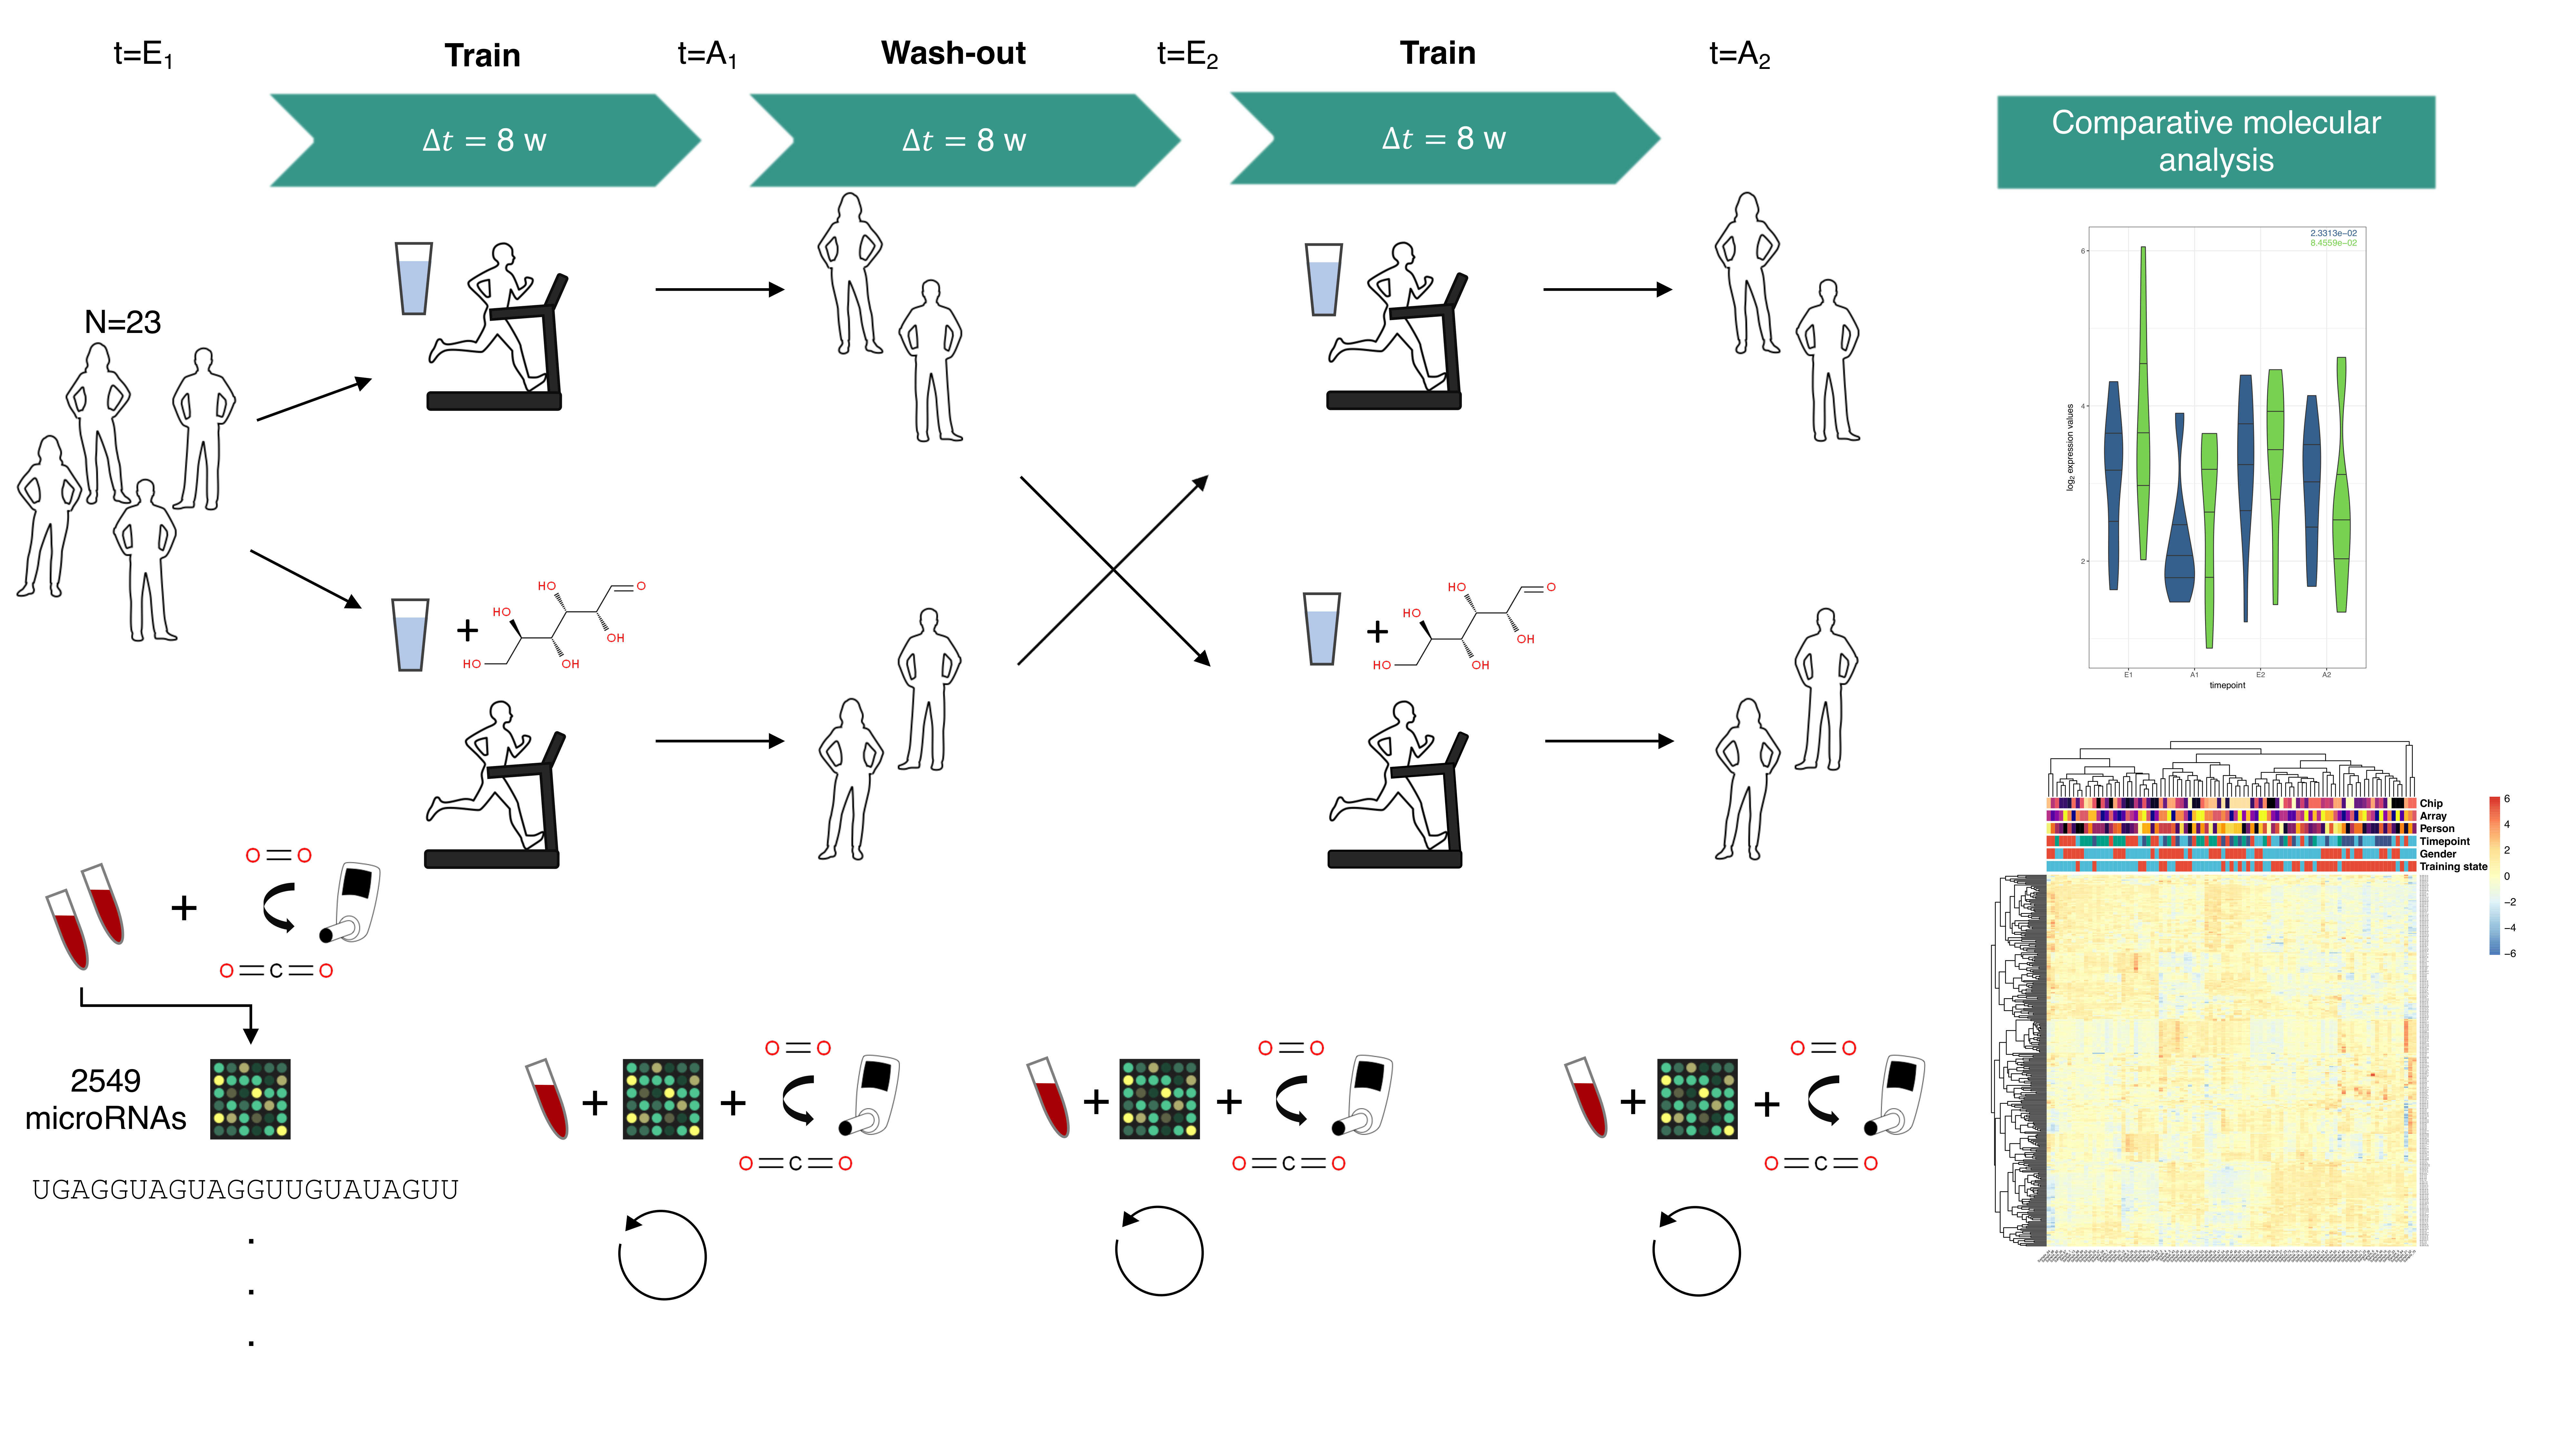
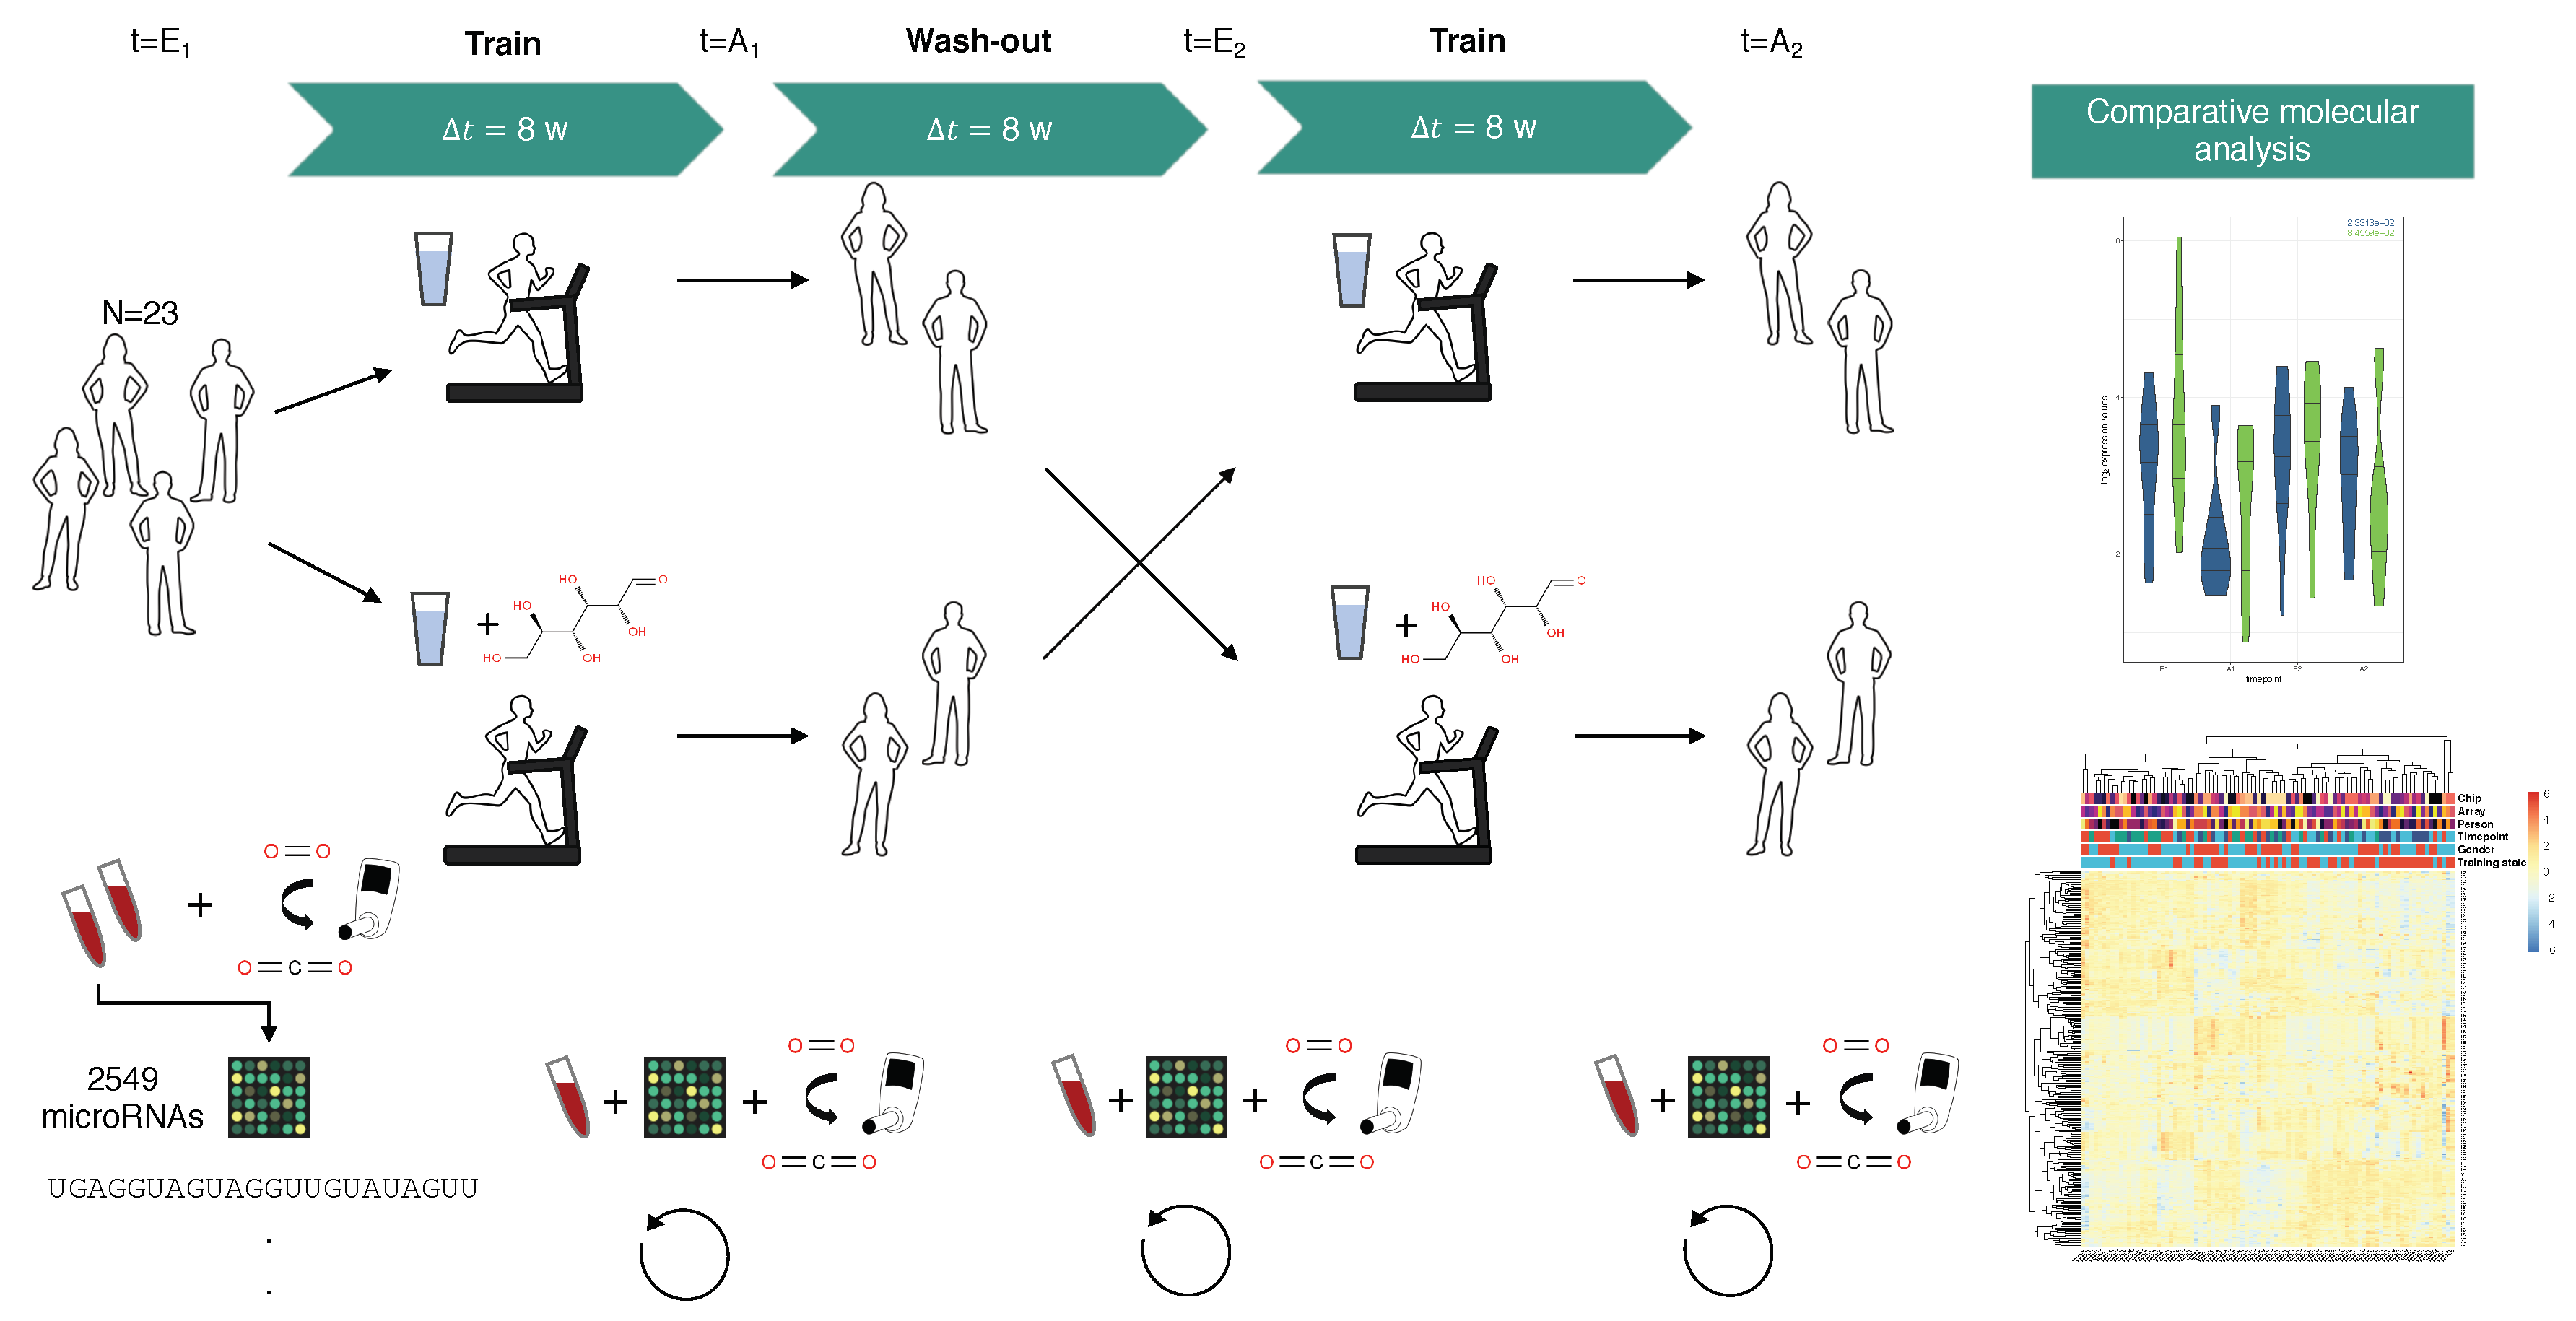
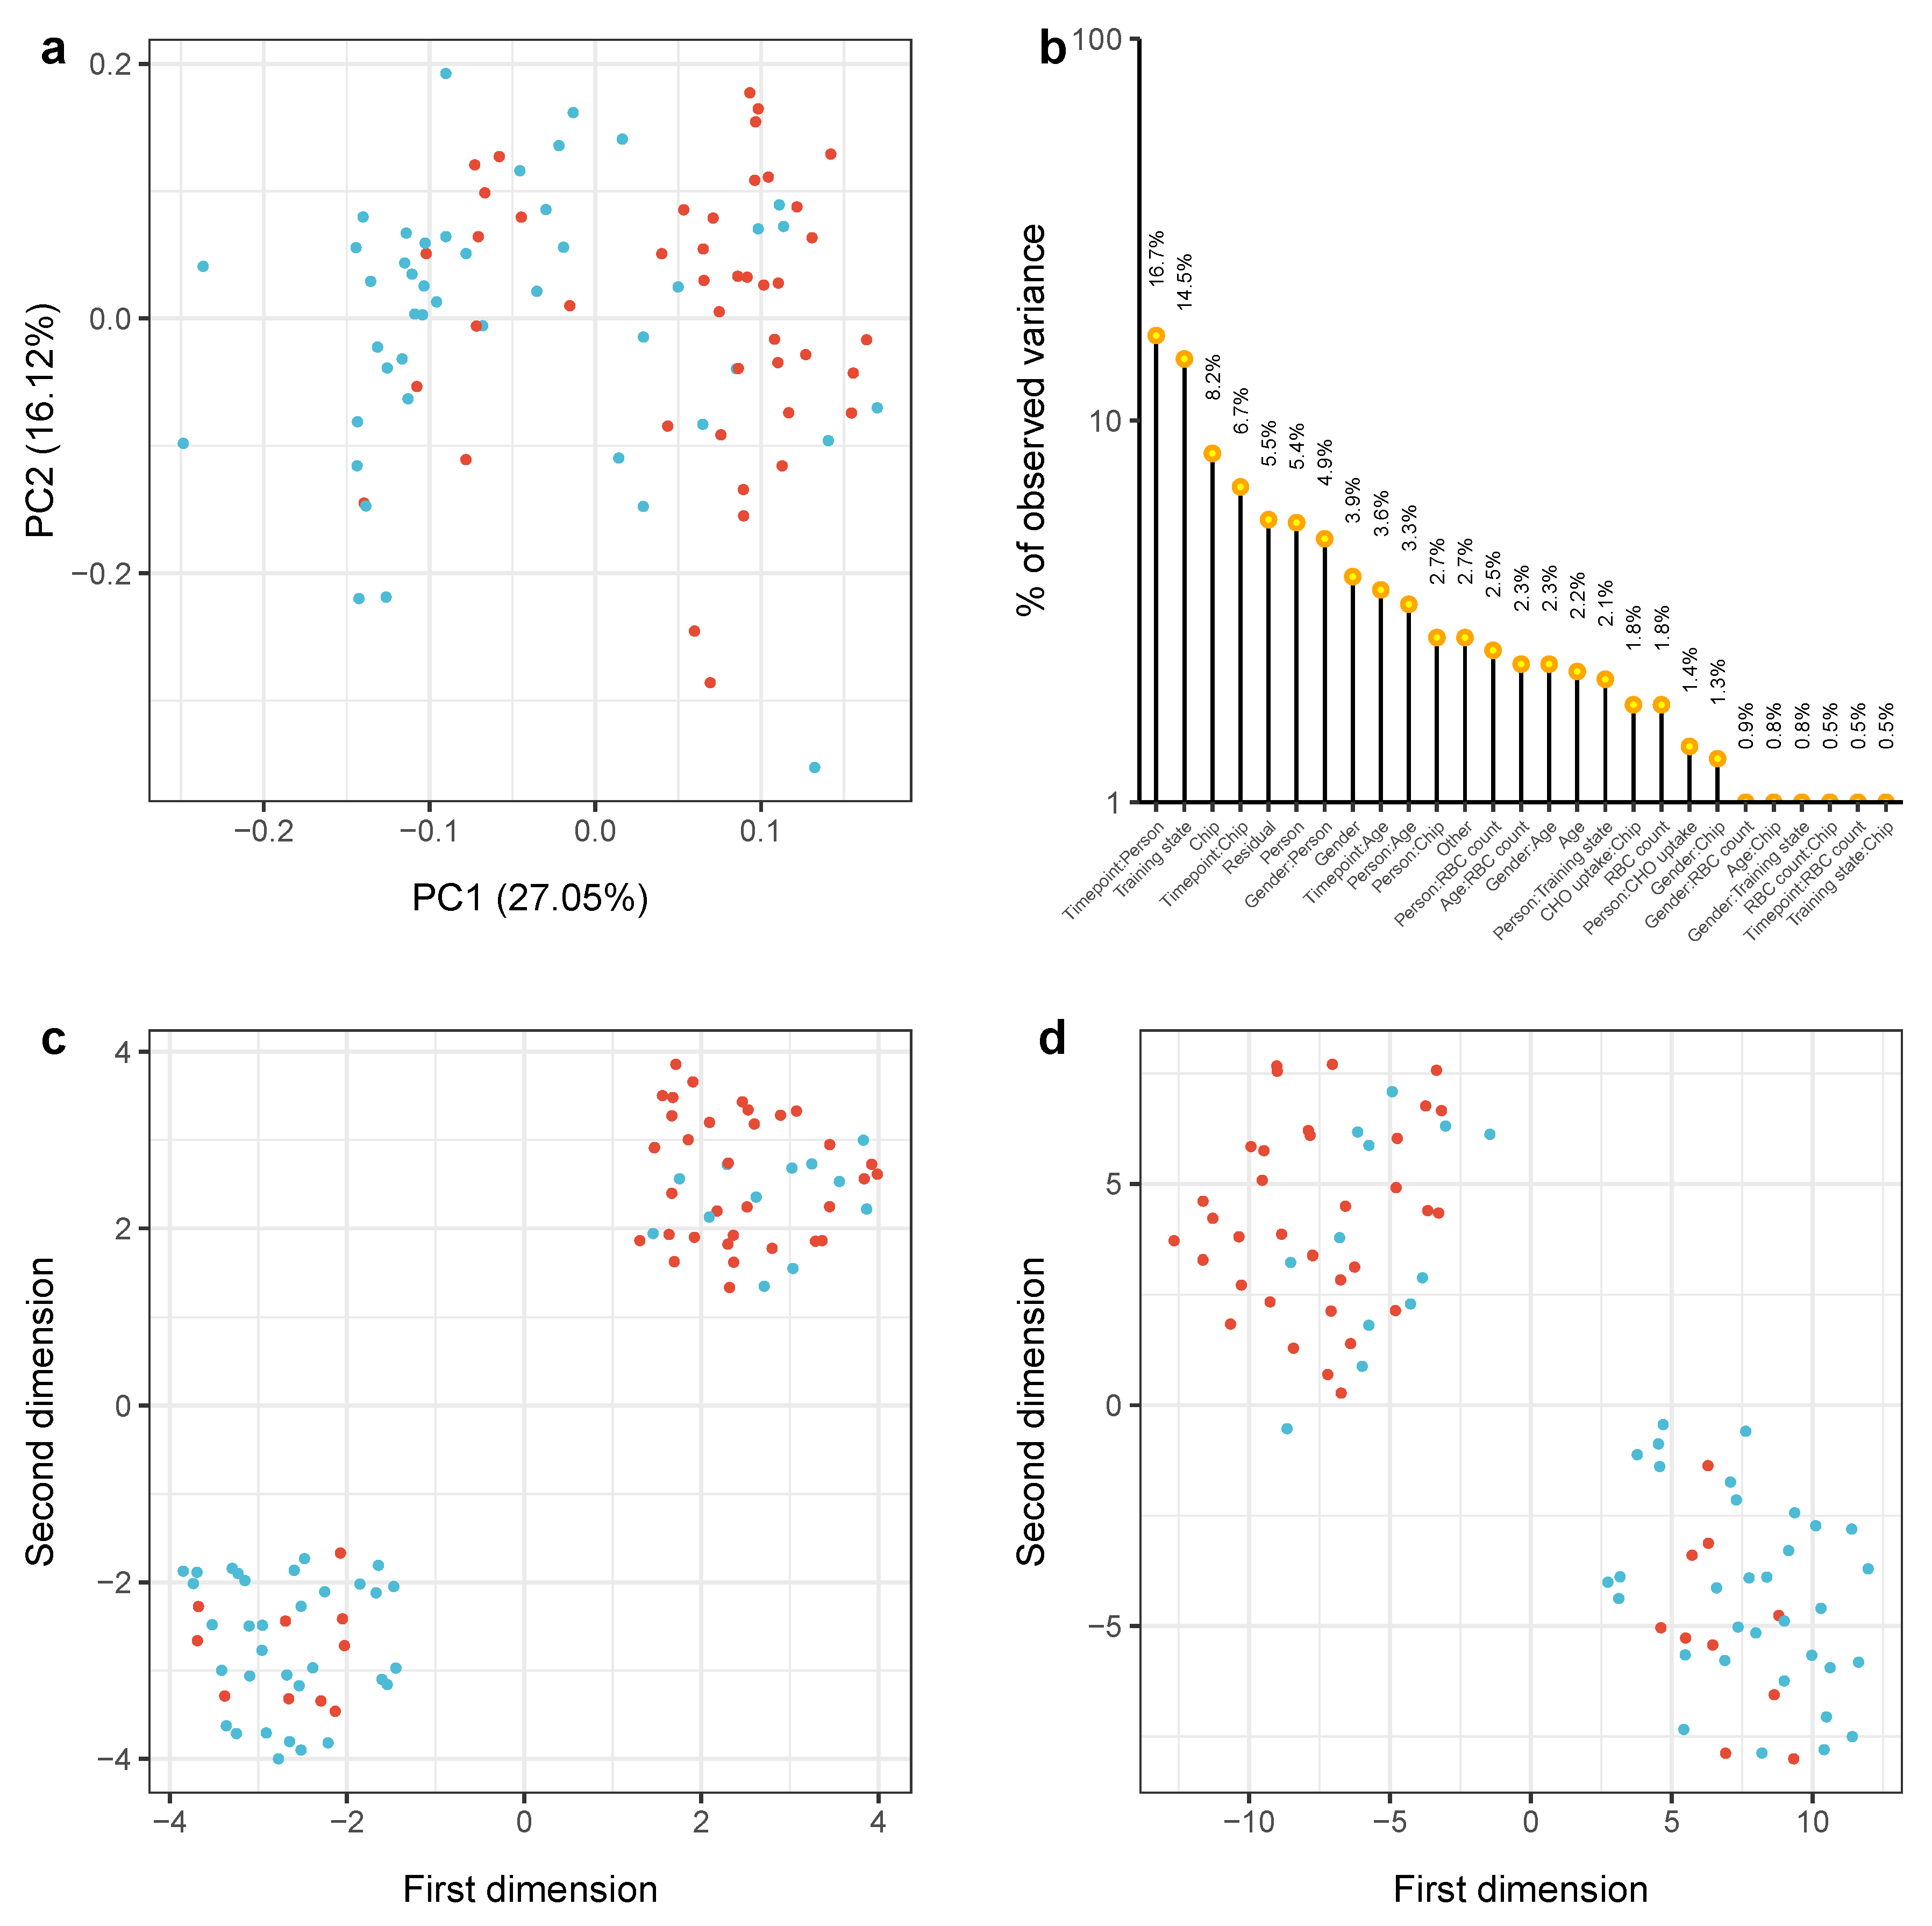
2.1. Outline
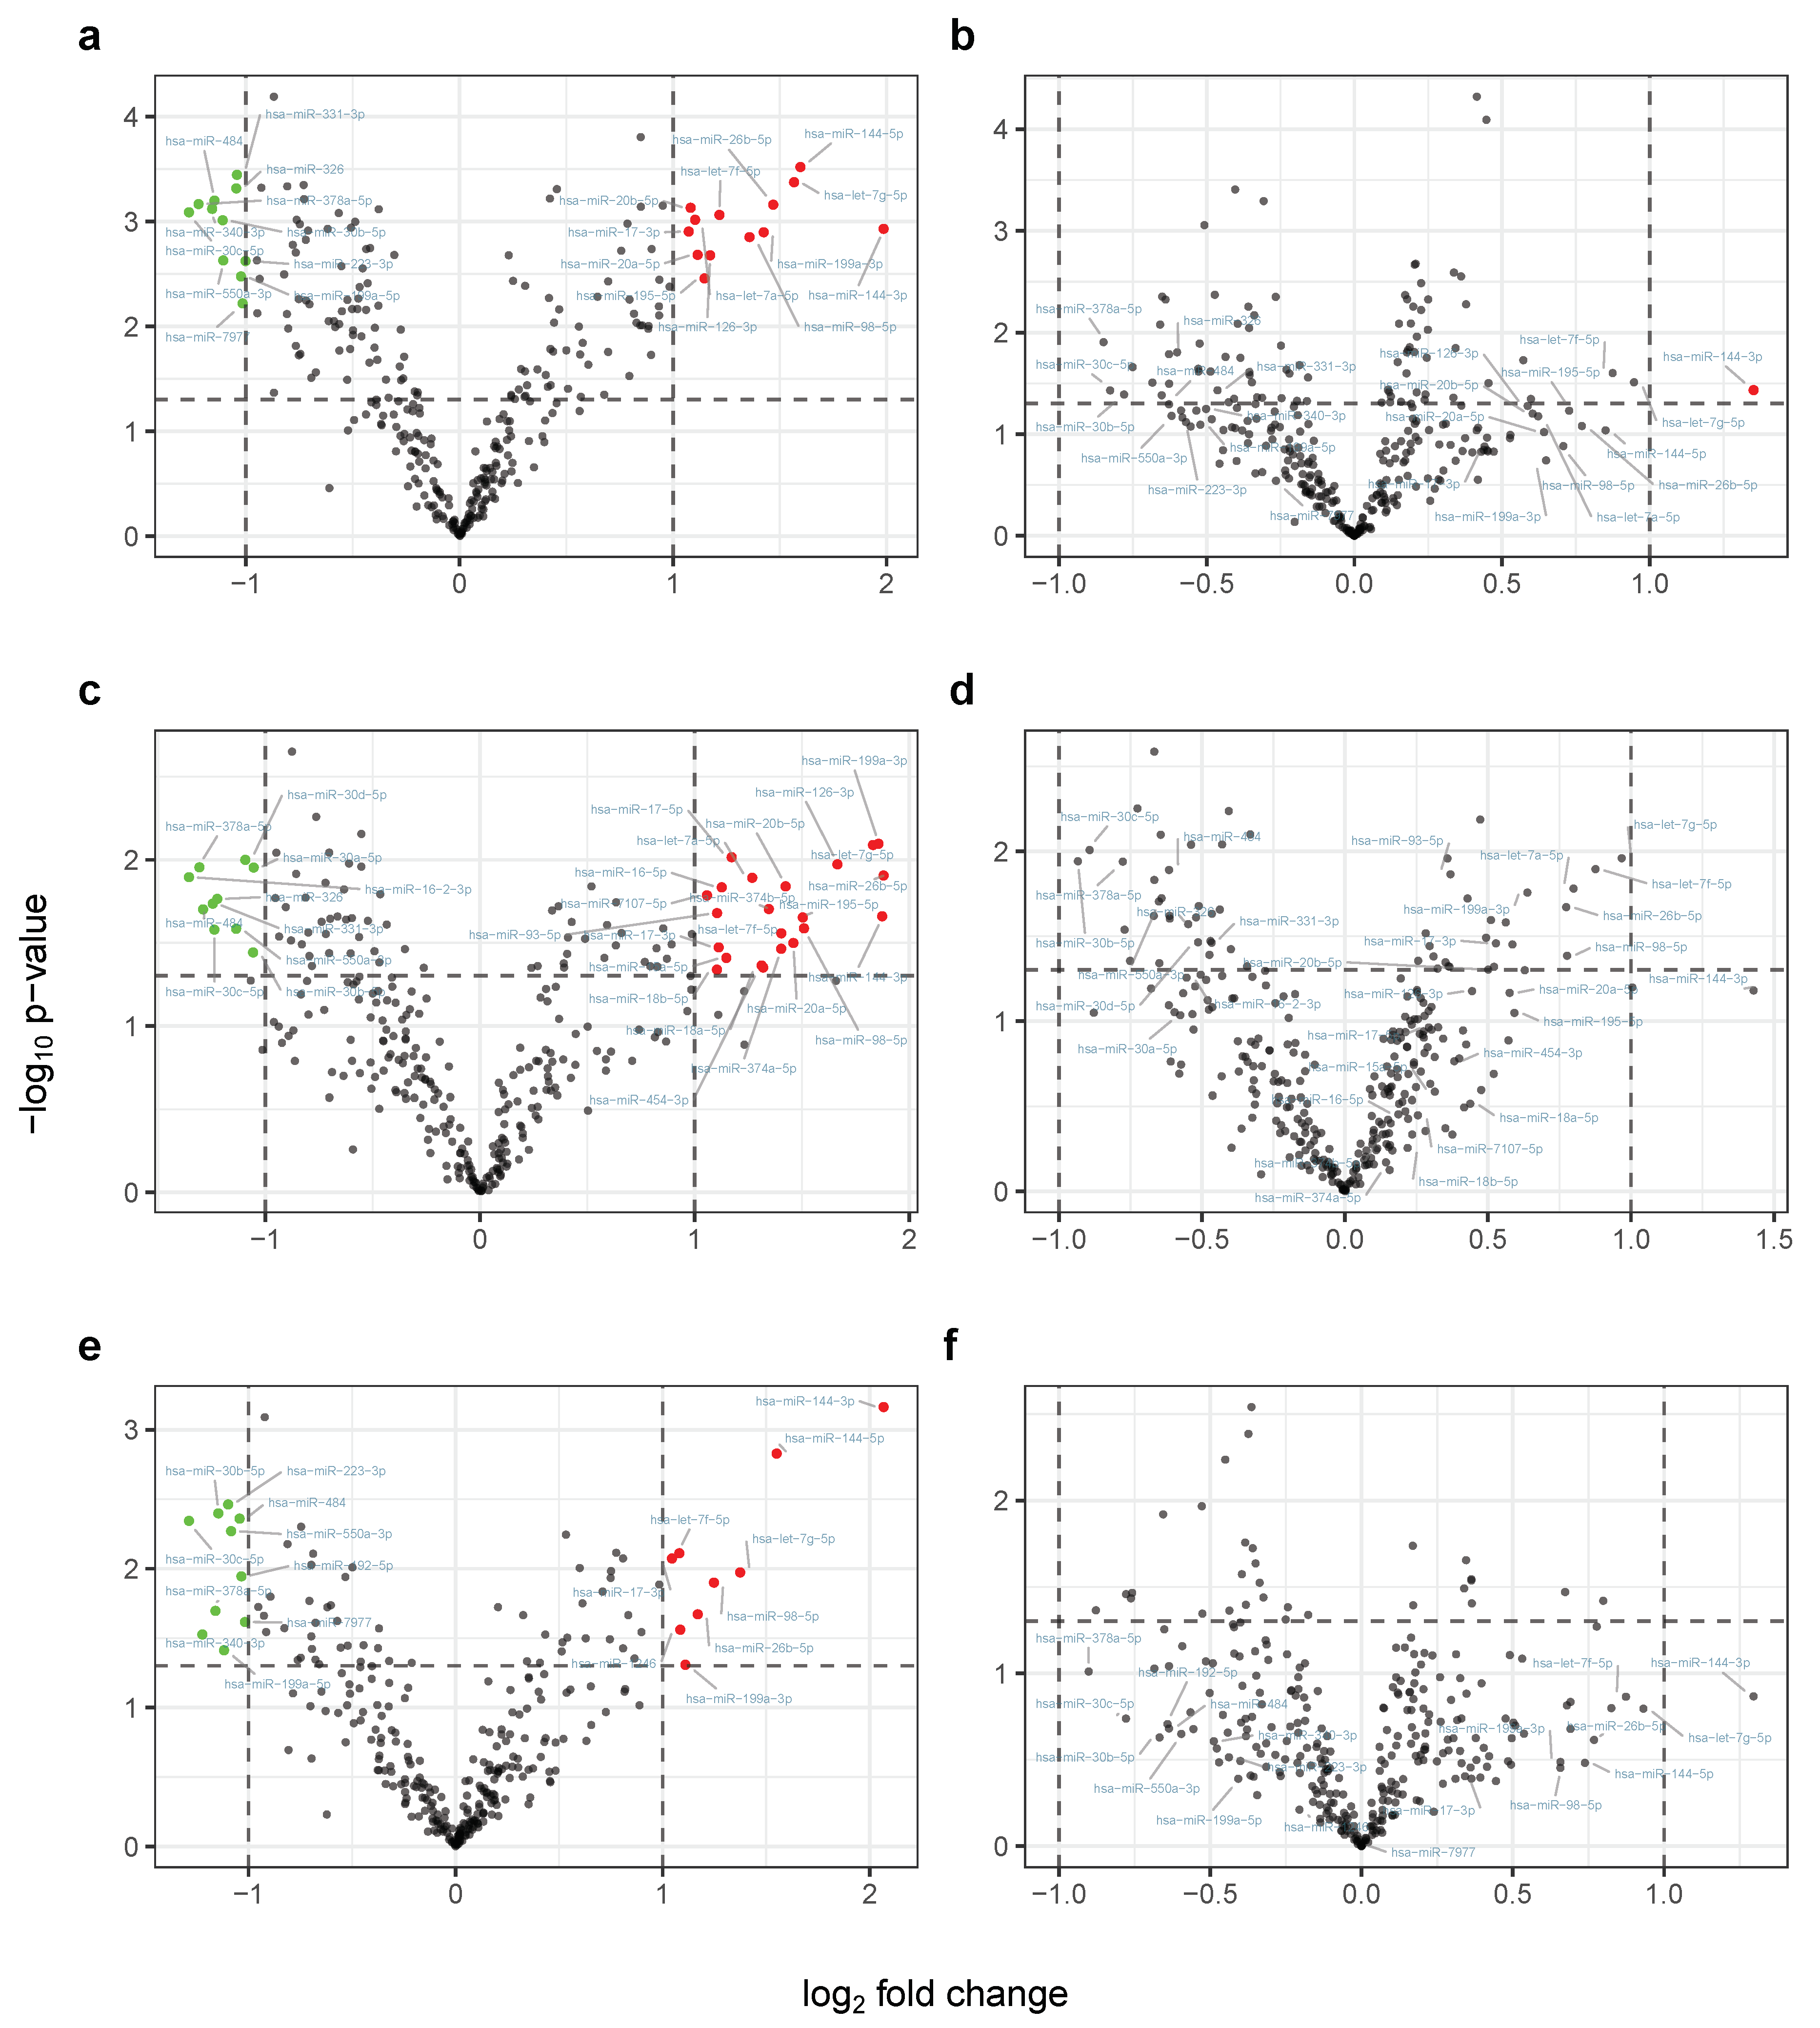
2.2. Physical Exercising Affects MicroRNA Expression
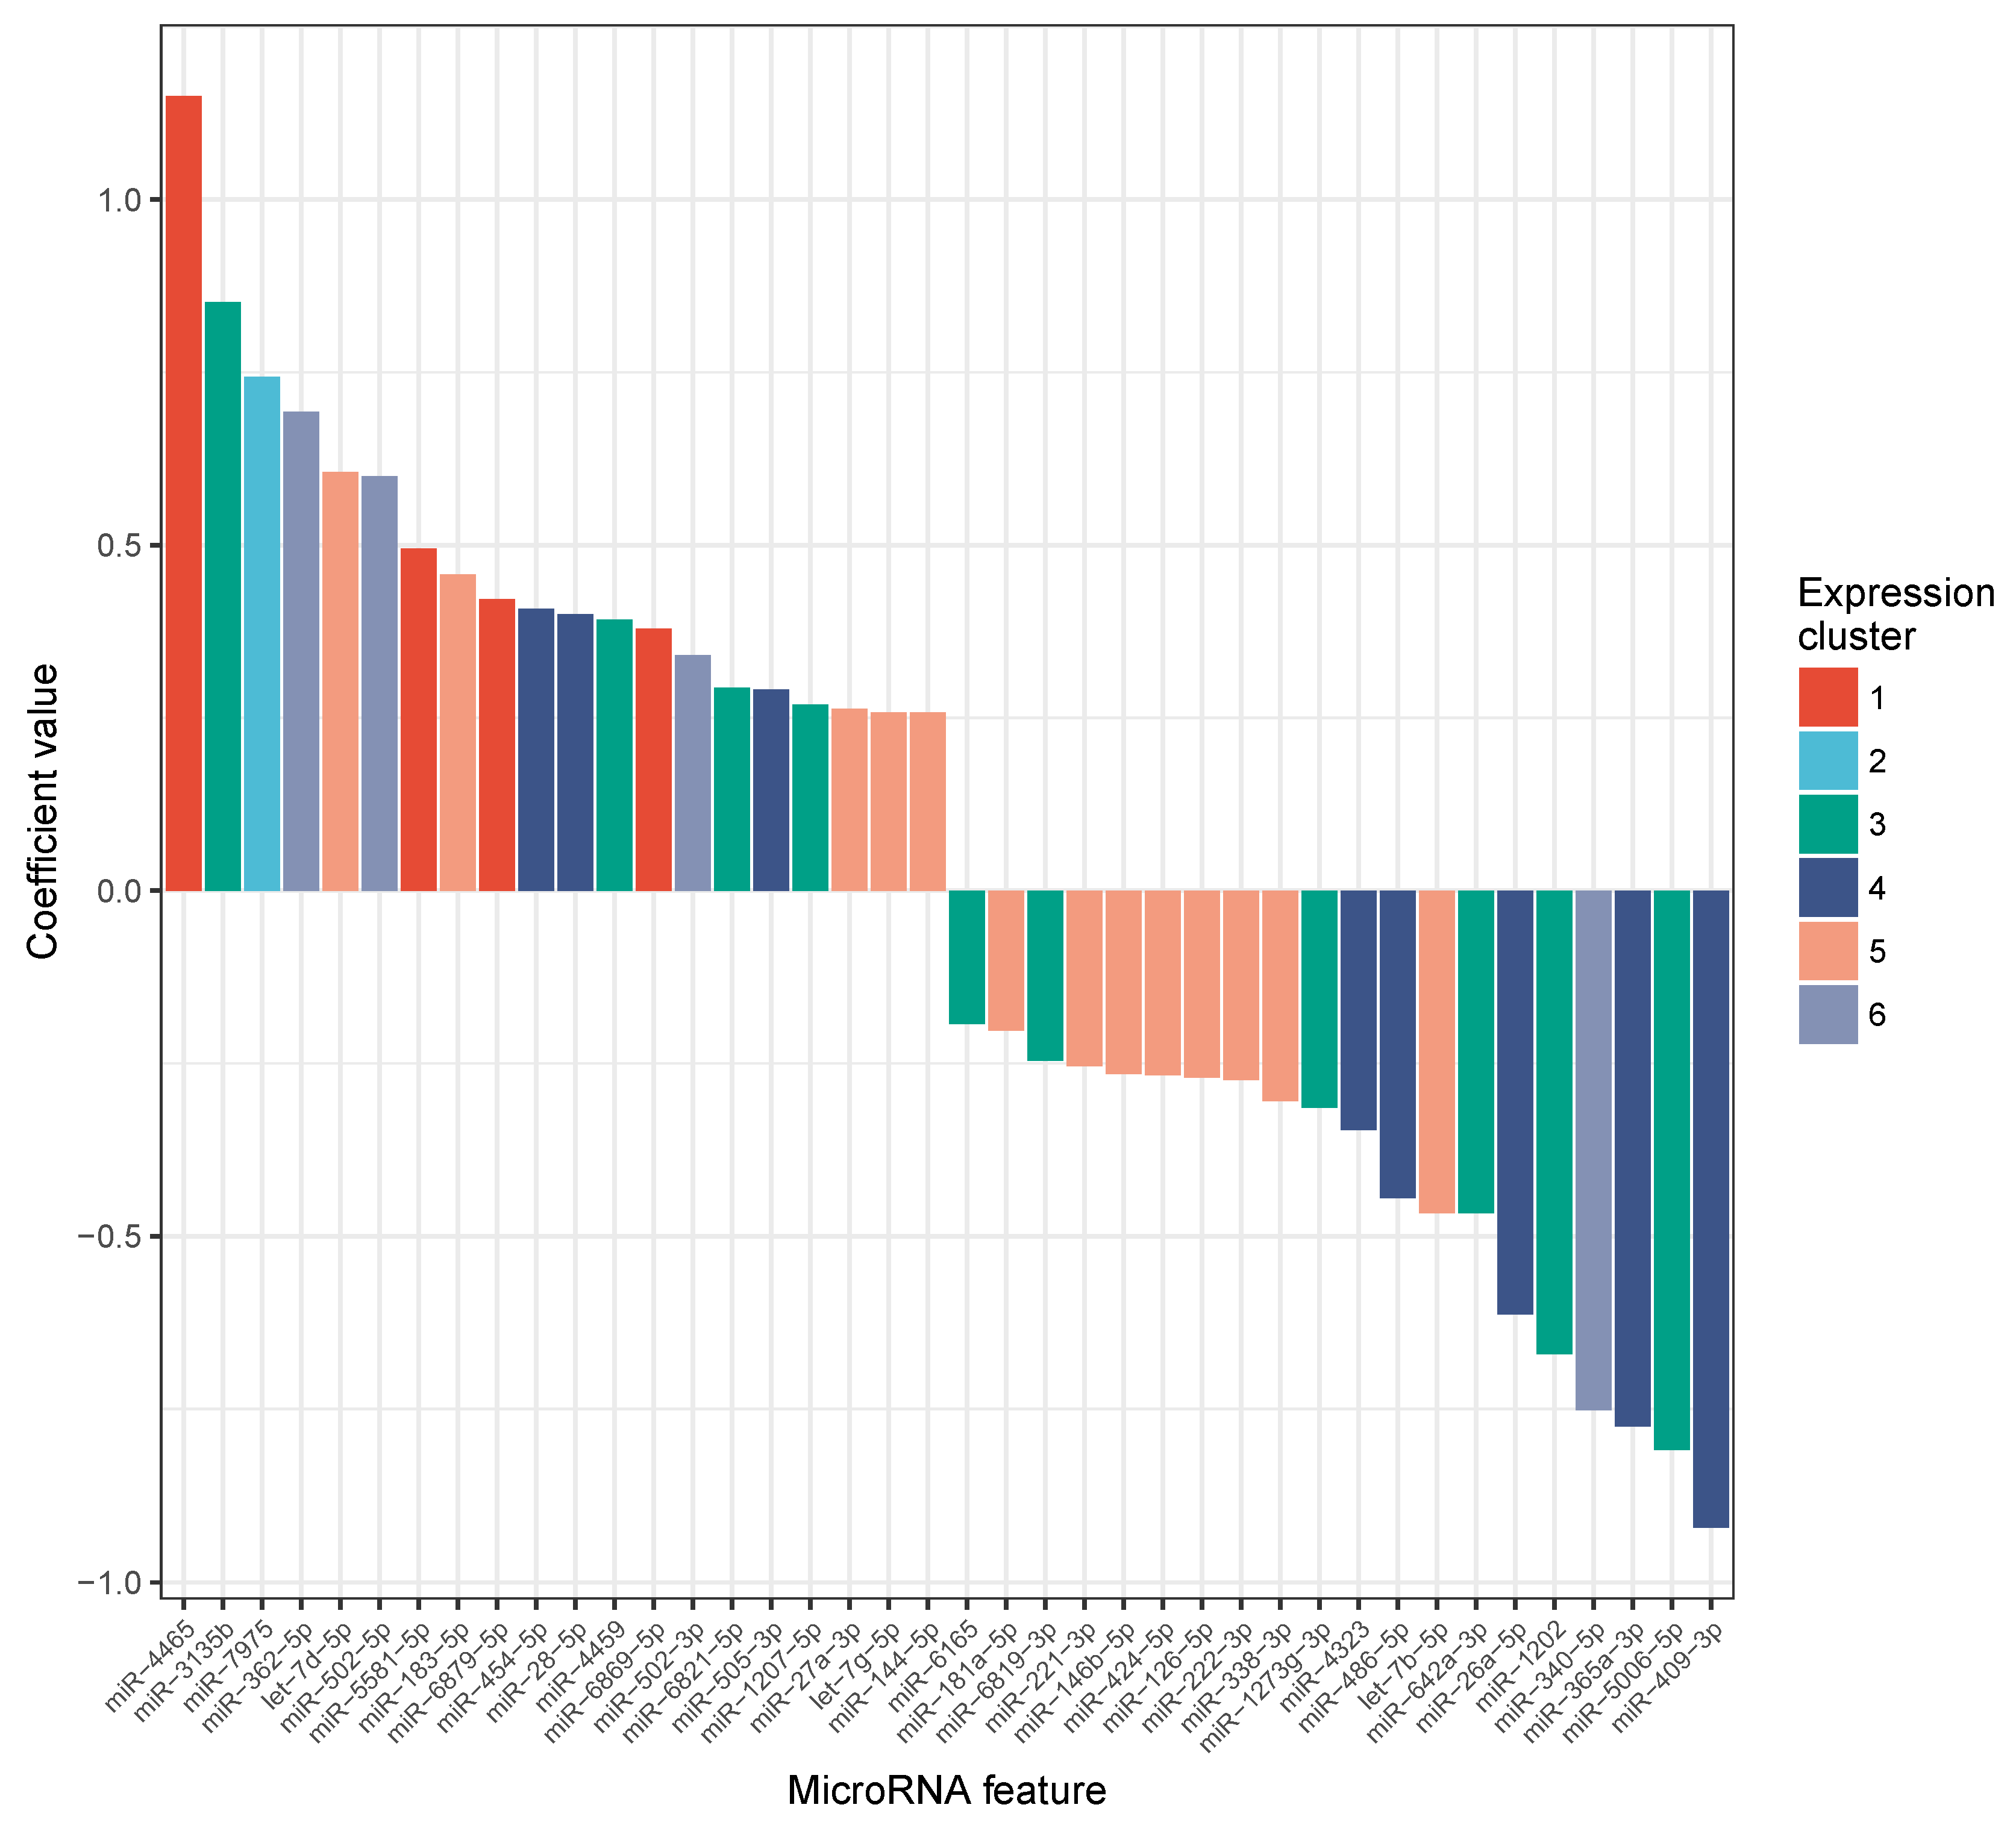
2.3. MiRNA Expression Levels Correlate with Change in VO Max
2.4. Candidate Marker MiR-532-5p Indicates Change in VO Max after Carbohydrate Uptake
3. Discussion
4. Materials and Methods
4.1. Study Design
4.2. Blood Sampling and Rna Extraction
4.3. Microarray Experiments
4.4. Statistical Analysis
4.5. Data Availability and Accession Codes
5. Conclusions
Supplementary Materials
Author Contributions
Funding
Acknowledgments
Conflicts of Interest
Abbreviations
| VT1 | Ventilatory threshold 1 |
| VO max | Maximal aerobic capacity |
| miRNA | MicroRNA |
| miRNome | Set of expressed miRNAs in a cell-type or tissue |
| mRNA | Messenger-RNA |
| UTR | Untranslated region |
| cDNA | Complementary DNA |
| CHO | Carbohydrates |
| AMPK | AMP-activated protein kinase |
| ECG | Electrocardiography |
| CBC | Complete blood count |
| RBC | Red blood cell |
| BMI | Body mass index |
| PCA | Principal component analysis |
| PVCA | Principal variance component analysis |
| t-SNE | t-distributed stochastic neighbor embedding |
| UMAP | Uniform manifold approximation and projection |
| GEO | Gene expression omnibus |
References
- Karvinen, S.; Waller, K.; Silvennoinen, M.; Koch, L.G.; Britton, S.L.; Kaprio, J.; Kainulainen, H.; Kujala, U.M. Physical activity in adulthood: Genes and mortality. Sci. Rep. 2015, 5, 18259. [Google Scholar] [CrossRef] [PubMed]
- Eijsvogels, T.M.H.; George, K.P.; Thompson, P.D. Cardiovascular benefits and risks across the physical activity continuum. Curr. Opin. Cardiol. 2016, 31, 566–571. [Google Scholar] [CrossRef] [PubMed]
- Warburton, D.E.R.; Bredin, S.S.D. Health benefits of physical activity: A systematic review of current systematic reviews. Curr. Opin. Cardiol. 2017, 32, 541–556. [Google Scholar] [CrossRef] [PubMed]
- Grazioli, E.; Dimauro, I.; Mercatelli, N.; Wang, G.; Pitsiladis, Y.; Di Luigi, L.; Caporossi, D. Physical activity in the prevention of human diseases: Role of epigenetic modifications. BMC Genom. 2017, 18, 802. [Google Scholar] [CrossRef] [PubMed]
- Wallace, R.G.; Twomey, L.C.; Custaud, M.A.; Turner, J.D.; Moyna, N.; Cummins, P.M.; Murphy, R.P. The role of epigenetics in cardiovascular health and ageing: A focus on physical activity and nutrition. Mech. Ageing Dev. 2018, 174, 76–85. [Google Scholar] [CrossRef] [PubMed]
- Ludlow, A.T.; Gratidao, L.; Ludlow, L.W.; Spangenburg, E.E.; Roth, S.M. Acute exercise activates p38 MAPK and increases the expression of telomere-protective genes in cardiac muscle. Exp. Physiol. 2017, 102, 397–410. [Google Scholar] [CrossRef]
- Recchioni, R.; Marcheselli, F.; Antonicelli, R.; Mensà, E.; Lazzarini, R.; Procopio, A.D.; Olivieri, F. Epigenetic effects of physical activity in elderly patients with cardiovascular disease. Exp. Gerontol. 2017, 100, 17–27. [Google Scholar] [CrossRef]
- Adams, V.; Reich, B.; Uhlemann, M.; Niebauer, J. Molecular effects of exercise training in patients with cardiovascular disease: Focus on skeletal muscle, endothelium, and myocardium. Am. J. Physiol.-Heart Circ. Physiol. 2017, 313, H72–H88. [Google Scholar] [CrossRef]
- Bartel, D.P. Metazoan MicroRNAs. Cell 2018, 173, 20–51. [Google Scholar] [CrossRef]
- Backes, C.; Meese, E.; Keller, A. Specific miRNA Disease Biomarkers in Blood, Serum and Plasma: Challenges and Prospects. Mol. Diagn. Ther. 2016, 6, 509–518. [Google Scholar] [CrossRef]
- Hecksteden, A.; Leidinger, P.; Backes, C.; Rheinheimer, S.; Pfeiffer, M.; Ferrauti, A.; Kellmann, M.; Sedaghat, F.; Meder, B.; Meese, E.; et al. miRNAs and sports: Tracking training status and potentially confounding diagnoses. J. Transl. Med. 2016, 14, 219. [Google Scholar] [CrossRef] [PubMed]
- Domańska-Senderowska, D.; Laguette, M.J.N.; Jegier, A.; Ciȩszczyk, P.; September, A.V.; Brzeziańska-Lasota, E. MicroRNA Profile and Adaptive Response to Exercise Training: A Review. Int. J. Sport Med. 2019, 40, 227–235. [Google Scholar] [CrossRef] [PubMed]
- Mann, T.N.; Lamberts, R.P.; Lambert, M.I. High responders and low responders: Factors associated with individual variation in response to standardized training. Sport Med. 2014, 44, 1113–1124. [Google Scholar] [CrossRef] [PubMed]
- Akerstrom, T.C.A.; Birk, J.B.; Klein, D.K.; Erikstrup, C.; Plomgaard, P.; Pedersen, B.K.; Wojtaszewski, J. Oral glucose ingestion attenuates exercise-induced activation of 5’-AMP-activated protein kinase in human skeletal muscle. Biochem. Biophys. Res. Commun. 2006, 342, 949–955. [Google Scholar] [CrossRef] [PubMed]
- Hardie, D.G. The AMP-activated protein kinase pathway–new players upstream and downstream. J. Cell Sci. 2004, 117, 5479–5487. [Google Scholar] [CrossRef] [PubMed]
- Rockl, K.S.C.; Witczak, C.A.; Goodyear, L.J. Signaling mechanisms in skeletal muscle: Acute responses and chronic adaptations to exercise. IUBMB Life 2008, 60, 145–153. [Google Scholar] [CrossRef] [PubMed]
- Beaudouin, F.; Joerg, F.; Hilpert, A.; Meyer, T.; Hecksteden, A. Carbohydrate intake and training efficacy—A randomized cross-over study. J. Sport Sci. 2018, 36, 942–948. [Google Scholar] [CrossRef] [PubMed]
- Kozomara, A.; Griffiths-Jones, S. MiRBase: Annotating high confidence microRNAs using deep sequencing data. Nucleic Acids Res. 2014, 42. [Google Scholar] [CrossRef]
- Pearson, K. LIII. On lines and planes of closest fit to systems of points in space. Philos. Mag. J. Sci. 1901, 2, 559–572. [Google Scholar] [CrossRef]
- Bushel, P. PVCA: Principal Variance Component Analysis (PVCA). Bioconduct. Release (3.9) 2013. [Google Scholar] [CrossRef]
- McInnes, L.; Healy, J.; Melville, J. UMAP: Uniform Manifold Approximation and Projection for Dimension Reduction. aRxiv 2018, arXiv:1802.03426. [Google Scholar]
- Van der Maaten, L.; Hinton, G. Visualizing Data using t-SNE. J. Mach. Learn. Res. 2008, 9, 2579–2605. [Google Scholar] [CrossRef]
- Backes, C.; Khaleeq, Q.T.; Meese, E.; Keller, A. MiEAA: MicroRNA enrichment analysis and annotation. Nucleic Acids Res. 2016, 44, 110–116. [Google Scholar] [CrossRef] [PubMed]
- Barnes, G.; Japp, A.G.; Newby, D.E. Translational promise of the apelin–APJ system. Heart 2010, 96, 1011 LP–1016 LP. [Google Scholar] [CrossRef]
- Akerstrom, T.C.A.; Fischer, C.P.; Plomgaard, P.; Thomsen, C.; van Hall, G.; Pedersen, B.K. Glucose ingestion during endurance training does not alter adaptation. J. Appl. Physiol. 2009, 106, 1771–1779. [Google Scholar] [CrossRef]
- Nybo, L.; Pedersen, K.; Christensen, B.; Aagaard, P.; Brandt, N.; Kiens, B. Impact of carbohydrate supplementation during endurance training on glycogen storage and performance. Acta Physiol. 2009, 197, 117–127. [Google Scholar] [CrossRef]
- Van Proeyen, K.; Szlufcik, K.; Nielens, H.; Ramaekers, M.; Hespel, P. Beneficial metabolic adaptations due to endurance exercise training in the fasted state. J. Appl. Physiol. 2011, 110, 236–245. [Google Scholar] [CrossRef] [PubMed]
- Fullagar, H.H.K.; Skorski, S.; Duffield, R.; Hammes, D.; Coutts, A.J.; Meyer, T. Sleep and athletic performance: The effects of sleep loss on exercise performance, and physiological and cognitive responses to exercise. Sport Med. 2015, 45, 161–186. [Google Scholar] [CrossRef]
- Leidinger, P.; Backes, C.; Rheinheimer, S.; Keller, A.; Meese, E. Towards Clinical Applications of Blood-Borne miRNA Signatures: The Influence of the Anticoagulant EDTA on miRNA Abundance. PLoS ONE 2015, 10, e0143321. [Google Scholar] [CrossRef]
- Zhou, S.S.; Jin, J.P.; Wang, J.Q.; Zhang, Z.G.; Freedman, J.H.; Zheng, Y.; Cai, L. miRNAS in cardiovascular diseases: Potential biomarkers, therapeutic targets and challenges. Acta Pharmacol. Sin. 2018, 39, 1073–1084. [Google Scholar] [CrossRef]
- Wang, H.; Peng, R.; Wang, J.; Qin, Z.; Xue, L. Circulating microRNAs as potential cancer biomarkers: The advantage and disadvantage. Clin. Epigenet. 2018, 10, 59. [Google Scholar] [CrossRef] [PubMed]
- Williams, C.J.; Williams, M.G.; Eynon, N.; Ashton, K.J.; Little, J.P.; Wisloff, U.; Coombes, J.S. Genes to predict VO2max trainability: A systematic review. BMC Genom. 2017, 18, 831. [Google Scholar] [CrossRef] [PubMed]
- Backes, C.; Sedaghat-Hamedani, F.; Frese, K.; Hart, M.; Ludwig, N.; Meder, B.; Meese, E.; Keller, A. Bias in High-Throughput Analysis of miRNAs and Implications for Biomarker Studies. Anal. Chem. 2016, 88, 2088–2095. [Google Scholar] [CrossRef] [PubMed]
- Cui, S.; Sun, B.; Yin, X.; Guo, X.; Chao, D.; Zhang, C.; Zhang, C.Y.; Chen, X.; Ma, J. Time-course responses of circulating microRNAs to three resistance training protocols in healthy young men. Sci. Rep. 2017, 7, 2203. [Google Scholar] [CrossRef]
- Ortega, F.J.; Mercader, J.M.; Catalan, V.; Moreno-Navarrete, J.M.; Pueyo, N.; Sabater, M.; Gomez-Ambrosi, J.; Anglada, R.; Fernandez-Formoso, J.A.; Ricart, W.; et al. Targeting the circulating microRNA signature of obesity. Clin. Chem. 2013, 59, 781–792. [Google Scholar] [CrossRef] [PubMed]
- Ortega, F.J.; Mercader, J.M.; Moreno-Navarrete, J.M.; Rovira, O.; Guerra, E.; Esteve, E.; Xifra, G.; Martinez, C.; Ricart, W.; Rieusset, J.; et al. Profiling of circulating microRNAs reveals common microRNAs linked to type 2 diabetes that change with insulin sensitization. Diabetes Care 2014, 37, 1375–1383. [Google Scholar] [CrossRef] [PubMed]
- Jones, A.; Danielson, K.M.; Benton, M.C.; Ziegler, O.; Shah, R.; Stubbs, R.S.; Das, S.; Macartney-Coxson, D. miRNA Signatures of Insulin Resistance in Obesity. Obesity 2017, 25, 1734–1744. [Google Scholar] [CrossRef] [PubMed]
- Al-Rawaf, H.A. Circulating microRNAs and adipokines as markers of metabolic syndrome in adolescents with obesity. Clin. Nutr. 2018. [Google Scholar] [CrossRef] [PubMed]


| Direction | Setup 1 | Setup 2 | Setup 3 |
|---|---|---|---|
| Up-regulated | |||
| let-7a-5p | let-7a-5p | let-7f-5p | |
| let-7f-5p | let-7f-5p | let-7g-5p | |
| let-7g-5p | let-7g-5p | miR-17-3p | |
| miR-17-3p | miR-15a-5p | miR-26b-5p | |
| miR-20a-5p | miR-16-5p | miR-98-5p | |
| miR-20b-5p | miR-17-3p | miR-144-3p | |
| miR-26b-5p | miR-17-5p | miR-144-5p | |
| miR-98-5p | miR-18a-5p | miR-199a-3p | |
| miR-126-3p | miR-18b-5p | miR-1246 | |
| miR-144-3p | miR-20a-5p | ||
| miR-144-5p | miR-20b-5p | ||
| miR-195-5p | miR-26b-5p | ||
| miR-199a-3p | miR-93-5p | ||
| miR-98-5p | |||
| miR-126-3p | |||
| miR-144-3p | |||
| miR-195-5p | |||
| miR-199a-3p | |||
| miR-374a-5p | |||
| miR-374b-5p | |||
| miR-454-3p | |||
| miR-7107-5p | |||
| Down-regulated | |||
| miR-30b-5p | miR-16-2-3p | miR-30b-5p | |
| miR-30c-5p | miR-30a-5p | miR-30c-5p | |
| miR-199a-5p | miR-30b-5p | miR-192-5p | |
| miR-223-3p | miR-30c-5p | miR-199a-5p | |
| miR-326 | miR-30d-5p | miR-223-3p | |
| miR-331-3p | miR-326 | miR-340-3p | |
| miR-340-3p | miR-331-3p | miR-378a-5p | |
| miR-378a-5p | miR-378a-5p | miR-484 | |
| miR-484 | miR-484 | miR-550a-3p | |
| miR-550a-3p | miR-550a-3p | miR-7977 | |
| miR-7977 |
| Timepoint 1 () | Timepoint 2 () | |||
|---|---|---|---|---|
| Group 1 (+) | Group 2 (−) | Group 1 (+) | Group 2 (−) | |
| − Glucose | ||||
| + Glucose | ||||
© 2019 by the authors. Licensee MDPI, Basel, Switzerland. This article is an open access article distributed under the terms and conditions of the Creative Commons Attribution (CC BY) license (http://creativecommons.org/licenses/by/4.0/).
Share and Cite
Kern, F.; Ludwig, N.; Backes, C.; Maldener, E.; Fehlmann, T.; Suleymanov, A.; Meese, E.; Hecksteden, A.; Keller, A.; Meyer, T. Systematic Assessment of Blood-Borne MicroRNAs Highlights Molecular Profiles of Endurance Sport and Carbohydrate Uptake. Cells 2019, 8, 1045. https://doi.org/10.3390/cells8091045
Kern F, Ludwig N, Backes C, Maldener E, Fehlmann T, Suleymanov A, Meese E, Hecksteden A, Keller A, Meyer T. Systematic Assessment of Blood-Borne MicroRNAs Highlights Molecular Profiles of Endurance Sport and Carbohydrate Uptake. Cells. 2019; 8(9):1045. https://doi.org/10.3390/cells8091045
Chicago/Turabian StyleKern, Fabian, Nicole Ludwig, Christina Backes, Esther Maldener, Tobias Fehlmann, Artur Suleymanov, Eckart Meese, Anne Hecksteden, Andreas Keller, and Tim Meyer. 2019. "Systematic Assessment of Blood-Borne MicroRNAs Highlights Molecular Profiles of Endurance Sport and Carbohydrate Uptake" Cells 8, no. 9: 1045. https://doi.org/10.3390/cells8091045
APA StyleKern, F., Ludwig, N., Backes, C., Maldener, E., Fehlmann, T., Suleymanov, A., Meese, E., Hecksteden, A., Keller, A., & Meyer, T. (2019). Systematic Assessment of Blood-Borne MicroRNAs Highlights Molecular Profiles of Endurance Sport and Carbohydrate Uptake. Cells, 8(9), 1045. https://doi.org/10.3390/cells8091045