Article

Sugar Transporter Proteins (STPs) in Gramineae Crops: Comparative Analysis, Phylogeny, Evolution, and Expression Profiling

State Key Laboratory for Hybrid Rice, College of Life Sciences, Wuhan University, Wuhan 430072, China
*
Author to whom correspondence should be addressed.
Cells 2019, 8(6), 560; https://doi.org/10.3390/cells8060560
Submission received: 14 May 2019 / Revised: 7 June 2019 / Accepted: 7 June 2019 / Published: 8 June 2019
(This article belongs to the Special Issue Bioinformatics and Computational Biology 2019)

Abstract

:
Sugar transporter proteins (STPs), such as H+/sugar symporters, play essential roles in plants’ sugar transport, growth, and development, and possess an important potential to enhance plants’ performance of multiple agronomic traits, especially crop yield and stress tolerance. However, the evolutionary dynamics of this important gene family in Gramineae crops are still not well-documented and functional differentiation of rice STP genes remain unclear. To address this gap, we conducted a comparative genomic study of STP genes in seven representative Gramineae crops, which are Brachypodium distachyon (Bd), Hordeum vulgare (Hv), Setaria italica (Si), Sorghum bicolor (Sb), Zea mays (Zm), Oryza rufipogon (Or), and Oryza sativa ssp. japonica (Os). In this case, a total of 177 STP genes were identified and grouped into four clades. Of four clades, the Clade I, Clade III, and Clade IV showed an observable number expansion compared to Clade II. Our results of identified duplication events and divergence time of duplicate gene pairs indicated that tandem, Whole genome duplication (WGD)/segmental duplication events play crucial roles in the STP gene family expansion of some Gramineae crops (expect for Hv) during a long-term evolutionary process. However, expansion mechanisms of the STP gene family among the tested species were different. Further selective force studies revealed that the STP gene family in Gramineae crops was under purifying selective forces and different clades and orthologous groups with different selective forces. Furthermore, expression analysis showed that rice STP genes play important roles not only in flower organs development but also under various abiotic stresses (cold, high-temperature, and submergence stresses), blast infection, and wounding. The current study highlighted the expansion and evolutionary patterns of the STP gene family in Gramineae genomes and provided some important messages for the future functional analysis of Gramineae crop STP genes.

1. Introduction

Sugar (e.g., monosaccharides, sucrose, polyols, and oligosaccharides) is important for a broad range of plant growth, development, and stress responses as energy sources, carbohydrate substrates, signal molecules, and the main elements for cellular compounds [1,2,3,4]. A variety of transporters have been evolved by plants for the transport of sugar from source (leaves) to sink tissues (e.g., roots, seeds, and flowers) [4,5,6,7], including sugars that will eventually be exported transporters (SWEETs), sucrose transporters (SUTs), and monosaccharide transporters (MSTs) [8,9]. These transporters are responsible for the loading and unloading of various polysaccharides and monosaccharides. These also contribute to carbon partitioning, signal transduction, crop yield, stress responses, and environmental adaption [7,10,11].
Sugar transporter proteins (STPs), which include one family of MSTs superfamily, are integral membrane proteins possessing 12 transmembrane domains and are regarded as H+/sugar symporters located on plasma membranes [3,4,12]. So far, STPs have been identified and well characterized in numerous plants, including Arabidopsis [13], Oryza sativa [4,14], Vitis vinifera [15], Solanum lycopersicum [16], Manihot esculenta [11], and Brassica oleracea var. capitata L. [5]. Most reported STPs exhibit a broad spectrum of absorption characteristics of substrates including glucose, pentose, xylose, ribose, galactose, fructose, and mannose [13,17,18]. For example, AtSIP1, AtSIP2, AtSIP3, AtSIP4, AtSIP6, and AtSIP11 transport of mannose, glucose, xylose, and galactose have different affinities [12,19]. Likewise, OsSTP4 and OsSTP6 are able to transport glucose, fructose, mannose, and galactose [20,21]. However, a few STPs show substrate specificity in sugar transport. For example, AtSTP9 and AtSTP14 specifically transport glucose and galactose, separately [22,23]. In addition, cumulative previous reports have demonstrated that STP genes have different expression patterns in diverse tissues/organs or under diverse stresses and they significantly impact plant development and stress tolerance [11,18]. For instance, AtSTP1 has relatively high expression level in germinating seeds, guard cells, and young seedlings [24]. AtSTP2, AtSTP6, AtSTP9, and AtSTP11 show a pollen-specific expression pattern [13], whereas AtSTP4 displays the highest expression level in roots [25]. Similarly, OsSTP13 is also highly expressed in roots and responds to hormone treatments [4]. OsSTP27 has the highest expression level in shoots and displays significant up-regulation under three sugar treatments (e.g., sucrose, glucose, and fructose) [24]. OsSTP3 can be detected in leaf blades and leaf sheaths and showed a high level in calli and roots [14]. Additionally, several STP genes (OsSTP4, OsSTP11, OsSTP19, and OsSTP28) reportedly responded to salt, osmotic, and drought stresses [4]. Furthermore, some STP genes are associated with various environmental stresses, such as wounding [25,26], pathogen attack [27], and nematode infection [28]. These findings stressed that STPs are of great significance in plants’ sugar transport, growth, development, and stress tolerances.
Many Gramineae crops (e.g., maize, rice, barley, millet, and sorghum) have high economic values, high-quality plant genomes, and well-characterized phylogeny [29]. In addition, Gramineae is an exceptional model system for the study of short-term evolutionary dynamics of one gene family and its consequences [30]. However, evolutionary dynamics of the STP gene family are poorly documented in the important Gramineae crops to date. Thus, a systematic comparative genetic analysis of the STP gene family in seven representative Gramineae crops, including Brachypodium distachyon, Hordeum vulgare, Setaria italica, Sorghum bicolor, Zea mays, Oryza rufipogon, and Oryza sativa ssp. japonica, was conducted including the phylogenetic relationship, chromosomal location, gene structure, protein motifs, orthologous groups, duplication events, and selective forces. Additionally, a comprehensive gene expression analysis (in the flower organ development process, under various abiotic stresses, under blast infection, and under wounding) was performed in rice to characterize the functional differentiation of the STP gene family. This study explored the expansion and evolutionary patterns of the STP gene family in seven representative Gramineae crops and provided preliminary insights into the STP genes’ functions.

2. Materials and Methods

2.1. Plant Materials

Rice cultivar ′9311′ (Oryza sativa ssp. indica) seedlings were grown in a Wuhan University greenhouse with a 16/8-h light/dark photoperiod at 26 °C, with 60% relative humidity. In the greenhouse, seeds after 2 days of germination in water at 37 °C were grown in containers with sponges as supporting materials in the Yoshida solution for further growth [4].

2.2. Plant Treatments

Rice seedlings of different ages grown in greenhouses were used for cold, high-temperature, submergence, wound, and rice blast treatment. For heat and cold treatments, the temperatures for 12-day-old seedlings were changed to 40 °C and 4 °C, respectively, and then sampled (leaves) at 0, 1, 3, 6, and 12 h. As to submergence (Sub) treatment, 12-day-old seedlings were placed in water, with a depth of 5 cm from leaf top to water surface, and sampled (leaves) at 0, 12, 24, 48, and 72 h. For wound treatment, the daily photoperiodic cycle of 9-day-old seedlings was changed to a 24-h light condition. Then, 12-day-old seedlings were cut off nearly one third of leaf from the top, and sampled (leaves) at 0, 1/4, 1/2, 1, 3, 6, 12, and 24 h. As to rice blast treatment, the daily photoperiodic cycle of 9-day-old seedlings was changed to a 24-h dark condition. Next, 12-day-old seedlings were sprayed with 70 mL spore suspension (about 10 5 conidia mL −1), and sampled (leaves) at 0, 1/4, 1/2, 1, 3, 6, 12, 24, and 48 h. During the sampling time, ddH2O was sprayed to keep the humidity of the treated seedlings.
Fourteen tissue samples were collected from ′9311′ rice plants grown in an experimental field with a nature environment during the summer in Wuhan city (29°58′20″N, 113°53′29″E) for tissue specific expression analysis, including Pan10/20 (panicles harvested before heading at lengths of 10/20 cm), SC1/2 (seed coat, 3/15 days after flowering), An (anther, 1–3 days before flowering), SO (stigma and ovary, 1–3 days before flowering), ImSe (immature endosperm, 15 days after flowering), and Car1/3/5/7/10/15/20 (caryopses, 1/3/5/7/10/15/20 days after flowering) [31].
In this study, three biological replicates were produced for every treatment. Each replicate was collected from over 12 seedlings and pooled together. All samples were triturated immediately with liquid nitrogen, and stored at 80 °C for further use [4,31].

2.3. Identification and Phylogenetic Analysis of STP Genes

The protein and cDNA sequences of seven representative Gramineae crops, including B. distachyon (v3.0), H. vulgare (IBSC_v2), S. italica (v2.0), S. bicolor (NCBIv3), Z. mays (B73_RefGen_v4), as well as O. sativa ssp. japonica (MSU 7.0), were downloaded from Ensembl Plants release 41 (http://plants.ensembl.org/index.html) and TIGR Database (http://rice.plantbiology.msu.edu), respectively. The HMM (Hidden Markov Model) profile of the Sugar_tr (PF00083) was obtained from Pfam (http://pfam.xfam.org/). All STP proteins were separately searched by HMMER 3.2.1 (with default parameters) and BLASTP (E-value of e-5) methods [4]. The candidate STP protein sequences with the length <400 amino acids were excluded for further analysis because the length of the complete Sugar_tr domain is greater than 400. Subsequently, all remaining candidate sequences were checked for the highly conserved Sugar_tr domain and the MFS_STP domain using SMART (http://smart.embl-heidelberg.de/), Pfam (http://pfam.xfam.org/search/sequence), and Batch CD-Search (https://www.ncbi.nlm.nih.gov/Structure/bwrpsb/bwrpsb.cgi) [4,32]. The STP genes information about chromosomal locations was extracted from all tested species’ GFF3 files [4,32].
All identified STP proteins from these seven representative Gramineae crops were aligned by ClustalW [32] and a phylogeny tree was generated in MEGA 6.0 using the neighbor-joining (NJ) method with 1000 bootstrap replicates [4,32]. Names of putative STP genes were assigned based on chromosomal order in each genome in accordance with the previous rice STPs study [4,14].

2.4. Gene Duplication Events, Orthologous Groups’ Analysis, Gene Structure, and Conserved Motifs

Various types of gene duplication events of the STP gene family were identified by the ’duplicate_gene_classifier’ script in MCScanX with an E-value of 1 × e-5 in BlastP search [32]. The synonymous (Ks)/nonsynonymous (Ka) substitution (Ka/Ks) rates were analyzed using DnaSP 5.0 (http://www.ub.edu/dnasp/) for selective force analysis of a duplicate gene pair [33]. Moreover, the divergence time of all duplicate pairs was estimated by T = Ks/(2 × 9.1 × 10−9) × 10−6 million years ago (Mya) [4,32].
First, an all-vs-all BlastP result was obtained by diamond software with parameters: E value 1 × e−3 (https://ab.inf.uni-tuebingen.de/software/) as the input file for OrthoFinder v2.0 software (University of Oxford, Oxford, UK). Then, orthologous groups were analyzed according to the previously published paper [34]. The phylogenetic tree of all tested species was rebuilt based on the result of orthologous groups using STAG and STRIDE algorithms in OrthoFinder software [34]. Additionally, the selective forces on orthologous groups were evaluated by Tajima’s D values and Tajima’s D of each orthologous group was calculated by DnaSP 5.0 [33].
Exon/intron site and length data were extracted from seven respective genome annotation GFF files. The conserved motifs of all STP proteins were analyzed by the MEME program (http://meme-suite.org/tools/meme) with parameters: the maximum number of 20 motifs with motif length between 6 wide and 300 wide amino acids. Then, TBtools was used to visualize the phylogenetic tree, gene structure, and conserved motifs of the STP gene family [35].

2.5. Quantitative Real-Time PCR (qRT-PCR)

All RNAs were extracted by the TRIzol Ragent (Invitrogen, Beijing, China) and reverse transcriptions of all RNAs were performed using HiScript III 1st Strand cDNA Synthesis Kit (Vazyme, Shanghai, China), according to their instruction manuals. The qRT-PCR reaction (10 μL) was formulated using the 2X SYBR Green qPCR Master Mix (US Everbright®Inc., Suzhou, China). Primers of rice 19 STP genes were designed by Primer 5.0 and displayed in Table S1. All qRT-PCRs were carried out on a CFX96 Touch™ Real-Time PCR Detection System (Bio-Rad, Hercules, CA, USA). The actin gene was used as an internal control [32]. Three biological replicates (from three independent RNA samples) of each treated point were used for qRT-PCR. For each biological replicate, three technical replicates were used. The average threshold cycle (Ct) from three biological replicates was used to calculate the gene expression fold change by the 2−ΔΔCT method [4,32].

3. Results

3.1. Identification and Comparative Phylogenetic of STP Genes in Seven Representative Gramineae Crops

A total of 27, 26, 28, 26, 25, 23, and 22 STP genes were identified in H. vulgare (Hv), B. distachyon (Bd), O. sativa ssp. japonica (Os), O. rufipogon (Or), S. italica (Si), S. bicolor (Sb), and Z. mays (Zm), respectively. As shown in Figure 1 and Figure 2, Hv, Bd, Os, and Or have more STP genes than Si, Sb, and Zm. We speculated the number of differences of STP genes in these species as a result of gene expansion of different clades among these species. Thus, a phylogenetic analysis and clade classifications were conducted. We found that all STP proteins were clustered into four clades, which include Clade I, Clade II, Clade III, and Clade IV. The Clade I, Clade III, and Clade IV showed a clear number expansion compared to Clade II (Figure 2). Clade III and Clade IV vary greatly among these tested species, while Clade I and Clade II showed more STP gene copies in Hv, Bd, Os, and Or than Si, Sb, and Zm (Figure 2).

3.2. Homologous Relationship, Gene Structure, and Selective Forces

To understand the expansion mechanism of paralogues in these species, we investigated gene locations and duplication modes within each species via MCScanX. The identified STP genes among these tested species were unevenly distributed on the chromosomes (Chrs). Only the ZmSTP22 (gene ID: Zm00001d000183_T001) could not be mapped to any Chr conclusively (Figure 3 and Table S2). In total, 29 duplicate gene pairs were identified containing two duplicate types: whole genome duplication (WGD)/segmental duplication and tandem duplication in these seven species (Table 1 and Figure 3). Further studies displayed that the numbers and types vary greatly among these six species (Table 1 and Figure 3), which indicates that gene expansion mechanisms of these tested species are different. For example, no duplicate gene pair was found in Hv, whereas nine, five, five, four, three, and three duplicate gene pairs were detected in Si, Or, Os, Zm, Sb, and Bd (Table 1 and Figure 3). Numbers and types of duplicate gene pairs were the same between Os and Or, which supported that wild rice (Or) is the ancestor of cultivated rice (Os) [36]. In addition, the number of WGD/segmental duplication was more than that of tandem duplication in Bd and Zm, while the number of tandem duplication was more than that of WGD/segmental duplication in Or, Os, Sb, and Si. Divergence time of all gene duplicate pairs ranged from 5.57 to 60.90 Mya and varied greatly among these tested species. For example, divergence time of Bd duplicate gene pairs were more than 25 Mya, that of Or and Os ranged from 5 to 31 Mya, that of Sb were more than 23 Mya, that of Si ranged from 15 to 50 Mya, and that of Zm was more than 29 Mya. However, Ka/Ks values of all identified duplicate pairs were less than 1.0 (Table 2). These results suggested that multiple duplication events play essential roles in the gene expansion of Gramineae crop genomes during the long-term evolutionary process and the main duplication mode are different between these tested species. However, all duplicate genes are under purifying selective forces (all Ka/Ks values of all identified duplicate pairs <1.0).
Additionally, to understand the evolutionary pattern of STP genes in Gramineae crops, the orthologous groups (OGs) were identified by OrthoFinder software. A total of 174 STP genes were assigned into 19 OGs except for three unassigned STP genes (Figure 1, Table 2, and Tables S3 and S4). We found that the number of genes in each OG is not identical to each other. For instance, OG1 contained 29 genes, while OG16 and OG17 had only four and two genes, respectively. Of these OGs, these seven tested species shared 12 OGs (OG1–OG12). Three single-copy OGs were found, which include OG10, OG11, and OG12. OG13–OG17 only existed in some species. When taking into account these results, we concluded that unequal loss or expansion of most OGs happened during the evolutionary process, but a few OGs were very conservative (e.g., OG10, OG11, and OG12). Additionally, all Tajima’s D values of OGs were less than 0, which means the STP gene family was under strong purifying selection (Table 2). We also calculated Tajima’s D values for four clades using the same methods and found four Tajima’s D values were less than 0. These results indicated that the STP gene family in these tested species was under strong purifying selection. Next, conserved motifs analysis of clades and OGs showed that a total of 20 conserved motifs were found and most STP proteins had similar conserved motifs (Figure S2B), which indicates the STP domain was strictly conserved in plants. However, we noticed that gene structures of four clades differed greatly, even in one OG (Figure S2C), which implies STP genes might have been differentiated.

3.3. Expression Profiling of Rice STP Genes in 14 Tissues

Expression analysis of one gene family can provide vital clues for functional differentiation [4,32]. We, thus, analyzed expression patterns of rice 19 STP genes during the flower organ development process by qRT-PCR. In the present study, we found that rice STP genes showed diversified expression patterns and most STP genes showed relatively higher expressions in some specific tissues (Figure 4). For example, more than 50% of STP genes showed the predominant expressions in Car and SC of different ages. OsSTP27 were highly expressed in Pan10 and P20, while OsSTP28 and OsSTP14 had relatively high expression in Pan10 and Pan20, separately. In addition, OsSTP17 showed higher expressions in An than other tissues. Our result also illustrated that most STP genes showed a relatively low expression level in SO and ImSe relative to other tissues.

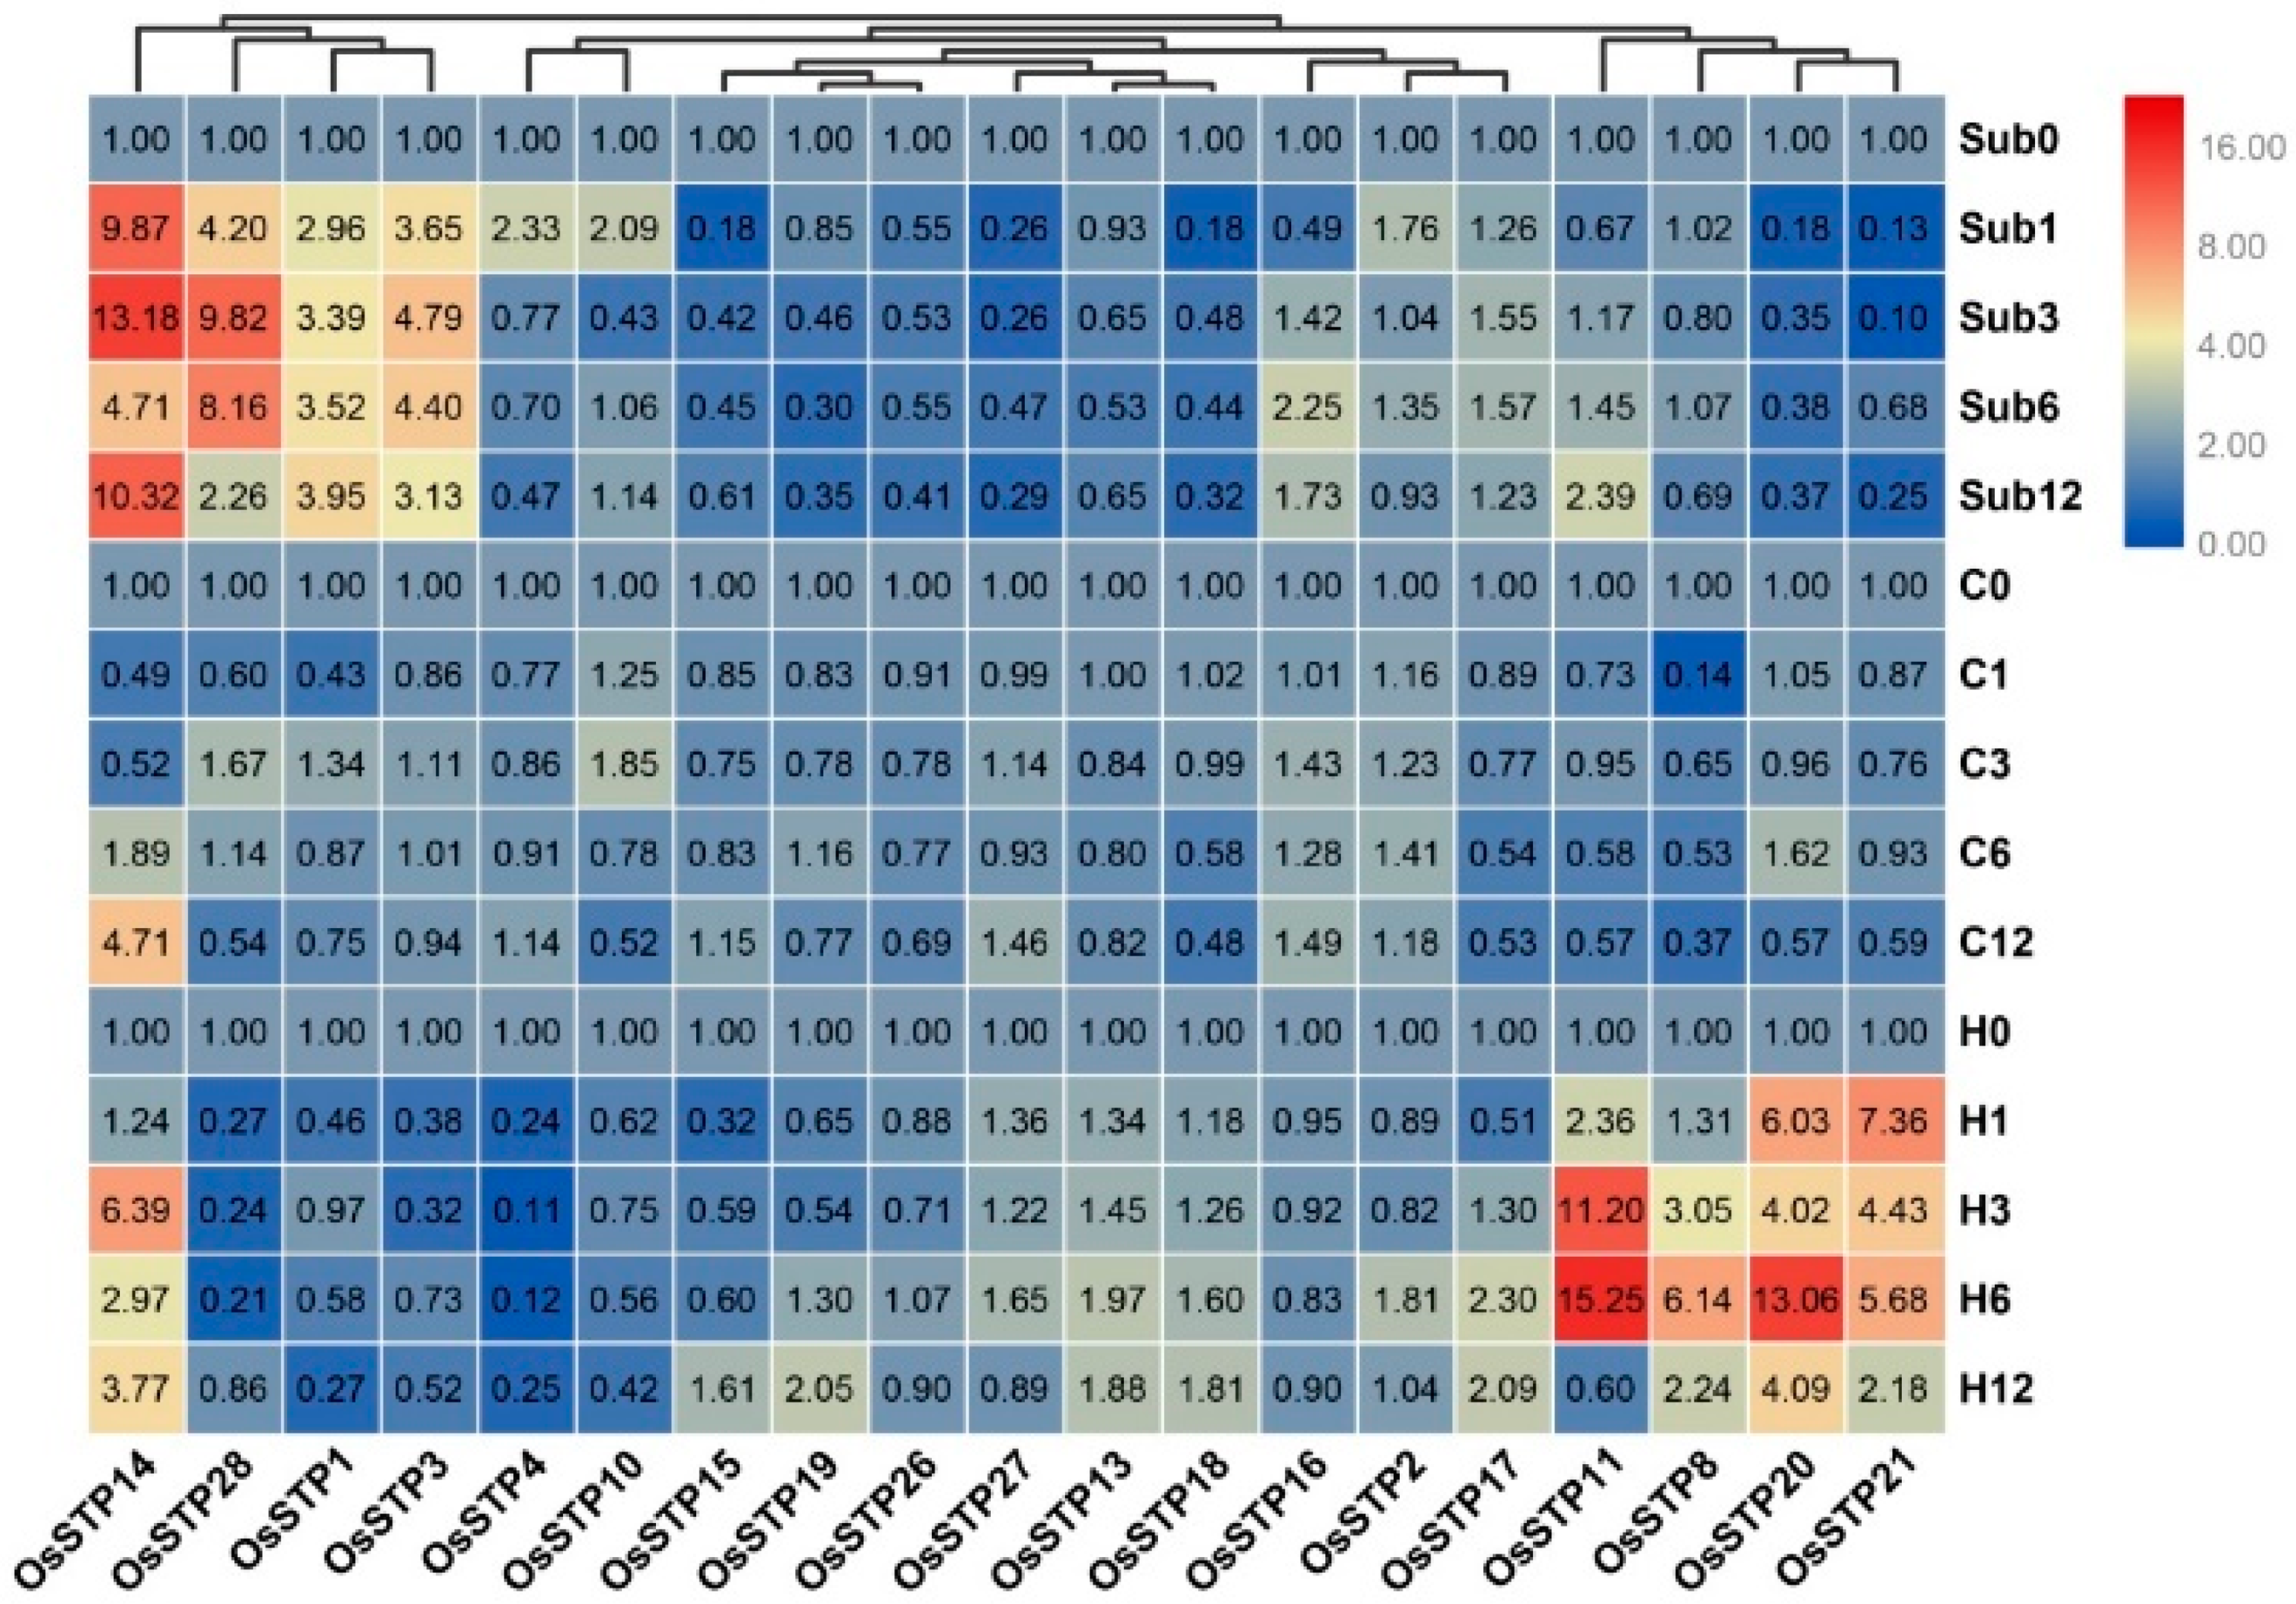
3.4. Expression Changes of STP Genes in Rice Seedling under Cold, High Temperature, and Submergence Stress

Our result demonstrated that rice STP genes respond differently to submergence, cold temperature, and high-temperature stress, which hints at functional differentiation of STP genes (Figure 5). In the present result, more genes respond to submergence and high-temperature stress than cold stress (Figure 5, Table S5). For example, OsSTP14, OsSTP28, OsSTP1, and OsSTP3 were up-regulated under submergence stress, whereas OsSTP11, OsSTP8, OsSTP20, and OsSTP21 showed clear up-regulation under high-temperature stress. It should be noted that OsSTP14 showed apparent up-regulation in all tested time points of submergence and high-temperature stress, as well as two time points of cold temperature stress.

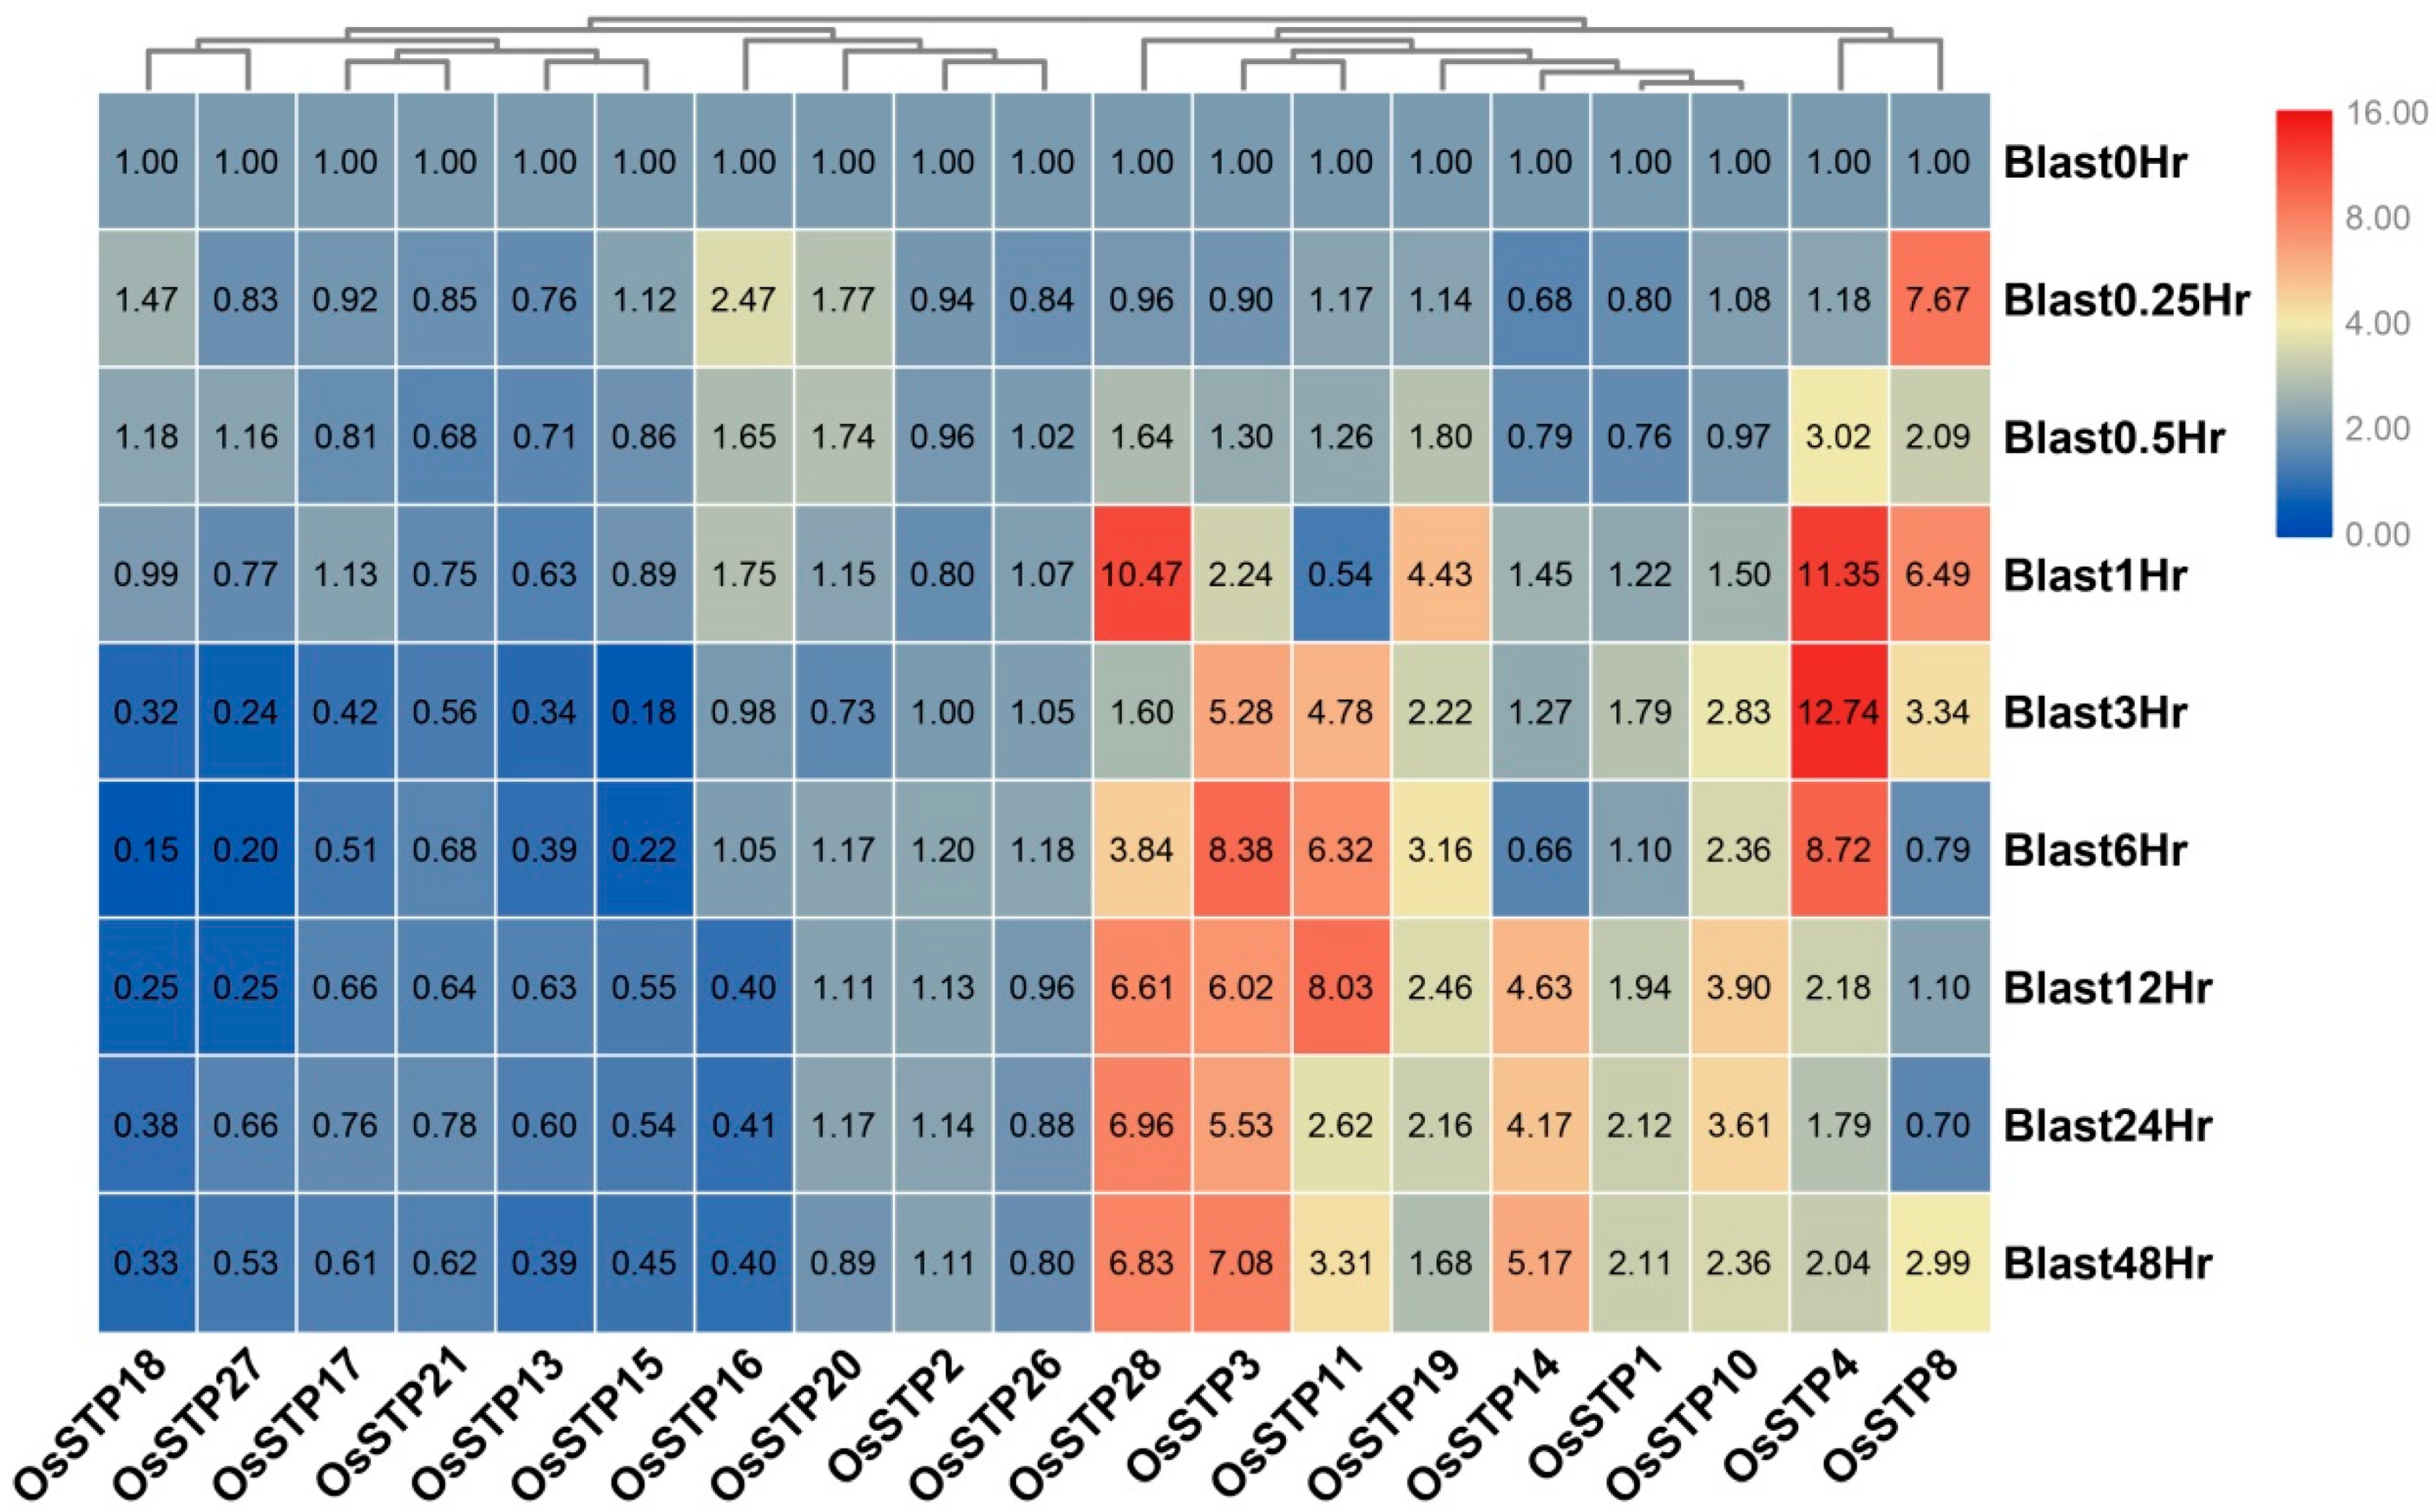
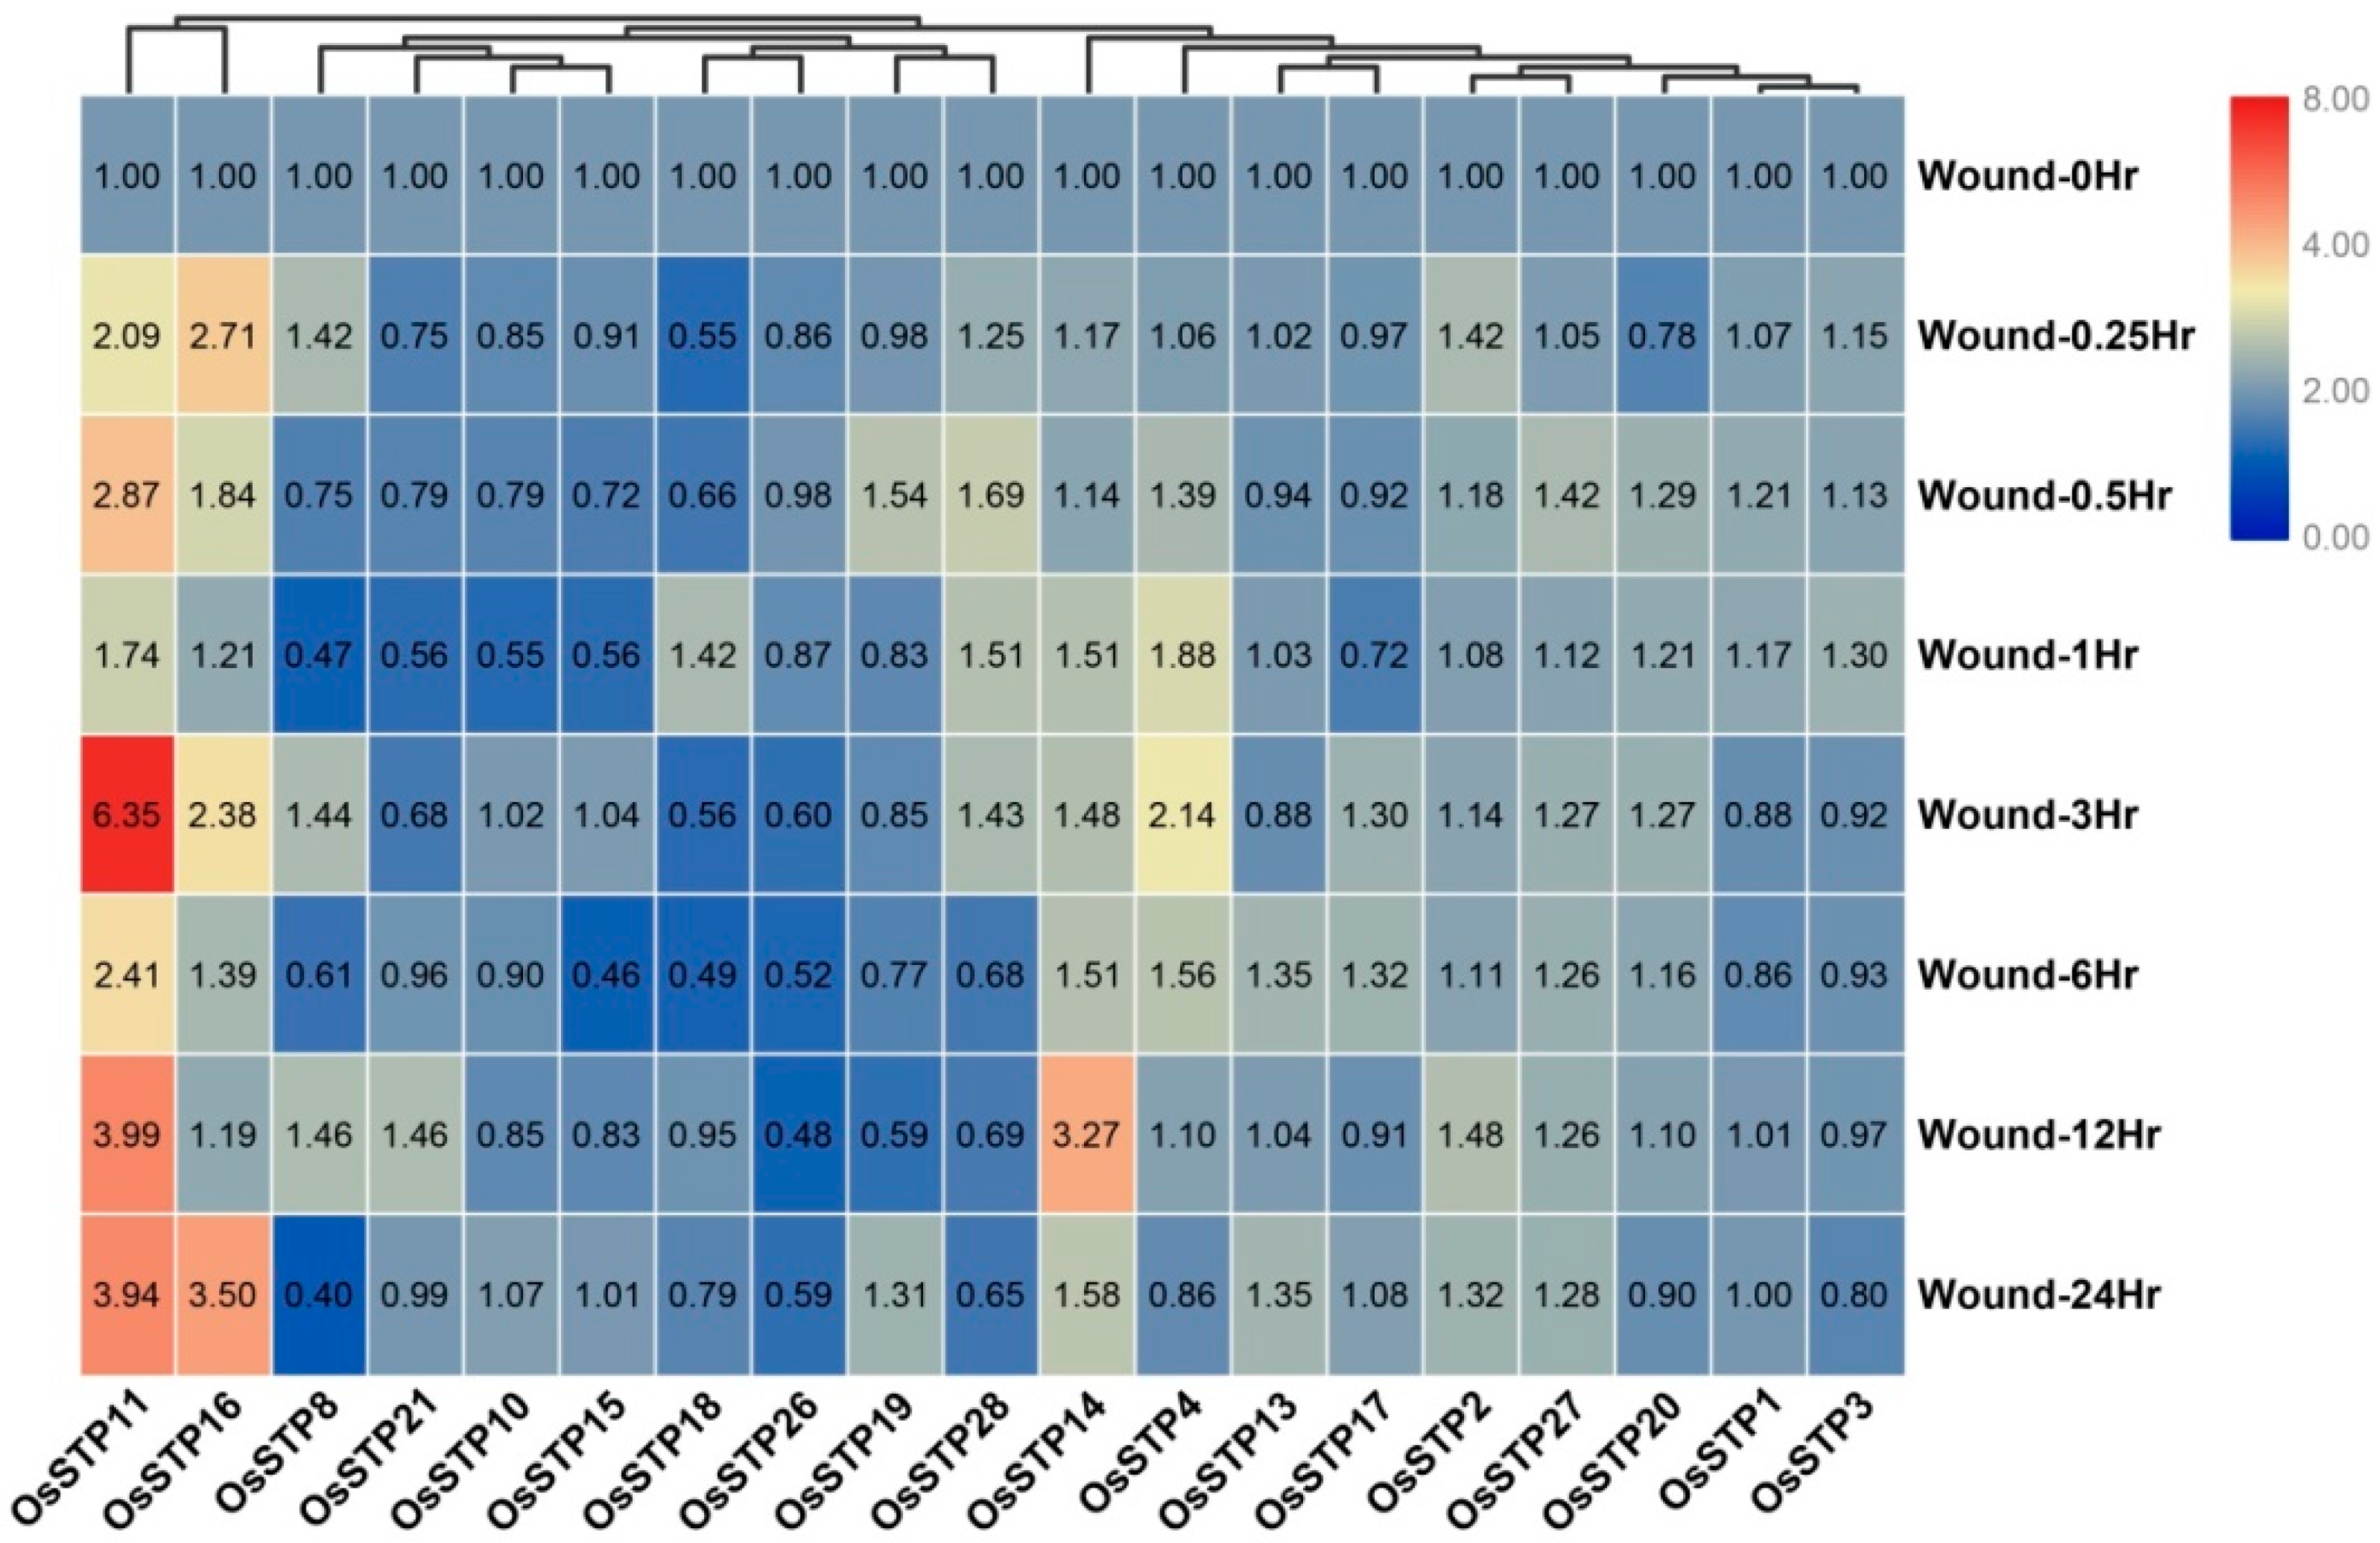
3.5. Expression Changes of STP Genes in Rice under Blast Infection and Wounding Stress

In this study, most STP genes were down-regulated after rice blast infection. However, several STP genes were up-regulated (Figure 6). For example, two STP genes (OsSTP8 and OsSTP16) showed significant up-regulation during 0–1 h, while OsSTP3, OsSTP11, OsSTP14, OsSTP19, OsSTP1, OsSTP10, OsSTP4, and OsSTP28 were up-regulated significantly at various time points during 1–48 h (Figure 6, Table S5). Based on our knowledge, the functions of rice STP genes under wounding stress were poorly documented to date. Our results showed that two STP genes (OsSTP11 and OsSTP16) had up-regulation after wounding stress, especially OsSTP11 (Figure 7, Table S5). Moreover, OsSTP28, OsSTP14, and OsSTP4 were up-regulated at various time points after wounding stress (Figure 7, Table S5).

4. Discussion

The availability of various Gramineae crops’ genomes has provided great opportunity to explore the short-term evolutionary dynamics of the STP gene family in Gramineae crops. In this study, 27, 26, 28, 26, 25, 23, and 22 STP genes were identified in Hv, Bd, Os, Or, Si, Sb, and Zm, respectively. We found no direct relevance between genome sizes and the number of STP genes. For example, there were 26 STP genes in Bd (genome size: 355 Mbp), while there were 23 STP genes in Sb (genome size: 730 Mbp) (Figure 1). Z. mays has reportedly undergone one specific WGDs more than other Gramineae plants [37]. However, we found that maize did not have more STP genes than other species. Instead, maize had the fewest STP genes in the tested species in this study (only 22). We speculated that a large number of gene losses occur after the gene duplication events. This speculation was supported by OGs results in which the lesser gene number was found in Zm than other tested species among key OGs, such as OG1 and OG2 (Table 2). Additionally, OG15, OG16, and OG17 were lost and 7 OGs containing only one member were retained, which included OG7–OG12, and OG13 (Table 2). Earlier studies reported that tandem, WGDs, segmental duplication events are the main driving forces for the expansion of one gene family [11,32,38]. Our results of identified duplication events and divergence time of duplicate gene pairs also indicated that tandem and WGDs/segmental duplication events play essential roles in the gene expansion of some Gramineae crops (expect for Hv). Notably, of these tested species, expansion mechanisms of the STP gene family were different. Furthermore, Hv had the most STP genes relative to other tested species. However, no tandem, WGDs/segmental duplication events were found. This result suggested that the expansion of the Hv STP gene family may result from other duplication types, such as proximal, dispersed, and replicative transposition.
Our clade classifications supported previous classification results that STP genes can be divided into four main clades [5,11]. We found most STP proteins had similar conserved motifs, while gene structures of four clades were greatly different, even in one OG (Figure S2), which implies the function of STP genes has been differentiated. Our gene expression profiling of STP genes also confirmed the functional differentiation of STP genes due to various expression patterns. Moreover, Ka/Ks results of all duplicate gene pairs and Tajima’s D values of all OGs or four clades both suggested that the STP gene family in Gramineae crops was under purifying selective forces. In addition, we found that a total of 17 OGs were identified. Further studies showed that OG1 contained 29 genes, while OG16 and OG17 had only four genes and two genes, respectively. These results indicated that different OGs have occurred at different degrees of expansion and loss. For example, OG1 and OG2 contained many duplication events, while OG16 and OG17 did not contain any duplication event. We hypothesized that the current difference in gene numbers for all OGs may be the result of natural or artificial selection. Beneficial genes to plants gained more copies, while redundant or pseudo-genes were lost in evolution. This speculation needs further verification in future work.
Previous studies reported orthologous with the same expression patterns, gene structure, and motifs [11,16,39]. We, thus, detected STP gene expression levels in multiple tissues and under several stresses for preliminary insights into the functional analysis of rice STP genes and orthologous in other tested species. In our expression result, STP genes have different expression patterns in diverse tissues and some STP genes with tissue-specific expressions. These results were consistent with previous findings on other species [11,13,18]. We found most STP genes showed the predominant expressions in Car and SC of different ages, which indicates STP genes play essential roles in Car and SC development. Previous studies reflected that STP genes play crucial roles in stresses and disease responses [4,11,13,26]. For example, wounding induces AtSTP3 [26]. Our result showed several STP genes with strong responses to cold, high temperature, and submergence stresses, which indicates that STP genes are associated with these stresses. We noted that OsSTP14 could be one good candidate gene for abiotic stress resistance breeding. In addition, OsSTP11 showed strong up-regulated responses to wounding, but the actual mechanism needs to be further explored in the future.

5. Conclusions

In the present study, 27, 26, 28, 26, 25, 23, and 22 STP genes were identified in H. vulgare (Hv), B. distachyon (Bd), O. sativa ssp. japonica (Os), O. rufipogon (Or), S. italica (Si), S. bicolor (Sb), and Z. mays (Zm), respectively. Then, a systemic analysis, including phylogenetic relationship, chromosomal location, gene structure, protein motifs, duplication events, orthologous groups (OGs), selective forces, and expression patterns of rice STP genes were conducted. Our result revealed different expansion mechanisms of the STP gene family among these tested species and reported differential selective pressures of different clades and OGs. The expression result from qRT-PCR suggested that STP genes play essential roles in plant development and stress responses. We believe that OsSTP14 and its orthologous may be a good candidate gene for plant resistance breeding.

Supplementary Materials

Supplementary Materials are available online at https://www.mdpi.com/2073-4409/8/6/560/s1, Table S1: Primers of rice STP genes were used for qRT-PCR in this study. Table S2: The detailed information on rice monosaccharide STP genes in seven tested species. Table S3: Orthologous groups among these seven species. Table S4: Statistical result of orthologous groups among these seven species. Table S5: Statistical analysis (Fold change, P value, Benjamini-Hochberg corrected p-value) of Figure 5, Figure 6 and Figure 7. Figure S1: A high resolution version of Figure 3. Figure S2: The phylogenetic tree (A), conserved motif compositions (B), and exon/intron structure of the STP genes in these seven species (C). A NJ phylogeny tree of STP protein sequences from H. vulgare, B. distachyon, O. sativa ssp. japonica, O. rufipogon, S. italic, S. bicolor, and Z. mays. Different colors of branches represent different clades. Different shaped markers indicated the different species. The numbers in blue boxes means different OGs. The widths of the grey bars showed the relative lengths of genes and proteins. Yellow boxes and grey lines displayed the exons and introns, respectively.

Author Contributions

W.K. performed all of the experiments, analyzed the data, prepared the figures and tables, and wrote the paper. B.A., J.Y., and Y.L. conceived and designed the experiments. Y.Z. performed parts of the bioinformatics analyses. B.A. performed qRT-PCR experiments. S.L. prepared parts of the figures and tables. All authors read and approved the final version of the manuscript.

Funding

The National Key Research and Development Program of China (2016YFD0100400), the National Special Key Project for Transgenic Breeding (Grant No. 2016ZX08001001), funded this study.

Acknowledgments

The authors thank the anonymous editors whose constructive comments were helpful in improving the quality of this work.

Conflicts of Interest

The authors declare no conflict of interest.

References

  1. Rolland, F.; Moore, B.; Sheen, J. Sugar sensing and signaling in plants. Plant Cell 2002, 14, S185–S205. [Google Scholar] [CrossRef] [PubMed]
  2. Hellmann, H.A.; Smeekens, S. Sugar sensing and signaling in plants. Front. Plant Sci. 2014, 5, 113. [Google Scholar]
  3. Yan, N. Structural advances for the major facilitator superfamily (MFS) transporters. Trends Biochem. Sci. 2013, 38, 151–159. [Google Scholar] [CrossRef] [PubMed]
  4. Deng, X.; An, B.; Zhong, H.; Yang, J.; Kong, W.; Li, Y. A novel insight into functional divergence of the MST gene family in rice based on comprehensive expression patterns. Genes 2019, 10, 239. [Google Scholar] [CrossRef] [PubMed]
  5. Zhang, W.; Wang, S.; Yu, F.; Tang, J.; Yu, L.; Wang, H.; Li, J. Genome-wide identification and expression profiling of sugar transporter protein (STP) family genes in cabbage (Brassica oleracea var. capitata L.) reveals their involvement in clubroot disease responses. Genes 2019, 10, 71. [Google Scholar] [CrossRef] [PubMed]
  6. Zhang, C.; Yuan, B.; Hou, S.; Li, X. Sugar transport played a more important role than sugar biosynthesis in fruit sugar accumulation during Chinese jujube domestication. Planta 2018, 248, 1187–1199. [Google Scholar] [CrossRef] [PubMed]
  7. Durand, M.; Mainson, D.; Porcheron, B.; Maurousset, L.; Lemoine, R.; Pourtau, N. Carbon source–sink relationship in Arabidopsis thaliana: The role of sucrose transporters. Planta 2018, 247, 587–611. [Google Scholar] [CrossRef]
  8. Chen, L.-Q.; Hou, B.-H.; Lalonde, S.; Takanaga, H.; Hartung, M.L.; Qu, X.-Q.; Guo, W.-J.; Kim, J.-G.; Underwood, W.; Chaudhuri, B. Sugar transporters for intercellular exchange and nutrition of pathogens. Nature 2010, 468, 527. [Google Scholar] [CrossRef]
  9. Doidy, J.; Grace, E.; Kühn, C.; Simon-Plas, F.; Casieri, L.; Wipf, D. Sugar transporters in plants and in their interactions with fungi. Trends Plant Sci. 2012, 17, 413–422. [Google Scholar] [CrossRef]
  10. Ludewig, F.; Flügge, U.-I. Role of metabolite transporters in source-sink carbon allocation. Front. Plant Sci. 2013, 4, 231. [Google Scholar] [CrossRef] [Green Version]
  11. Liu, Q.; Dang, H.; Chen, Z.; Wu, J.; Chen, Y.; Chen, S.; Luo, L. Genome-wide identification, expression, and functional analysis of the sugar transporter gene family in Cassava (Manihot esculenta). Int. J. Mol. Sci. 2018, 19, 987. [Google Scholar] [CrossRef] [PubMed]
  12. Alexander, S.; Joachim, S.S.; Norbert, S.; Michael, B. AtSTP11, a pollen tube-specific monosaccharide transporter in Arabidopsis. Planta 2005, 221, 48–55. [Google Scholar]
  13. Büttner, M. The Arabidopsis sugar transporter (AtSTP) family: An update. Plant Biol. 2010, 12, 35–41. [Google Scholar] [CrossRef] [PubMed]
  14. Toyofuku, K.; Kasahara, M.; Yamaguchi, J. Characterization and expression of monosaccharide transporters (OsMSTs) in rice. Plant Cell Physiol. 2000, 41, 940–947. [Google Scholar] [CrossRef] [PubMed]
  15. Afoufa-Bastien, D.; Medici, A.; Jeauffre, J.; Coutos-Thévenot, P.; Lemoine, R.; Atanassova, R.; Laloi, M. The Vitis vinifera sugar transporter gene family: Phylogenetic overview and macroarray expression profiling. BMC Plant Biol. 2010, 10, 245. [Google Scholar] [CrossRef] [PubMed]
  16. Reuscher, S.; Akiyama, M.; Yasuda, T.; Makino, H.; Aoki, K.; Shibata, D.; Shiratake, K. The sugar transporter inventory of tomato: Genome-wide identification and expression analysis. Plant Cell Physiol. 2014, 55, 1123–1141. [Google Scholar] [CrossRef] [PubMed]
  17. Büttner, M. The monosaccharide transporter (-like) gene family in Arabidopsis. FEBS Lett. 2007, 581, 2318–2324. [Google Scholar] [CrossRef] [PubMed]
  18. Julius, B.T.; Leach, K.A.; Tran, T.M.; Mertz, R.A.; Braun, D.M. Sugar transporters in plants: New insights and discoveries. Plant Cell Physiol. 2017, 58, 1442–1460. [Google Scholar] [CrossRef] [PubMed]
  19. Cho, J.I.; Burla, B.; Lee, D.W.; Ryoo, N.; Hong, S.K.; Kim, H.B.; Eom, J.S.; Choi, S.B.; Cho, M.H.; Bhoo, S.H. Expression analysis and functional characterization of the monosaccharide transporters, OsTMTs, involving vacuolar sugar transport in rice (Oryza sativa). New Phytologist 2010, 186, 657–668. [Google Scholar] [CrossRef] [PubMed]
  20. Wang, Y.; Xu, H.; Wei, X.; Chai, C.; Xiao, Y.; Zhang, Y.; Chen, B.; Xiao, G.; Ouwerkerk, P.B.; Wang, M. Molecular cloning and expression analysis of a monosaccharide transporter gene OsMST4 from rice (Oryza sativa L.). Plant Mol. Biol. 2007, 65, 439–451. [Google Scholar] [CrossRef] [PubMed]
  21. Wang, Y.; Xiao, Y.; Zhang, Y.; Chai, C.; Wei, G.; Wei, X.; Xu, H.; Wang, M.; Ouwerkerk, P.B.; Zhu, Z. Molecular cloning, functional characterization and expression analysis of a novel monosaccharide transporter gene OsMST6 from rice (Oryza sativa L.). Planta 2008, 228, 525. [Google Scholar] [CrossRef] [PubMed]
  22. Schneider, S.; Beyhl, D.; Hedrich, R.; Sauer, N. Functional and physiological characterization of Arabidopsis INOSITOL TRANSPORTER1, a novel tonoplast-localized transporter for myo-inositol. Plant Cell 2008, 20, 1073–1087. [Google Scholar] [CrossRef] [PubMed]
  23. Poschet, G.; Hannich, B.; Büttner, M. Identification and characterization of AtSTP14, a novel galactose transporter from Arabidopsis. Plant Cell Physiol. 2010, 51, 1571–1580. [Google Scholar] [CrossRef] [PubMed]
  24. Sherson, S.M.; Hemmann, G.; Wallace, G.; Forbes, S.; Germain, V.; Stadler, R.; Bechtold, N.; Sauer, N.; Smith, S.M. Monosaccharide/proton symporter AtSTP1 plays a major role in uptake and response of Arabidopsis seeds and seedlings to sugars. Plant J. 2000, 24, 849–857. [Google Scholar] [CrossRef]
  25. Truernit, E.; Schmid, J.; Epple, P.; Illig, J.; Sauer, N. The sink-specific and stress-regulated Arabidopsis STP4 gene: Enhanced expression of a gene encoding a monosaccharide transporter by wounding, elicitors, and pathogen challenge. Plant Cell 1996, 8, 2169–2182. [Google Scholar] [CrossRef] [PubMed]
  26. Büttner, M.; Truernit, E.; Baier, K.; Scholz-Starke, J.; Sontheim, M.; Lauterbach, C.; Huss, V.; Sauer, N. AtSTP3, a green leaf-specific, low affinity monosaccharide-H+ symporter of Arabidopsis thaliana. Plant Cell Environ. 2000, 23, 175–184. [Google Scholar] [CrossRef]
  27. Yamada, K.; Saijo, Y.; Nakagami, H.; Takano, Y. Regulation of sugar transporter activity for antibacterial defense in Arabidopsis. Science 2016, 354, 1427–1430. [Google Scholar] [CrossRef]
  28. Mendgen, K.; Hahn, M. Plant infection and the establishment of fungal biotrophy. Trends Plant Sci. 2002, 7, 352–356. [Google Scholar] [CrossRef] [Green Version]
  29. Tetlow, I.; Emes, M. Starch biosynthesis in the developing endosperms of grasses and cereals. Agronomy 2017, 7, 81. [Google Scholar] [CrossRef]
  30. Watanabe, N.; Nakazono, M.; Kanno, A.; Tsutsumi, N.; Hirai, A. Evolutionary variations in DNA sequences transferred from chloroplast genomes to mitochondrial genomes in the Gramineae. Curr. Genetics 1994, 26, 512. [Google Scholar] [CrossRef]
  31. An, B.; Lan, J.; Deng, X.; Chen, S.; Ouyang, C.; Shi, H.; Yang, J.; Li, Y. Silencing of D-lactate dehydrogenase impedes glyoxalase system and leads to methylglyoxal accumulation and growth inhibition in rice. Front. Plant Sci. 2017, 8, 2071. [Google Scholar] [CrossRef] [PubMed]
  32. Kong, W.; Zhong, H.; Deng, X.; Gautam, M.; Gong, Z.; Zhang, Y.; Zhao, G.; Liu, C.; Li, Y. Evolutionary analysis of GH3 genes in six Oryza species/subspecies and their expression under salinity stress in Oryza sativa ssp. japonica. Plants 2019, 8, 30. [Google Scholar] [CrossRef] [PubMed]
  33. Librado, P.; Rozas, J. DnaSP v5: A software for comprehensive analysis of DNA polymorphism data. Bioinformatics 2009, 25, 1451–1452. [Google Scholar] [CrossRef]
  34. Emms, D.M.; Kelly, S. OrthoFinder: Solving fundamental biases in whole genome comparisons dramatically improves orthogroup inference accuracy. Genome Biol. 2015, 16, 157. [Google Scholar] [CrossRef] [PubMed]
  35. Chen, C.; Xia, R.; Chen, H.; He, Y. TBtools, a toolkit for biologists integrating various biological data handling tools with a user-friendly interface. BioRxiv 2018, 289660. [Google Scholar]
  36. Londo, J.P.; Chiang, Y.C.; Hung, K.H.; Chiang, T.Y.; Schaal, B.A. Phylogeography of Asian wild rice, Oryza rufipogon, reveals multiple independent domestications of cultivated rice, Oryza sativa. Proc. Nat. Acad. Sci. USA 2006, 103, 9578–9583. [Google Scholar] [CrossRef]
  37. Swigoňová, Z.; Lai, J.; Ma, J.; Ramakrishna, W.; Llaca, V.; Bennetzen, J.L.; Messing, J. Close split of sorghum and maize genome progenitors. Genome Res. 2004, 14, 1916–1923. [Google Scholar] [CrossRef] [PubMed]
  38. Coghlan, A.; Eichler, E.E.; Oliver, S.G.; Paterson, A.H.; Stein, L. Chromosome evolution in eukaryotes: A multi-kingdom perspective. Trends Genetics 2005, 21, 673–682. [Google Scholar] [CrossRef]
  39. Kong, W.; Bendahmane, M.; Fu, X. Genome-wide identification and characterization of aquaporins and their role in the flower opening processes in carnation (Dianthus caryophyllus). Molecules 2018, 23, 1895. [Google Scholar] [CrossRef]
Figure 1. An NJ phylogeny tree of STP protein sequences from H. vulgare, B. distachyon, O. sativa ssp. japonica, O. rufipogon, S. italica, S. bicolor, and Z. mays. Different colors of branches represent different clades. The numbers in outside circles represent different orthologous groups (OGs), such 1 means OG1. The different species are displayed by different shaped markers. Proteins * mean unassigned STP proteins.
Cells 08 00560 g001
Figure 2. The STP gene numbers and Tajima’s values of four clades among seven species, including H. vulgare, B. distachyon, O. sativa ssp. japonica, O. rufipogon, S. italica, S. bicolor, and Z. mays.
Cells 08 00560 g002
Figure 3. The chromosome locations and duplication events of STP genes in seven species, including H. vulgare (A), B. distachyon (B), O. sativa ssp. japonica (C), O. rufipogon (D), S. italica (E), S. bicolor (F), and Z. mays (G). The blue lines represent tandem duplication and red lines mean whole genome duplication (WGD)/segmental duplication events. A high-resolution version of Figure 3 is provided in Figure S1.
Cells 08 00560 g003
Figure 4. Expression profiles of the rice STP genes in 14 different tissues by qRT-PCR. Pan10/20 (panicles harvested before heading at lengths of 10/20 cm), SC1/2 (seed coat, 3/15 days after flowering), An (anther, 1 to 3 days before flowering), SO (stigma and ovary, 1 to 3 days before flowering), ImSe (immature endosperm, 15 days after flowering), and Car1/3/5/7/10/15/20 (caryopses, 1/3/5/7/10/15/20 days after flowering) [31]. The color scale represents relative expression levels from the 2−ΔΔCT method: red indicates a high level and green represents a low level of transcript abundance.
Cells 08 00560 g004
Figure 5. Expression changes of the rice seedling under cold stress, high-temperature stress, and submergence stress by qRT-PCR. Sub0, Sub1, Sub3, Sub6, and Sub12 represent 0 h, 1 h, 3 h, 6 h, and 12 h after the submergence stress. C0, C1, C3, C6, and C12 mean 0 h, 1 h, 3 h, 6 h, and 12 h after cold stress (4 °C). H0, H3, H6, and H12 represent 0 h, 1 h, 3 h, 6 h, and 12 h after high-temperature stress (40 °C). The color scale represents fold changes (2−ΔΔCT method): the red color indicates high up-regulation and the green color represents low up-regulation.
Cells 08 00560 g005
Figure 6. Expression changes of rice STP genes after blast infection. Blast mean rice blast infection and Hr represent hour after infection. The color scale represents fold changes (2−ΔΔCT method): the red color indicates high up-regulation and the green color represents low up-regulation.
Cells 08 00560 g006
Figure 7. Expression changes of the rice seedling after wounding. Wound-0Hr, Wound-0.25Hr, Wound-0.5Hr, Wound-1Hr, Wound-3Hr, Wound-6Hr, Wound-12Hr, and Wound-24Hr mean 0, 0.25, 0.5, 1, 3, 6, 12, and 24 h after wounding. The color scale represents fold changes and is the same as Figure 6.
Cells 08 00560 g007
Table 1. Ka/Ks values and the divergence time of duplicate gene pairs in seven tested species.
Seq_1Seq_2Ka/KsDuplication TypeDate (MY)Purifying Selection
BdSTP21BdSTP220.4413Tandem duplication25.29YES
BdSTP7BdSTP120.1415WGD or segmental duplication60.90YES
BdSTP13BdSTP210.6124WGD or segmental duplication30.94YES
OrSTP1OrSTP20.5062Tandem duplication6.58YES
OrSTP8OrSTP90.6519Tandem duplication28.34YES
OrSTP9OrSTP100.6026Tandem duplication20.73YES
OrSTP10OrSTP110.7493Tandem duplication25.73YES
OrSTP4OrSTP100.6994WGD or segmental duplication31.39YES
OsSTP8OsSTP70.5424Tandem duplication6.24YES
OsSTP11OsSTP120.3240Tandem duplication5.57YES
OsSTP14OsSTP10.5108Tandem duplication21.25YES
OsSTP1OsSTP150.7193Tandem duplication23.42YES
OsSTP10OsSTP180.5693WGD or segmental duplication31.75YES
SbSTP17SbSTP180.4488Tandem duplication23.42YES
SbSTP18SbSTP190.7516Tandem duplication25.57YES
SbSTP11SbSTP160.6396WGD or segmental duplication30.31YES
SiSTP22SiSTP230.2625Tandem duplication26.71YES
SiSTP16SiSTP170.5320Tandem duplication20.80YES
SiSTP17SiSTP180.4016Tandem duplication23.18YES
SiSTP18SiSTP190.6358Tandem duplication28.01YES
SiSTP2SiSTP30.4998Tandem duplication20.83YES
SiSTP3SiSTP40.3743Tandem duplication15.09YES
SiSTP2SiSTP150.6225WGD or segmental duplication30.39YES
SiSTP4SiSTP180.5679WGD or segmental duplication33.62YES
SiSTP22SiSTP250.1653WGD or segmental duplication50.11YES
ZmSTP20ZmSTP210.5103Tandem duplication35.43YES
ZmSTP20ZmSTP130.5835WGD or segmental duplication34.12YES
ZmSTP5ZmSTP130.5345WGD or segmental duplication35.53YES
ZmSTP11ZmSTP130.3853WGD or segmental duplication29.68YES
Note: WGD mean whole genome duplication. MY mean million years ago.
Table 2. Numbers and Tajima’s D values of all orthologous groups (OGs) among seven tested species.
BdHvOrOsSbSiZmTotalTajima’s D
OG1644444329−0.6892
OG2243321217−0.49247
OG3212244217−0.57229
OG4222223215−0.56846
OG5211313213−0.75888
OG6112211210−0.20414
OG7221211110−0.17804
OG822111119−1.00743
OG912111219−0.72613
OG1011111117−0.15393
OG1111111117−0.23779
OG1211111117−0.44667
OG1311100126−0.72003
OG1411111016−0.14611
OG1511111106−0.23085
OG1600121004−0.84257
OG1700110002
Note: Different colors in table represent numbers from lower (green color) to higher (red color). Red OG means single-copy OG among these seven species.

