Pre-Treatment Biomarkers of Anti-Tumour Necrosis Factor Therapy Response in Crohn’s Disease—A Systematic Review and Gene Ontology Analysis


Abstract
1. Introduction
2. Materials and Methods
2.1. Information Sources and Search, Study Selection
2.2. Data Collection and Integration
2.3. Interactome Builds and Gene Ontology (GO) Analysis
3. Results
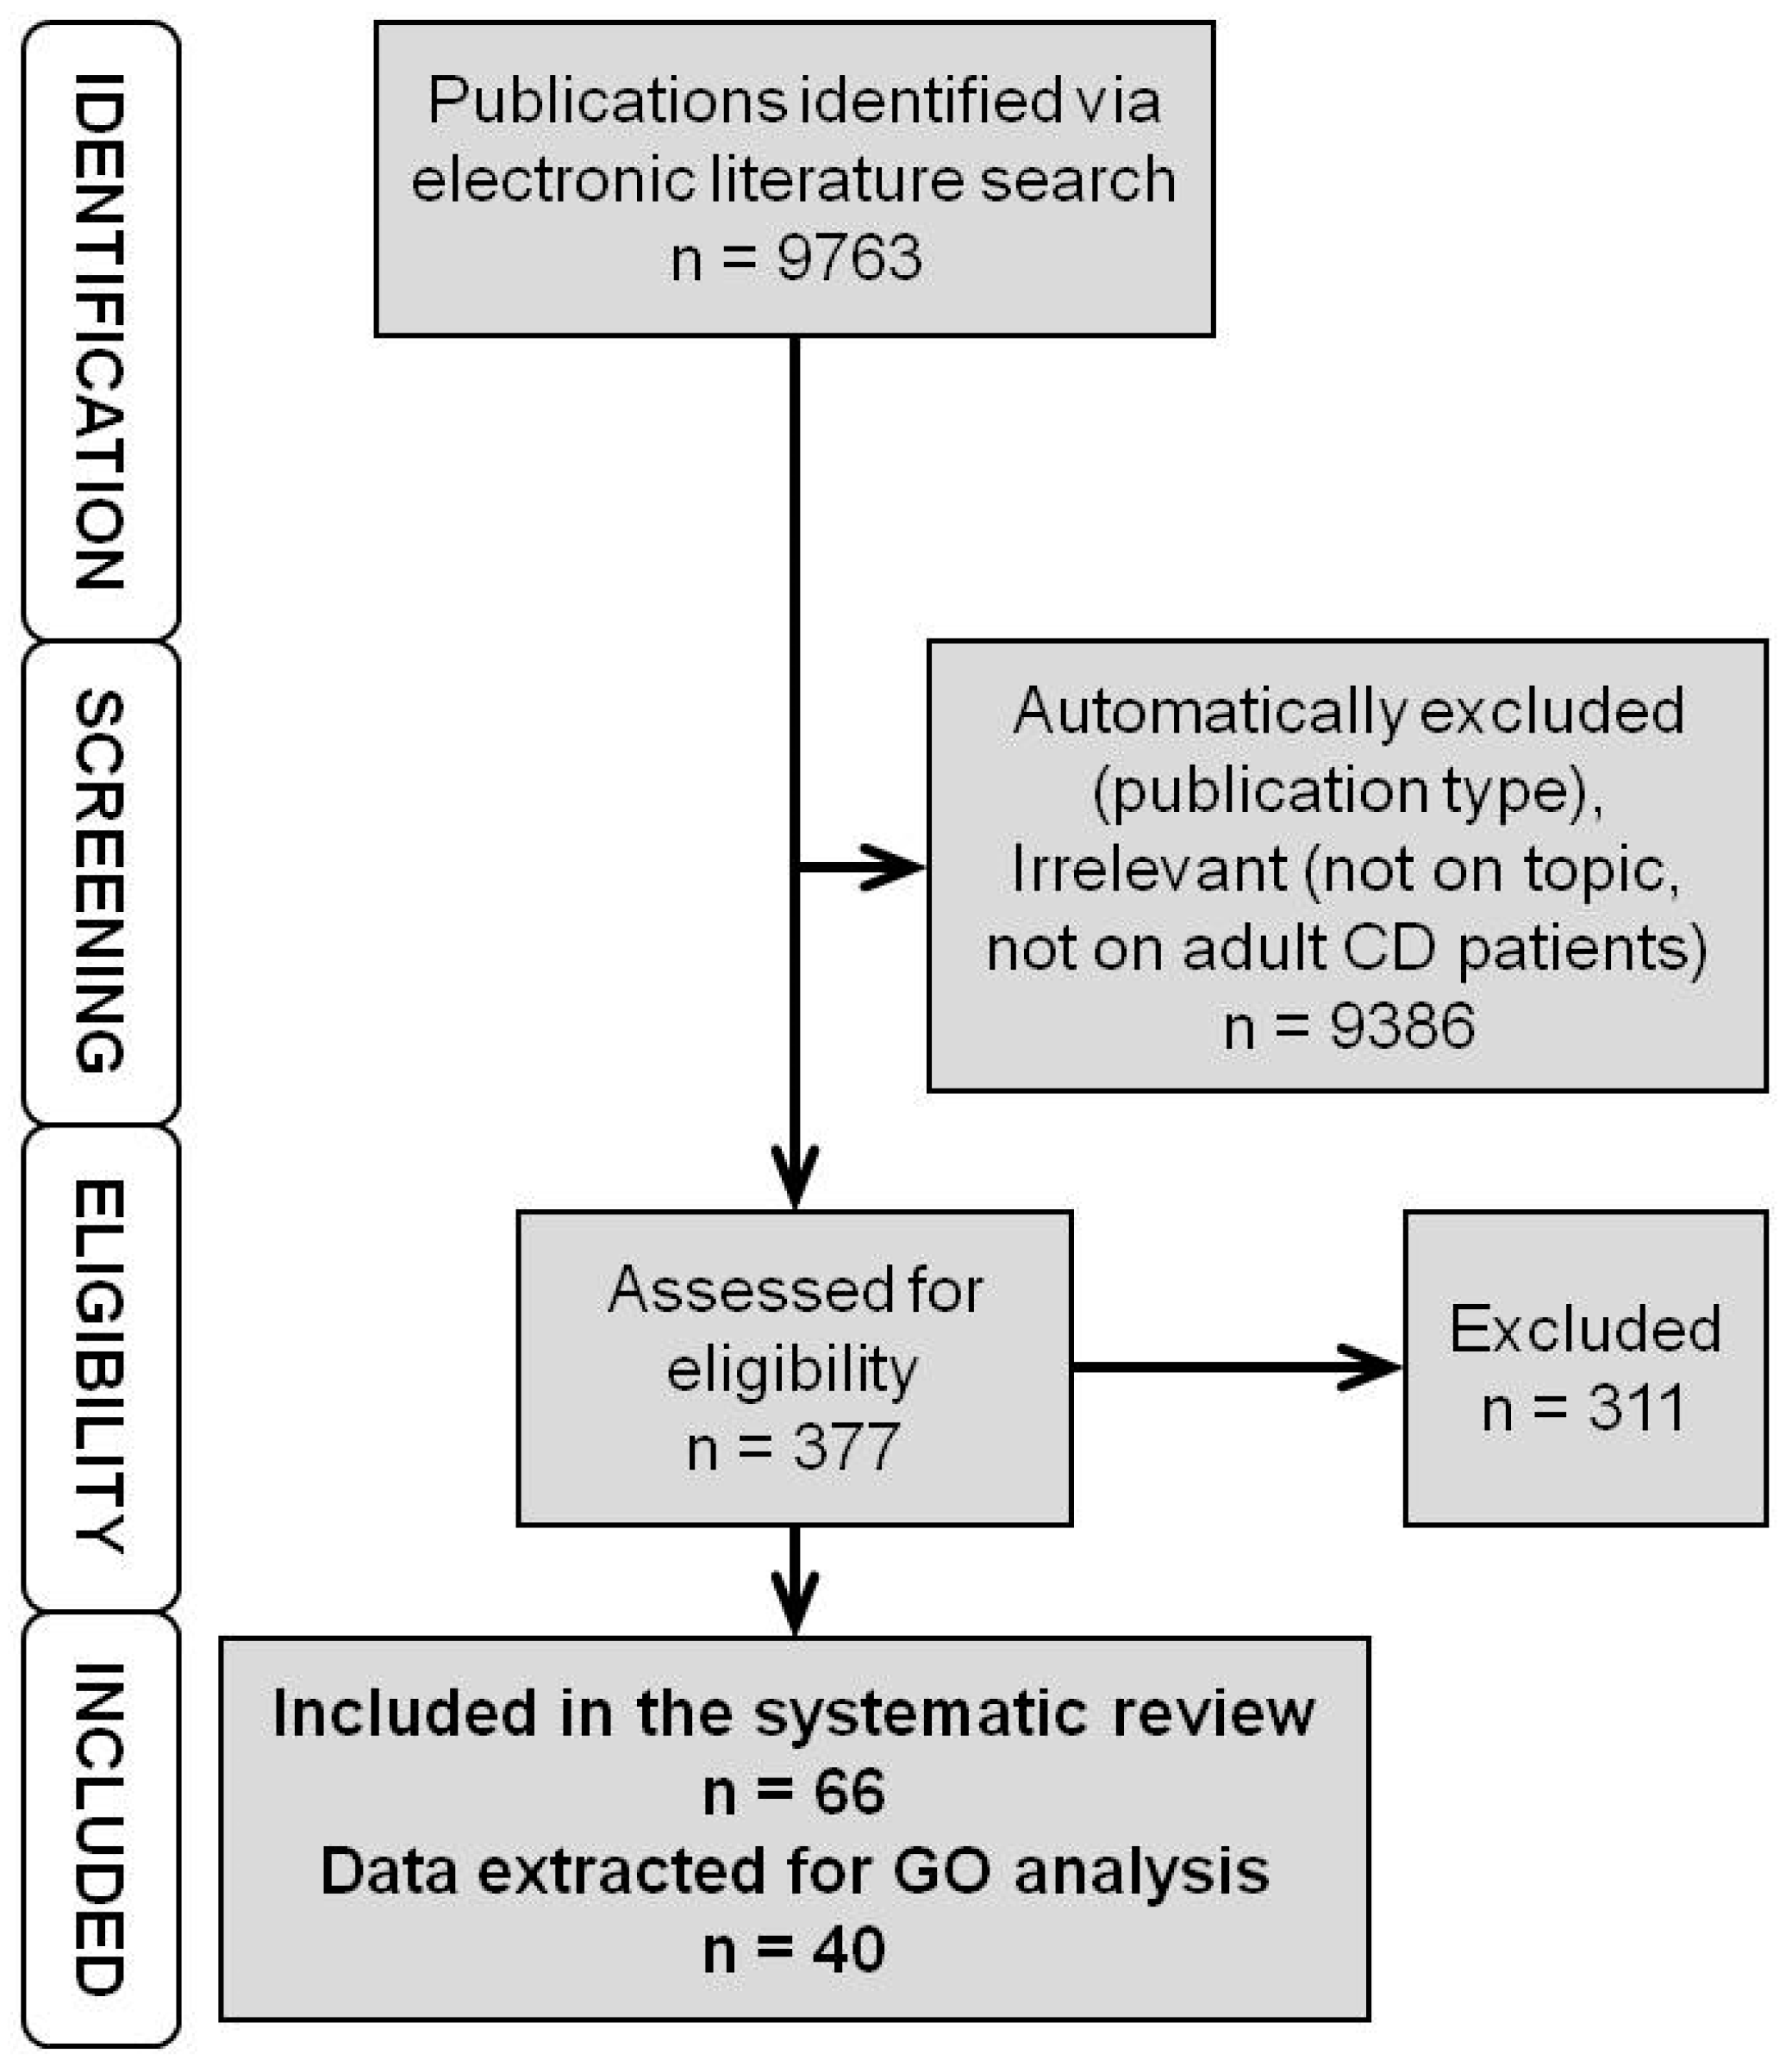
3.1. Literature Search
3.2. Genomic Markers
3.3. Expression Markers—RNA Level
3.4. Expression Markers—Protein Level
3.5. Integrated Data on Genomic and Expression Markers
3.6. Interactomes and Gene Ontology of Anti-TNF Therapy Response Markers
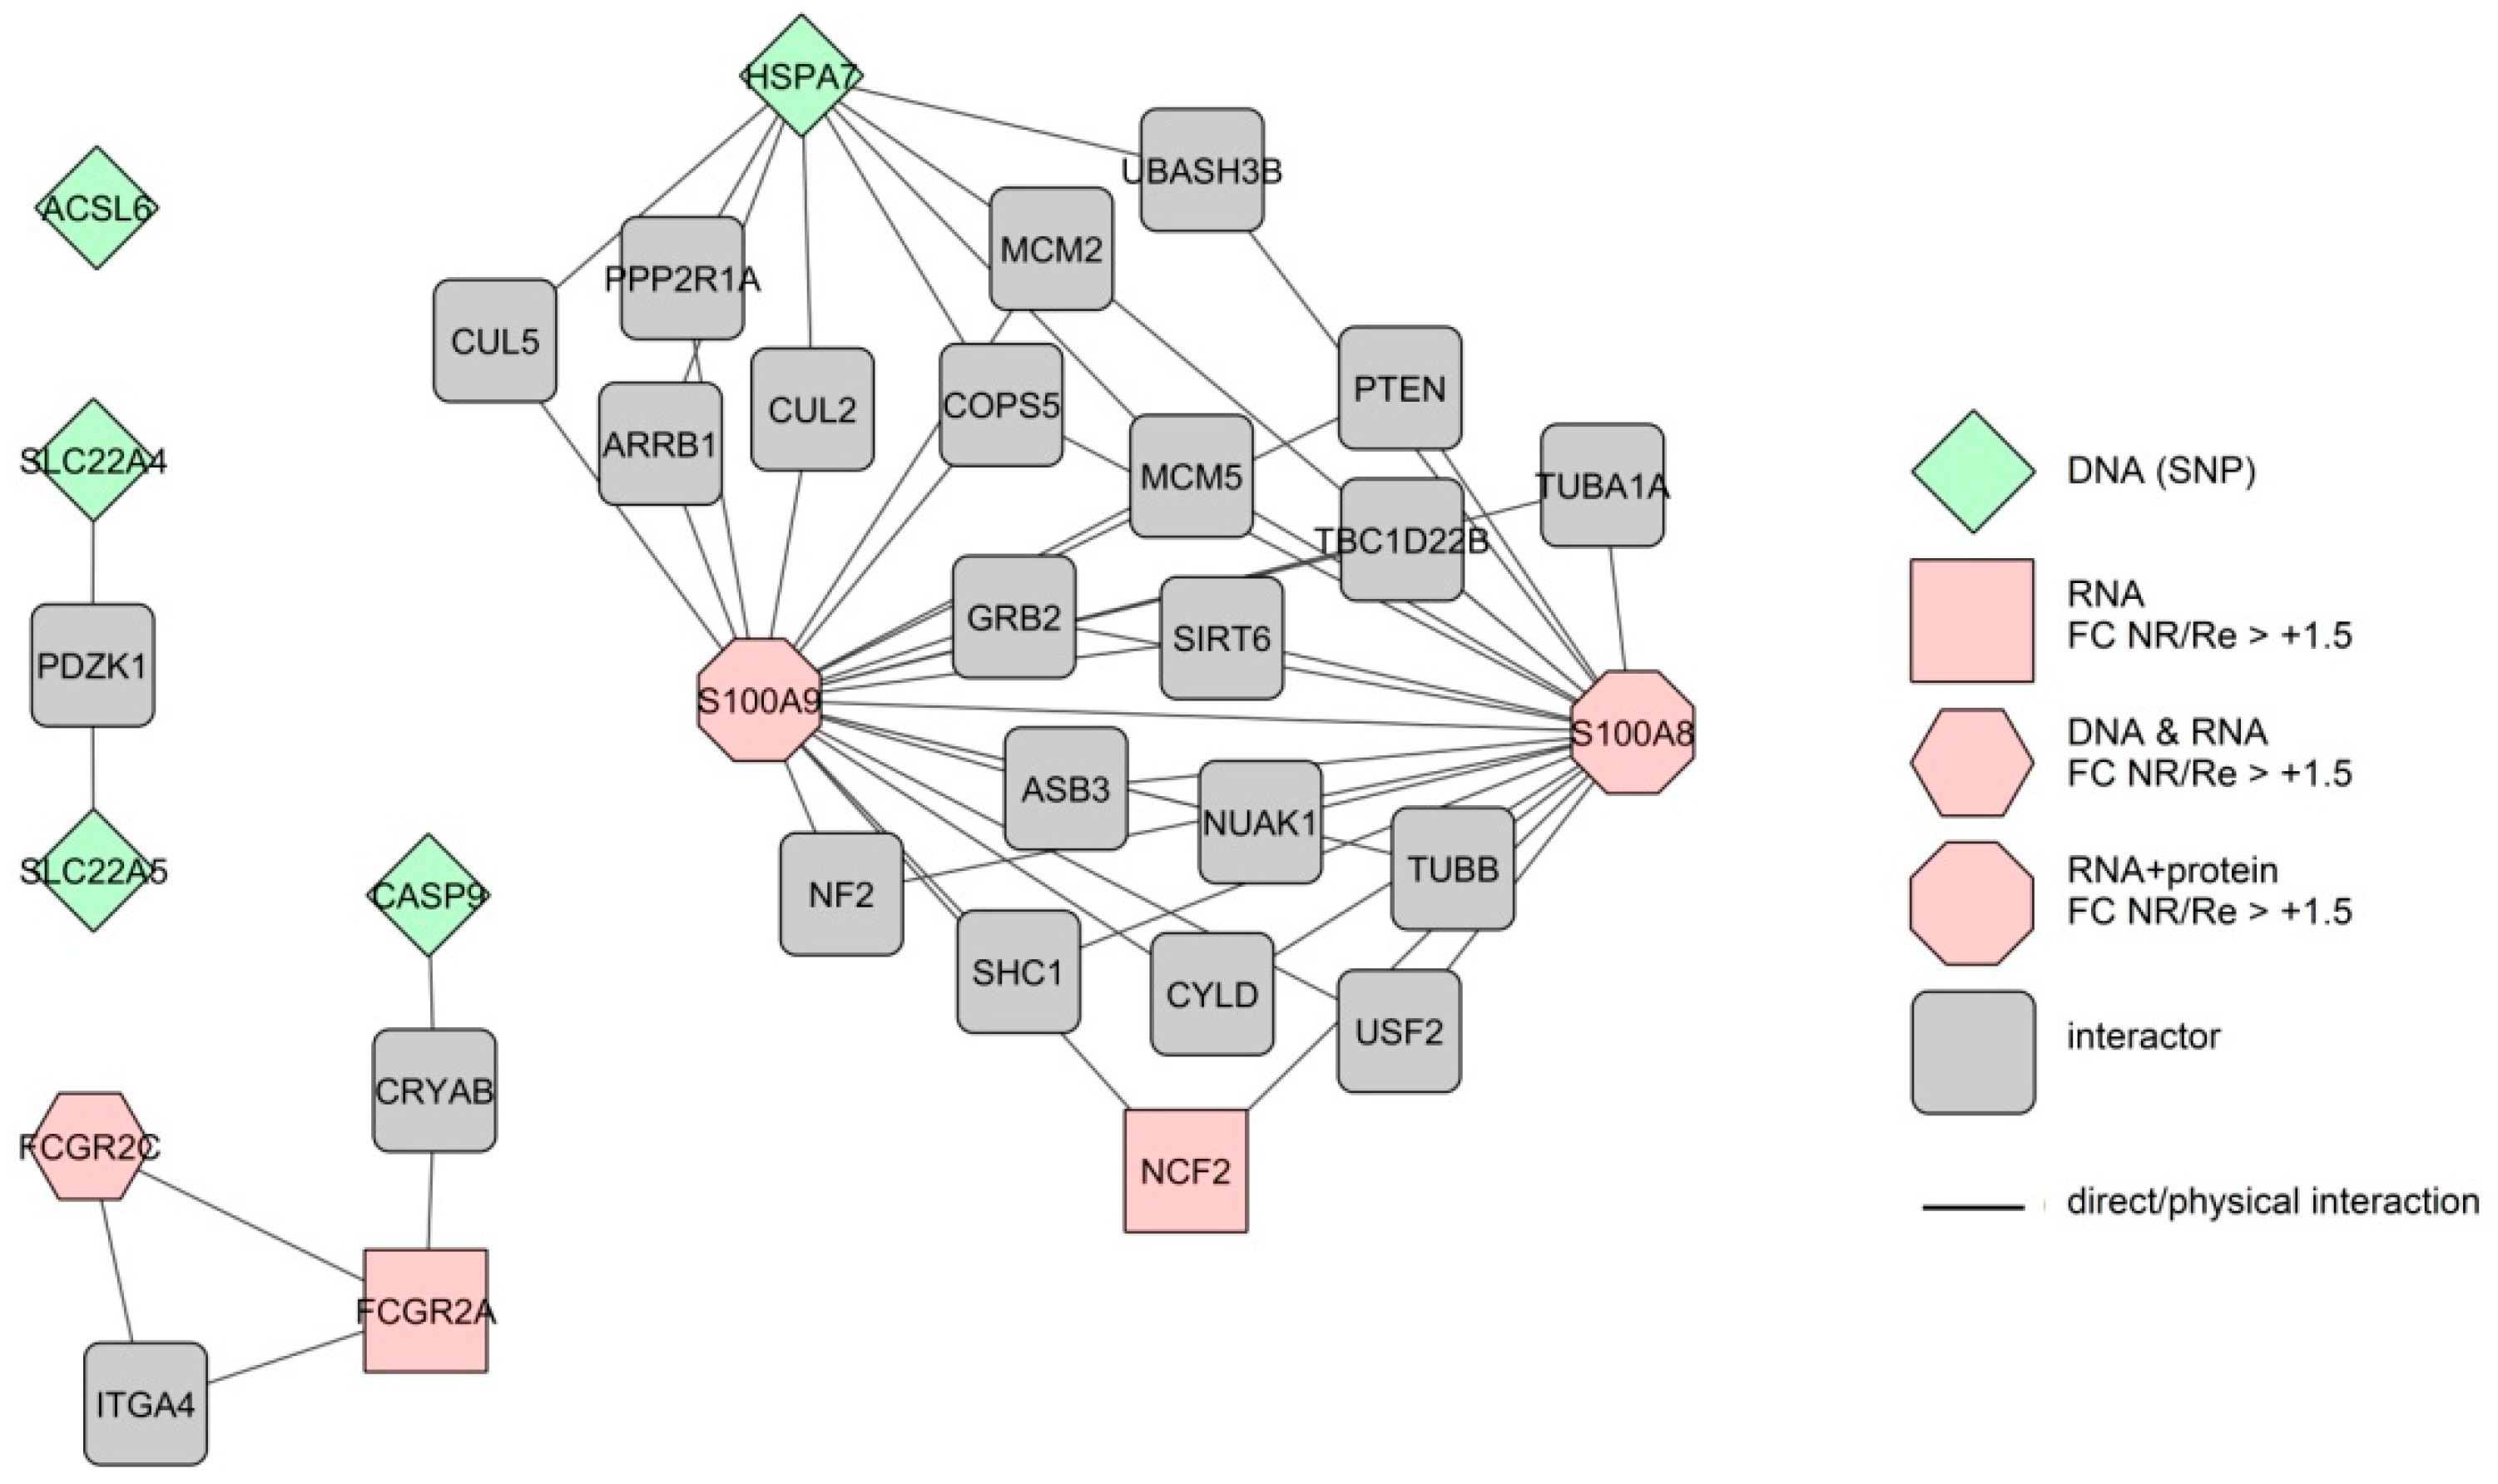
3.6.1. Response Markers of the Colon
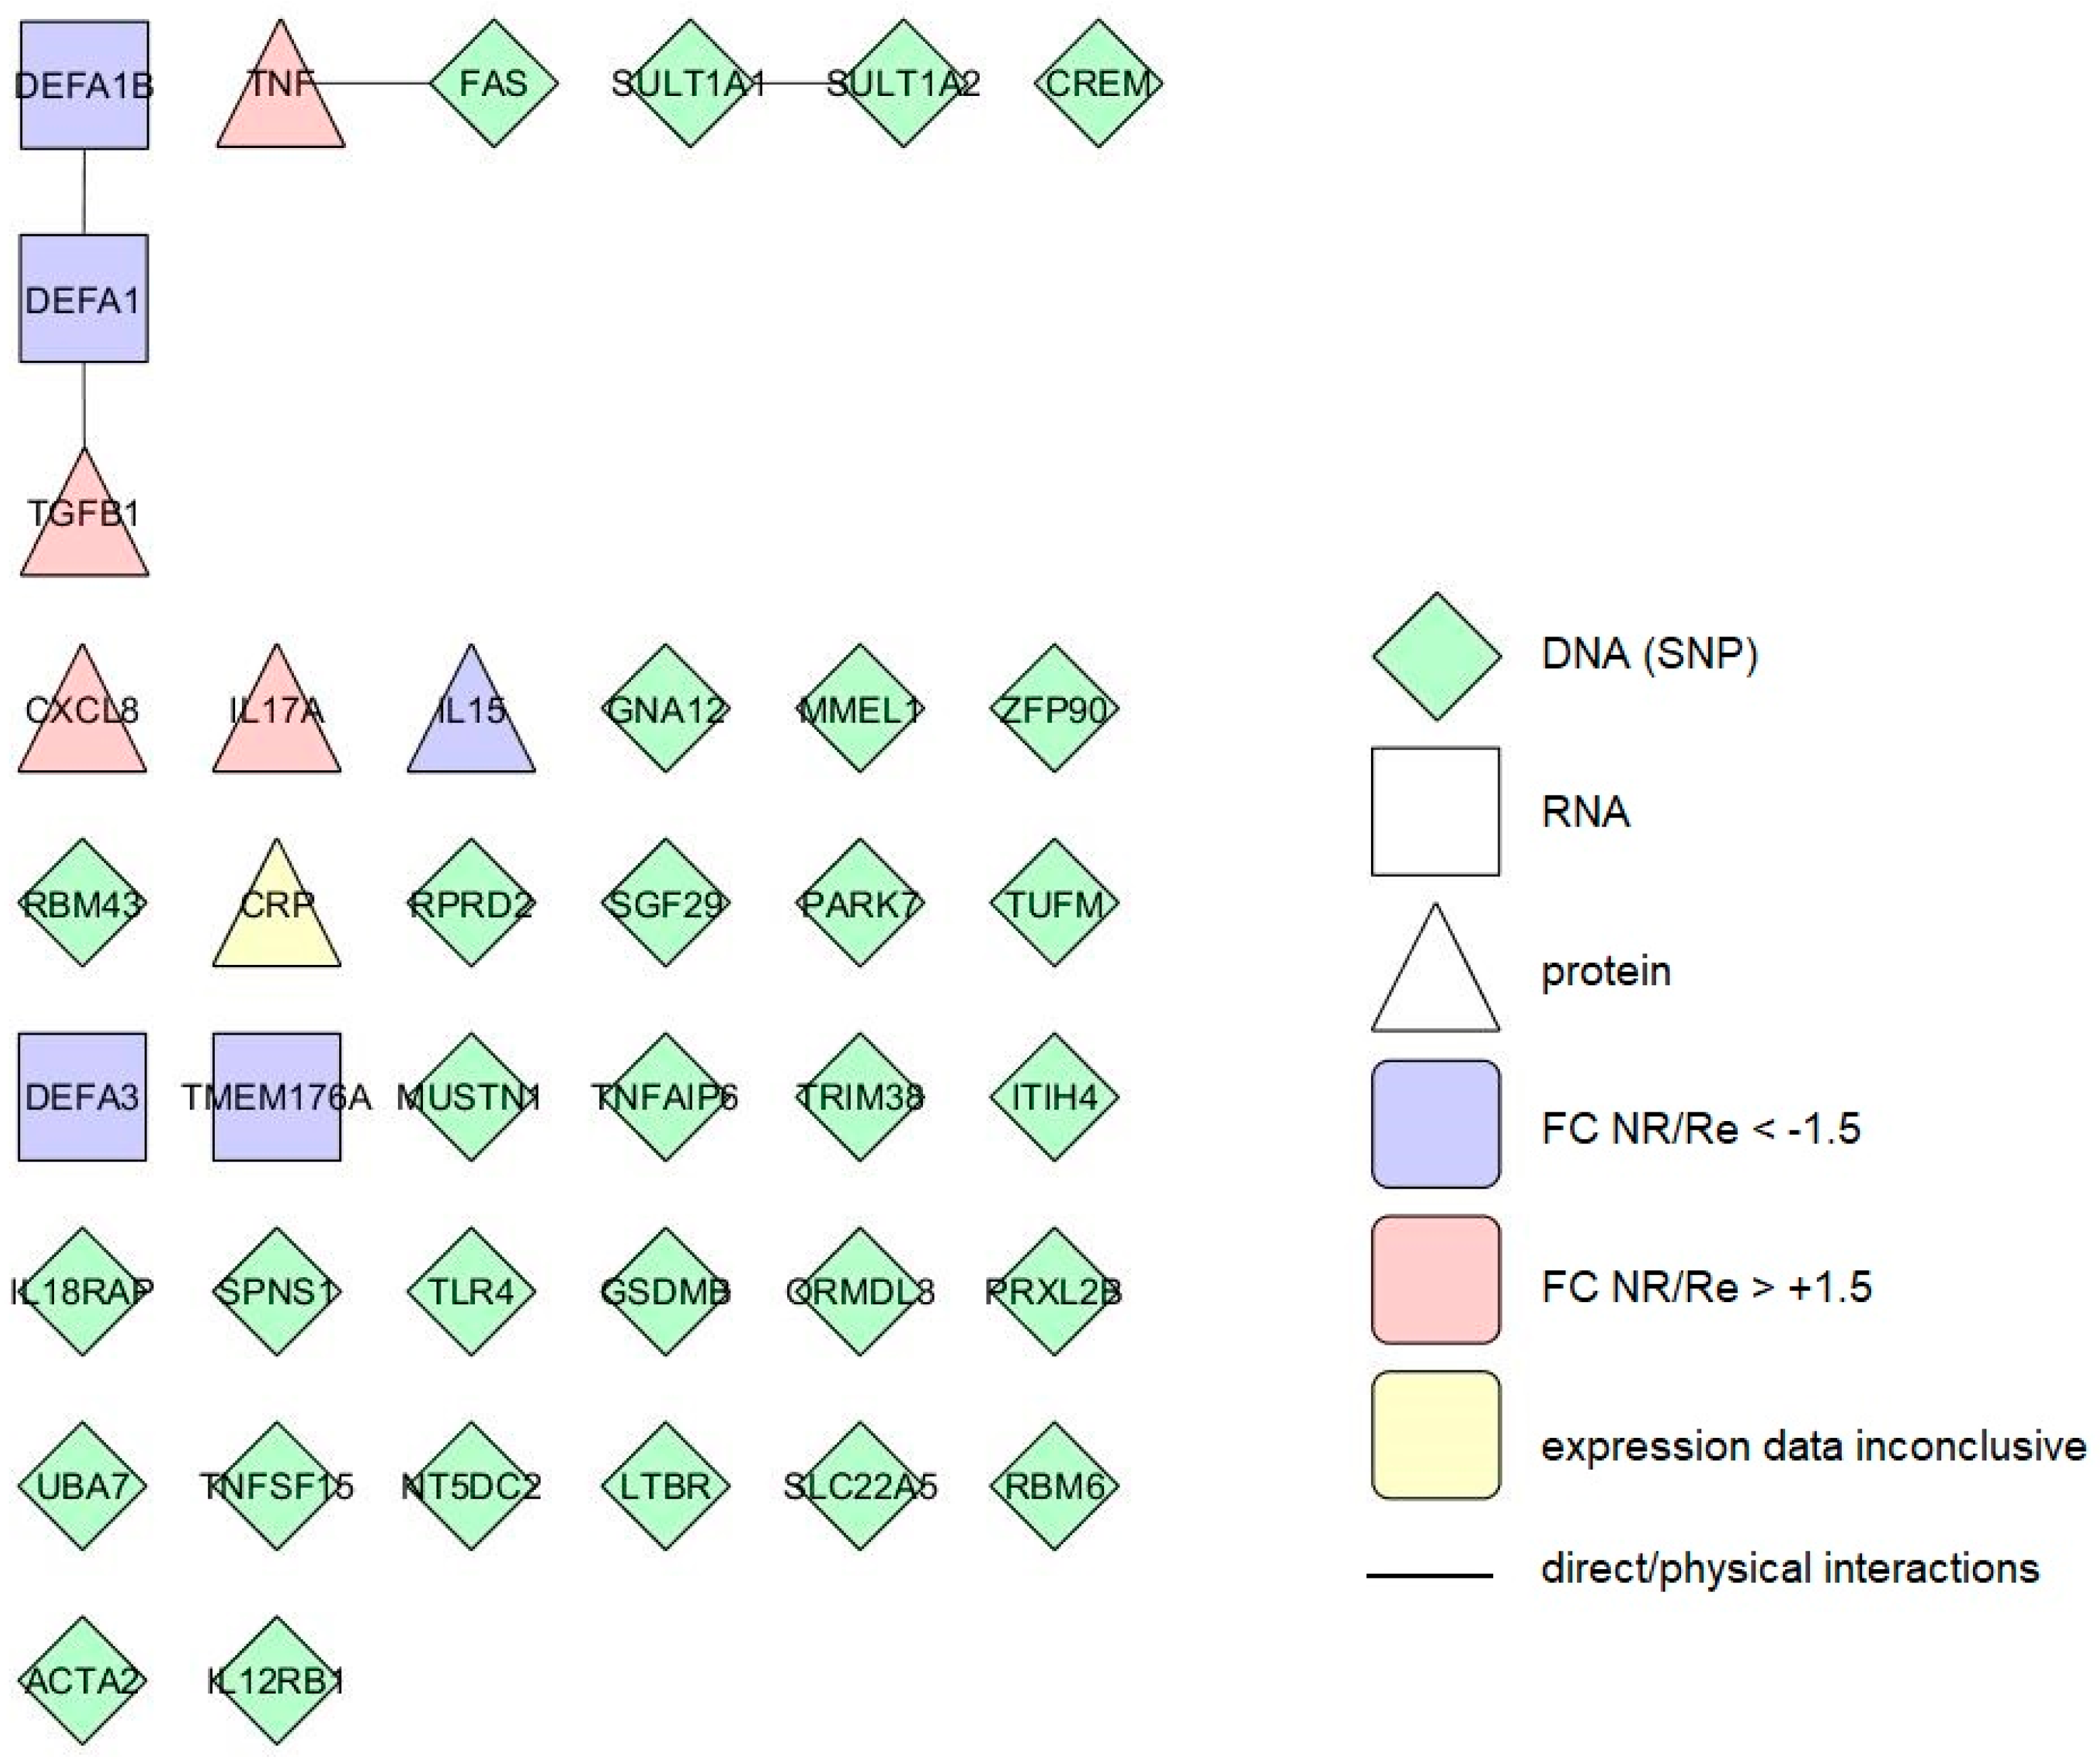
3.6.2. Response Markers of the Blood
4. Discussion
5. Conclusions
Supplementary Materials
Author Contributions
Funding
Conflicts of Interest
References
- Jostins, L.; Ripke, S.; Weersma, R.K.; Duerr, R.H.; McGovern, D.P.; Hui, K.Y.; Lee, J.C.; Schumm, L.P.; Sharma, Y.; Anderson, C.A.; et al. Host-microbe interactions have shaped the genetic architecture of inflammatory bowel disease. Nat. Cell Boil. 2012, 491, 119–124. [Google Scholar] [CrossRef] [PubMed]
- Linares-Pineda, T.M.; Cañadas-Garre, M.; Sánchez-Pozo, A.; Calleja-Hernández, M.Á. Pharmacogenetic biomarkers of response in Crohn’s disease. Pharm. J. 2017, 8, 1–13. [Google Scholar] [CrossRef] [PubMed]
- Cohn, H.M.; Dave, M.; Loftus, E.V., Jr. Understanding the Cautions and Contraindications of Immunomodulator and Biologic Therapies for Use in Inflammatory Bowel Disease. Inflamm. Bowel Dis. 2017, 23, 1301–1315. [Google Scholar] [CrossRef] [PubMed]
- Lopetuso, L.R.; Gerardi, V.; Papa, V.; Scaldaferri, F.; Rapaccini, G.L.; Gasbarrini, A.; Papa, A. Can We Predict the Efficacy of Anti-TNF-α Agents? Int. J. Mol. Sci. 2017, 18, 1973. [Google Scholar] [CrossRef] [PubMed]
- Qiu, Y.; Chen, B.L.; Mao, R.; Zhang, S.H.; He, Y.; Zeng, Z.R.; Ben-Horin, S.; Chen, M.H. Systematic review with meta-analysis: Loss of response and requirement of anti-TNFα dose intensification in Crohn’s disease. J. Gastroenterol. 2017, 52, 535–554. [Google Scholar] [CrossRef] [PubMed]
- Reinglas, J.; Gonczi, L.; Kurt, Z.; Bessissow, T.; Lakatos, P.L. Positioning of old and new biologicals and small molecules in the treatment of inflammatory bowel diseases. World J. Gastroenterol. 2018, 24, 3567–3582. [Google Scholar] [CrossRef] [PubMed]
- Koder, S.; Repnik, K.; Ferkolj, I.; Pernat, C.; Skok, P.; Weersma, R.K.; Potočnik, U. Genetic polymorphism in ATG16L1 gene influences the response to adalimumab in Crohn’s disease patients. Pharmacogenomics 2015, 16, 191–204. [Google Scholar] [CrossRef]
- Deželak, M.; Repnik, K.; Koder, S.; Ferkolj, I.; Potočnik, U. A Prospective Pharmacogenomic Study of Crohn’s Disease Patients during Routine Therapy with Anti-TNF-α Drug Adalimumab: Contribution of ATG5, NFKB1, and CRP Genes to Pharmacodynamic Variability. Omics: J. Integr. Biol. 2016, 20, 296–309. [Google Scholar] [CrossRef]
- Repnik, K.; Koder, S.; Skok, P.; Ferkolj, I.; Potočnik, U. Transferrin Level Before Treatment and Genetic Polymorphism in HFE Gene as Predictive Markers for Response to Adalimumab in Crohn’s Disease Patients. Biochem. Genet. 2016, 54, 476–486. [Google Scholar] [CrossRef]
- Barber, G.E.; Yajnik, V.; Khalili, H.; Giallourakis, C.; Garber, J.; Xavier, R.; Ananthakrishnan, A.N. Genetic markers predict primary non-response and durable response to anti-TNF biologic therapies in Crohn’s disease. Am. J. Gastroenterol. 2016, 111, 1816–1822. [Google Scholar] [CrossRef]
- Yoon, S.M.; Haritunians, T.; Chhina, S.; Liu, Z.; Yang, S.; Landers, C.; Li, D.; Ye, B.D.; Shih, D.; Vasiliauskas, E.A.; et al. Colonic Phenotypes Are Associated with Poorer Response to Anti-TNF Therapies in Patients with IBD. Inflamm. Bowel Dis. 2017, 23, 1382–1393. [Google Scholar] [CrossRef] [PubMed]
- Arijs, I.; De Hertogh, G.; Lemaire, K.; Quintens, R.; Van Lommel, L.; Van Steen, K.; Leemans, P.; Cleynen, I.; Van Assche, G.; Vermeire, S.; et al. Mucosal gene expression of antimicrobial peptides in inflammatory bowel disease before and after first infliximab treatment. PLoS ONE 2009, 4, e7984. [Google Scholar] [CrossRef] [PubMed]
- Schmitt, H.; Billmeier, U.; Dieterich, W.; Rath, T.; Sonnewald, S.; Reid, S.; Hirschmann, S.; Hildner, K.; Waldner, M.J.; Mudter, J.; et al. Expansion of IL-23 receptor bearing TNFR2+ T cells is associated with molecular resistance to anti-TNF therapy in Crohn’s disease. Gut 2019, 68, 814–828. [Google Scholar] [CrossRef] [PubMed]
- Andersen, V.; Hansen, A.K.; Heitmann, B.L. Potential Impact of Diet on Treatment Effect from Anti-TNF Drugs in Inflammatory Bowel Disease. Nutrients 2017, 9, 286. [Google Scholar] [CrossRef] [PubMed]
- Steenholdt, C. Personalized therapy with TNF-inhibitors in Crohn’s disease: Optimizing treatment outcomes by monitoring drug levels and anti-drug antibodies. Dan. Med. J. 2016, 63, B5270. [Google Scholar] [PubMed]
- Bek, S.; Nielsen, J.V.; Bojesen, A.B.; Franke, A.; Bank, S.; Vogel, U.; Andersen, V. Systematic review: Genetic biomarkers associated with anti-TNF treatment response in inflammatory bowel diseases. Aliment. Pharmacol. Ther. 2016, 44, 554–567. [Google Scholar] [CrossRef]
- Kopylov, U.; Seidman, E. Predicting durable response or resistance to antitumor necrosis factor therapy in inflammatory bowel disease. Therap. Adv. Gastroenterol. 2016, 9, 513–526. [Google Scholar] [CrossRef]
- Prieto-Pérez, R.; Almoguera, B.; Cabaleiro, T.; Hakonarson, H.; Abad-Santos, F. Association between Genetic Polymorphisms and Response to Anti-TNFs in Patients with Inflammatory Bowel Disease. Int. J. Mol. Sci. 2016, 17, 225. [Google Scholar] [CrossRef]
- Stevens, T.W.; Matheeuwsen, M.; Lönnkvist, M.H.; Parker, C.E.; Wildenberg, M.E.; Gecse, K.B.; D’Haens, G.R. Systematic review: Predictive biomarkers of therapeutic response in inflammatory bowel disease-personalised medicine in its infancy. Aliment. Pharmacol. Ther. 2018, 48, 1213–1231. [Google Scholar] [CrossRef]
- Naviglio, S.; Giuffrida, P.; Stocco, G.; Lenti, M.V.; Ventura, A.; Corazza, G.R.; Di Sabatino, A. How to predict response to anti-tumour necrosis factor agents in inflammatory bowel disease. Expert Rev. Gastroenterol. Hepatol. 2018, 12, 797–810. [Google Scholar] [CrossRef]
- Hlavaty, T.; Pierik, M.; Henckaerts, L.; Ferrante, M.; Joossens, S.; van Schuerbeek, N.; Noman, M.; Rutgeerts, P.; Vermeire, S. Polymorphisms in apoptosis genes predict response to infliximab therapy in luminal and fistulizing Crohn’s disease. Aliment. Pharmacol. Ther. 2005, 22, 613–626. [Google Scholar] [CrossRef] [PubMed]
- Dideberg, V.; Louis, E.; Farnir, F.; Bertoli, S.; Vermeire, S.; Rutgeerts, P.; De Vos, M.; Van Gossum, A.; Belaiche, J.; Bours, V. Lymphotoxin alpha gene in Crohn’s disease patients: Absence of implication in the response to infliximab in a large cohort study. Pharm. Genom. 2006, 16, 369–373. [Google Scholar] [CrossRef] [PubMed][Green Version]
- Louis, E.; El Ghoul, Z.; Vermeire, S.; Dall’Ozzo, S.; Rutgeerts, P.; Paintaud, G.; Belaiche, J.; De Vos, M.; Van Gossum, A.; Colombel, J.F.; et al. Association between polymorphism in IgG Fc receptor IIIa coding gene and biological response to infliximab in Crohn’s disease. Aliment. Pharmacol. Ther. 2004, 19, 511–519. [Google Scholar] [CrossRef] [PubMed]
- Thomas, D.; Gazouli, M.; Karantanos, T.; Rigoglou, S.; Karamanolis, G.; Bramis, K.; Zografos, G.; E Theodoropoulos, G. Association of rs1568885, rs1813443 and rs4411591 polymorphisms with anti-TNF medication response in Greek patients with Crohn’s disease. World J. Gastroenterol. 2014, 20, 3609–3614. [Google Scholar] [CrossRef] [PubMed]
- Medrano, L.M.; Taxonera, C.; Márquez, A.; Barreiro-de Acosta, M.; Gómez-García, M.; González-Artacho, C.; Pérez-Calle, J.L.; Bermejo, F.; Lopez-Sanromán, A.; Martín Arranz, M.D.; et al. Role of TNFRSF1B polymorphisms in the response of Crohn’s disease patients to infliximab. Hum. Immunol. 2014, 75, 71–75. [Google Scholar] [CrossRef] [PubMed]
- Steenholdt, C.; Enevold, C.; Ainsworth, M.A.; Brynskov, J.; Thomsen, O.Ø.; Bendtzen, K. Genetic polymorphisms of tumour necrosis factor receptor superfamily 1b and fas ligand are associated with clinical efficacy and/or acute severe infusion reactions to infliximab in Crohn’s disease. Aliment. Pharmacol. Ther. 2012, 36, 650–659. [Google Scholar] [CrossRef] [PubMed]
- Lacruz-Guzmán, D.; Torres-Moreno, D.; Pedrero, F.; Romero-Cara, P.; García-Tercero, I.; Trujillo-Santos, J.; Conesa-Zamora, P. Influence of polymorphisms and TNF and IL1β serum concentration on the infliximab response in Crohn’s disease and ulcerative colitis. Eur. J. Clin. Pharmacol. 2013, 69, 431–438. [Google Scholar] [CrossRef] [PubMed]
- Urcelay, E.; Mendoza, J.L.; Martinez, A.; Fernandez, L.; Taxonera, C.; Diaz-Rubio, M.; de la Concha, E.G. IBD5 polymorphisms in inflammatory bowel disease: Association with response to infliximab. World J. Gastroenterol. 2005, 11, 1187–1192. [Google Scholar] [CrossRef] [PubMed]
- Matsuoka, K.; Hamada, S.; Shimizu, M.; Nanki, K.; Mizuno, S.; Kiyohara, H.; Arai, M.; Sugimoto, S.; Iwao, Y.; Ogata, H.; et al. Factors predicting the therapeutic response to infliximab during maintenance therapy in Japanese patients with Crohn’s disease. PLoS ONE 2018, 13, e0204632. [Google Scholar] [CrossRef] [PubMed]
- Arijs, I.; Quintens, R.; Van Lommel, L.; Van Steen, K.; De Hertogh, G.; Lemaire, K.; Schraenen, A.; Perrier, C.; Van Assche, G.; Vermeire, S.; et al. Predictive value of epithelial gene expression profiles for response to infliximab in Crohn’s disease. Inflamm. Bowel Dis. 2010, 12, 2090–2098. [Google Scholar] [CrossRef] [PubMed]
- Mesko, B.; Poliska, S.; Váncsa, A.; Szekanecz, Z.; Palatka, K.; Hollo, Z.; Horvath, A.; Steiner, L.; Zahuczky, G.; Podani, J.; et al. Peripheral blood derived gene panels predict response to infliximab in rheumatoid arthritis and Crohn’s disease. Genome Med. 2013, 5, 59. [Google Scholar] [CrossRef] [PubMed]
- Gaujoux, R.; Starosvetsky, E.; Maimon, N.; Vallania, F.; Bar-Yoseph, H.; Pressman, S.; Weisshof, R.; Goren, I.; Rabinowitz, K.; Waterman, M.; et al. Cell-centred meta-analysis reveals baseline predictors of anti-TNFα non-response in biopsy and blood of patients with IBD. Gut 2019, 68, 604–614. [Google Scholar] [CrossRef] [PubMed]
- Verstockt, B.; Verstockt, S.; Blevi, H.; Cleynen, I.; De Bruyn, M.; Van Assche, G.; Vermeire, S.; Ferrante, M. TREM-1, the ideal predictive biomarker for endoscopic healing in anti-TNF-treated Crohn’s disease patients? Gut 2018. [Google Scholar] [CrossRef] [PubMed]
- Louis, E.; Vermeire, S.; Rutgeerts, P.; De Vos, M.; Van Gossum, A.; Pescatore, P.; Fiasse, R.; Pelckmans, P.; Reynaert, H.; D’Haens, G.; et al. Inflammatory Bowel Disease A Positive Response to Infliximab in Crohn Disease: Association with a Higher Systemic Inflammation Before Treatment But Not With -308 TNF Gene Polymorphism. Scand. J. Gastroenterol. 2002, 37, 818–824. [Google Scholar] [CrossRef] [PubMed]
- Reinisch, W.; Wang, Y.; Oddens, B.J.; Link, R. C-reactive protein, an indicator for maintained response or remission to infliximab in patients with Crohn’s disease: A post-hoc analysis from ACCENT I. Aliment. Pharmacol. Ther. 2012, 35, 568–576. [Google Scholar] [CrossRef] [PubMed]
- Magro, F.; Rodrigues-Pinto, E.; Santos-Antunes, J.; Vilas-Boas, F.; Lopes, S.; Nunes, A.; Camila-Dias, C.; Macedo, G. High C-reactive protein in Crohn’s disease patients predicts nonresponse to infliximab treatment. J. Crohn’s Colitis 2014, 8, 129–136. [Google Scholar] [CrossRef] [PubMed]
- Beltrán, B.; Iborra, M.; Sáez-González, E.; Marqués-Miñana, M.R.; Moret, I.; Cerrillo, E.; Tortosa, L.; Bastida, G.; Hinojosa, J.; Poveda-Andrés, J.L.; et al. Fecal Calprotectin Pretreatment and Induction Infliximab Levels for Prediction of Primary Nonresponse to Infliximab Therapy in Crohn’s Disease. Dig. Dis. 2019, 37, 108–115. [Google Scholar] [CrossRef] [PubMed]
- Ferreiro-Iglesias, R.; Barreiro-de Acosta, M.; Otero Santiago, M.; Lorenzo Gonzalez, A.; Alonso de la Peña, C.; Benitez Estevez, A.J.; Dominguez-Muñoz, J.E. Fecal Calprotectin as Predictor of Relapse in Patients With Inflammatory Bowel Disease Under Maintenance Infliximab Therapy. J. Clin. Gastroenterol. 2016, 50, 147–151. [Google Scholar] [CrossRef]
- Ferreiro-Iglesias, R.; Barreiro-de Acosta, M.; Lorenzo-Gonzalez, A.; Dominguez-Muñoz, J.E. Usefulness of a rapid faecal calprotectin test to predict relapse in Crohn’s disease patients on maintenance treatment with adalimumab. Scand. J. Gastroenterol. 2016, 51, 442–447. [Google Scholar] [CrossRef]
- Atreya, R.; Neumann, H.; Neufert, C.; Waldner, M.J.; Billmeier, U.; Zopf, Y.; Willma, M.; App, C.; Münster, T.; Kessler, H.; et al. In vivo imaging using fluorescent antibodies to tumor necrosis factor predicts therapeutic response in Crohn’s disease. Nat. Med. 2014, 20, 313–318. [Google Scholar] [CrossRef]
- Billiet, T.; Cleynen, I.; Ballet, V.; Claes, K.; Princen, F.; Singh, S.; Ferrante, M.; Van Assche, G.; Gils, A.; Vermeire, S. Evolution of cytokines and inflammatory biomarkers during infliximab induction therapy and the impact of inflammatory burden on primary response in patients with Crohn’s disease. Scand. J. Gastroenterol. 2017, 52, 1086–1092. [Google Scholar] [CrossRef] [PubMed]
- Bouchaud, G.; Mortier, E.; Flamant, M.; Barbieux, I.; Plet, A.; Galmiche, J.P.; Jacques, Y.; Bourreille, A. Interleukin-15 and its soluble receptor mediate the response to infliximab in patients with Crohn’s disease. Gastroenterology 2010, 138, 2378–2387. [Google Scholar] [CrossRef] [PubMed]
- Ogawa, K.; Matsumoto, T.; Esaki, M.; Torisu, T.; Iida, M. Profiles of circulating cytokines in patients with Crohn’s disease under maintenance therapy with infliximab. J. Crohn’s Colitis 2012, 6, 529–535. [Google Scholar] [CrossRef] [PubMed]
- Di Sabatino, A.; Biancheri, P.; Piconese, S.; Rosado, M.M.; Ardizzone, S.; Rovedatti, L.; Ubezio, C.; Massari, A.; Sampietro, G.M.; Foschi, D.; et al. Peripheral regulatory T cells and serum transforming growth factor-β: Relationship with clinical response to infliximab in Crohn’s disease. Inflamm. Bowel Dis. 2010, 16, 1891–1897. [Google Scholar] [CrossRef] [PubMed]
- Martínez-Borra, J.; López-Larrea, C.; González, S.; Fuentes, D.; Dieguez, A.; Deschamps, E.M.; Pérez-Pariente, J.M.; López-Vázquez, A.; de Francisco, R.; Rodrigo, L. High serum tumor necrosis factor-alpha levels are associated with lack of response to infliximab in fistulizing Crohn’s disease. Am. J. Gastroenterol. 2002, 97, 2350–2356. [Google Scholar] [CrossRef]
- Suzuki, Y.; Matsui, T.; Ito, H.; Ashida, T.; Nakamura, S.; Motoya, S.; Matsumoto, T.; Sato, N.; Ozaki, K.; Watanabe, M.; et al. Circulating Interleukin 6 and Albumin, and Infliximab Levels Are Good Predictors of Recovering Efficacy After Dose Escalation Infliximab Therapy in Patients with Loss of Response to Treatment for Crohn’s Disease: A Prospective Clinical Trial. Inflamm. Bowel Dis. 2015, 21, 2114–2122. [Google Scholar]
- Netz, U.; Carter, J.V.; Eichenberger, M.R.; Dryden, G.W.; Pan, J.; Rai, S.N.; Galandiuk, S. Genetic polymorphisms predict response to anti-tumor necrosis factor treatment in Crohn’s disease. World J. Gastroenterol. 2017, 23, 4958–4967. [Google Scholar] [CrossRef]
- Billiet, T.; De Bruyn, M.; Verstockt, B.; Princen, F.; Singh, S.; Ferrante, M.; Papamichael, K.; Cleynen, I.; Van Assche, G.; Vermeire, S. A Matrix-based Model Predicts Primary Response to Infliximab in Crohn’s Disease. J. Crohn’s Coliti 2015, 9, 1120–1126. [Google Scholar] [CrossRef]
- Bank, S.; Andersen, P.S.; Burisch, J.; Pedersen, N.; Roug, S.; Galsgaard, J.; Turino, S.Y.; Brodersen, J.B.; Rashid, S.; Rasmussen, B.K.; et al. Associations between functional polymorphisms in the NFκB signaling pathway and response to anti-TNF treatment in Danish patients with inflammatory bowel disease. Pharm. J. 2014, 14, 526–534. [Google Scholar] [CrossRef]
- Hong, E.P.; Park, J.W. Sample size and statistical power calculation in genetic association studies. Genom. Inform. 2012, 10, 117–122. [Google Scholar] [CrossRef]
- Arijs, I.; De Hertogh, G.; Machiels, K.; Van Steen, K.; Lemaire, K.; Schraenen, A.; Van Lommel, L.; Quintens, R.; Van Assche, G.; Vermeire, S.; et al. Mucosal Gene Expression of Cell Adhesion Molecules, Chemokines, and Chemokine Receptors in Patients With Inflammatory Bowel Disease Before and After Infliximab Treatment. Am. J. Gastroenterol. 2011, 106, 748–761. [Google Scholar] [CrossRef] [PubMed]
- Leal, R.F.; Planell, N.; Kajekar, R.; Lozano, J.J.; Ordás, I.; Dotti, I.; Esteller, M.; Masamunt, M.C.; Parmar, H.; Panes, J. Identification of inflammatory mediators in patients with Crohn’s disease unresponsive to anti-TNFα therapy. Gut 2015, 64, 233–242. [Google Scholar] [CrossRef]
- Planell, N.; Masamunt, M.C.; Leal, R.F.; Rodríguez, L.; Esteller, M.; Lozano, J.J.; Ramírez, A.; Ayrizono, M.D.L.S.; Coy, C.S.R.; Alfaro, I.; et al. Usefulness of Transcriptional Blood Biomarkers as a Non-invasive Surrogate Marker of Mucosal Healing and Endoscopic Response in Ulcerative Colitis. J. Crohn’s Coliti 2017, 11, 1335–1346. [Google Scholar] [CrossRef] [PubMed]
- Sandahl, T.D.; Kelsen, J.; Dige, A.; Dahlerup, J.F.; Agnholt, J.; Hvas, C.L.; Thiel, S. The lectin pathway of the complement system is downregulated in Crohn’s disease patients who respond to anti-TNF-α therapy. J. Crohn’s Colitis 2014, 8, 521–528. [Google Scholar] [CrossRef]
- Taylor, K.D.; Plevy, S.E.; Yang, H.; Landers, C.J.; Barry, M.J.; Rotter, J.I.; Targan, S.R. ANCA pattern and LTA haplotype relationship to clinical responses to anti-TNF antibody treatment in Crohn’s disease. Gastroenterology 2001, 120, 1347–1355. [Google Scholar] [CrossRef] [PubMed]
- Papamichael, K.; Gazouli, M.; Karakoidas, C.; Panayotou, I.; Roma-Giannikou, E.; Mantzaris, G.J. Association of TNF and FcγRΙΙΙA gene polymorphisms with differential response to infliximab in a Greek cohort of Crohn’s disease patients. Ann. Gastroenterol. 2011, 24, 35–40. [Google Scholar] [PubMed]
- Mascheretti, S.; Hampe, J.; Kühbacher, T.; Herfarth, H.; Krawczak, M.; Fölsch, U.R.; Schreiber, S. Pharmacogenetic investigation of the TNF/TNF-receptor system in patients with chronic active Crohn’s disease treated with infliximab. Pharm. J. 2002, 2, 127–136. [Google Scholar] [CrossRef]
- Gole, B.; Mian, E.; Rall, M.; Wiesmüller, L. Base excision repair proteins couple activation-induced cytidine deaminase and endonuclease G during replication stress-induced MLL destabilization. Leukemia 2018, 32, 159–167. [Google Scholar] [CrossRef]
- Konikoff, M.R.; Denson, L.A. Role of fecal calprotectin as a biomarker of intestinal inflammation in inflammatory bowel disease. Inflamm. Bowel Dis. 2006, 6, 524–534. [Google Scholar] [CrossRef]
- Luther, J.; Gala, M.; Patel, S.J.; Dave, M.; Borren, N.; Xavier, R.J.; Ananthakrishnan, A.N. Loss of Response to Anti-Tumor Necrosis Factor Alpha Therapy in Crohn’s Disease Is Not Associated with Emergence of Novel Inflammatory Pathways. Dig. Dis. Sci. 2018, 63, 738–745. [Google Scholar] [CrossRef]
- Yamamoto, K.; Chiba, T.; Matsumoto, T. Effect of tumor necrosis factor-α antagonists on oxidative stress in patients with Crohn’s disease. World J. Gastroenterol. 2015, 21, 10208–10214. [Google Scholar] [CrossRef] [PubMed]
- Andersen, V.; Holmskov, U.; Sørensen, S.B.; Jawhara, M.; Andersen, K.W.; Bygum, A.; Hvid, L.; Grauslund, J.; Wied, J.; Glerup, H.; et al. A Proposal for a Study on Treatment Selection and Lifestyle Recommendations in Chronic Inflammatory Diseases: A Danish Multidisciplinary Collaboration on Prognostic Factors and Personalised Medicine. Nutrients 2017, 9, 499. [Google Scholar] [CrossRef] [PubMed]
- Vermeire, S.; Louis, E.; Rutgeerts, P.; De Vos, M.; Van Gossum, A.; Belaiche, J.; Pescatore, P.; Fiasse, R.; Pelckmans, P.; Vlietinck, R.; et al. NOD2/CARD15 does not influence response to infliximab in Crohn’s disease. Gastroenterology 2002, 123, 106–111. [Google Scholar] [CrossRef] [PubMed]
- Mascheretti, S.; Hampe, J.; Croucher, P.J.; Nikolaus, S.; Andus, T.; Schubert, S.; Olson, A.; Bao, W.; Fölsch, U.R.; Schreiber, S. Response to infliximab treatment in Crohn’s disease is not associated with mutations in the CARD15 (NOD2) gene: An analysis in 534 patients from two multicenter, prospective GCP-level trials. Pharmacogenetics 2002, 12, 509–515. [Google Scholar] [CrossRef] [PubMed]
- Pierik, M.; Vermeire, S.; Steen, K.V.; Joossens, S.; Claessens, G.; Vlietinck, R.; Rutgeerts, P. Tumour necrosis factor-alpha receptor 1 and 2 polymorphisms in inflammatory bowel disease and their association with response to infliximab. Aliment. Pharmacol. Ther. 2004, 20, 303–310. [Google Scholar] [CrossRef]
- Palmieri, O.; Latiano, A.; Valvano, R.; D’Incà, R.; Vecchi, M.; Sturniolo, G.C.; Saibeni, S.; Bossa, F.; Latiano, T.; Devoto, M.; et al. Multidrug resistance 1 gene polymorphisms are not associated with inflammatory bowel disease and response to therapy in Italian patients. Aliment. Pharmacol. Ther. 2005, 22, 1129–1138. [Google Scholar] [CrossRef] [PubMed]
- Willot, S.; Vermeire, S.; Ohresser, M.; Rutgeerts, P.; Paintaud, G.; Belaiche, J.; De Vos, M.; Van Gossum, A.; Franchimont, D.; Colombel, J.F.; et al. No association between C-reactive protein gene polymorphisms and decrease of C-reactive protein serum concentration after infliximab treatment in Crohn’s disease. Pharm. Genom. 2006, 16, 37–42. [Google Scholar] [CrossRef]
- Dideberg, V.; Théâtre, E.; Farnir, F.; Vermeire, S.; Rutgeerts, P.; De Vos, M.; Belaiche, J.; Franchimont, D.; Van Gossum, A.; Louis, E.; et al. The TNF/ADAM 17 system: Implication of an ADAM 17 haplotype in the clinical response to infliximab in Crohn’s disease. Pharm. Genom. 2006, 16, 727–734. [Google Scholar] [CrossRef] [PubMed]
- Louis, E.J.; Watier, H.E.; Schreiber, S.; Hampe, J.; Taillard, F.; Olson, A.; Thorne, N.; Zhang, H.; Colombel, J.F. Polymorphism in IgG Fc receptor gene FCGR3A and response to infliximab in Crohn’s disease: A subanalysis of the ACCENT I study. Pharm. Genom. 2006, 16, 911–914. [Google Scholar] [CrossRef]
- Fischer, S.; Lakatos, P.L.; The Hungarian IBD Study Group; Lakatos, L.; Kovacs, A.; Molnár, T.; Altorjay, I.; Papp, M.; Szilvasi, A.; Tulassay, Z.; et al. ATP-binding cassette transporter ABCG2 (BCRP) and ABCB1 (MDR1) variants are not associated with disease susceptibility, disease phenotype response to medical therapy or need for surgeryin Hungarian patients with inflammatory bowel diseases. Scand. J. Gastroenterol. 2007, 42, 726–733. [Google Scholar] [CrossRef]
- Matsukura, H.; Ikeda, S.; Yoshimura, N.; Takazoe, M.; Muramatsu, M. Genetic polymorphisms of tumour necrosis factor receptor superfamily 1A and 1B affect responses to infliximab in Japanese patients with Crohn’s disease. Aliment. Pharmacol. Ther. 2008, 27, 765–770. [Google Scholar] [CrossRef] [PubMed]
- Meuwis, M.A.; Fillet, M.; Lutteri, L.; Marée, R.; Geurts, P.; de Seny, D.; Malaise, M.; Chapelle, J.P.; Wehenkel, L.; Belaiche, J.; et al. Proteomics for prediction and characterization of response to infliximab in Crohn’s disease: A pilot study. Clin. Biochem. 2008, 41, 960–967. [Google Scholar] [CrossRef] [PubMed]
- Weiss, B.; Lebowitz, O.; Fidder, H.H.; Maza, I.; Levine, A.; Shaoul, R.; Reif, S.; Bujanover, Y.; Karban, A. Response to medical treatment in patients with Crohn’s disease: The role of NOD2/CRAD15, disease phenotype, and age of diagnosis. Dig. Dis. Sci. 2010, 55, 1674–1680. [Google Scholar] [CrossRef] [PubMed]
- Jürgens, M.; Mahachie John, J.M.; Cleynen, I.; Schnitzler, F.; Fidder, H.; van Moerkercke, W.; Ballet, V.; Noman, M.; Hoffman, I.; van Assche, G.; et al. Levels of C-reactive protein are associated with response to infliximab therapy in patients with Crohn’s disease. Clin. Gastroenterol. Hepatol. 2011, 9, 421–427. [Google Scholar] [CrossRef] [PubMed]
- Niess, J.H.; Klaus, J.; Stephani, J.; Pflüger, C.; Degenkolb, N.; Spaniol, U.; Mayer, B.; Lahr, G.; von Boyen, G.B. NOD2 polymorphism predicts response to treatment in Crohn’s disease--first steps to a personalized therapy. Dig. Dis. Sci. 2012, 57, 879–886. [Google Scholar] [CrossRef] [PubMed]
- Dige, A.; Støy, S.; Rasmussen, T.K.; Kelsen, J.; Hvas, C.L.; Sandahl, T.D.; Dahlerup, J.F.; Deleuran, B.; Agnholt, J. Increased levels of circulating Th17 cells in quiescent versus active Crohn’s disease. J. Crohn’s Colitis 2013, 7, 248–255. [Google Scholar] [CrossRef] [PubMed]
- Perrier, C.; Arijs, I.; Staelens, D.; Breynaert, C.; Cleynen, I.; Covens, K.; Ferrante, M.; Van Assche, G.; Vermeire, S.; de Hertogh, G.; et al. Interleukin-15 receptor α expression in inflammatory bowel disease patients before and after normalization of inflammation with infliximab. Immunology 2013, 138, 47–56. [Google Scholar] [CrossRef]
- Lu, C.; Waugh, A.; Bailey, R.J.; Cherry, R.; A Dieleman, L.; Gramlich, L.; Matic, K.; Millan, M.; I Kroeker, K.; Sadowski, D.; et al. Crohn’s disease genotypes of patients in remission vs relapses after infliximab discontinuation. World J. Gastroenterol. 2012, 18, 5058–5064. [Google Scholar] [CrossRef]
- Moroi, R.; Endo, K.; Kinouchi, Y.; Shiga, H.; Kakuta, Y.; Kuroha, M.; Kanazawa, Y.; Shimodaira, Y.; Horiuchi, T.; Takahashi, S.; et al. FCGR3A-158 polymorphism influences the biological response to infliximab in Crohn’s disease through affecting the ADCC activity. Immunogenetics 2013, 65, 265–271. [Google Scholar] [CrossRef]
- Gutiérrez, A.; Scharl, M.; Sempere, L.; Holler, E.; Zapater, P.; Almenta, I.; González-Navajas, J.M.; Such, J.; Wiest, R.; Rogler, G.; et al. Genetic susceptibility to increased bacterial translocation influences the response to biological therapy in patients with Crohn’s disease. Gut 2014, 63, 272–280. [Google Scholar] [CrossRef]
- Boschetti, G.; Garnero, P.; Moussata, D.; Cuerq, C.; Préaudat, C.; Duclaux-Loras, R.; Mialon, A.; Drai, J.; Flourié, B.; Nancey, S. Accuracies of serum and fecal S100 proteins (calprotectin and calgranulin C) to predict the response to TNF antagonists in patients with Crohn’s disease. Inflamm. Bowel Dis. 2015, 21, 331–336. [Google Scholar] [CrossRef] [PubMed]
- Váradi, C.; Holló, Z.; Poliska, S.; Nagy, L.; Szekanecz, Z.; Váncsa, A.; Palatka, K. Combination of IgG N -glycomics and corresponding transcriptomics data to identify anti-TNF-α treatment responders in inflammatory diseases. Electrophoresis 2015, 36, 1330–1335. [Google Scholar] [CrossRef] [PubMed]
- Vatansever, A.; Çekiç, C.; Ekinci, N.; Yüksel, E.S.; Avcı, A.; Aslan, F.; Arabul, M.; Ünsal, B.; Çakalağaoğlu, F. Effects of mucosal TNF-alpha levels on treatment response in Crohn’s disease patients receiving anti-TNF treatment. Hepatogastroenterology 2014, 61, 2277–2282. [Google Scholar] [PubMed]
- Rapti, E.; Gazouli, M.; Legaki, E.; Karamanolis, G.; Thomas, D.; Marinos, E.; Papaconstantinou, I. Association of survivin promoter polymorphisms with inflammatory bowel disease and response to antitumor necrosis factor therapy. Genet. Test. Mol. Biomark. 2015, 19, 339–343. [Google Scholar] [CrossRef] [PubMed]
- Medrano, L.M.; Taxonera, C.; González-Artacho, C.; Pascual, V.; Gómez-García, M.; Acosta, M.B.-D.; Perez-Calle, J.L.; Bermejo, F.; López-Sanromán, A.; Arranz, D.M.; et al. Response to Infliximab in Crohn’s Disease: Genetic Analysis Supporting Expression Profile. Mediat. Inflamm. 2015, 2015, 1–8. [Google Scholar] [CrossRef] [PubMed]
- Urabe, S.; Isomoto, H.; Ishida, T.; Maeda, K.; Inamine, T.; Kondo, S.; Higuchi, N.; Sato, K.; Uehara, R.; Yajima, H.; et al. Genetic Polymorphisms of IL-17F and TRAF3IP2 Could Be Predictive Factors of the Long-Term Effect of Infliximab against Crohn’s Disease. BioMed Int. 2015, 2015, 1–12. [Google Scholar] [CrossRef] [PubMed]
- Bank, S.; Andersen, P.S.; Burisch, J.; Pedersen, N.; Roug, S.; Galsgaard, J.; Turino, S.Y.; Brodersen, J.B.; Rashid, S.; Rasmussen, B.K.; et al. Genetically determined high activity of IL-12 and IL-18 in ulcerative colitis and TLR5 in Crohns disease were associated with non-response to anti-TNF therapy. Pharm. J. 2018, 18, 87–97. [Google Scholar] [CrossRef]
- Papaconstantinou, I.; Kapizioni, C.; Legaki, E.; Xourgia, E.; Karamanolis, G.; Gklavas, A.; Gazouli, M. Association of miR-146 rs2910164, miR-196a rs11614913, miR-221 rs113054794 and miR-224 rs188519172 polymorphisms with anti-TNF treatment response in a Greek population with Crohn’s disease. World J. Gastrointest. Pharmacol. Ther. 2017, 8, 193–200. [Google Scholar] [CrossRef] [PubMed]


| SNP | p-Value | Adjusted p-Value | Allele/Genotype Association | Reference | |
|---|---|---|---|---|---|
| short-term response | |||||
| rs1130864 | 4.09 × 10⁻⁵ | 4.09 × 10⁻⁴ | C | Re | [8] |
| rs763110 | N.D. | 1.00 × 10⁻³ | CC/CT | Re | [21] |
| rs12469362 | N.D. | 1.30 × 10⁻³ | T | Re | [22] |
| rs10495565 | N.D. | 1.40 × 10⁻³ | G | Re | [22] |
| rs1056204 | N.D. | 1.40 × 10⁻³ | C | Re | [22] |
| rs4464248 | N.D. | 1.80 × 10⁻³ | G | Re | [22] |
| rs396991 | 3.00 × 10⁻³ | 3.00 × 10⁻³ | GG | Re | [23] |
| rs1813443 | 2.00 × 10⁻³ | 6.00 × 10⁻³ | CC | NR | [24] |
| rs9373839 | 1.13 × 10⁻³ | 1.13 × 10⁻² | C | Re | [8] |
| rs2071303 | 8.20 × 10⁻³ | 1.64 × 10⁻² | G | Re | [9] |
| rs1061624 | 5.00 × 10⁻³ | 2.00 × 10⁻² | A | NR | [25] |
| rs1568885 | 7.00 × 10⁻³ | 2.10 × 10⁻² | TT | NR | [24] |
| rs976881 | 2.00 × 10⁻³ | 2.40 × 10⁻² | A | NR | [26] |
| rs10210302 | 8.10 × 10⁻⁴ | 2.67 × 10⁻² | CC | Re | [7] |
| rs1143634 | N.D. | 2.70 × 10⁻² | C | NR | [27] |
| rs4645983 | N.D. | 3.00 × 10⁻² | TT | Re | [21] |
| rs2522057 | 2.40 × 10⁻² | 4.80 × 10⁻² | C | NR | [28] |
| rs35260072 | 2.40 × 10⁻² | 4.80 × 10⁻² | G | NR | [28] |
| long-term response | |||||
| rs1130864 | 4.09 × 10⁻⁵ | 4.09 × 10⁻⁴ | C | Re | [8] |
| rs9373839 | 1.13 × 10⁻³ | 1.13 × 10⁻² | C | Re | [8] |
| rs1799724 | N.D. | 4.00 × 10⁻² | CC | Re | [29] |
| Gene Name | NCBI Gene ID | log2 FC NR/Re | p-Value | Adjusted p-Value | Reference |
|---|---|---|---|---|---|
| colon (colon mucosa)1 | |||||
| short-term response | |||||
| IL13RA2 | 3598 | 2.761 | 1.27 × 10⁻⁵ | 2.37 × 10⁻² | [12] |
| 2.184 | <1.00 × 10⁻² | <5.00 × 10⁻² | [30] | ||
| IL11 | 3589 | 3.306 | 1.41 × 10⁻⁵ | 2.37 × 10⁻² | [12] |
| 3.184 | <1.00 × 10⁻² | <5.00 × 10⁻² | [30] | ||
| STC1 | 6781 | 1.514 | 7.49 × 10⁻⁵ | 3.89 × 10⁻² | [12] |
| 2.396 | <1.00 × 10⁻² | <5.00 × 10⁻² | [30] | ||
| PTGS2 | 5743 | 2.206 | 8.55 × 10⁻⁵ | 3.94 × 10⁻² | [12] |
| 3.059 | <1.00 × 10⁻² | <5.00 × 10⁻² | [30] | ||
| blood (PBMCs) | |||||
| short-term response | |||||
| DEFA1 | 1667 | −1.885 | 6.72 × 10⁻³ | 9.13 × 10⁻¹ | [32] |
| DEFA3 | 1668 | −1.885 | 6.72 × 10⁻³ | 9.13 × 10⁻¹ | [32] |
| DEFA1B | 728358 | −1.950 | 6.84 × 10⁻³ | 9.13 × 10⁻¹ | [32] |
| SCARNA4 | 677771 | 1.701 | 2.24 × 10⁻² | 8.96 × 10⁻¹ | [31] |
| TMEM176A | 55365 | −1.712 | 2.36 × 10⁻² | 8.96 × 10⁻¹ | [31] |
| long-term response | |||||
| TREM1 | 54210 | 2.341 | 2.00 × 10⁻² | 2.00 × 10⁻² | [33] |
| Protein Name | FC NR/Re | p-Value | Reference |
|---|---|---|---|
| colon (colon mucosa, stool) | |||
| short-term response | |||
| colon mucosa | |||
| TNF | 0.366 | 4.00 × 10⁻⁴ | [40] |
| stool | |||
| calprotectin | 3.053 | <5.00 × 10⁻³ | [38] |
| 13.889 | <5.00 × 10⁻³ | [39] | |
| 4.463 | 3.00 × 10⁻² | [37] | |
| blood (serum) | |||
| short-term response | |||
| TGF-β1 | 1.724 | <5.00 × 10⁻³ | [44] |
| CRP | 0.571 | 2.00 × 10⁻² | [34] |
| 0.568 | 7.00 × 10⁻³ | [35] | |
| 2.732 | 1.50 × 10⁻² | [36] | |
| 4.563 | 4.00 × 10⁻² | [37] | |
| IL-8 (CXCL8) | 1.786 | 1.00 × 10⁻² | [41] |
| IL-15 | 0.054 | 1.00 × 10⁻² | [42] |
| TNF | 14.286 | 3.50 × 10⁻² | [45] |
| IL-17A | 19.231 | 4.00 × 10⁻² | [43] |
| long-term response | |||
| TREM1 | 2.096 | 1.00 × 10⁻³ | [33] |
| IL-6 | 1.961 | 2.90 × 10⁻² | [46] |
| Gene Name | NCBI Gene ID | SNP | p-Value | Adjusted p-Value | Data Type | Reference |
|---|---|---|---|---|---|---|
| Colon (colon-sigmoid/colon-transverse/small intestine eQTL, colon mucosa/stool expression)1 | ||||||
| short-term response | ||||||
| AC034220.3 | N.A. | rs2522057 | 2.40 × 10⁻² | 4.80 × 10⁻² | DNA | [28] |
| rs35260072 | 2.40 × 10⁻² | 4.80 × 10⁻² | ||||
| rs1050152 | 2.40 × 10⁻² | 7.92 × 10⁻¹ | [7] | |||
| rs2631372 | 2.60 × 10⁻² | 8.58 × 10⁻¹ | ||||
| ACSL6 | 23305 | rs2522057 | 2.40 × 10⁻² | 4.80 × 10⁻² | DNA | [28] |
| rs35260072 | 2.40 × 10⁻² | 4.80 × 10⁻² | ||||
| rs1050152 | 2.40 × 10⁻² | 7.92 × 10⁻¹ | [7] | |||
| CASP9 | 842 | rs4645983 | N.D. | 3.00 × 10⁻² | DNA | [21] |
| 7.20 × 10⁻³ | 2.38 × 10⁻¹ | [7] | ||||
| FCGR2C | 9103 | rs396991 | 3.00 × 10⁻³ | 3.00 × 10⁻³ | DNA | [23] |
| N.A. | 1.34 × 10⁻⁴ | 4.55 × 10⁻² | RNA | [12] | ||
| rs396991 | 2.10 × 10⁻² | 6.93 × 10⁻¹ | DNA | [7] | ||
| HSPA7 | 3311 | rs396991 | 3.00 × 10⁻³ | 3.00 × 10⁻³ | DNA | [23] |
| 2.10 × 10⁻² | 6.93 × 10⁻¹ | [7] | ||||
| S100A8 | 6279 | N.A. | 7.67 × 10⁻⁶ | 2.37 × 10⁻² | RNA | [12] |
| <5.00 × 10⁻³ | N.D. | protein | [38] | |||
| <5.00 × 10⁻³ | N.D. | [39] | ||||
| 3.00 × 10⁻² | N.D. | [37] | ||||
| S100A9 | 6280 | N.A. | 5.61 × 10⁻⁵ | 3.57 × 10⁻² | RNA | [12] |
| <5.00 × 10⁻³ | N.D. | protein | [38] | |||
| <5.00 × 10⁻³ | N.D. | [39] | ||||
| 3.00 × 10⁻² | N.D. | [37] | ||||
| SLC22A4 | 6583 | rs35260072 | 2.40 × 10⁻² | 4.80 × 10⁻² | DNA | [28] |
| rs1050152 | 2.40 × 10⁻² | 7.92 × 10⁻¹ | [7] | |||
| SLC22A5 | 6584 | rs35260072 | 2.40 × 10⁻² | 4.80 × 10⁻² | DNA | [28] |
| rs1050152 | 2.40 × 10⁻² | 7.92 × 10⁻¹ | [7] | |||
| rs2631372 | 2.60 × 10⁻² | 8.58 × 10⁻¹ | ||||
| long-term response | ||||||
| CCHCR1 | 54535 | rs1800629 | 4.90 × 10⁻² | 3.43 × 10⁻¹ | DNA | [47] |
| rs1799724 | 2.50 × 10⁻³ | 4.00 × 10⁻² | [29] | |||
| blood (blood eQTL, serum/PBMCs expression) | ||||||
| short-term response | ||||||
| AC116366.6 | N.A. | rs2522057 | 2.40 × 10⁻² | 4.80 × 10⁻² | DNA | [28] |
| rs35260072 | 2.40 × 10⁻² | 4.80 × 10⁻² | ||||
| rs1050152 | 2.40 × 10⁻² | 7.92 × 10⁻¹ | [7] | |||
| rs2631372 | 2.60 × 10⁻² | 8.58 × 10⁻¹ | ||||
| CRP | 1401 | N.A. | 2.00 × 10⁻² | N.D. | protein | [34] |
| 7.00 × 10⁻⁴ | [35] | |||||
| 1.50 × 10⁻² | [36] | |||||
| 4.00 × 10⁻² | [37] | |||||
| RPS23P10 | 100419471 | rs396991 | 3.00 × 10⁻³ | 3.00 × 10⁻³ | DNA | [23] |
| 2.10 × 10⁻² | 6.93 × 10⁻¹ | [7] | ||||
| SLC22A5 | 6584 | rs2522057 | 2.40 × 10⁻² | 4.80 × 10⁻² | DNA | [28] |
| rs35260072 | 2.40 × 10⁻² | 4.80 × 10⁻² | ||||
| rs1050152 | 2.40 × 10⁻² | 7.92 × 10⁻¹ | [7] | |||
| long-term response | ||||||
| TREM1 | 54210 | N.A. | 2.00 × 10⁻² | 2.00 × 10⁻² | RNA | [33] |
| 1.00 × 10⁻³ | 1.00 × 10⁻³ | protein | ||||
| GO ID | GO Term | Ontology Source | p-Value | Adjusted p-Value | % Assoc. Genes | Genes |
|---|---|---|---|---|---|---|
| GO analysis of the markers | ||||||
| GO:0015909 | long-chain fatty acid transport | BP | 4.28 × 10⁻⁶ | 4.28 × 10⁻⁶ | 3.53 | ACSL6, S100A8, S100A9 |
| GO:0030888 | regulation of B cell proliferation | BP | 3.84 × 10⁻⁶ | 7.69 × 10⁻⁶ | 3.66 | FCGR2C, S100A8, S100A9 |
| GO:0043030 | regulation of macrophage activation | BP | 2.70 × 10⁻⁶ | 8.11 × 10⁻⁶ | 4.11 | FCGR2C, S100A8, S100A9 |
| GO analysis of the extended interactome | ||||||
| GO:0015838 | amino-acid betaine transport | BP | 1.09 × 10⁻⁷ | 1.53 × 10⁻⁶ | 60.00 | PDZK1, SLC22A4, SLC22A5 |
| GO:0015879 | carnitine transport | BP | 1.09 × 10⁻⁷ | 1.53 × 10⁻⁶ | 60.00 | PDZK1, SLC22A4, SLC22A5 |
| GO:0015697 | quaternary ammonium group transport | BP | 3.81 × 10⁻⁷ | 4.95 × 10⁻⁶ | 42.86 | PDZK1, SLC22A4, SLC22A5 |
| GO:0015695 | organic cation transport | BP | 3.92 × 10⁻⁶ | 4.70 × 10⁻⁵ | 21.43 | PDZK1, SLC22A4, SLC22A5 |
| GO:0030165 | PDZ domain binding | MF | 8.88 × 10⁻⁶ | 9.76 × 10⁻⁵ | 6.90 | PDZK1, PTEN, SLC22A4, SLC22A5 |
| GO:0072337 | modified amino-acid transport | BP | 1.42 × 10⁻⁵ | 1.42 × 10⁻⁴ | 14.29 | PDZK1, SLC22A4, SLC22A5 |
| GO:0015696 | ammonium transport | BP | 3.84 × 10⁻⁵ | 3.46 × 10⁻⁴ | 10.34 | PDZK1, SLC22A4, SLC22A5 |
| GO:0008180 | COP9 signalosome | CC | 1.88 × 10⁻⁴ | 5.64 × 10⁻⁴ | 6.12 | COPS5, GRB2, HSPA7 |
| GO:0042770 | signal transduction in response to DNA damage | BP | 7.67 × 10⁻⁵ | 6.13 × 10⁻⁴ | 4.00 | CASP9, GRB2, S100A8, S100A9 |
| GO:0001540 | amyloid-beta binding | MF | 9.47 × 10⁻⁵ | 6.63 × 10⁻⁴ | 7.69 | CRYAB, FCGR2A, FCGR2C |
| GO:0006898 | receptor-mediated endocytosis | BP | 1.88 × 10⁻⁴ | 7.51 × 10⁻⁴ | 3.17 | ARRB1, FCGR2A, FCGR2C, GRB2 |
| GO:0090342 | regulation of cell aging | BP | 1.36 × 10⁻⁴ | 8.17 × 10⁻⁴ | 6.82 | NUAK1, S100A8, S100A9 |
| GO:2001235 | positive regulation of apoptotic signalling pathway | BP | 1.71 × 10⁻⁴ | 8.55 × 10⁻⁴ | 3.25 | CYLD, PTEN, S100A8, S100A9 |
| GO:0007569 | cell aging | BP | 1.12 × 10⁻³ | 1.12 × 10⁻³ | 3.33 | NUAK1, S100A8, S100A9 |
| GO:0008630 | intrinsic apoptotic signalling pathway in response to DNA damage | BP | 6.61 × 10⁻⁴ | 1.32 × 10⁻³ | 4.00 | CASP9, S100A8, S100A9 |
| GO ID | GO Term | Ontology Source | p-Value | Adjusted p-Value | % Assoc. Genes | Genes |
|---|---|---|---|---|---|---|
| GO Analysis of the Markers | ||||||
| GO:0090322 | regulation of superoxide metabolic process | BP | 1.38 × 10⁻⁹ | 2.48 × 10⁻⁸ | 22.73 | CRP, LTBR, PARK7, TGFB1, TNF |
| GO:0048545 | response to steroid hormone | BP | 3.05 × 10⁻⁹ | 4.88 × 10⁻⁸ | 4.94 | DEFA1, DEFA1B, DEFA3, GNA12, PARK7, RBM6, TGFB1, TNF |
| GO:0071396 | cellular response to lipid | BP | 2.97 × 10⁻⁹ | 5.04 × 10⁻⁸ | 3.01 | CXCL8, DEFA1, DEFA1B, DEFA3, GNA12, PARK7, RBM6, TGFB1, TLR4, TNF |
| GO:2000379 | positive regulation of reactive oxygen species metabolic process | BP | 2.46 × 10⁻⁷ | 3.70 × 10⁻⁶ | 8.47 | CRP, LTBR, PARK7, TGFB1, TNF |
| GO:0051701 | interaction with host | BP | 4.37 × 10⁻⁷ | 6.12 × 10⁻⁶ | 4.76 | CXCL8, DEFA1, DEFA1B, SLC22A5, TGFB1, TRIM38 |
| GO:0002227 | innate immune response in mucosa | BP | 5.89 × 10⁻⁷ | 7.66 × 10⁻⁶ | 13.79 | DEFA1, DEFA1B, DEFA3, RBM6 |
| GO:0071383 | cellular response to steroid hormone stimulus | BP | 8.14 × 10⁻⁷ | 9.77 × 10⁻⁶ | 4.29 | DEFA1, DEFA1B, DEFA3, GNA12, PARK7, RBM6 |
| GO:0030518 | intracellular steroid hormone receptor signalling pathway | BP | 5.05 × 10⁻⁶ | 5.56 × 10⁻⁵ | 4.63 | DEFA1, DEFA1B, DEFA3, PARK7, RBM6 |
| GO:0019731 | antibacterial humoral response | BP | 6.98 × 10⁻⁶ | 6.98 × 10⁻⁵ | 7.55 | DEFA1, DEFA1B, DEFA3, RBM6 |
| GO:0032930 | positive regulation of superoxide anion generation | BP | 7.99 × 10⁻⁶ | 7.19 × 10⁻⁵ | 17.65 | CRP, LTBR, TGFB1 |
| GO:0031640 | killing of cells of other organism | BP | 1.31 × 10⁻⁵ | 1.05 × 10⁻⁴ | 6.45 | DEFA1, DEFA1B, DEFA3, RBM6 |
| GO:0061844 | antimicrobial humoral immune response mediated by antimicrobial peptide | BP | 2.38 × 10⁻⁵ | 1.66 × 10⁻⁴ | 5.56 | DEFA1, DEFA1B, DEFA3, RBM6 |
| GO:0035821 | modification of morphology or physiology of other organism | BP | 3.02 × 10⁻⁵ | 1.81 × 10⁻⁴ | 3.21 | DEFA1, DEFA1B, DEFA3, RBM6, TGFB1 |
| GO:0044003 | modification by symbiont of host morphology or physiology | BP | 3.78 × 10⁻⁵ | 1.89 × 10⁻⁴ | 10.71 | DEFA1, DEFA1B, DEFA3, RBM6, TGFB1 |
| GO:0032677 | regulation of interleukin-8 production | BP | 7.08 × 10⁻⁵ | 2.83 × 10⁻⁴ | 4.21 | DEFA1, DEFA1B, TGFB1 |
| GO:0071260 | cellular response to mechanical stimulus | BP | 1.81 × 10⁻⁴ | 3.63 × 10⁻⁴ | 6.38 | DEFA1, DEFA1B, TGFB1 |
| GO:0071222 | cellular response to lipopolysaccharide | BP | 1.44 × 10⁻⁴ | 4.31 × 10⁻⁴ | 3.51 | CRP, PARK7, TLR4, TNF |
| GO:1901224 | positive regulation of NIK/NF-kappaB signalling | BP | 4.33 × 10⁻⁴ | 4.33 × 10⁻⁴ | 4.76 | FAS, LTBR, TLR4 |
© 2019 by the authors. Licensee MDPI, Basel, Switzerland. This article is an open access article distributed under the terms and conditions of the Creative Commons Attribution (CC BY) license (http://creativecommons.org/licenses/by/4.0/).
Share and Cite
Gole, B.; Potočnik, U. Pre-Treatment Biomarkers of Anti-Tumour Necrosis Factor Therapy Response in Crohn’s Disease—A Systematic Review and Gene Ontology Analysis. Cells 2019, 8, 515. https://doi.org/10.3390/cells8060515
Gole B, Potočnik U. Pre-Treatment Biomarkers of Anti-Tumour Necrosis Factor Therapy Response in Crohn’s Disease—A Systematic Review and Gene Ontology Analysis. Cells. 2019; 8(6):515. https://doi.org/10.3390/cells8060515
Chicago/Turabian StyleGole, Boris, and Uroš Potočnik. 2019. "Pre-Treatment Biomarkers of Anti-Tumour Necrosis Factor Therapy Response in Crohn’s Disease—A Systematic Review and Gene Ontology Analysis" Cells 8, no. 6: 515. https://doi.org/10.3390/cells8060515
APA StyleGole, B., & Potočnik, U. (2019). Pre-Treatment Biomarkers of Anti-Tumour Necrosis Factor Therapy Response in Crohn’s Disease—A Systematic Review and Gene Ontology Analysis. Cells, 8(6), 515. https://doi.org/10.3390/cells8060515