1. Introduction
Dysfunction of oligodendrocytes (OLs), the cells responsible for neuron myelin sheath formation, is suggested as one of the most important factors underlying the incomplete remyelination in multiple sclerosis (MS) pathology. In the course of relapsing-remitting MS (RR-MS) there are observed acute attacks (relapses) followed by a period of partial withdrawal of symptoms (remission) [
1]. Relapse mainly involves the brain areas previously affected by the disease that leads to gradual accumulation of irreversible impairment due to extended local demyelination [
2]. The crucial cause of slowly progressing, irreversible disease-related disability is a renewal of only fragmentary tissue [
3].
Although some studies highlighted the participation of oligodendrocytes (OLs) as the principle cells responsible for neuron myelin sheath formation, their critical role in incomplete remyelination in MS pathology is still not clarified [
3,
4]. In adults, oligodendroglia precursor cells (OPCs) constitute approximately 6% of the CNS total cell number and are abundant throughout the gray matter of CNS, where they generate new OLs during remyelination [
5,
6]. The structure of new myelin sheaths formed in remyelinating lesions is thinner than during development [
7]. Disproportions in myelin proteins, myelin basic protein (MBP), myelin oligodendrocyte glycoprotein (MOG), and proteolipid protein (PLP) can explain the observed phenomenon. Recent studies demonstrated that approximately 70% of lesions contained progenitors or premyelinating OLs characterized by inability to differentiate into mature cells [
8,
9]. Thus, the deficiency in myelin synthesis by OLs is thought to be mediated at the early stages of OPC differentiation, probably during migration to the inflammatory site. For its effectiveness, two consecutive processes must occur within a strictly defined period. First, OPCs should be recruited to the demyelinating lesion and then growth factors and cytokines should create a specific environment, which is necessary for directed progenitor differentiation.
The presence of inflammatory cells was revealed in MS lesions regardless of the clinical diagnosis [
2]. Recently, we identified a new subpopulation of myelin-specific CD49d
+CD154
+ lymphocytes in the peripheral blood of RR-MS patients during remission that proliferated in vitro in response to myelin peptides. These lymphocytes possessed the unique ability to migrate towards maturing oligodendrocyte precursor cells (OPCs) and synthetize proinflammatory chemokines/cytokines [
10]. In this study, we explored the role of MS myelin-specific CD49d
+CD154
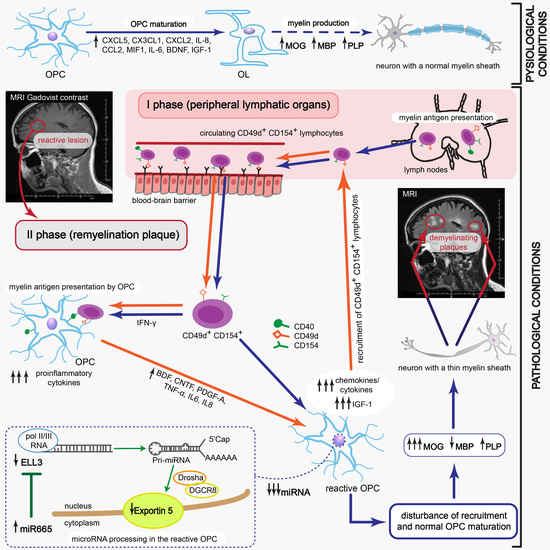
+ lymphocytes in dysregulating remyelination by affecting the transcriptional and post-transcriptional processing of OPC maturation. We demonstrated that myelin-specific lymphocytes induced OPC reprogramming for immune-reactive OLs with impaired myelin synthesis which fueled ongoing accumulation and activation of lymphocytes. This positive feedback reaction loop is critical in creating remyelinating plaques to become more susceptible to reattack contrary to unaffected brain tissue, resulting in deterioration of existing lesions and increased severity of MS symptoms within each new relapse.
2. Materials and Methods
2.1. Human Subjects
All participants of the study were diagnosed and recruited at the Department of Neurology, Medical University of Lodz. Ten patients (six females, four males; aged 43.2) diagnosed with RR-MS according to the McDonald criteria 2010 [
11] were enrolled into the study during disease remission. Mean disease duration was 5.4 years and mean time from last relapse was eight months. Relapse was defined as the appearance of new neurological signs or worsening of pre-existing ones after a minimum 30 days of clinical stability. Remission was defined as minimum three months of neurological stabilization after last relapse. None of the patients received systemic steroids or other anti-inflammatory or immunosuppressive drugs for at least three months prior to the study. For the control group, ten healthy volunteers matched by age and sex were recruited. A total of 20 mL of peripheral blood was collected from the patients during remission phase of the disease and healthy controls (HC). The study was approved by the Ethics Committee of the Medical University of Lodz (RNN/44/14/KE and RNN/28/18/KE), and informed consent was obtained from each participant of the study.
2.2. Experimental Autoimmune Encephalomyelitis (EAE) Mouse Model
For the mouse model of MS, C57Bl/6 mice were housed and maintained in an accredited facility, the Animal Core Department of the Medical University of Lodz. Six to eight-week-old female C57Bl/6 mice were injected with MOG
35-55 (NH2-MEVGWYRSPFSRVVHLYRNGK-COOH) in complete Freund adjuvant (CFA) subcutaneously [
12,
13,
14]. On day 0, each mouse received 0.25 mL of 0.15 mg mixture of dissolved MOG
35-55 in 0.1 mL of PBS and 0.75 mg of
Mycobacterium tuberculosis in 0.15 mL of CFA, injected in four abdominal sites. The blood–brain barrier (BBB) was damaged by using 0.2 µg Pertussis toxin (Sigma-Aldrich, St. Louis, MO, USA) injected into a tail vein on days 0 and 2. Mice were observed for neurologic signs of EAE and were scored using the scale 0–5 as follows: 0—nondisease; 1—weak tail or wobbly walk; 2—hind limb paralysis; 3—forelimbs paralysis; 4—hind and forelimb paralysis; 5—death or euthanasia for ethical reasons. On day 14–15 (peak of the disease) or three weeks after the peak (remyelination period), mice were sacrificed and sampled to further analysis. All experiments were approved by the Medical University Ethics Committee (12/ŁB702/2014).
2.3. Human Cell Model of Progenitor Cell Differentiation to Mature Myelin-Producing Oligodendrocytes
A human oligodendroglia cell line MO3.13 (OLs, Tebu-bio, Le Perray En Yvelines, Rambouillet, France) was used as the model of progenitor cell differentiation to mature myelin-producing OLs. We chose the MO3.13 cell line, which differentiates after phorbol 12-myristate 13-acetate (PMA) stimulation, as the most adequate model of OPC maturation. Contrary to other OL lines (HOG or KG-1C), during maturation, MO3.13 cells exhibited the strongest similarity to primary human OLs in morphology as well as in gene and protein expression [
15]. OLs were cultured in DMEM high glucose medium supplemented with 10% fetal bovine serum, 1% penicillin–streptomycin and maintained at 37 °C with 5% CO
2 in humidified atmosphere. The cultures were conducted in 75 cm
2 flasks (Nunc, Thermo Scientific, Waltham, MA, USA). After reaching 80% confluence, cells were passaged by using a 0.25% trypsin–EDTA solution in total three times for a week with a dilution factor of 1/8. To induce OPC maturation, Phorbol 12-Myristate 13-Acetate was added (0.1 mM) for 72 h and cells were incubated at 37 °C with 5% CO
2 in humidified atmosphere. All reagents used for culturing were purchased from Sigma-Aldrich.
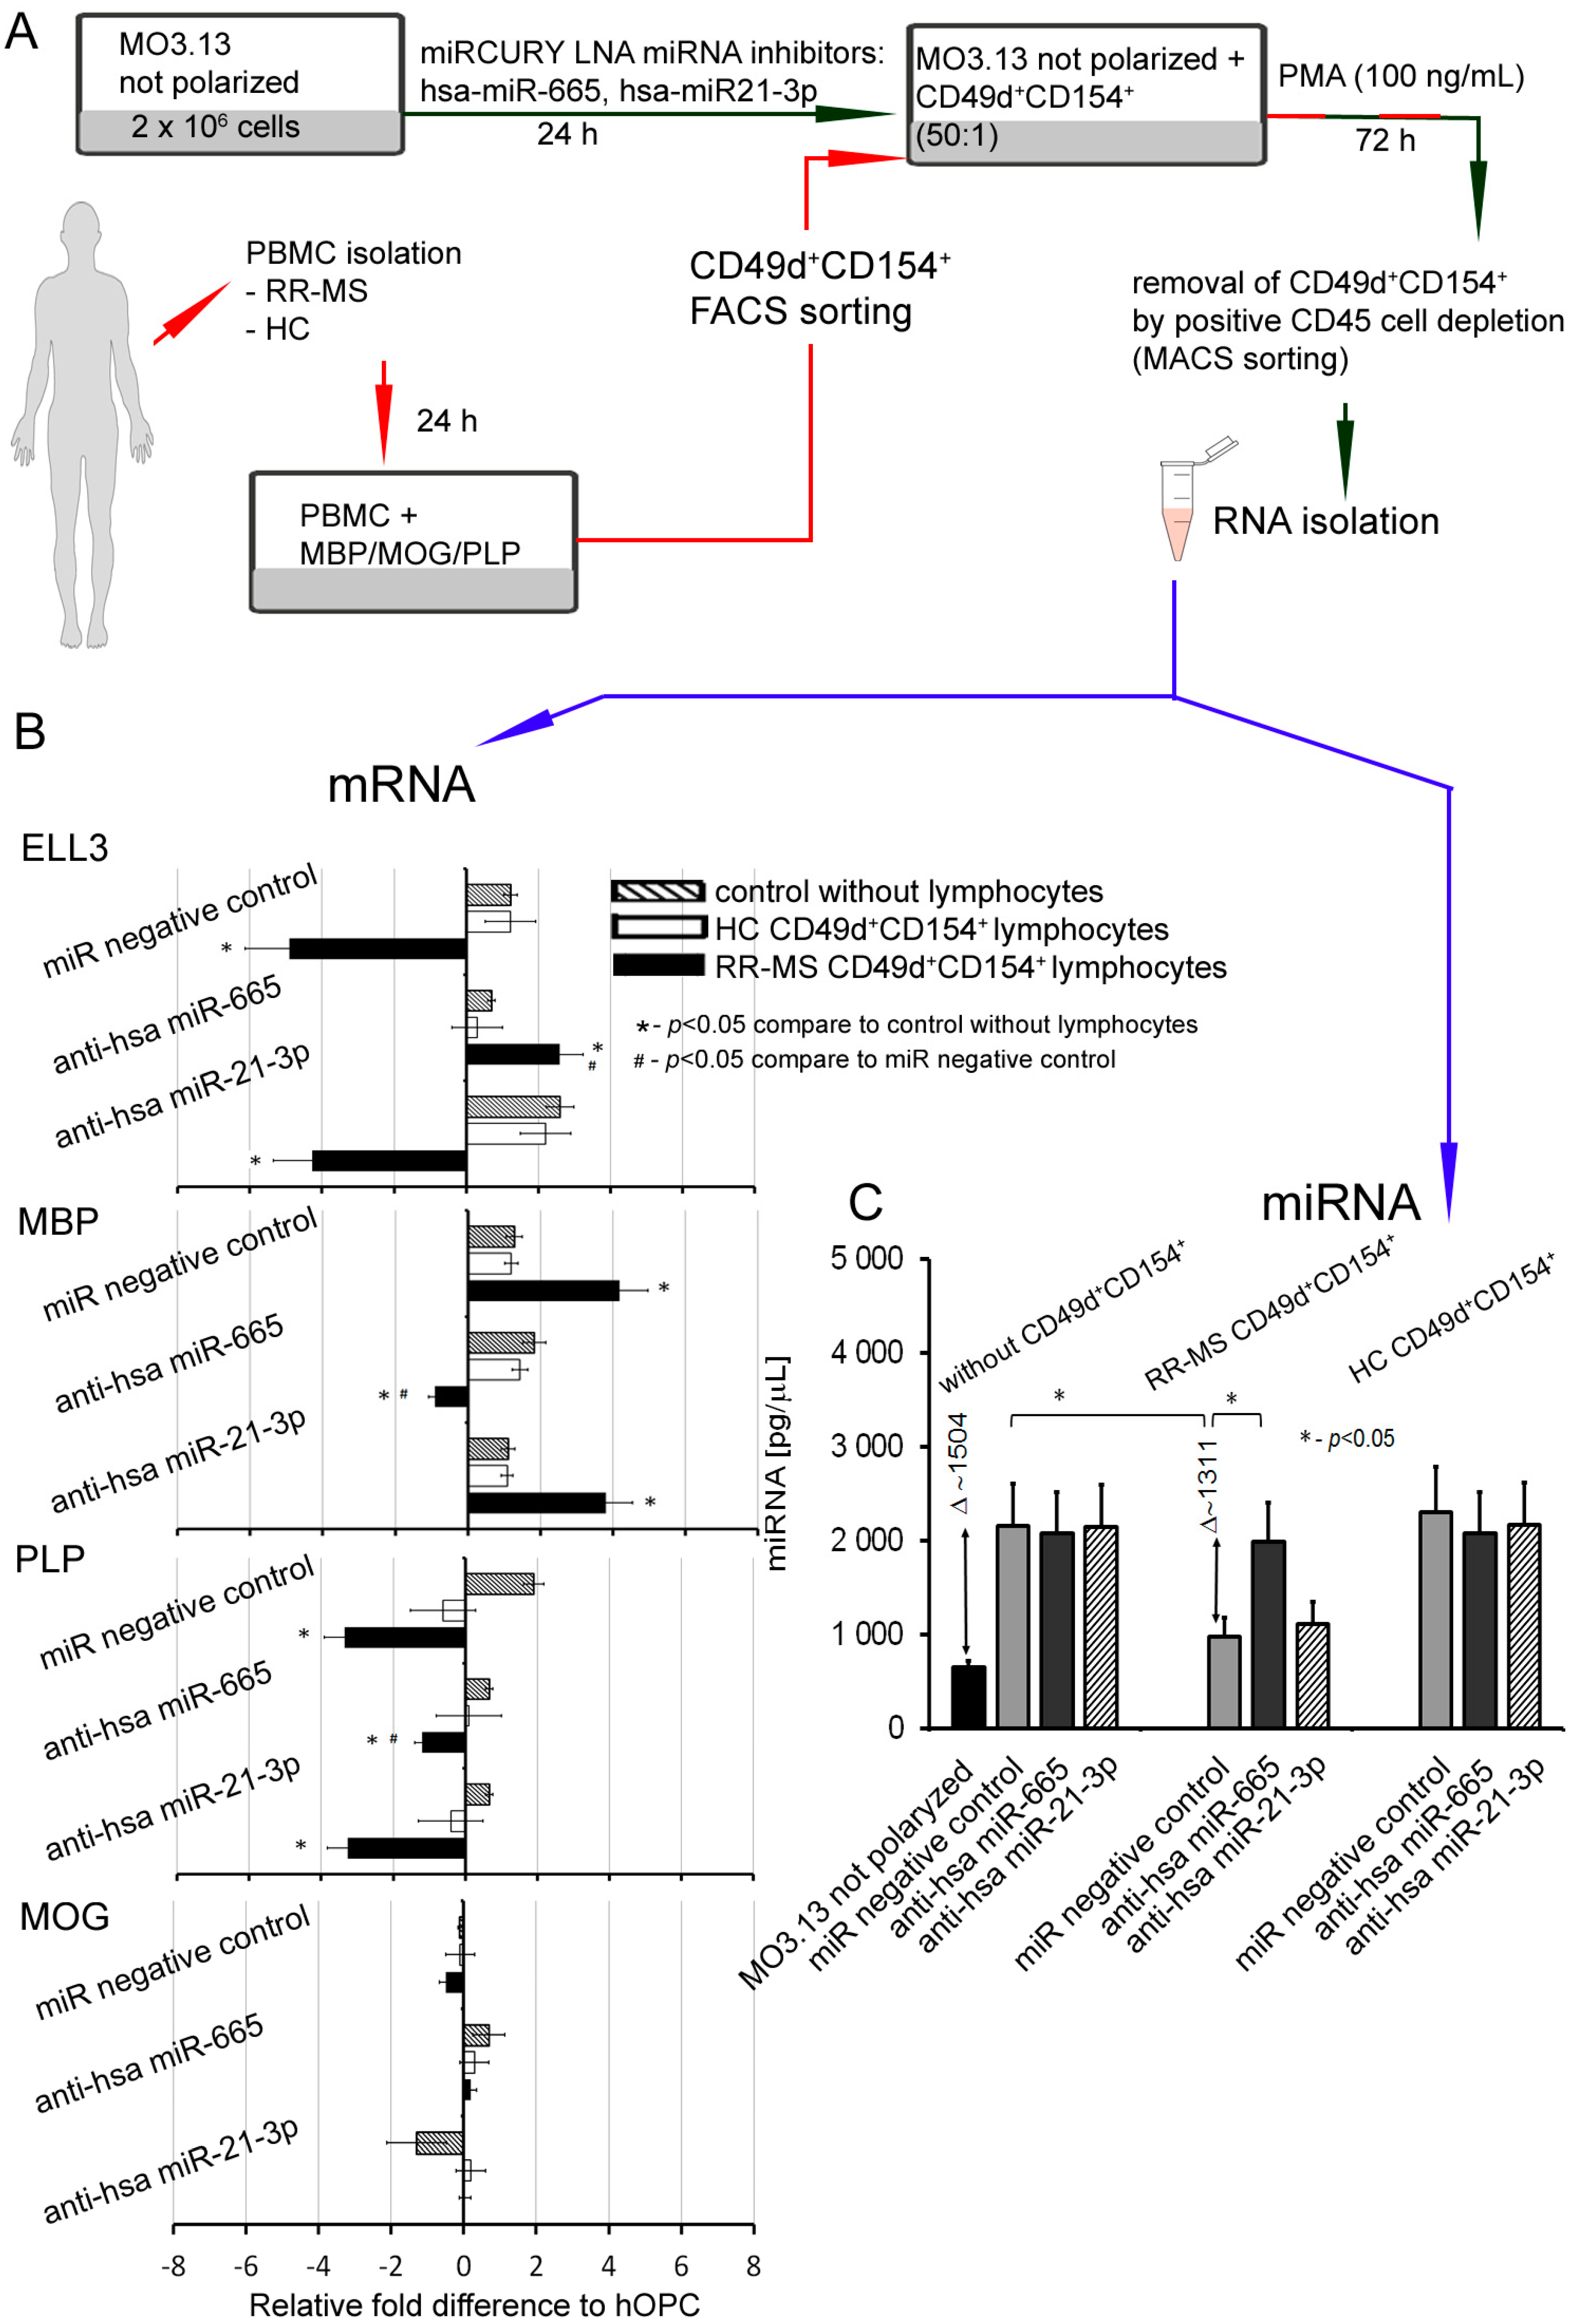
2.4. MO3.13 Transfection
A total of 6 × 10⁵ MO3.13 cells were seeded on six-well culture plates (37 °C, 5% CO2) one day before transfection to achieve suitable confluence. For transfection, X-treme GENE 9 Reagent (Roche) was used. Cells were transfected with 50 nM miRCURY LNA inhibitors: hsa-miR-21-3p, hsa-miR-665, hsa-miR-21-3p with hsa-miR-665, and Negative Control A which does not recognize any human gene (Exiqon, Vedbæk, Denmark). After 48 h incubation (37 °C, 5% CO2), RR-MS myelin-specific CD49d+CD154+ lymphocytes or HC lymphocytes were added to transfected MO3.13 cells stimulated with PMA (100 nM). After 72 h incubation (37 °C, 5% CO2), cells were separated using CD45 MicroBeads (Miltenyi Biotec, Bergisch Gladbach, Germany).
2.5. RR-MS CD49d+CD154+ Lymphocyte Sorting
Peripheral blood mononuclear cells (PBMCs) were isolated by density centrifugation over Lymphoprep (Axis-Shield, Oslo, Norway) according to manual instruction. PBMCs were stimulated by adding mixture of peptides: proteolipid protein (PLP139-151 NH2-HSLGKWLGHPDKF-COOH; pepPLP), myelin oligodendrocyte glycoprotein (MOG35-55 (NH2-MEVGWYRSPFSRVVHLYRNGK-COOH; pepMOG) and myelin basic protein (MBP85-99 NH2-VHFFKNIVTPRTPPP-COOH; pepMBP) (each 25 μg/mL) for 21 h (37°C, 5% CO2 in humidified atmosphere). Following the incubation, cells were washed and labelled with 5 μg/mL CD154-PE (clone 89–76, BD Biosciences, San Jose, CA, USA) and CD49d-FITC (clone 9F10, BD Biosciences, San Jose, CA, USA) mAbs for 30 min at 4 °C. CD49d+CD154+ population was isolated by FACS sorting procedure using a FACSAria with purity mask mode (BD Biosciences, San Jose, CA, USA). The purity of FACS-sorted CD49d+CD154+ cell fraction assessed by two-color flow cytometry was ~99.5%.
2.6. hOPC–Lymphocyte Coculture
To examine the effect of myelin-specific CD49d+CD154+ lymphocytes on OPC differentiation, 4 × 10⁴ lymphocytes were added to 2 × 10⁶ OPCs (1:50) which were seeded on six-well plates 24 h earlier. PMA (phorbol 12-myristate 13-acetate), an artificial stimulator of OPC differentiation, was added (0.1 mM) to culture in DMEM high glucose medium supplemented with 5% FBS, 1% penicillin–streptomycin at 37 °C with 5% CO2 for 72 h. After incubation, supernatants were collected and cells were washed in DPBS. For further OL analysis, lymphocytes were removed by antihuman CD45 MicroBeads (Miltenyi Biotec, Bergisch Gladbach, Germany). Lymphocytes were attached to the magnetically polarized side of the Eppendorf tube and OLs remained at the tube’s bottom. These procedures allowed us to avoid OL activation during flowing through the magnetic column. OLs were transferred into a new tube, washed, and the dry pellet was frozen in −80 °C for NGS mRNA and miRNA ddPCR analysis.
2.7. Isolation of EAE Mouse Memory CD19+ and CD3+ Brain-Infiltrating Lymphocytes
Mice were perfused intracardially with PBS before the brain dissection and homogenization. Brain mononuclear cells (BMCs) were isolated using 37–70% (v/v) Percoll gradients. Three weeks after the peak of the disease, EAE BMCs were separated by magnetic microbeads in a two-step procedure: positive selection of memory CD19+ cells (mCD19+) (Memory B Cell Isolation Kit, Miltenyi Biotec, Bergisch Gladbach, Germany) followed by negative selection of CD3+ cells from the remaining unlabeled cells (Pan T cell isolation kit II, Miltenyi Biotec, Bergisch Gladbach, Germany). Four brain tissues were pooled for each experiment. BMC purity and phenotype were analyzed by LSRII flow cytometry (BD) using conjugated anti-B220 (clone RA3-6B2, BioLegend, San Diego, CA, USA), TCR-β (clone H57-597, BioLegend, San Diego, CA, USA), CD3 (clone 17A2, BioLegend, San Diego, CA, USA), CD19 (clone 1D3, Abcam, Cambridge, UK), and appropriate isotype control monoclonal antibodies (mAbs).
2.8. Neonatal Mouse Oligodendrocyte Precursor Cell (OPC) Isolation
OPCs were prepared from one-day-old neonatal mouse pup brains. Mice were anaesthetized and brains were removed from the skull cavity. Subsequently, the cortex was rinsed with HBSS, cut and digested by trypsin (0.25%) and DNase I (0.005%) for 15 min (shaking every 5 min). After that, the blocking buffer was added to the tissue and centrifuged at 100× g for 2 min. The samples were washed, suspended in DMEM/F12 (supplemented with 10% FBS and streptomycin–penicillin) and cultured for 10 days (37 °C, 5% CO2, humid atmosphere). Next, the flasks were shaken at 90 rpm for 40 min to remove microglia, and incubated for next four days with DMEM/F12 medium (supplemented with 3% FBS, 10 μg/mL biotin, 5 μg/mL insulin, N2 and penicillin/streptomycin). All reagents used for culture were purchased from Sigma-Aldrich. The medium was changed every three days following 2–3 weeks. The isolation correctness, purity, and cell differentiation were estimated by O4 (clone O4, R&D Systems, Minneapolis, MN, USA), Nestin (clone Poly18419, BioLegend, San Diego, CA, USA), MOG (clone D10, Santa Cruz Biotechnology, Dallas, TX, USA), and GFAP (clone H50, Santa Cruz Biotechnology, Dallas, TX, USA), expression by immunocytochemical (ICC) analysis, as well as morphology shape in differential contrast microscopy (DIC) examination.
2.9. Coculture of Mouse OPCs with EAE CD3+ and mCD19+ Cells
To examine the effect of EAE CD3+ and mCD19+ BMCs on mOPC maturation, 4 × 10⁴ lymphocytes, seeded on six-well plates 24 h earlier, were added to 2 × 10⁶ OPCs (1:50). Cells were cultured in DMEM high glucose medium containing: PMA (0.1 mM), 5% fetal bovine serum, and 1% penicillin–streptomycin at 37 °C with 5% CO2 in humidified atmosphere for 7 2 h (all reagents purchased from Sigma-Aldrich, St. Louis, MO, USA). After incubation, supernatants were collected and cell suspensions were washed in DPBS. Subsequently, lymphocytes were removed by magnetic antimouse CD45 MicroBead (Miltenyi Biotec, Bergisch Gladbach, Germany), as described in the experiment with human cells.
2.10. OPC Viability and Apoptosis
The influence of mice and human lymphocytes on OPC viability was assessed using three independent methods, which allowed analysis of OPC morphology, apoptosis/necrosis, and cell lysis.
2.10.1. DIC Microscopy
The visualization of live cell interactions between lymphocytes and OPCs was performed on eight-well glass chamber slides (Nalge Nunc International, Waltham, MA, USA). During the course of 21 h, lymphocyte–OPC interactions were imaged at five time points (0, 1, 3, 5, and 7 h intervals) with a Zeiss Axiovert 200 inverse microscope with a Zeiss LD Plan-Neofluar 40×/0.62 Ph2 Korr differential interference contrast objective (Göttingen, Germany).
2.10.2. OPC Apoptosis
The binding of ANXV-FITC to phosphatidylserine was used as a sensitive measurement of OPC apoptosis. Additional staining with (PI) enabled to distinguish between early and late stage of apoptosis, as ANXV binds to both types of cells. After incubation of OPCs with lymphocytes, samples (100 μL) were washed twice in ice cold PBS without Ca+2/Mg+2 and incubated with ANXV-FITC and PI (BD Pharmingen) according to the manufacturer’s instructions. OPCs were identified and gated on the SSC/FSC dot plot and analyzed by flow cytometry.
2.10.3. Lactate Dehydrogenase (LDH) Release Assay
LDH release was measured by colorimetric method using Cytotoxicity Detection Kit (Sigma-Aldrich, St. Louis, MO, USA) according to the manufacturer’s instructions. The concentration of released LDH from 100% cell lysis (OLs lysed with 1% Triton X-100) was used as the positive control and supernatants from OLs supplemented with 10% PBS as negative control (spontaneous LDH release). The rate of lysed cells was calculated based on the normalization of each sample to the level of LDH released by positive control subtracted from negative control samples. All samples were analyzed in duplicate.
2.11. ELISA
Human BDNF, CNTF, PDGF subunit A, PDGF-Rα, FGF2, IGF-1 (all from Wuhan EIAab Science, Wuhan, China), sCD40 (Biorbyt, Cambridge, UK), MBP, PLP, and MOG (all from Biomatik, Wilmington, DE, USA) were measured in supernatants using ELISA Kits. The detection limits were as following: 0.33 pg/mL (BDNF and CNTF), 12 pg/mL (PDGFA and IGF-1), 0.045 ng/mL (PDGF-Rα), 1.56 pg/mL (FGF-2), 1.0 pg/mL (sCD40), 1.25 ng/mL (MBP), 0.056 ng/mL (PLP), and 0.054 ng/mL for MOG.
2.12. Immunocytochemical Analysis (ICC)
For ICC analysis, isolated cells were transferred to gelatin-coated microscope slides by cytospin (300×
g, 10 min) and fixed with 4% PFA for 20 min at 21 °C. Fixed cells were washed with PBS and blocked with 10% rabbit blocking serum (Santa Cruz Biotechnology, Dallas, TX, USA) supplemented with 3% Triton
TM X-100 (Sigma-Aldrich, St. Louis, MO, USA) for 45 min at 21 °C. Cells were washed and double stained for MBP/MOG, PLP/nestin, O4/phalloidin, GFAP/phalloidin and Ago2/Dicer1. Anti-MOG (mouse, Santa Cruz Biotechnology, Dallas, TX, USA), anti-O4 (clone O4, R&D Systems), anti-Nestin (rabbit, BioLegend, San Diego, CA, USA), anti-Dicer1 (clone F10, Santa Cruz Biotechnology, Dallas, TX, USA), phalloidin (F-actin)/TR (Invitrogen), anti-Ago2 (rabbit, Abcam, Cambridge, UK), anti-GFAP (clone H50, Santa Cruz Biotechnology, Dallas, TX, USA), and rat IgG2b (Invitrogen, Carlsbad, CA, USA) as negative isotype control, were used. All antibodies were suspended in PBS supplemented with 1.5% blocking rabbit serum, 0.3% Triton X-100, 0.01% sodium azide, and incubated overnight at 4 °C. Cells were washed and secondary fluorescent Abs were added for 1 h at RT: chicken pAb to rabbit TR (Santa Cruz Biotechnology, Dallas, TX, USA), goat pAbs to mouse FITC (Abcam, Cambridge, UK), goat pAbs to mouse TR (Abcam, Cambridge, UK), mouse to rabbit FITC (Santa Cruz Biotechnology, Dallas, TX, USA). For nuclei DNA staining, DAPI (1.5 μg/mL UltraCruz Mounting Medium, Santa Cruz Biotechnology, Dallas, TX, USA) was used. Images were acquired using confocal microscope Nikon D-Eclipse C1 and analyzed with EZ-C1 v. 3.6 software. Fluorescence intensity was determined as the average fluorescence (Avg. area), the sum of the fluorescence from all segments divided by the number of segments. The average fluorescence was calculated using at least twenty single cells taken from four independent experiments. The level of baseline fluorescence was established individually for each experiment. Nonspecific fluorescence (signal noise) was electronically diminished to the level when nonspecific signal was undetectable [
16].
2.13. CLARITY Brain Examination
CLARITY (Clear, Lipid-exchanged, Acrylamide-hybridized Rigid, Imaging/immunostaining compatible, Tissue hYdrogel) was performed according to RapiClear 1.55 Kit manufacturer’s instructions (SunJin Lab, Hsinchu City, Taiwan). Mice were anesthetized and perfused with ice-cold PBS (10 mL/min) and 4% PFA (10 mL/min). Brains and spinal cords were removed, placed into 20 mL of 4% PFA and incubated at 4 °C overnight. Next, brains and spinal cords were washed with PBS and transferred to 20% sucrose/PBS (w/v) for one day at 4 °C. Samples were placed into OCT Compound solution (Sakura Finetek, Torrance, CA, USA INC) and frozen overnight. Brains and spinal cords were washed with PBS, fixed with 4% PFA for 2 h at RT, washed again and treated with SCALEVIEW-A2 solution (Olympus Life Science) for two days. Subsequently, samples were transferred into ScaleB4 solution (8 M Urea with 0.1% Triton X-100) for 10 days being refreshed every 2–3 days and to working solution prepared by 3:2 diluting RapiClear® 1.55 with ScaleB4 for 4–7 days. After the CLARITY procedure, samples were prepared for immunofluorescence analysis. Primary Abs anti-ELL3 (rabbit, Bioss Antibodies, Woburn, MA, USA), Exportin 5 (clone A11, Santa Cruz Biotechnology, Dallas, TX, USA), and MBP (chicken, ThermoFisher Scientific, Waltham, MA, USA) were applied for 96 h at 37 °C, then washed with buffer containing 0.5 M boric acid with 0.1% Triton X-100 (pH 8.5) for 48 h. Secondary Abs goat antichicken/TR (ThermoFisher Scientific, Waltham, MA, USA), goat antimouse/AlexaFluorPlus 488 (ThermoFisher Scientific, Waltham, MA, USA), goat antirabbit/AlexaFluor 350 (ThermoFisher Scientific, Waltham, MA, USA) were applied at 1:300 each for 72 h at 37 °C, and rinsed several times over a 96 h period. At the time of imaging, tissues were transferred into imaging spacer (iSpacer, SunJin Lab, Hsinchu City, Taiwan) and immersed in working solution. Images were acquired using a Leica TCS SP8 confocal microscope with 25× CLARITY objective.
2.14. Total RNA Isolation and miRNA Concentration Analysis
Total RNA was extracted from human and mouse OPCs and OLs with mirVanaTM miRNA Kit (ThermoFisher Scientific, Waltham, MA, USA). After isolation, the miRNA level and the purity analysis were performed by Agilent small RNA Kit (2100 Bioanalyzer, Agilent 2100 expert software, Santa Clara, CA, USA). The data were shown as raw data of miRNA concentration (pg/mL) as well as the percentage of small RNA.
2.15. Microarray and Data Bioinformatic Analysis
RNA integrity number (RIN) was measured by Agilent Bioanalyzer technology to check RNA quality. Specific mRNA expression was analyzed using Affymetrix® GeneChip® AF-902120 Affymetrix Mouse Gene 2.1 ST microarray expression profiling. The hybridization data were analyzed using Transcriptome Analysis Console (TAC) Software (ThermoFisher Scientific, Waltham, MA, USA).
2.16. Quantitative Real-time PCR (qRT-PCR)
qRT-PCR was performed with TaqMan probes (ThermoFisher Scientific, Waltham, MA, USA) using a 7900 Real Time PCR System. A total of 1 µg of total RNA was transcribed to cDNA using SuperScript® VILOTM cDNA Synthesis Kit (ThermoFisher Scientific, Waltham, MA, USA). cDNA was amplified in the presence of specific TaqMan probes: MBP (UniGene: Hs00921945_m1), MOG (Hs01555268_m1), PLP (Hs00166914_m1), Dicer1 (Hs00229023_m1), Ago2 (Hs01085579_m1), ELL3 (Hs00228559_m1), Exp5 (Hs00382453_m1), β-actin (Hs00921945_g1) using TaqMan® Fast Advanced Master Mix (ThermoFisher Scientific, Waltham, MA, USA). The PCR reactions were performed on the 96-well plates using TaqMan® Fast Advanced Master Mix (ThermoFisher Scientific, Waltham, MA, USA). The reaction specificity was checked by melting curve analysis, and relative gene expression was determined by the ΔΔCT method.
2.17. miRNA Library Preparation and Next Generation Sequencing (NGS)
miRNA profiling of OLs was performed using NGS. The library preparation was done using the NEBNext
® Small RNA Library preparation kit (New England Biolabs, Ipswich, MA, USA). A total of 500 ng of total RNA isolated from OLs in each independent experiment was converted into the miRNA NGS library. Library preparation quality control was performed using Bioanalyzer 2100 and TapeStation 4200 (both Agilent). Based on the quality of the inserts and the concentration measurements, the libraries were pooled in equimolar ratios. The pool was size-selected using the LabChip XT (PerkinElmer, Waltham, MA, USA), aiming to select the fraction with the size corresponding to miRNA libraries (~145 nt). The library pools were quantified using the qPCR KAPA Library Quantification Kit (KAPA Biosystems, Indianapolis, IN, USA). Samples were analyzed on a NextSeq 500. Raw data was demultiplexed and FASTQ files for each sample were generated using the bcl2fastq software (Illumina Inc., San Diego, CA, USA) [
17].
2.18. Bioinformatic Analysis of NGS miRNA Data
miRNA bioinformatic data analysis was performed using reference annotation in homo sapiens GRCh37 and miRbase20 (
http://www.mirbase.org/). All samples passed quality control (higher Q-score than Q30). Mapping of the sequencing reads were classified as follows: 1. Out-mapped—not used in the analysis (polyA and PolyC homopolymers, ribosomal RNA mitochondrial chromosome, and the genome of phiX174); 2. Unmapped—reads that could not be alignment to reference genome; 3. Genome—reads that aligned to the reference genome in locations with unknown miRNAs or smallRNAs, including fragments of mRNA and lncRNA transcripts; 4. miRNA—reads mapped to miRBase; 5. smallRNA—reads mapped to smallRNA database; 6. predicted miRNA—prediction based on the sequence homology in another organism or by miRPara predictive algorithm [
18]. After mapping the data, counts of relevant entries in miRBase20 and the numbers of known microRNAs were calculated. The differential expression analysis was done using M-values normalization method (TMM normalization) by EdgeR statistical software package (Bioconductor,
http://www.bioconductor.org/) [
19]. NGS analysis was performed using Exiqon platform (Vedbaek, Denmark).
2.19. miRNA Target Analysis
Bioinformatics identification of hsa-miR-665, hsa-miR-21-3p, and hsa-miR-212-3p putative mRNA target sequences and functional classification of encoded proteins were performed based on a cooperative analysis of two predictive programs: miRSearch (
www.exiqon.com/miRSearch) and miRBase (
www.mirbase.org). The mirSVR score was used to classify the most important targets of miRNA which had the strongest affinity and the best matching to particular mRNA.
2.20. Validation of OL miRNA Expression with the Dropped Digital PCR System
miRNA quantification of miR-665, hsa-miR-21-3p, and hsa-miR-212-3p in OLs was done using specific TaqMan gene expression probes (UniGene Hs06637014_s1 for miR-665, 002438 for hsa-miR-21-3p and 000515 for hsa-miR-212-3p; all from Life Technologies, Carlsbad, USA) and the QX200 dropped digital PCR system (ddPCR, BioRad QuantaSoft Analysis Pro v.1.0.596 software, Hercules, CA, USA). ddPCR reactions were performed from additional cohort patients. The results were expressed as the number of miRNA copies per million cells.
2.21. Statistics
Arithmetic means and standard deviations were calculated for all parameters from at least four independent experiments. Statistical analysis of difference was performed using the one-way ANOVA test. Tukey’s test was used for multiple comparisons as a post-hoc test when statistical significances were identified in the ANOVA test. Statistical significance was set at p < 0.05.
4. Discussion
It is generally hypothesized that limited remyelination after MS relapse is associated with the incapability of OPCs to repopulate the area of demyelination, which is the effect of inhibitory factors and/or lack of stimuli required to generate remyelinating OLs in the area of demyelination [
25].
Our study provides the detailed explanation about the causes of inefficient production of myelin proteins. This phenomenon is related to the presence of brain-infiltrating myelin-specific CD49d+CD154+ lymphocytes in remyelinating zone during MS remission. Maturing OPCs are reprogrammed into immune reactive OLs that cannot efficiently produce myelin proteins, but instead of this, amplify recruitment and mediate proliferation of myelin-specific lymphocytes as a result of two different mechanisms. Firstly, these lymphocytes might migrate from the periphery, recruited by chemokines released within remyelinating plaque by maturating OPCs, and are intensely accelerated by interaction with immune-reactive OLs. Secondly, myelin-specific lymphocytes can proliferate following direct contact with myelin antigens presented by maturating OPCs, leading to the development of the resident RR-MS CD49d+CD154+ lymphocytes, which are not completely eliminated after active phase of disease and which can permanently affect the remyelination process.
Our previous data demonstrated that RR-MS CD49d
+CD154
+ lymphocytes are divided into CD3 and CD19 subpopulations (10:1) [
10]. As both populations of CD19
+ and CD3
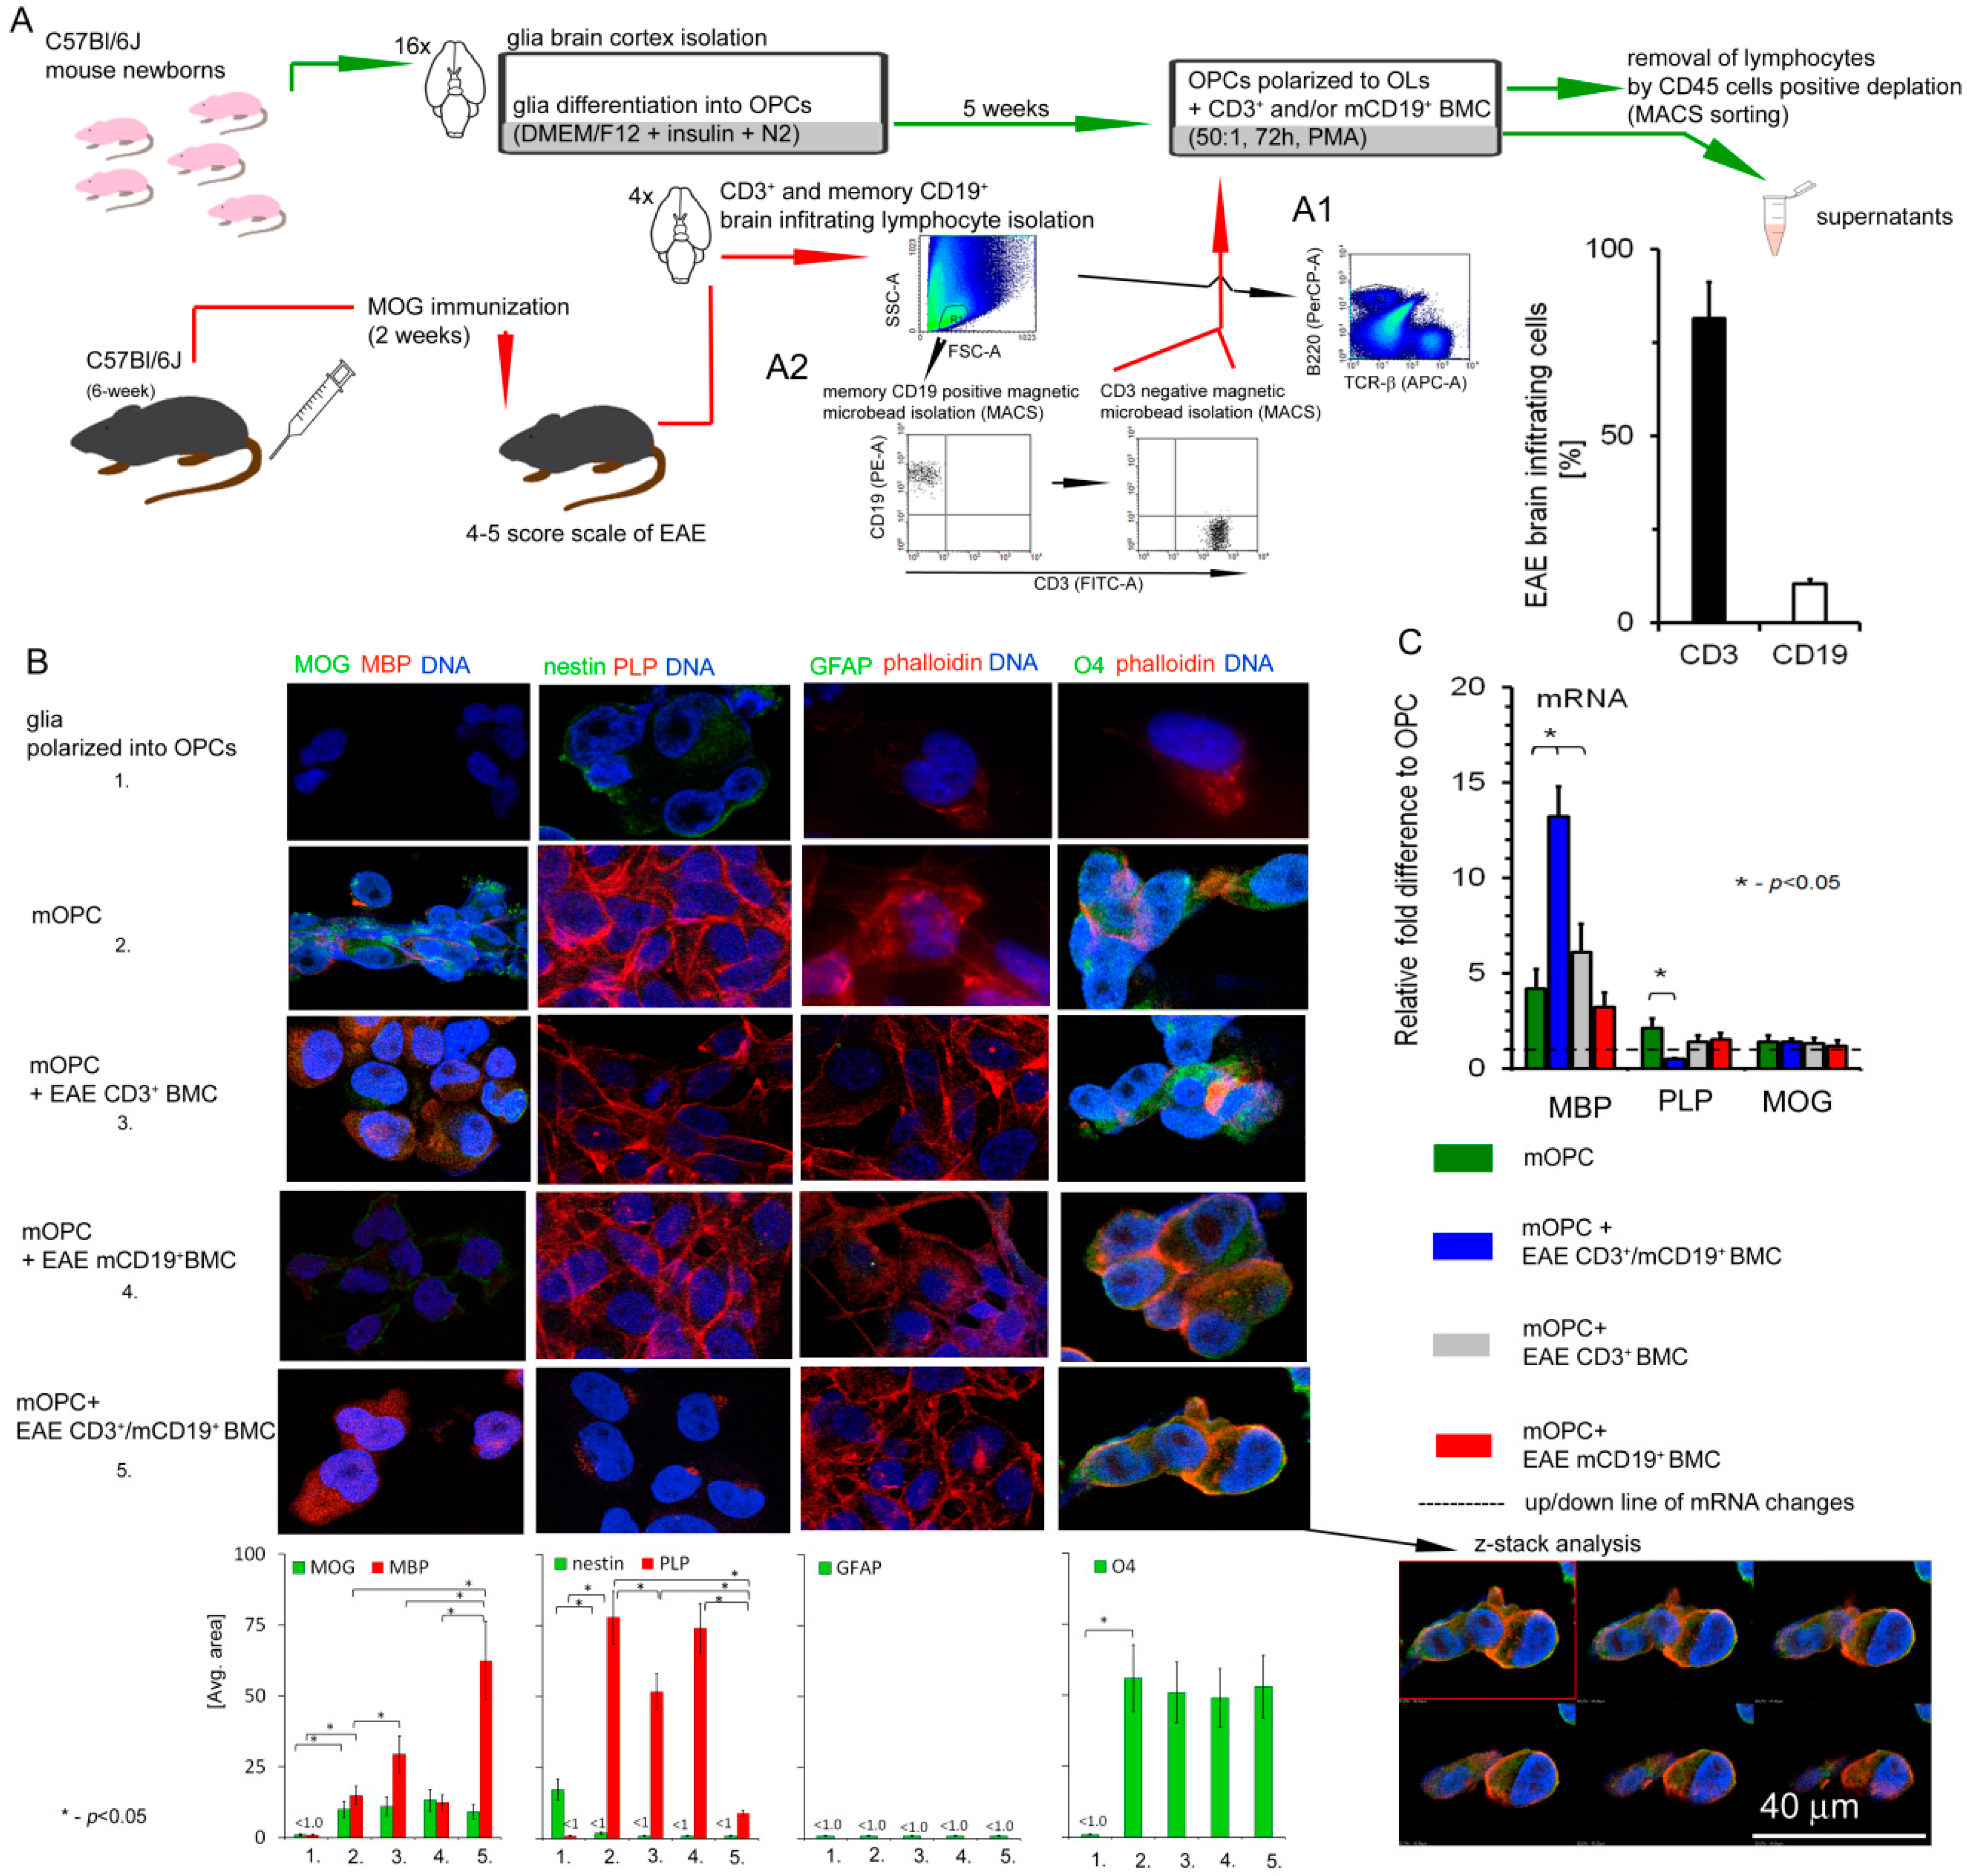
+ lymphocytes were strongly attracted by maturating OPCs, we investigated their particular roles in the induction of reactive OLs. Specifically, we showed that EAE CD3
+ and memory CD19
+ (mCD19
+) BMCs isolated during the remyelination phase cooperated in affecting MPB, PLP, and miRNA processing of protein production in OLs to a greater degree than CD3
+ alone. Moreover, mCD19
+ cells alone did not affect maturing OPCs at all, suggesting their influence on OPCs via supporting CD3
+. This is in concordance with previous data demonstrating HLA-DR-dependent autoproliferation of self-reactive brain-homing CD4
+ mediated by mCD19
+ cells [
26].
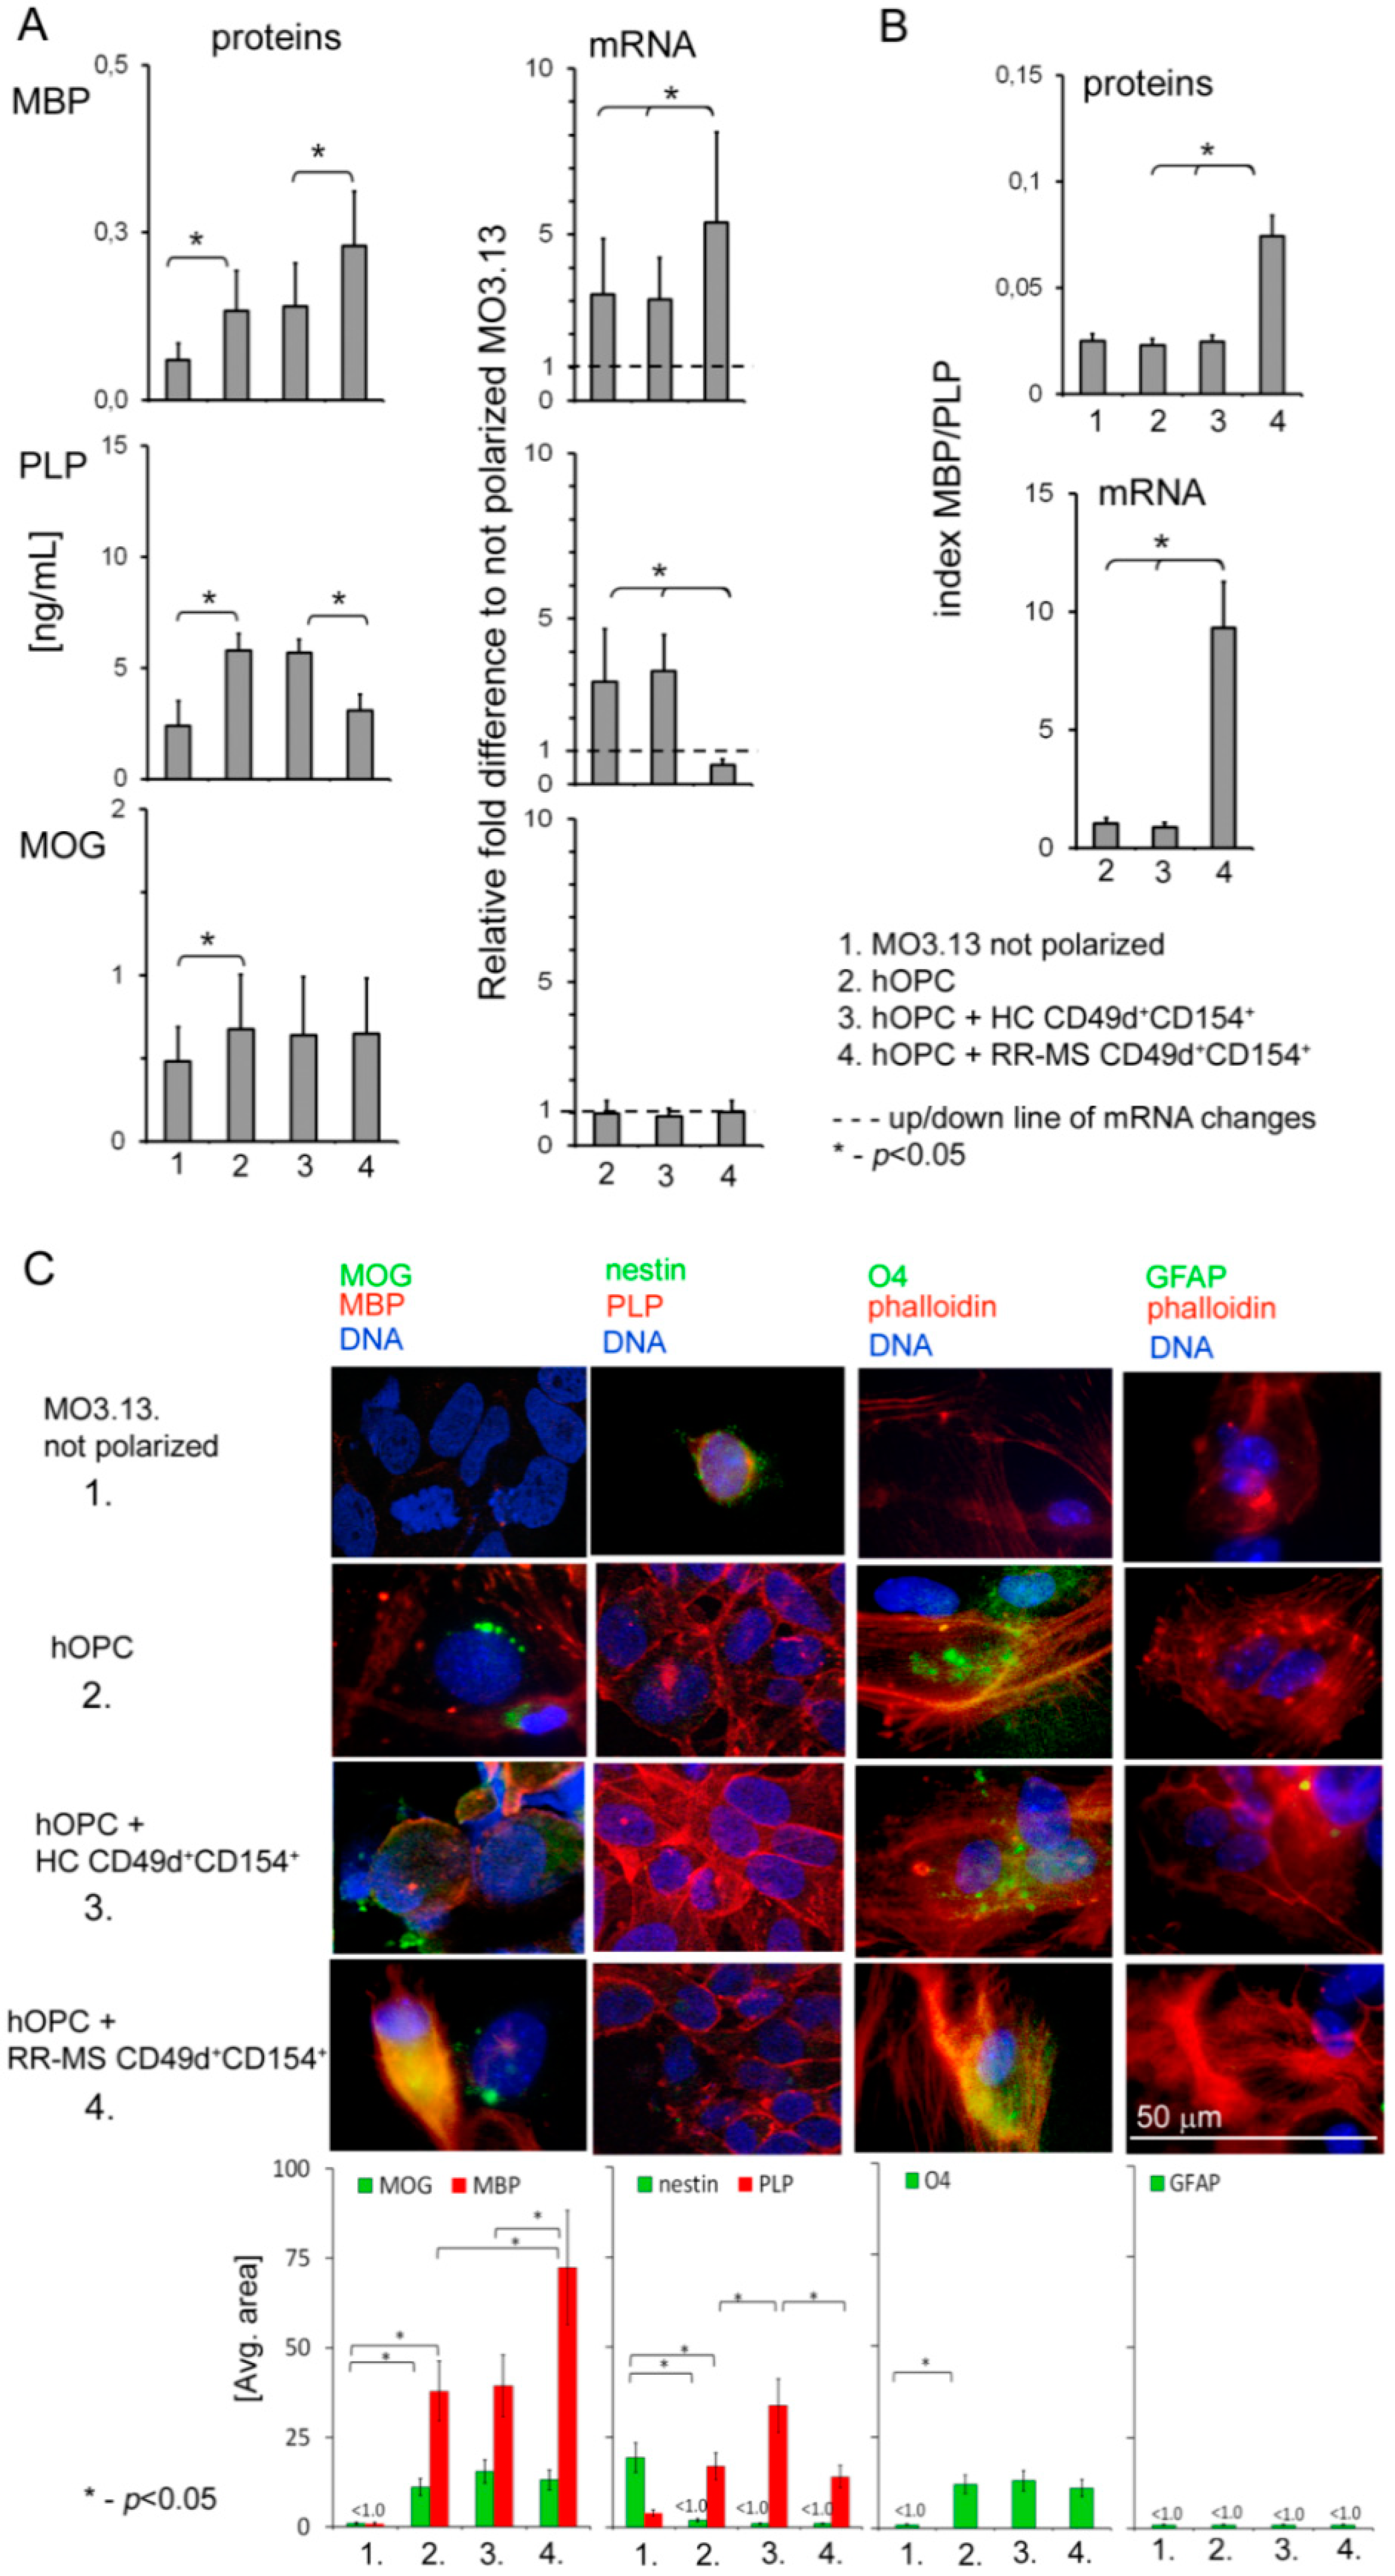
RR-MS CD49d
+CD154
+ cells affected the ratio of MBP/PLP produced by OLs and inhibited their spontaneous apoptosis. These changes are probably the effect of growth factors and cytokines/chemokines produced by RR-MS PBMCs exposed to myelin proteins. The role of these molecules in insufficient regeneration might be postulated, given that approximately 70% of MS lesions contain progenitor cells or premyelinating OLs that are characterized by the inability to differentiate to mature myelin-producing OLs. The other 30% of lesions contain only a few progenitors, suggesting inability to migrate towards the demyelinating zone [
8]. During physiological CNS reconstitution, growth factors FGF, IGF, CNTF, and PDGF are synthetized by perivascular astrocytes, and/or residual microglia/macrophages in normal-appearing grey matter, orchestrating maturation of OPCs and neurons [
9]. Presence of brain-infiltrating immune cells that produce growth factors can change this favorable environment. We revealed the high concentration of BDNF, CNTF, and PDGF-A in supernatants of RR-MS PBMCs cultured with myelin proteins. Our observations are in the line with previous studies demonstrating that EAE brain-infiltrating immune cells were characterized by increased PDGF-A synthesis [
27], and OPCs recruited towards the chronic-active lesions expressed IGFR1, FGFR1, and PDGFR1 growth factor receptors [
28]. Because OPCs produce BDNF, FGF-2, and IGF-1, the interpretation of the coculture results is problematic and the true source of these growth factors can only be speculated [
29]. As myelin proteins did not stimulate RR-MS PBMCs to produce IGF-1, its high concentration in the coculture might be a result of increased synthesis by maturating OPCs exposed to RR-MS CD49d
+CD154
+ lymphocytes. In this set of experiments, we also noted high concentrations of PDGF-A and its receptor. Since PDGF-A is not produced by maturating OPCs, but by myelin-stimulated RR-MS PBMCs, lymphocytes are probably the source of PDGF-A in the coculture [
30]. Increased shedding of PDGF-R-α in cocultures pointed to functional engagement of PDGF-A in modulation of maturating OPCs. Regardless of the growth factor source, a comparative analysis of OPC/RR-MS CD49d
+CD154
+ lymphocyte coculture confirmed the unique properties of MS lymphocytes in modifying the environment of remyelinating plaque.
Our data suggest that pathological deregulation of OPC maturation is executed at the post-transcriptional level, and is dependent on the miRNA activity. First, we analyzed the expression of transcriptional factors which are crucial for activation and polarization of adult OPCs in response to a brain tissue degeneration: TCF7L2 and SOX2 responsible for adult OPC activation; SFMBT2, MYC proto-oncogen protein, and E2F1 responsible for OPC differentiation and production of myelin proteins [
31,
32]. Using mRNA microarray analysis, we noted that none of them changed their expression in maturating OPCs cocultured with EAE BMC-derived CD3
+ and mCD19
+ cells. Therefore, we assumed that OPC–BMC interaction engaged post-transcriptional changes most likely dependent on the miRNA activity.
In fact, we demonstrated that maturing OPCs cocultured with RR-MS or EAE brain-derived lymphocytes were characterized by dysregulated miRNA synthesis. This seems to be a result of ELL3 downregulation, which controls elongation step of the miRNA synthesis by RNA polymerase II (pol II) [
33]. It is worthy to emphasize that the elongation step regulated by ELL3 is thought to be a critical stage for the regulation of gene expression, especially in stimulating lineage differentiation of embryonic stem cells [
34].
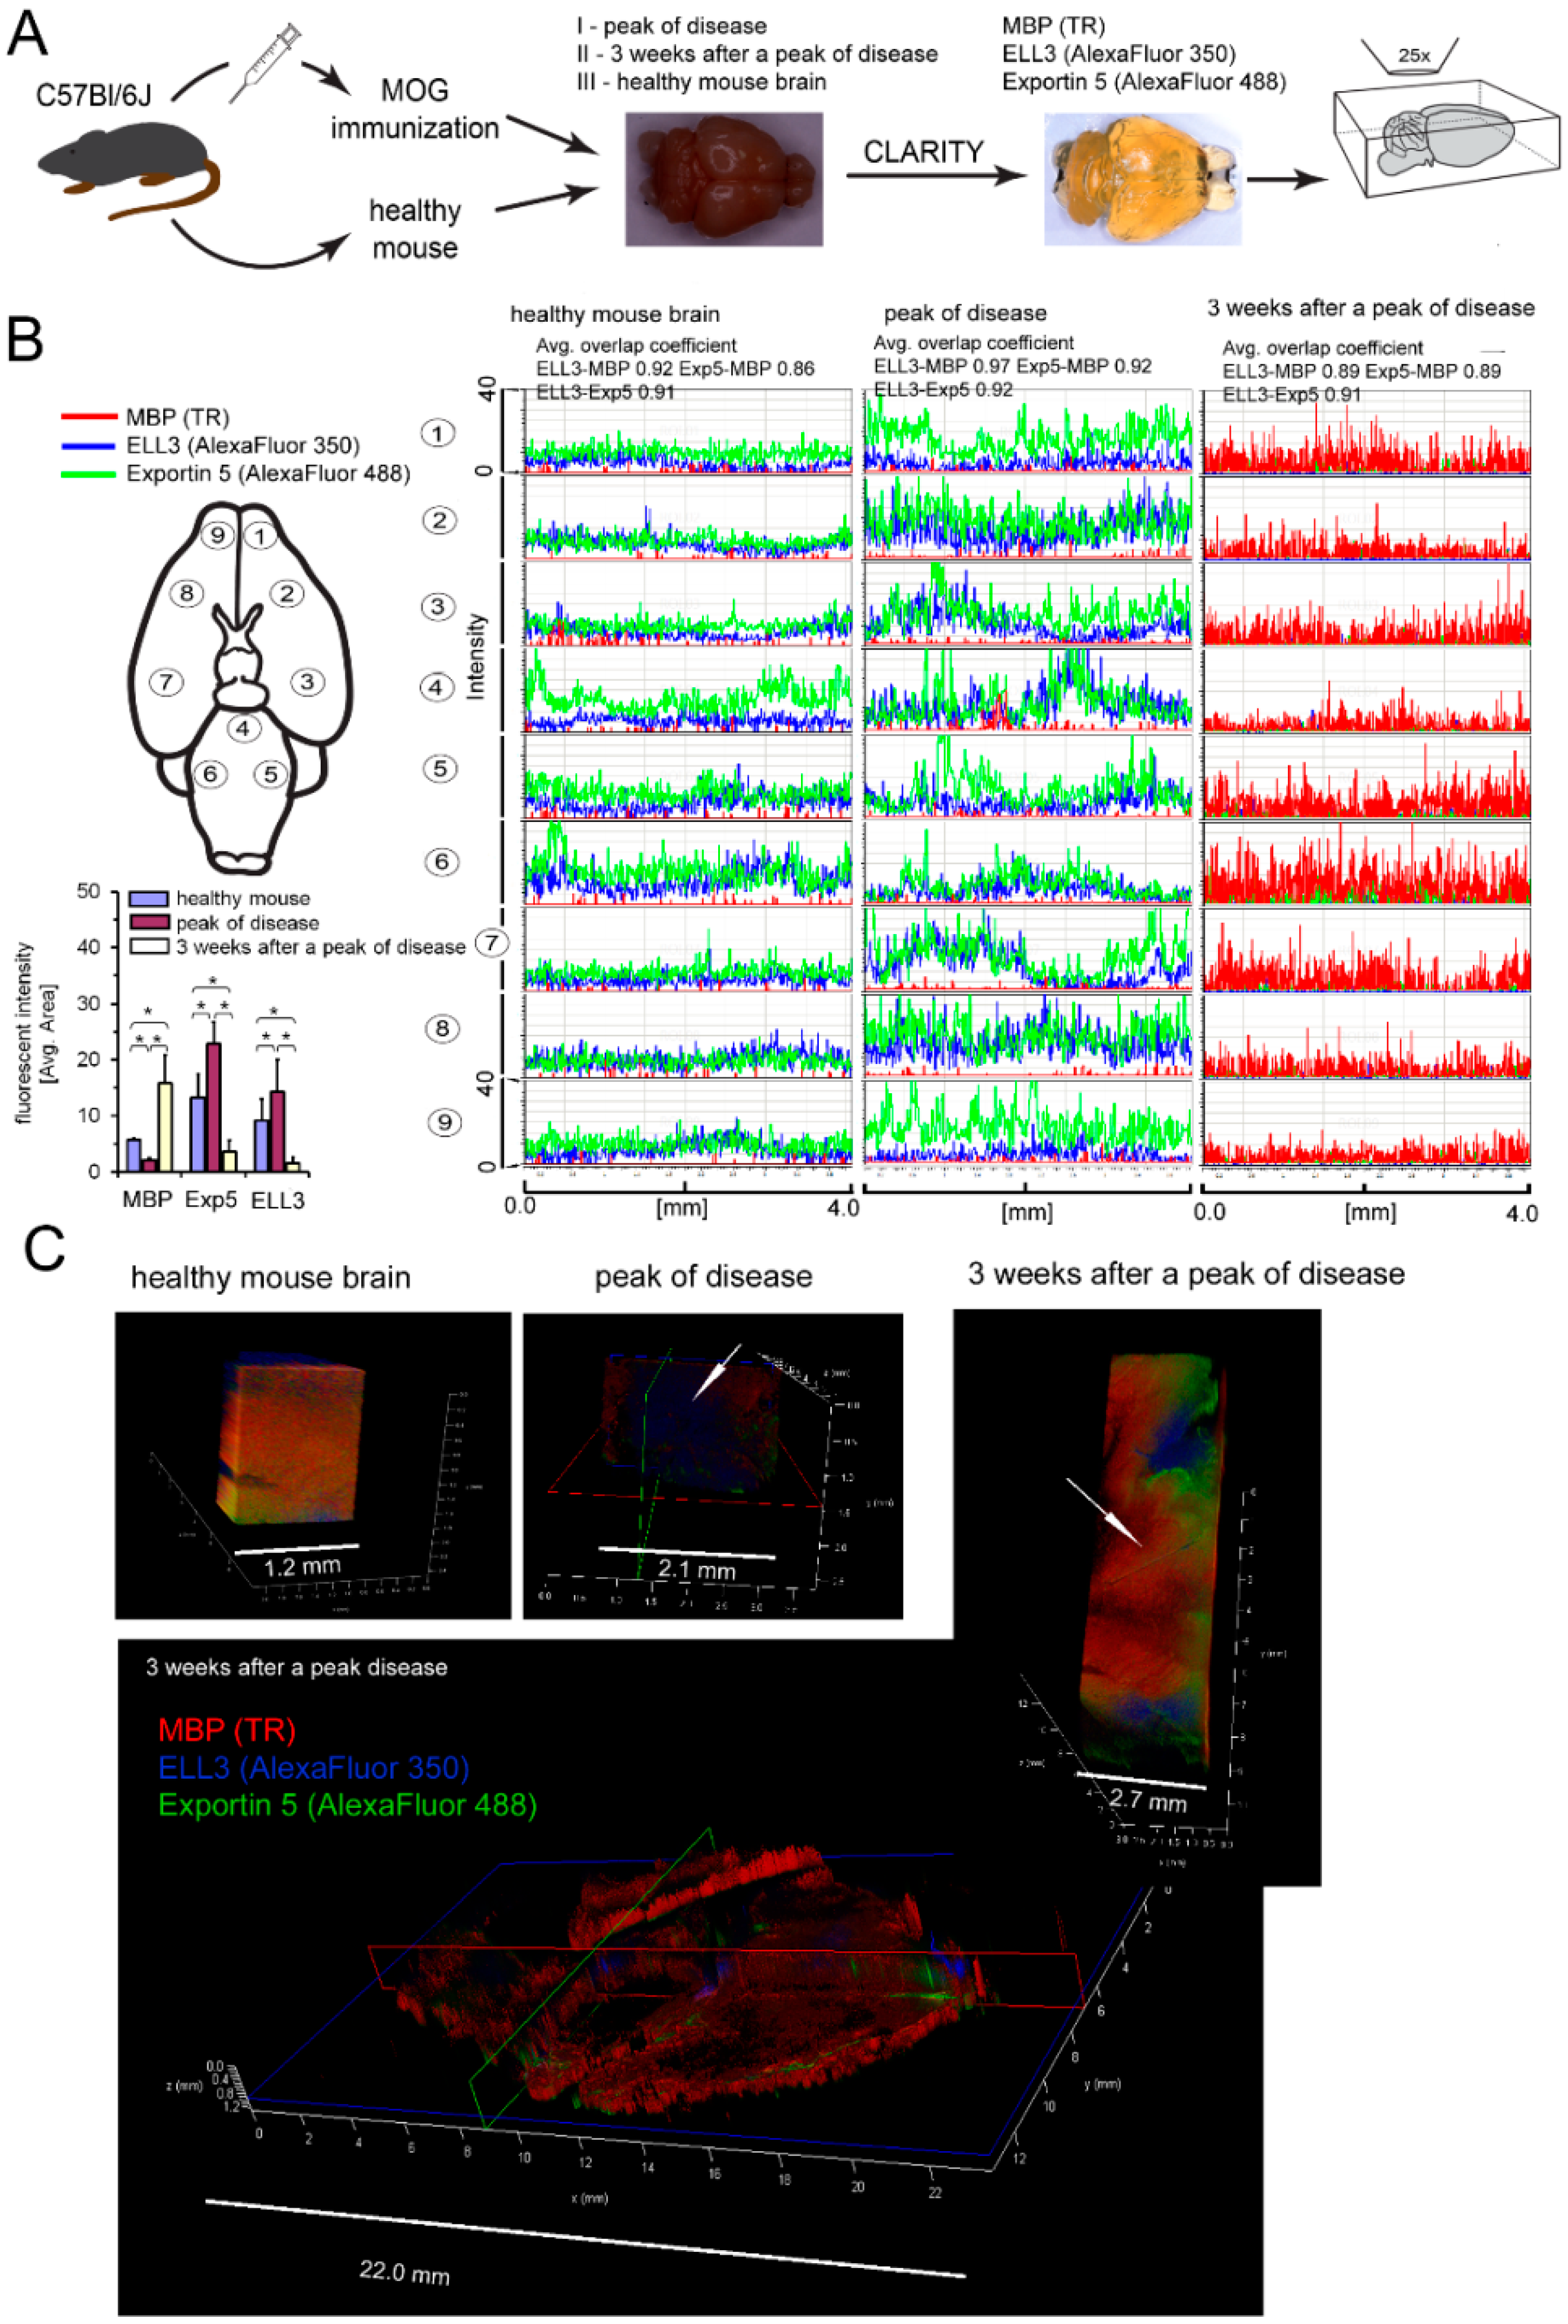
CLARITY analysis of ELL3, Exp5, and MBP proteins in the brains from EAE mice at the peak of the disease and three weeks later vs. healthy mouse brains confirmed our ex vivo findings. During remyelination, MBP was intensively synthetized, but ELL3 and Exp5 expression were reduced. Our experiments demonstrated a link between dysregulation of miRNA processing proteins at the early stages of miRNA synthesis and MBP overexpression. Downregulated miRNA synthesis was reflected by lower expression of miRNA biogenesis proteins. We found that downregulation of ELL3 was accompanied by low expression of Exp5, DICER1, and Ago2 (at mRNA and protein levels). Downregulation of Exp5 resulted in decreased DICER1 protein through a post-transcriptional mechanism that was associated with nuclear accumulation of DICER1 mRNA and its interaction with Exp5 mRNA [
35]. Although the role of Ago2, as the limiting factor for miRNA biogenesis is well-known, its overexpression in humans leads to the increase of total mature miRNA [
23,
36,
37], no data is available about the reversed effect—the total miRNA level on the Ago2 expression. The last question we addressed was about the direct cause of ELL3 downregulation in maturating OPCs exposed to lymphocytes present in the remyelinating plaques. Transcriptional miRNAs are controlled in a feedback loop reaction where transcriptional factors, that regulate specific miRNAs, are themselves the targets for those miRNAs [
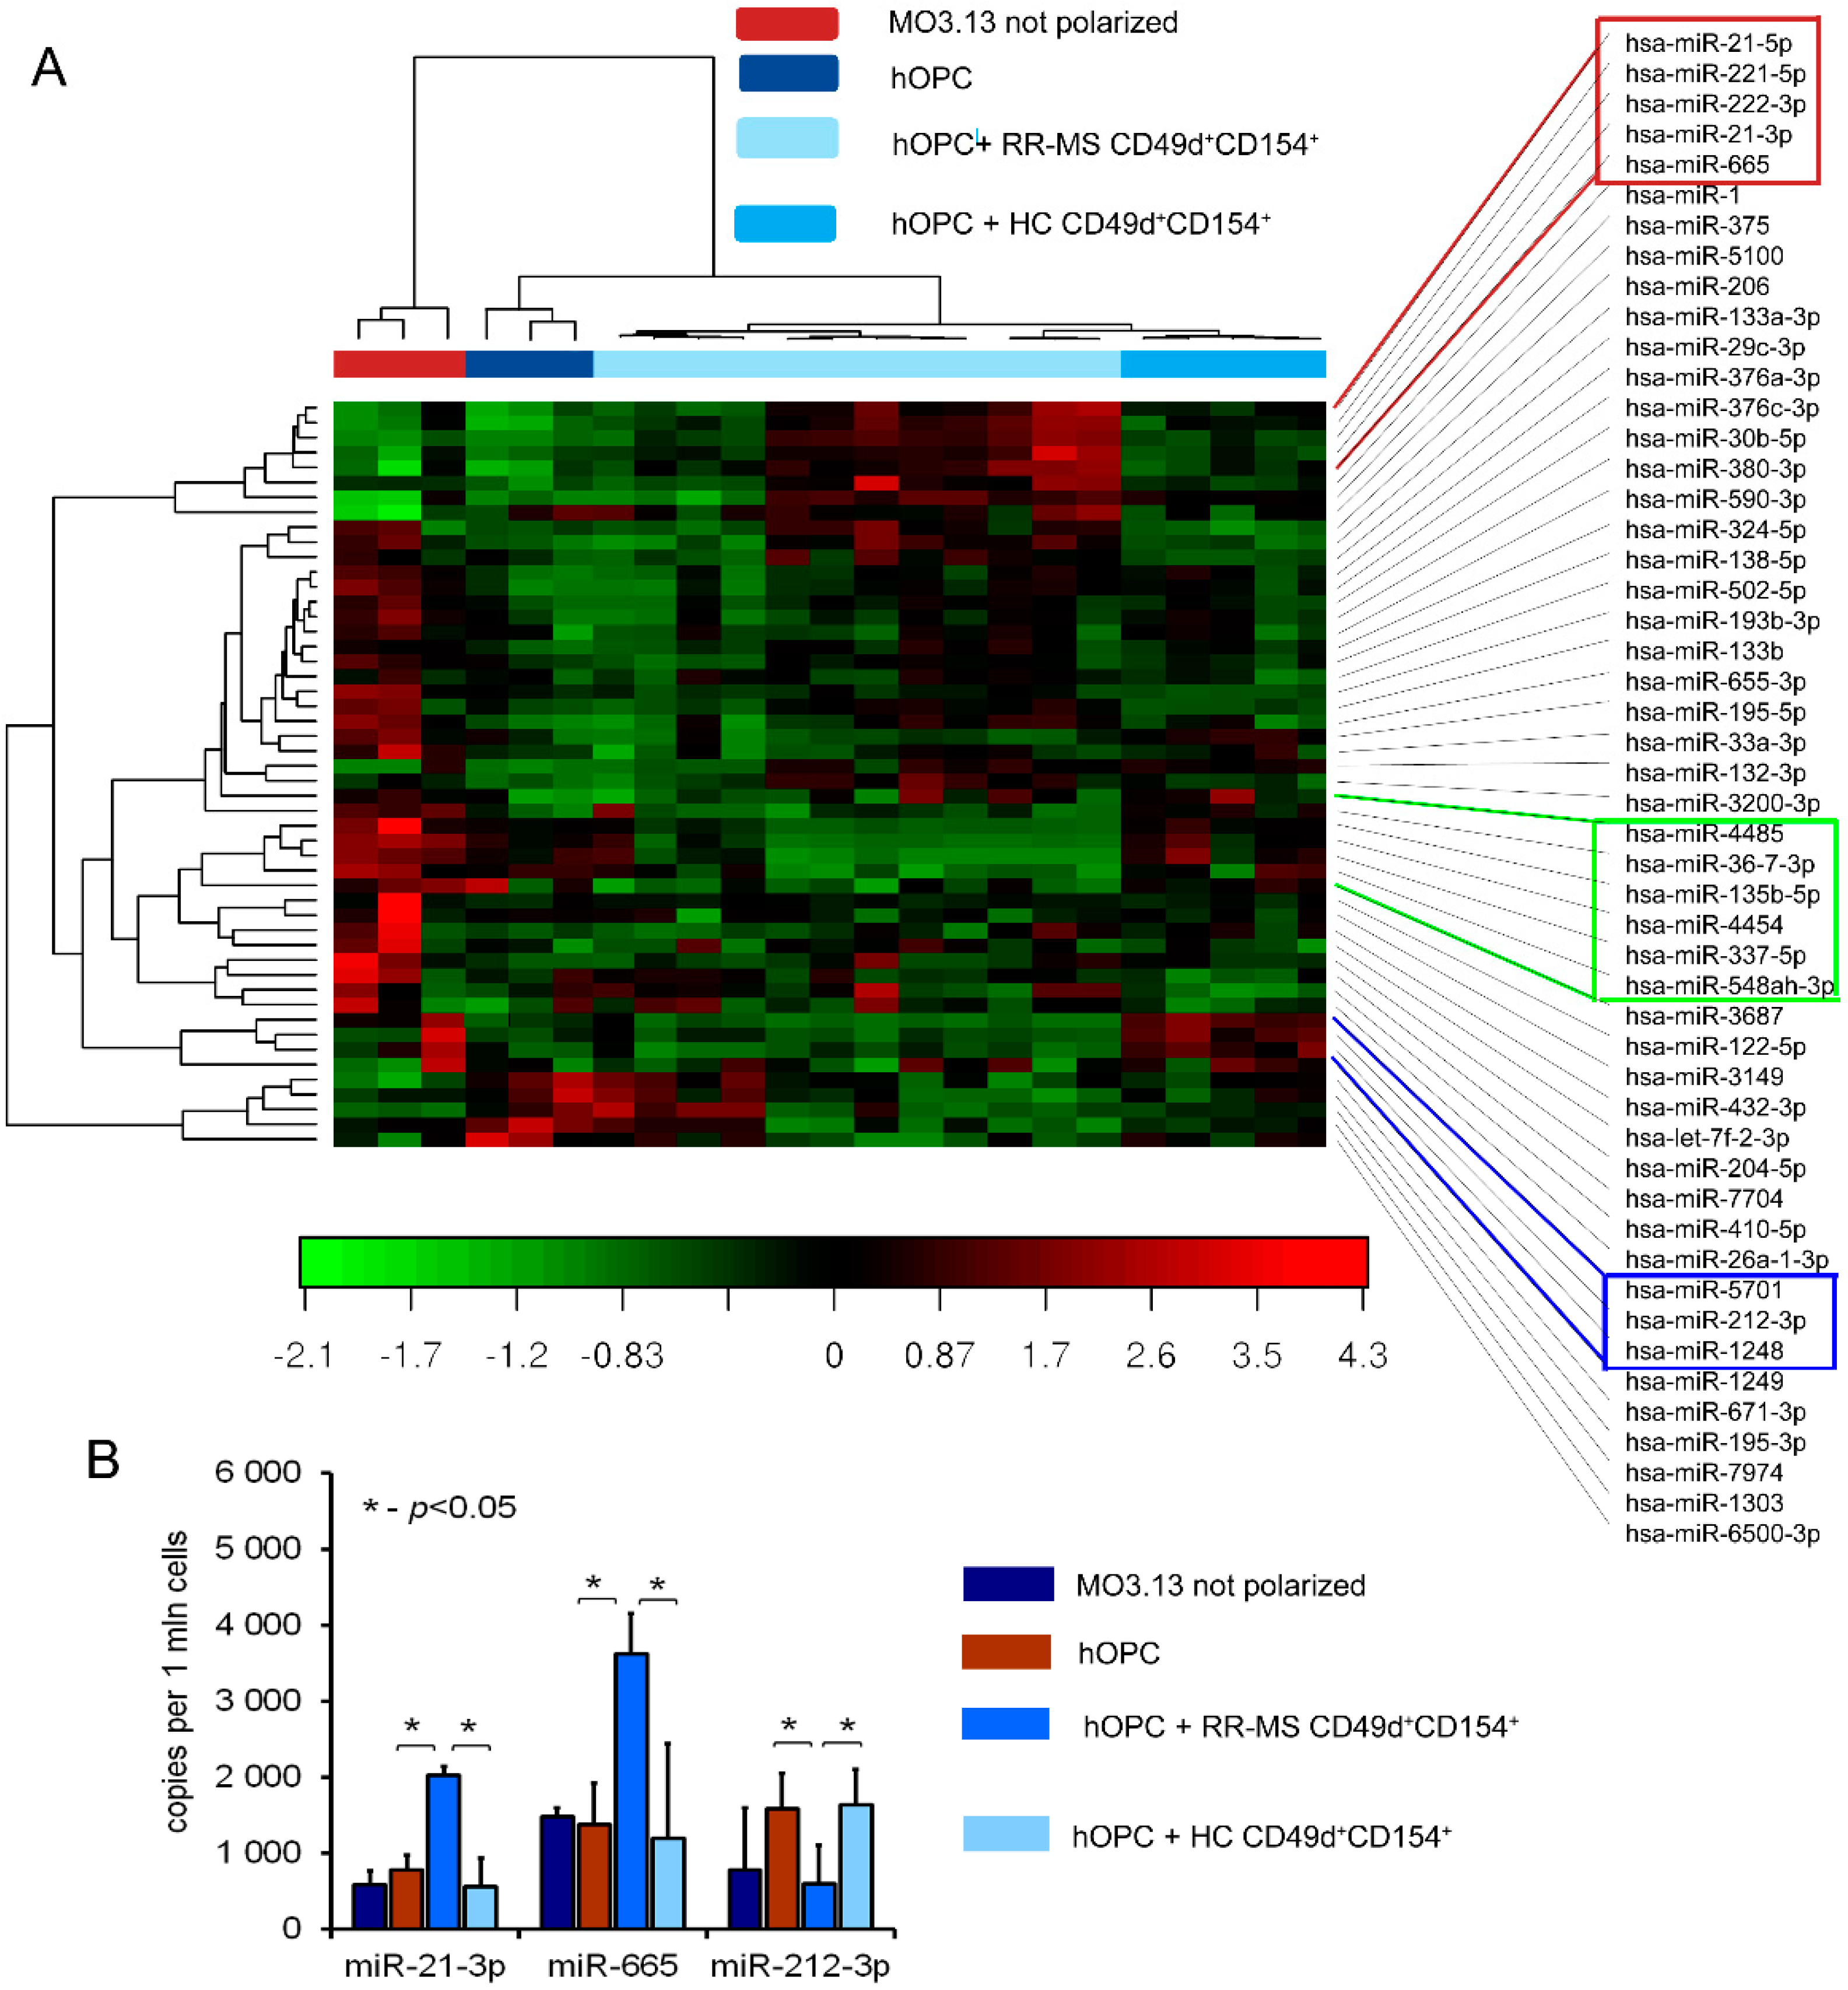
38]. NGS analysis of MO3.13 cells polarized to myelin-producing OLs cocultured with RR-MS CD49d
+CD154
+ lymphocytes identified three differentially expressed molecules: miR-665, miR-21-3p, and miR-212-3p. Two of them, miR-665 and miR-21-3p, are negatively and directly connected with activity of polymerase II and global chromatin remodeling. Consequently, we found that miR-665 overexpression affects other miRNA molecules by interfering with transcription, and exerts an indirect effect on myelin protein synthesis. Experiments performed using antagomirs confirmed bioinformatic suggestions that miRNA dysregulation in maturating OPCs cultured with RR-MS CD49d
+CD154
+ lymphocytes was dependent on the miR-665, but not miR-21-3p overexpression, as only miR-665 neutralization reconstituted total miRNA concentrations and ELL3, MBP, PLP mRNA levels. Among the most abundant miRNAs in the mature OLs, miR-219 is thought to be crucial in promoting OL differentiation, in part by direct targeting negative regulators of OL development such as PDGFRα, Sox6, and Hes5 [
39]. Deletion of DICER in mature OLs using PLP-CreERT results in the dysregulation of miR-219 target gene Elov7 expression that is involved in lipid homeostasis [
40]. Although, in our study, RR-MS as well as HC CD49d
+CD154
+ lymphocytes had no effect on miR-219, and other miRNA molecules involved in OPC maturation (miR-338, miR-138, miR-29, miR-32), we cannot exclude that they are engaged in impaired myelin synthesis by OLs [
21,
41]. Our doubts come from the miRNA NGS analysis, where each sample was normalized to an equal amount of cDNA. As total miRNA was diminished by silencing RNA polymerase II transcription activity, and more total RNA was taken to cDNA synthesis, many more miRNAs can appear to be downregulated. Nevertheless, this part of the study demonstrated a new possible mechanism, which involved not only particular miRNA molecules directly associated with myelin synthesis, but also affected the global miRNA profile at the transcriptional level. Our findings provide a link between disproportions in MBP and PLP production during remyelination via dysregulation of miRNAs in maturing OPCs triggered by RR-MS CD49d
+CD154
+ myelin-specific lymphocytes.
Our findings explain the phenomenon of insufficient remyelination based on the positive feedback between OPC-CD49d+CD154+ myelin-specific lymphocytes. Therefore, our data provide the opportunity for therapeutic interventions using combined therapy with neutralizing anti-CD154 and CD49d mAbs. As CD49d+CD154+ lymphocyte proliferation might be induced by OPCs in the CNS, the effectiveness of this therapy nowadays is limited. Further studies with the use of anti-CD154 mAbs alone, as well as in combination with anti-CD49d mAbs administrated intravenously and/or intraventricularly at different time points of EAE to estimate their influence on the disease induction and remyelination process may indicate a new trend for therapeutic approach.

 ,
, 


