Identification of A Novel Class of Benzofuran Oxoacetic Acid-Derived Ligands that Selectively Activate Cellular EPAC1

 , ,
, ,  ,
,  add
Show full author list
add
Show full author list
Abstract
1. Introduction
2. Materials and Methods
2.1. Materials
2.2. Recombinant Protein Production
2.3. 8-NBD-cAMP Competition Assay and Ultra-High Throughput Screening (uHTS)
2.4. Bayesian Modeling
2.5. Generation of in Silico Docking Models of EPAC1 CNBD
2.6. Chemical Synthesis—General Methods
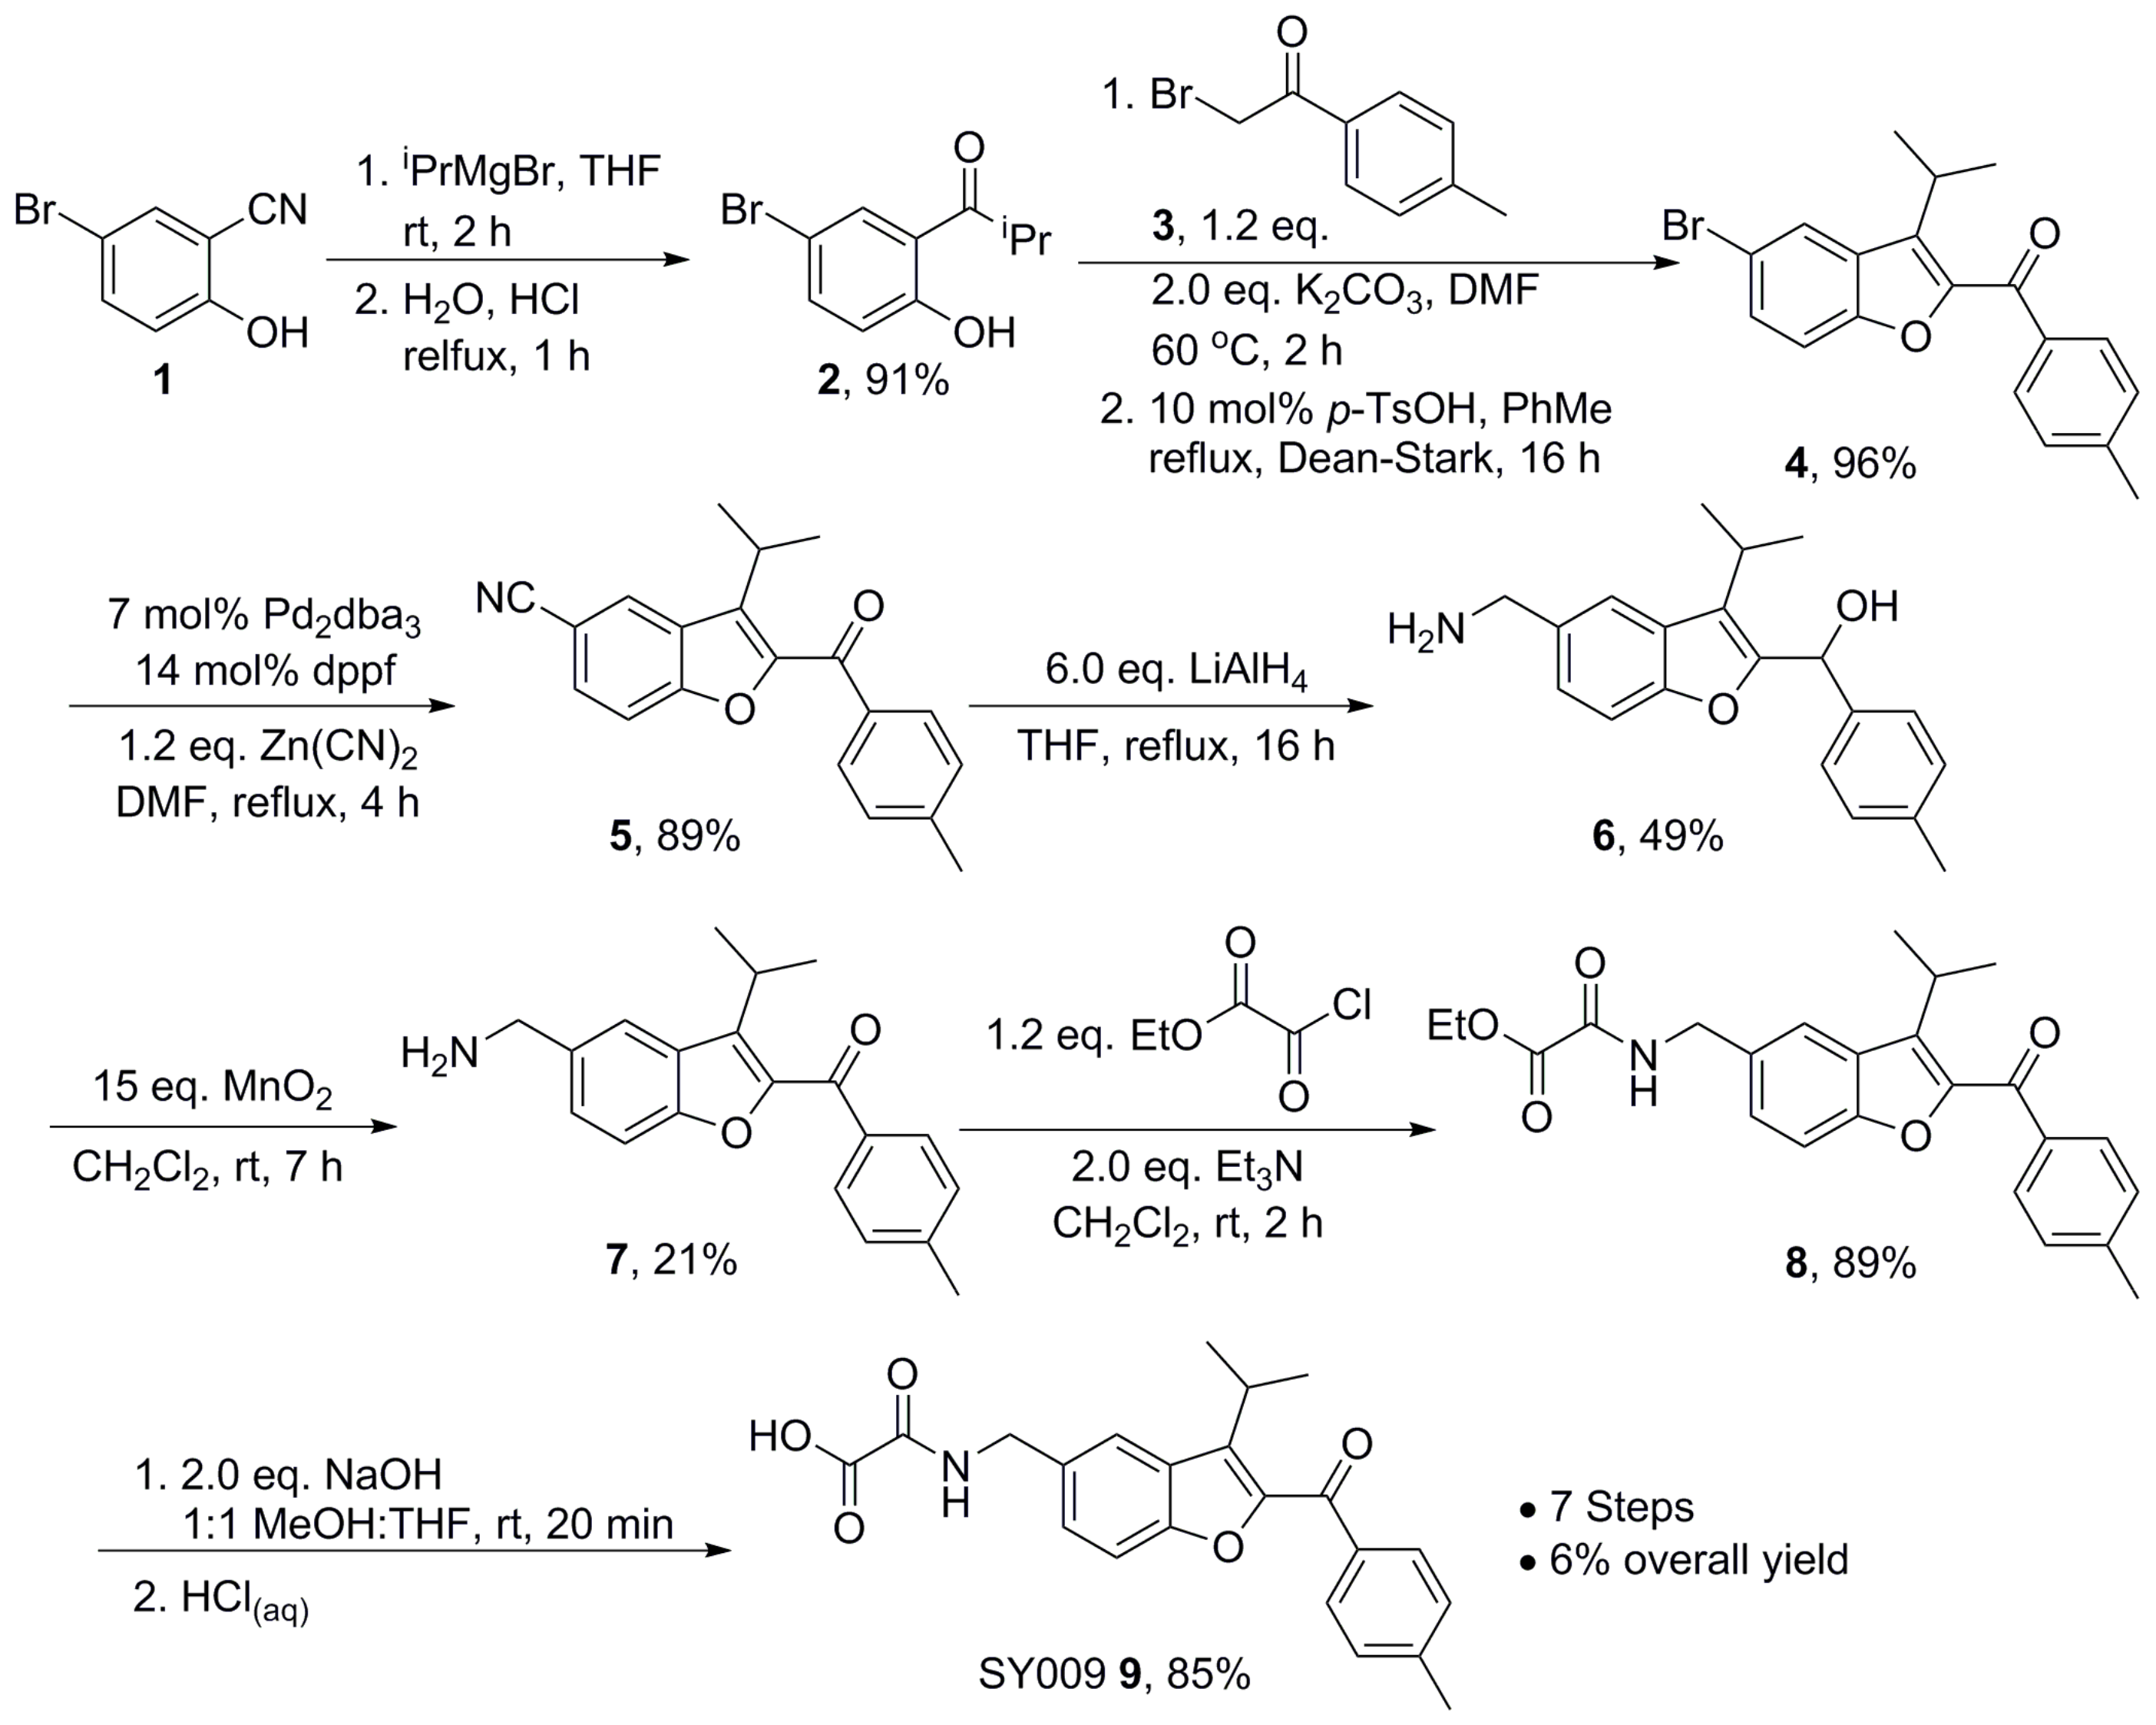
2.7. Chemical Synthesis—Representative Synthesis of SY009
2.8. Microscale Thermophoresis (MST)
2.9. Guanine Nucleotide Exchange Factor (GEF) Activity Assay
2.10. Active Rap1 Pull-Down Assay
2.11. SDS-PAGE and Western Blotting
2.12. Statistical Analyses
3. Results
3.1. Ultra-High-Throughput (uHTS) Screening to Identify Interacting Ligands for the EPAC1 CNBD
3.2. Development of An in Silico Docking Model of EPAC1
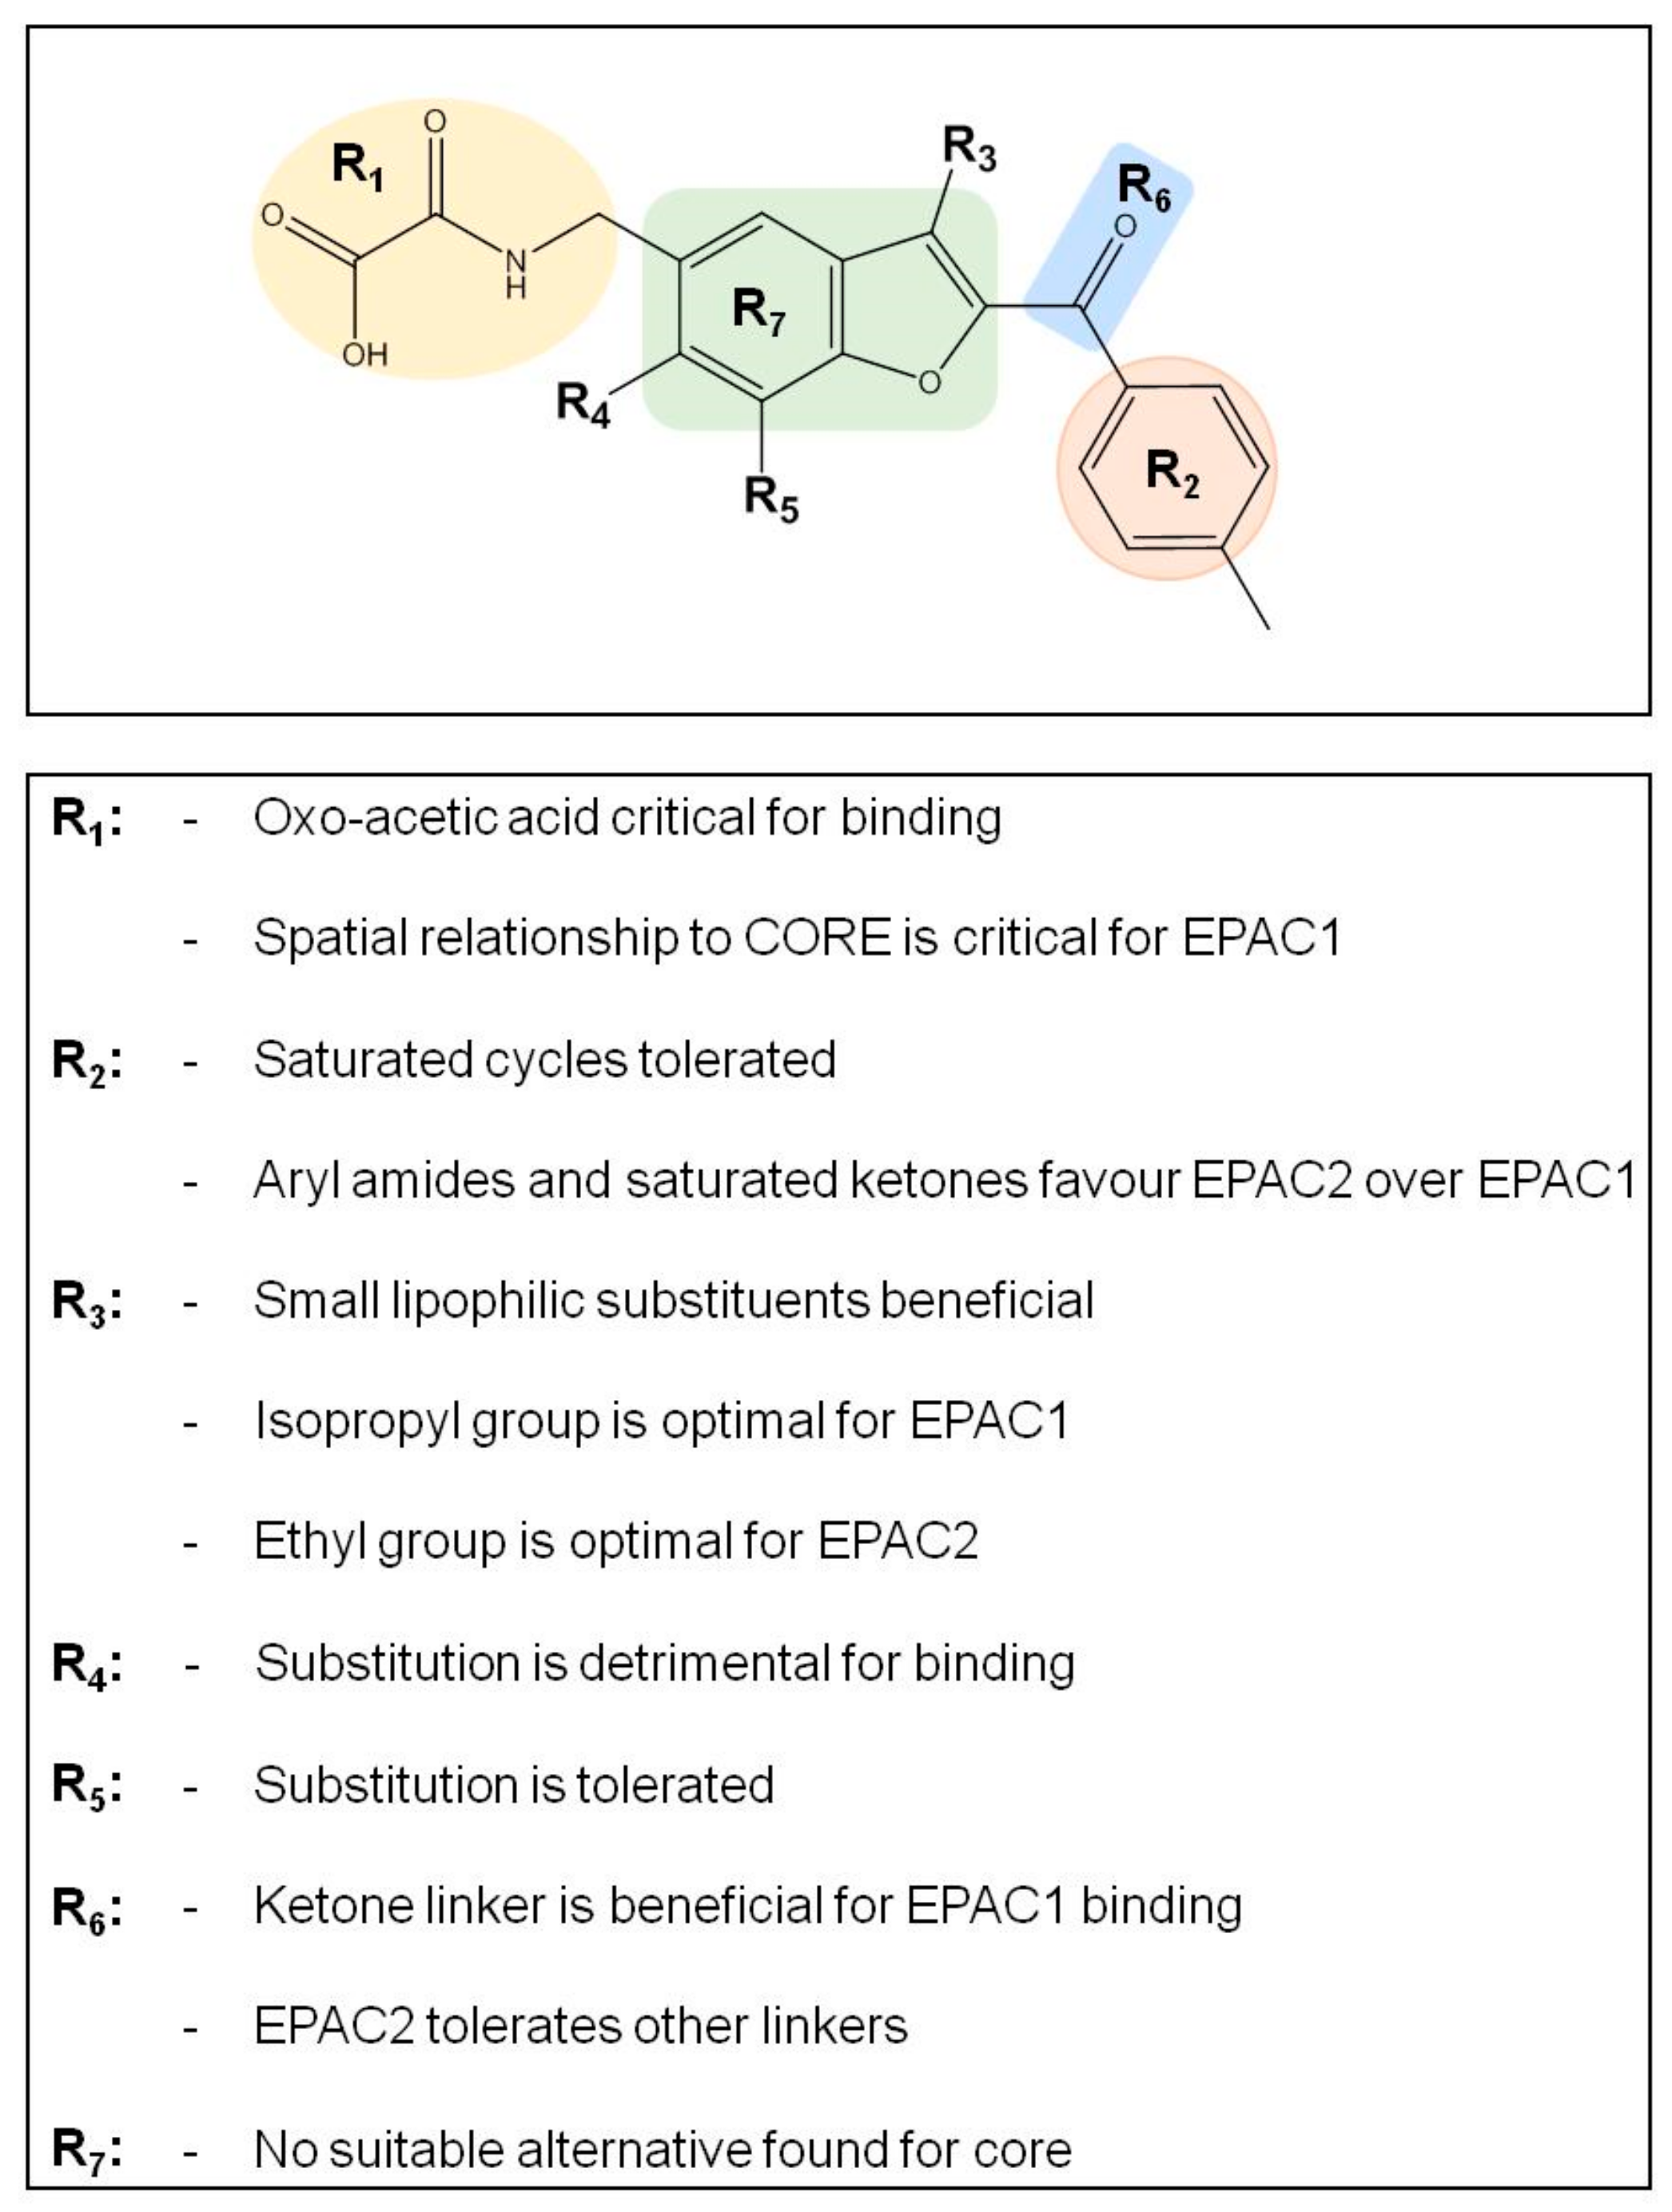
3.3. SAR Analysis of Structural Analogues of SY000 with the EPAC1 CNBD
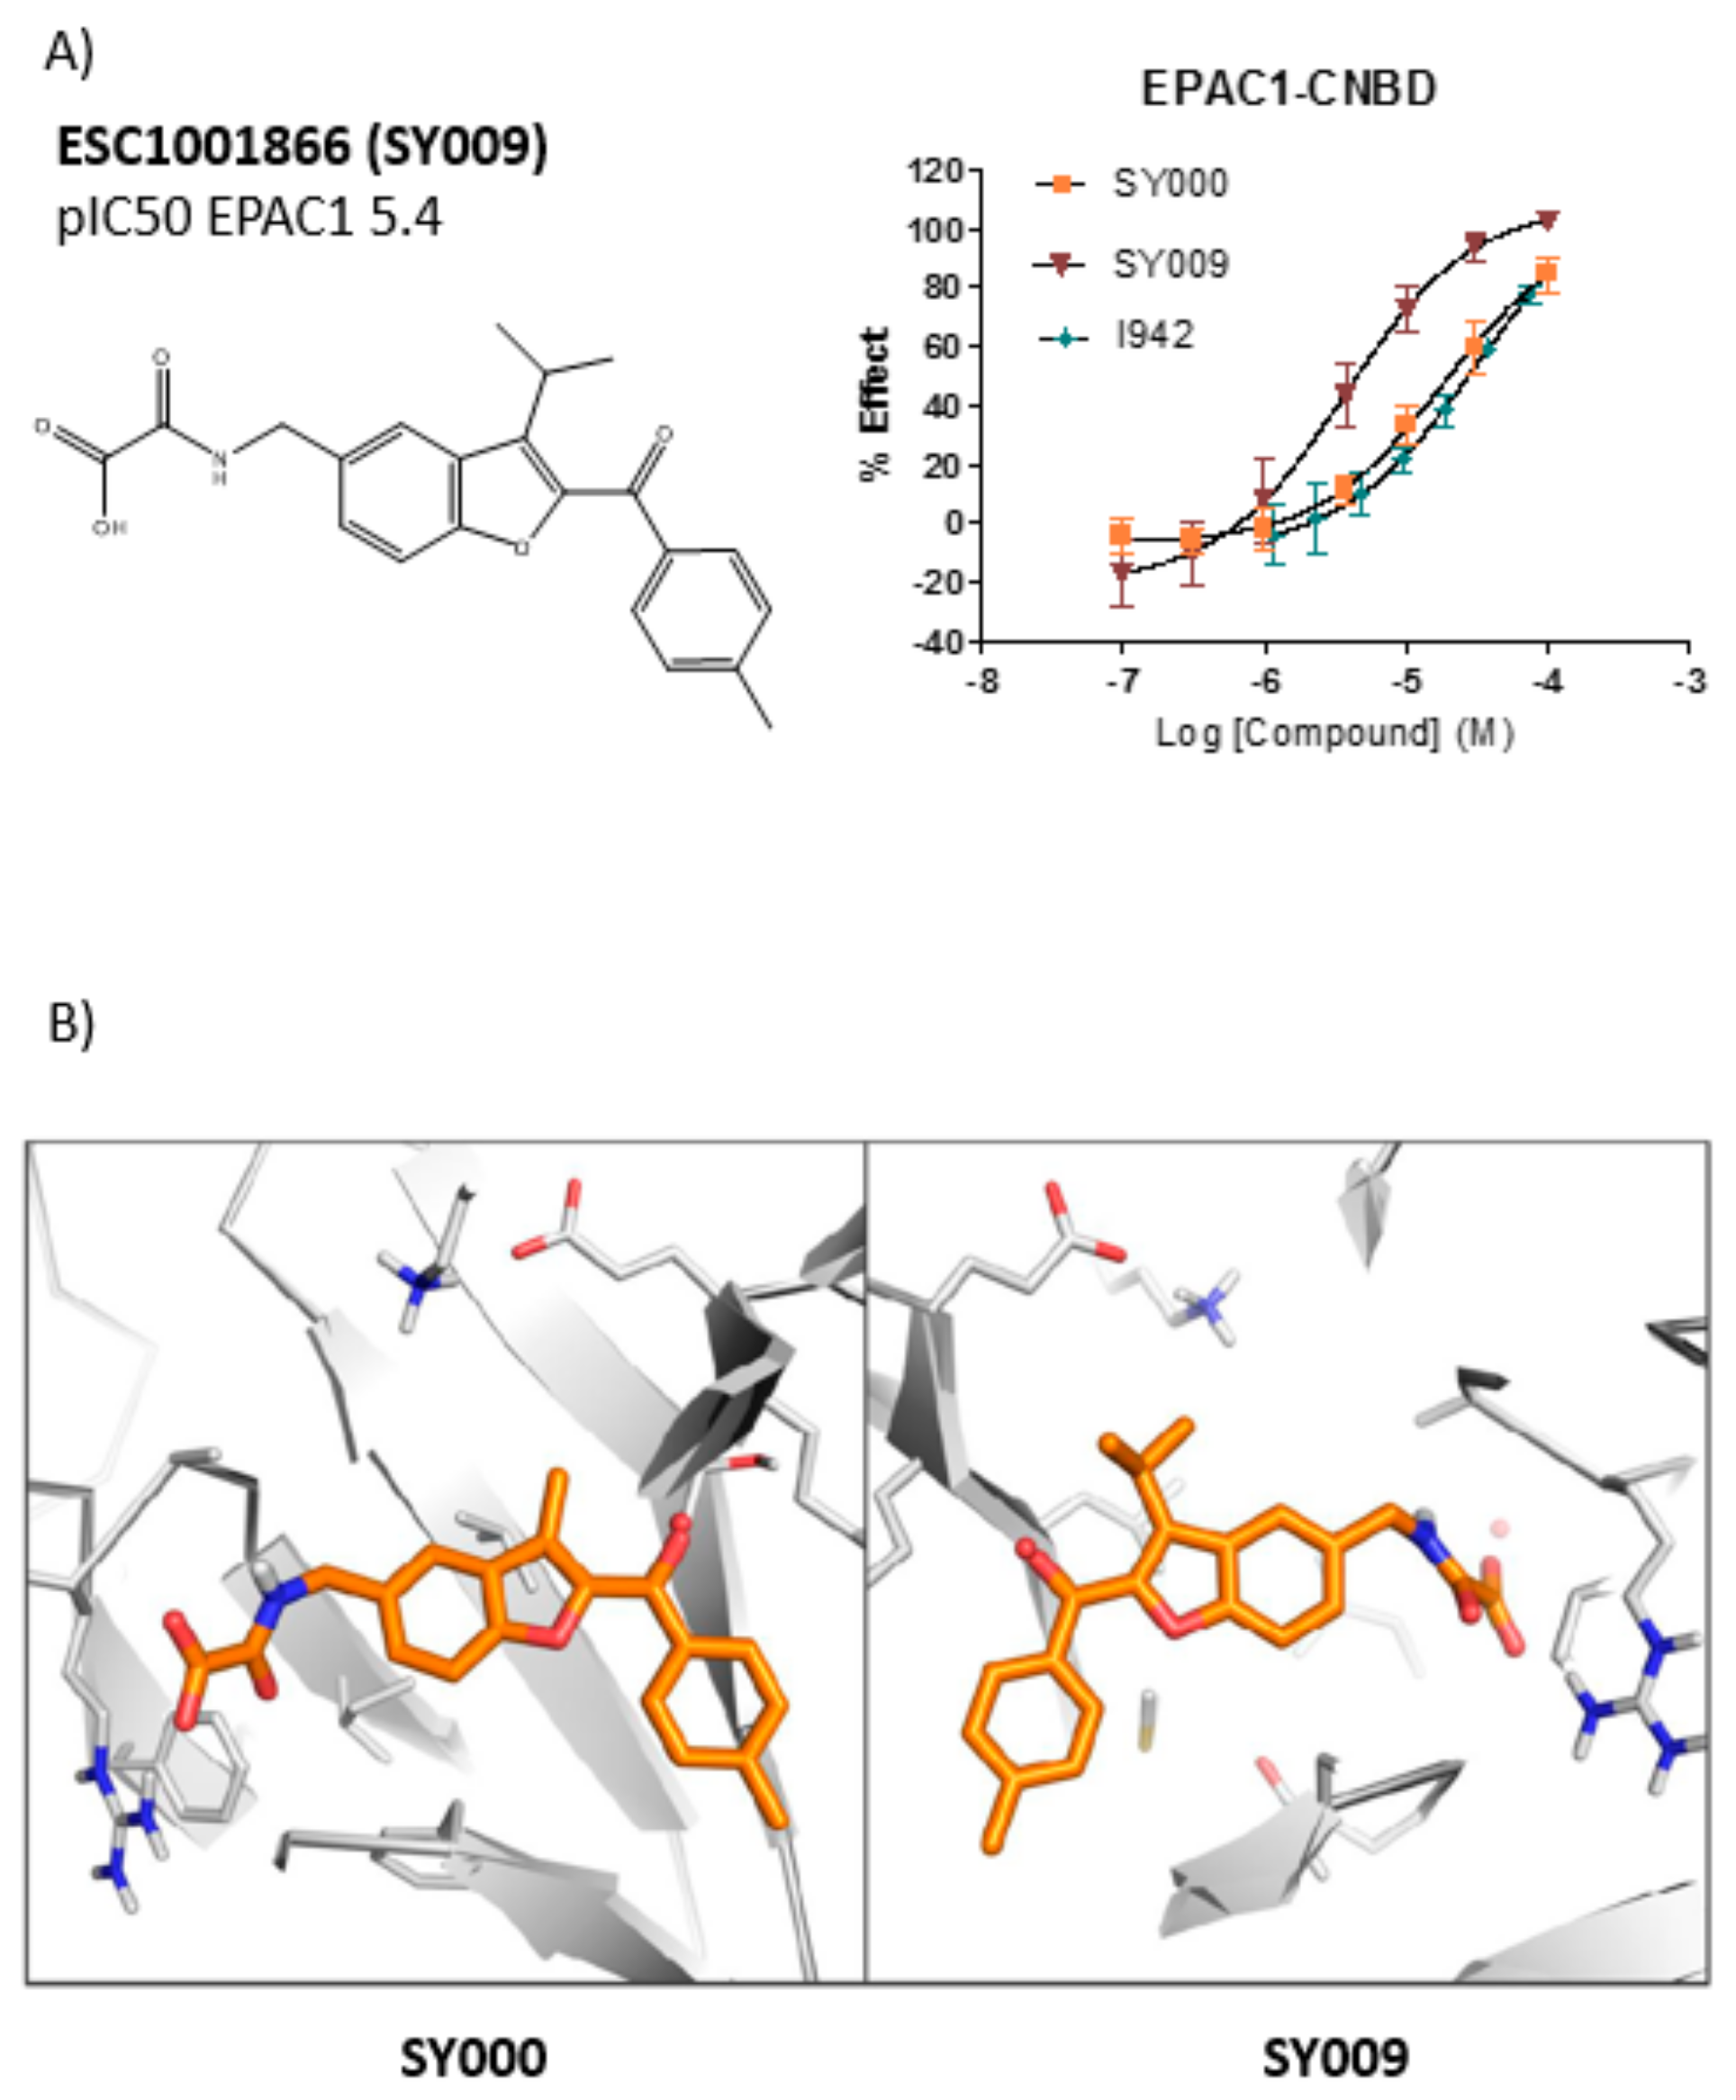
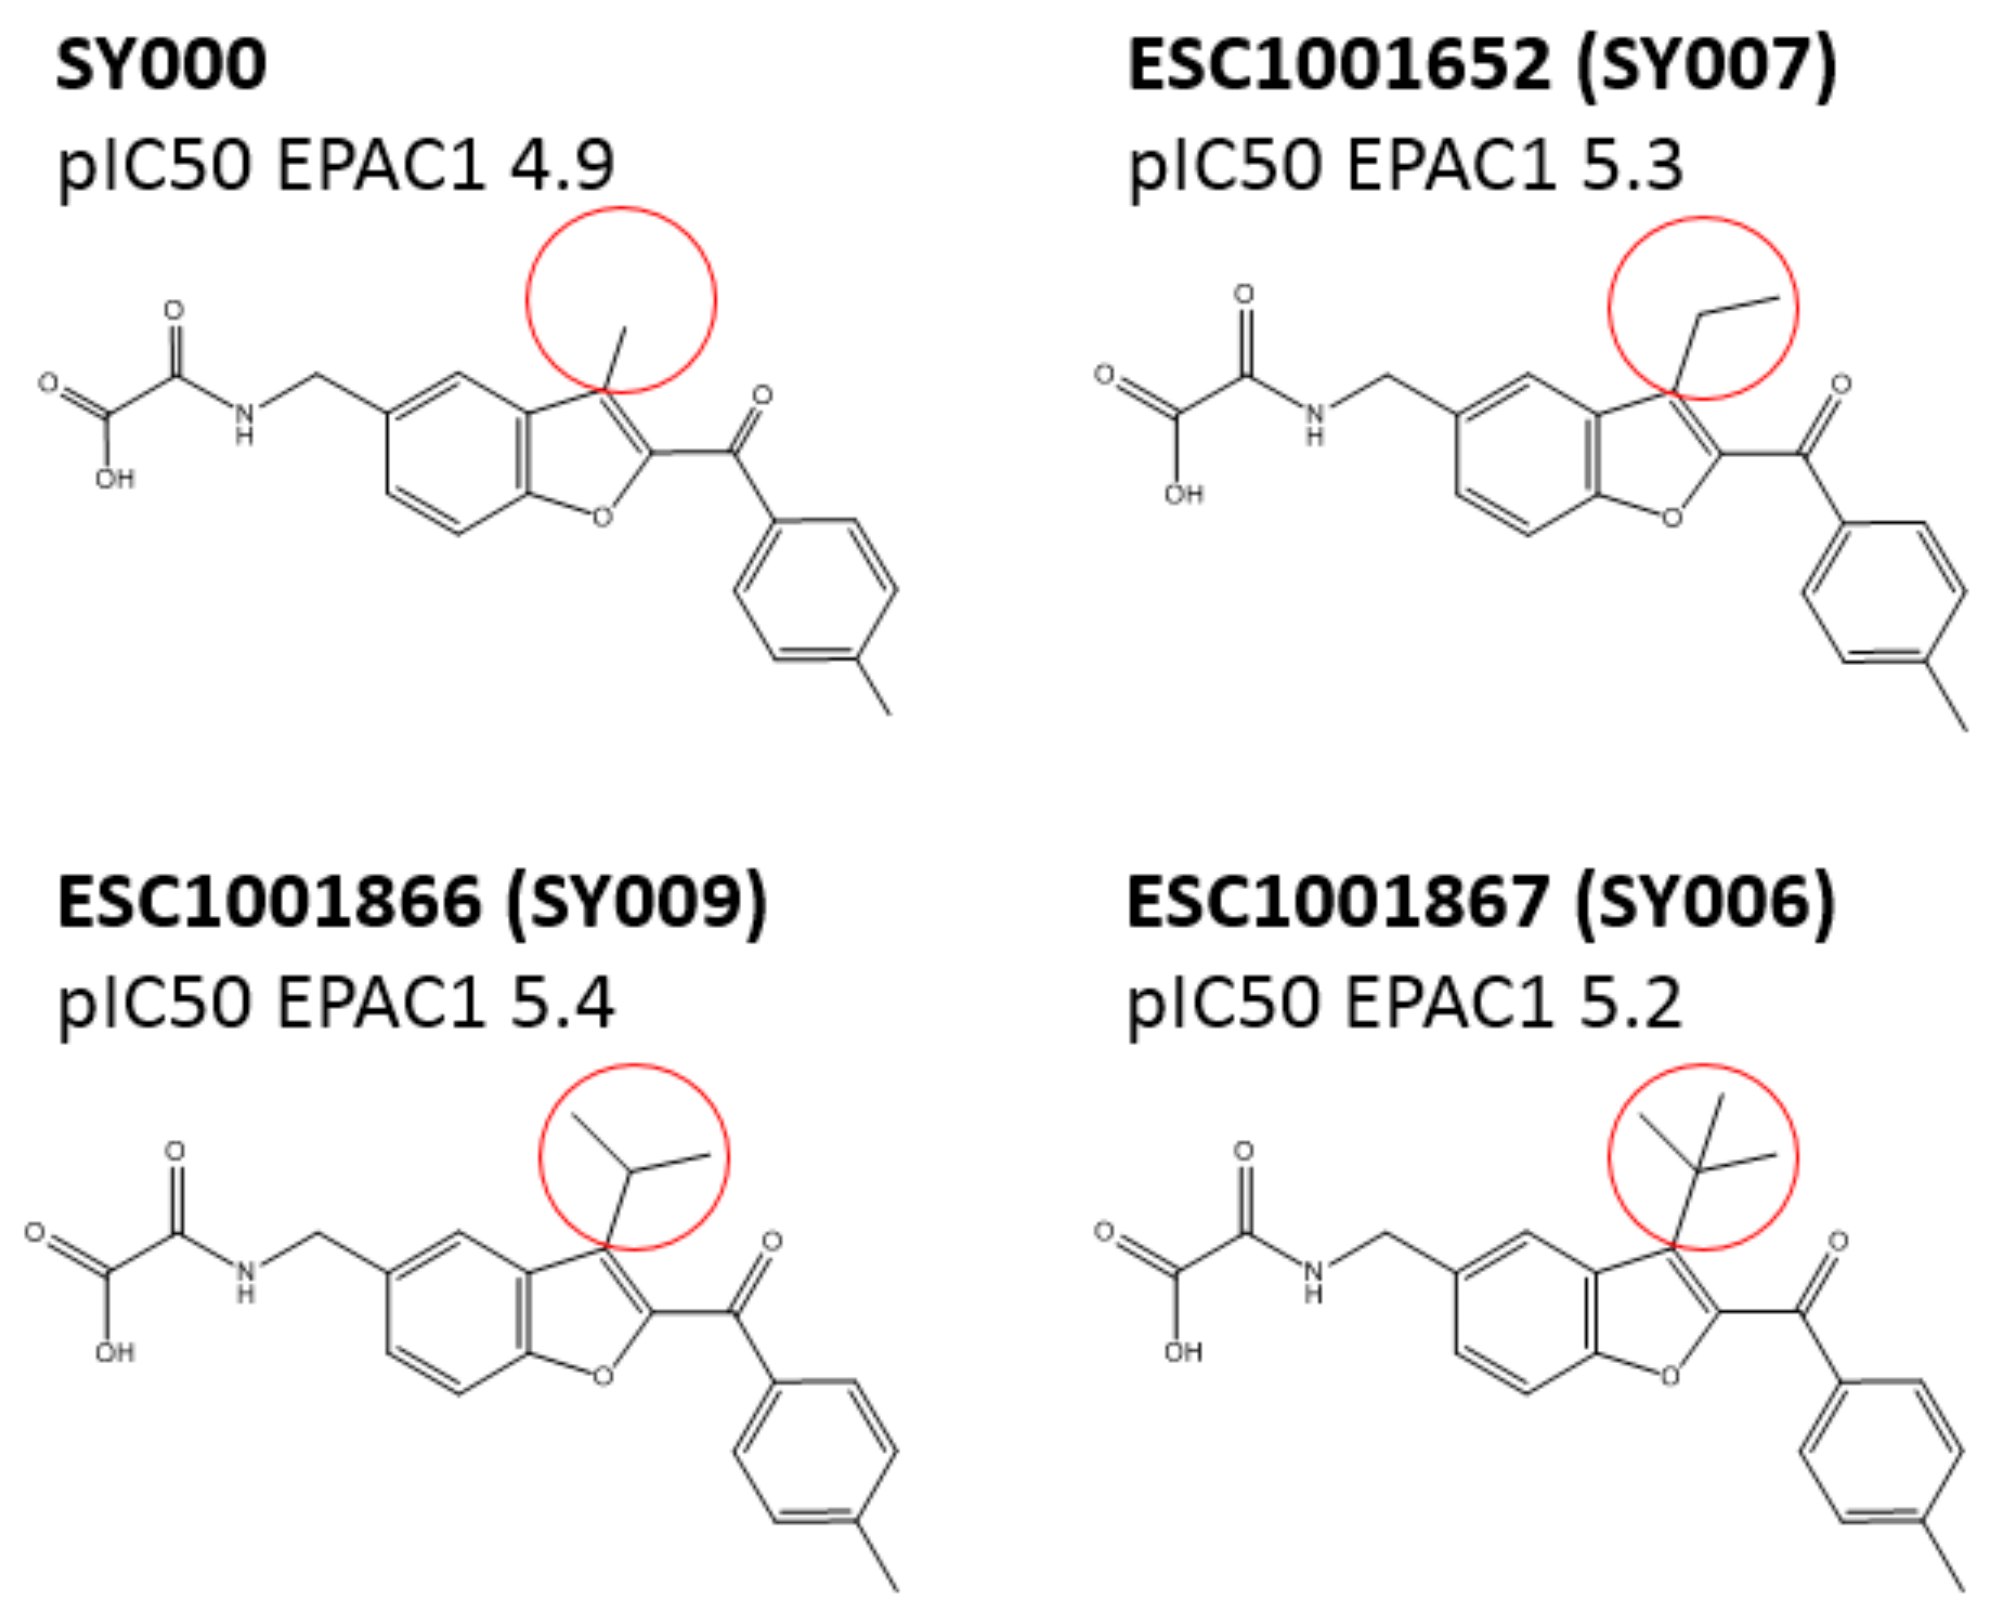
3.4. Binding/Activity Relationships of R3 Substituted SY000 Analogues
4. Discussion
5. Conclusions
Supplementary Materials
Author Contributions
Funding
Conflicts of Interest
Abbreviations
References
- Parnell, E.; Palmer, T.M.; Yarwood, S.J. The future of EPAC-targeted therapies: Agonism versus antagonism. Trends Pharmacol. Sci. 2015, 36, 203–214. [Google Scholar] [CrossRef] [PubMed]
- Enserink, J.M.; Christensen, A.E.; de Rooij, J.; van Triest, M.; Schwede, F.; Genieser, H.G.; Doskeland, S.O.; Blank, J.L.; Bos, J.L. A novel Epac-specific cAMP analogue demonstrates independent regulation of Rap1 and ERK. Nat. Cell Biol. 2002, 4, 901–906. [Google Scholar] [CrossRef] [PubMed]
- Ohba, Y.; Mochizuki, N.; Matsuo, K.; Yamashita, S.; Nakaya, M.; Hashimoto, Y.; Hamaguchi, M.; Kurata, T.; Nagashima, K.; Matsuda, M. Rap2 as a slowly responding molecular switch in the Rap1 signaling cascade. Mol. Cell. Biol. 2000, 20, 6074–6083. [Google Scholar] [CrossRef] [PubMed][Green Version]
- Kawasaki, H.; Springett, G.M.; Mochizuki, N.; Toki, S.; Nakaya, M.; Matsuda, M.; Housman, D.E.; Graybiel, A.M. A family of cAMP-binding proteins that directly activate Rap1. Science 1998, 282, 2275–2279. [Google Scholar] [CrossRef] [PubMed]
- De Rooij, J.; Zwartkruis, F.J.; Verheijen, M.H.; Cool, R.H.; Nijman, S.M.; Wittinghofer, A.; Bos, J.L. Epac is a Rap1 guanine-nucleotide-exchange factor directly activated by cyclic AMP. Nature 1998, 396, 474–477. [Google Scholar] [CrossRef] [PubMed]
- Parnell, E.; Smith, B.O.; Yarwood, S.J. The cAMP sensors, EPAC1 and EPAC2, display distinct subcellular distributions despite sharing a common nuclear pore localisation signal. Cell. Signal. 2015, 27, 989–996. [Google Scholar] [CrossRef] [PubMed]
- Rehmann, H.; Arias-Palomo, E.; Hadders, M.A.; Schwede, F.; Llorca, O.; Bos, J.L. Structure of Epac2 in complex with a cyclic AMP analogue and RAP1B. Nature 2008, 455, 124–127. [Google Scholar] [CrossRef] [PubMed]
- Rehmann, H.; Das, J.; Knipscheer, P.; Wittinghofer, A.; Bos, J.L. Structure of the cyclic-AMP-responsive exchange factor Epac2 in its auto-inhibited state. Nature 2006, 439, 625–628. [Google Scholar] [CrossRef] [PubMed]
- Harper, S.M.; Wienk, H.; Wechselberger, R.W.; Bos, J.L.; Boelens, R.; Rehmann, H. Structural dynamics in the activation of EPAC. J. Biol. Chem. 2007, 283, 6501–6508. [Google Scholar] [CrossRef] [PubMed]
- Mazhab-Jafari, M.T.; Das, R.; Fotheringham, S.A.; SilDas, S.; Chowdhury, S.; Melacini, G. Understanding cAMP-dependent allostery by NMR spectroscopy: Comparative analysis of the EPAC1 cAMP-binding domain in its apo and cAMP-bound states. J. Am. Chem. Soc. 2007, 129, 14482–14492. [Google Scholar] [CrossRef] [PubMed]
- Das, R.; Mazhab-Jafari, M.T.; Chowdhury, S.; SilDas, S.; Selvaratnam, R.; Melacini, G. Entropy-driven cAMP-dependent allosteric control of inhibitory interactions in exchange proteins directly activated by cAMP. J. Biol. Chem. 2008, 283, 19691–19703. [Google Scholar] [CrossRef] [PubMed]
- Parnell, E.; McElroy, S.P.; Wiejak, J.; Baillie, G.L.; Porter, A.; Adams, D.R.; Rehmann, H.; Smith, B.O.; Yarwood, S.J. Identification of a Novel, Small Molecule Partial Agonist for the Cyclic AMP Sensor, EPAC1. Sci. Rep. 2017, 7, 294. [Google Scholar] [CrossRef] [PubMed]
- Barker, G.; Parnell, E.; van Basten, B.; Buist, H.; Adams, D.R.; Yarwood, S.J. The Potential of a Novel Class of EPAC-Selective Agonists to Combat Cardiovascular Inflammation. J. Cardiovasc. Dev. Dis. 2017, 4, 22. [Google Scholar] [CrossRef] [PubMed]
- Tsalkova, T.; Mei, F.C.; Cheng, X. A fluorescence-based high-throughput assay for the discovery of exchange protein directly activated by cyclic AMP (EPAC) antagonists. PLoS ONE 2012, 7, e30441. [Google Scholar] [CrossRef] [PubMed]
- Almahariq, M.; Tsalkova, T.; Mei, F.C.; Chen, H.; Zhou, J.; Sastry, S.K.; Schwede, F.; Cheng, X. A novel EPAC-specific inhibitor suppresses pancreatic cancer cell migration and invasion. Mol. Pharmacol. 2013, 83, 122–128. [Google Scholar] [CrossRef] [PubMed]
- Chen, H.; Tsalkova, T.; Chepurny, O.G.; Mei, F.C.; Holz, G.G.; Cheng, X.; Zhou, J. Identification and characterization of small molecules as potent and specific EPAC2 antagonists. J. Med. Chem. 2013, 56, 952–962. [Google Scholar] [CrossRef] [PubMed]
- Tsalkova, T.; Mei, F.C.; Li, S.; Chepurny, O.G.; Leech, C.A.; Liu, T.; Holz, G.G.; Woods, V.L., Jr.; Cheng, X. Isoform-specific antagonists of exchange proteins directly activated by cAMP. Proc. Natl. Acad. Sci. USA 2012, 109, 18613–18618. [Google Scholar] [CrossRef] [PubMed]
- Rehmann, H. Epac-inhibitors: Facts and artefacts. Sci. Rep. 2013, 3, 3032. [Google Scholar] [CrossRef] [PubMed]
- Courilleau, D.; Bisserier, M.; Jullian, J.C.; Lucas, A.; Bouyssou, P.; Fischmeister, R.; Blondeau, J.P.; Lezoualc’h, F. Identification of a tetrahydroquinoline analog as a pharmacological inhibitor of the cAMP-binding protein Epac. J. Biol. Chem. 2012, 287, 44192–44202. [Google Scholar] [CrossRef] [PubMed]
- Brown, L.M.; Rogers, K.E.; Aroonsakool, N.; McCammon, J.A.; Insel, P.A. Allosteric inhibition of Epac: Computational modeling and experimental validation to identify allosteric sites and inhibitors. J. Biol. Chem. 2014, 289, 29148–29157. [Google Scholar] [CrossRef] [PubMed]
- Schwede, F.; Bertinetti, D.; Langerijs, C.N.; Hadders, M.A.; Wienk, H.; Ellenbroek, J.H.; de Koning, E.J.; Bos, J.L.; Herberg, F.W.; Genieser, H.G.; et al. Structure-guided design of selective Epac1 and Epac2 agonists. PLoS Biol. 2015, 13, e1002038. [Google Scholar] [CrossRef] [PubMed]
- Wiejak, J.; van Basten, B.; Luchowska-Stanska, U.; Hamilton, G.; Yarwood, S.J. The novel exchange protein activated by cyclic AMP 1 (EPAC1) agonist, I942, regulates inflammatory gene expression in human umbilical vascular endothelial cells (HUVECs). Biochim. Biophys. Acta Mol. Cell Res. 2019, 1866, 264–276. [Google Scholar] [CrossRef] [PubMed]
- McPhee, I.; Houslay, M.D.; Yarwood, S.J. Use of an activation-specific probe to show that Rap1A and Rap1B display different sensitivities to activation by forskolin in rat1 cells. FEBS Lett. 2000, 477, 213–218. [Google Scholar] [CrossRef]
- Kingwell, K. European Lead Factory hits its stride. Nat. Rev. Drug Discov. 2016, 15, 221. [Google Scholar] [CrossRef] [PubMed]
- Besnard, J.; Jones, P.S.; Hopkins, A.L.; Pannifer, A.D. The Joint European Compound Library: Boosting precompetitive research. Drug Discov. Today 2015, 20, 181–186. [Google Scholar] [CrossRef] [PubMed]
- Jerabek-Willemsen, M.; Wienken, C.J.; Braun, D.; Baaske, P.; Duhr, S. Molecular interaction studies using microscale thermophoresis. Assay Drug Dev. Technol. 2011, 9, 342–353. [Google Scholar] [CrossRef] [PubMed]
- Seidel, S.A.; Dijkman, P.M.; Lea, W.A.; van den Bogaart, G.; Jerabek-Willemsen, M.; Lazic, A.; Joseph, J.S.; Srinivasan, P.; Baaske, P.; Simeonov, A.; et al. Microscale thermophoresis quantifies biomolecular interactions under previously challenging conditions. Methods 2013, 59, 301–315. [Google Scholar] [CrossRef] [PubMed]
- Rainard, J.M.; Pandarakalam, G.C.; McElroy, S.P. Using Microscale Thermophoresis to Characterize Hits from High-Throughput Screening: A European Lead Factory Perspective. SLAS Discov. 2018, 23, 225–241. [Google Scholar] [CrossRef] [PubMed]


| Cluster | ID Codes | EPAC1 (uHTS pIC50) | MST (pKd ) | EPAC1 (Resynthesis pIC50) |
|---|---|---|---|---|
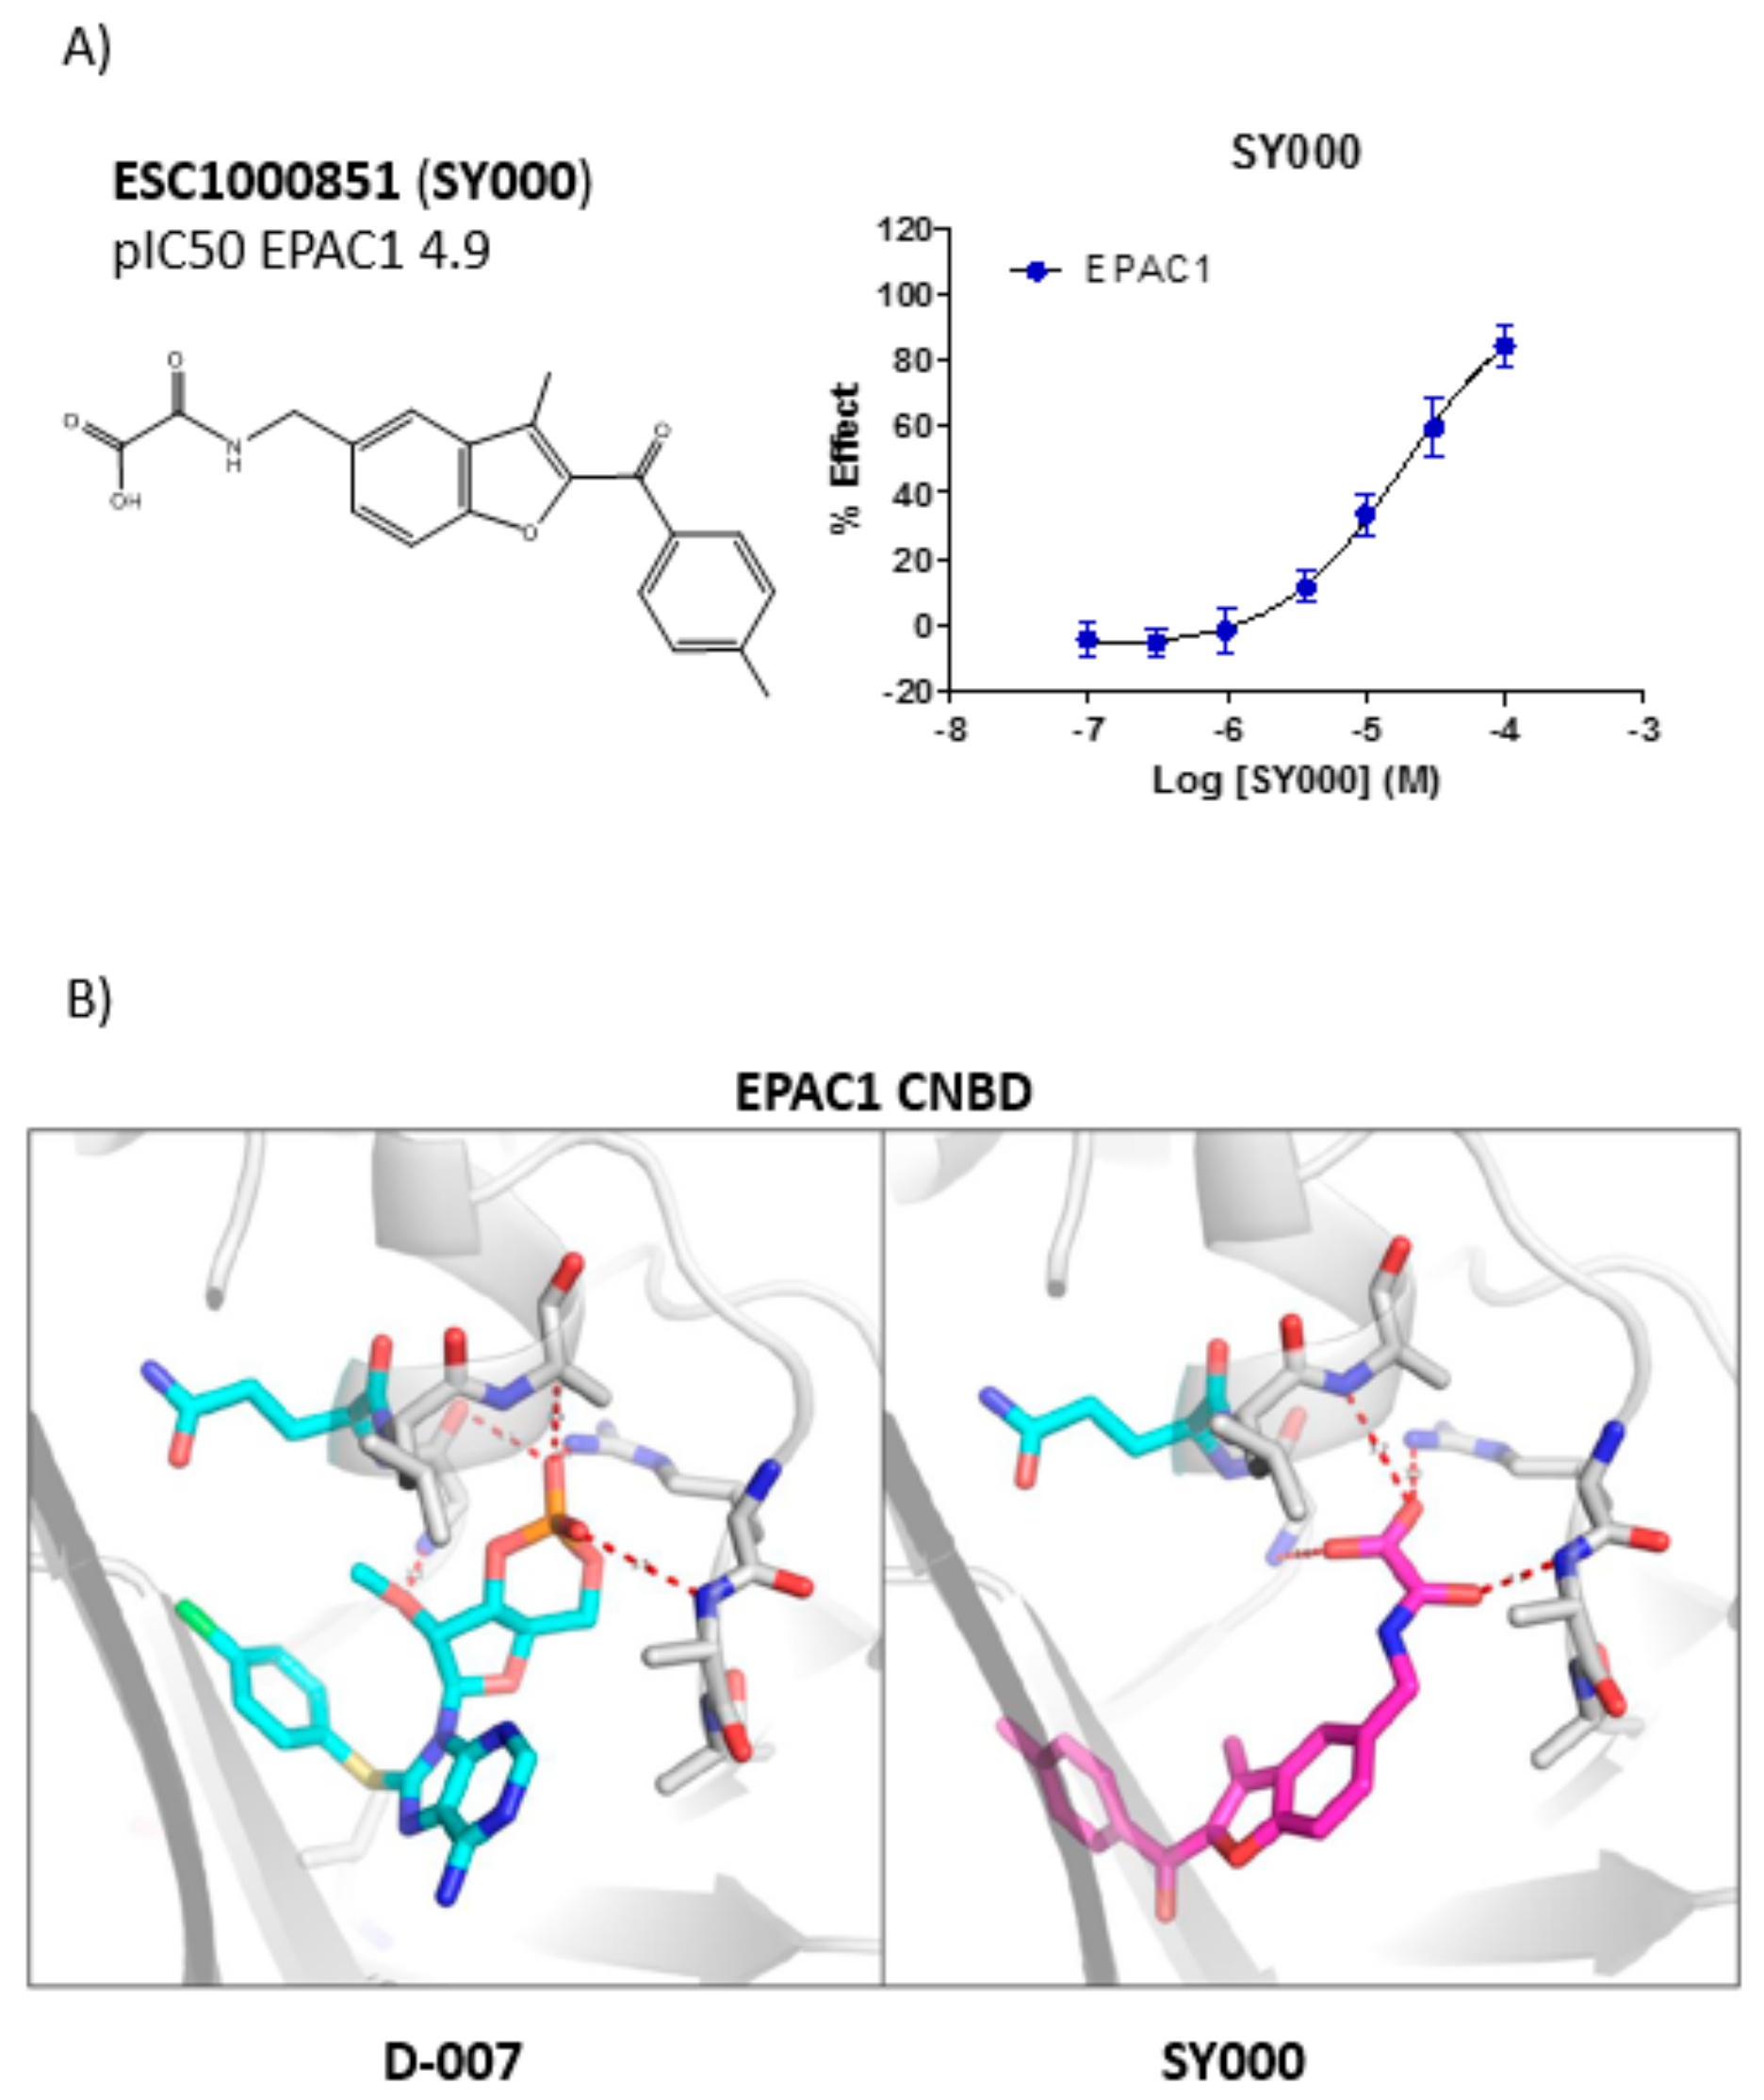
| Cluster 1 | ESC1000851 (SY000) | <4.7 | 5.5 | 4.9 |
| Cluster 1 | ESC1000906 | <4.7 | 6.5 | 4.5 |
| Cluster 2 | ESC1000583 | 5.4 | <4.5 | <4 |
| Singleton 3 | ESC1000505 | <4.7 | <4.5 | <4 |
| Compound Name | Structure | EPAC1 (pIC50) | MW | LE | LipE | cLogD | PSA | Fsp3 |
|---|---|---|---|---|---|---|---|---|
| ESC1000851(SY000) |  | 4.9 | 351 | 0.26 | 2.6 | 2.2 | 97 | 0.15 |
| ESC1000906 |  | 4.5 | 416 | 0.24 | 2.0 | 2.5 | 97 | 0.11 |
© 2019 by the authors. Licensee MDPI, Basel, Switzerland. This article is an open access article distributed under the terms and conditions of the Creative Commons Attribution (CC BY) license (http://creativecommons.org/licenses/by/4.0/).
Share and Cite
Beck, E.M.; Parnell, E.; Cowley, A.; Porter, A.; Gillespie, J.; Robinson, J.; Robinson, L.; Pannifer, A.D.; Hamon, V.; Jones, P.; et al. Identification of A Novel Class of Benzofuran Oxoacetic Acid-Derived Ligands that Selectively Activate Cellular EPAC1. Cells 2019, 8, 1425. https://doi.org/10.3390/cells8111425
Beck EM, Parnell E, Cowley A, Porter A, Gillespie J, Robinson J, Robinson L, Pannifer AD, Hamon V, Jones P, et al. Identification of A Novel Class of Benzofuran Oxoacetic Acid-Derived Ligands that Selectively Activate Cellular EPAC1. Cells. 2019; 8(11):1425. https://doi.org/10.3390/cells8111425
Chicago/Turabian StyleBeck, Elizabeth M., Euan Parnell, Angela Cowley, Alison Porter, Jonathan Gillespie, John Robinson, Lindsay Robinson, Andrew D. Pannifer, Veronique Hamon, Philip Jones, and et al. 2019. "Identification of A Novel Class of Benzofuran Oxoacetic Acid-Derived Ligands that Selectively Activate Cellular EPAC1" Cells 8, no. 11: 1425. https://doi.org/10.3390/cells8111425
APA StyleBeck, E. M., Parnell, E., Cowley, A., Porter, A., Gillespie, J., Robinson, J., Robinson, L., Pannifer, A. D., Hamon, V., Jones, P., Morrison, A., McElroy, S., Timmerman, M., Rutjes, H., Mahajan, P., Wiejak, J., Luchowska-Stańska, U., Morgan, D., Barker, G., ... Yarwood, S. J. (2019). Identification of A Novel Class of Benzofuran Oxoacetic Acid-Derived Ligands that Selectively Activate Cellular EPAC1. Cells, 8(11), 1425. https://doi.org/10.3390/cells8111425