Article

Photosensitizer Activation Drives Apoptosis by Interorganellar Ca2+ Transfer and Superoxide Production in Bystander Cancer Cells

1
Department of Physics and Astronomy “G. Galilei”, University of Padova, 35131 Padova, Italy
2
CNR Institute of Biochemistry and Cell Biology, 00015 Monterotondo, Rome, Italy
3
Department of Science, Roma Tre University, 00146 Rome, Italy
4
Institute of Otolaryngology, Catholic University of Rome, 00168 Rome, Italy
*
Author to whom correspondence should be addressed.
Cells 2019, 8(10), 1175; https://doi.org/10.3390/cells8101175
Submission received: 9 August 2019 / Revised: 14 September 2019 / Accepted: 27 September 2019 / Published: 29 September 2019
(This article belongs to the Section Intracellular and Plasma Membranes)

Abstract

:
In cells, photosensitizer (PS) activation by visible light irradiation triggers reactive oxygen species (ROS) formation, followed by a cascade of cellular responses involving calcium (Ca2+) and other second messengers, resulting in cell demise. Cytotoxic effects spread to nearby cells not exposed to light by poorly characterized so-called “bystander effects”. To elucidate the mechanisms involved in bystander cell death, we used both genetically encoded biosensors and fluorescent dyes. In particular, we monitored the kinetics of interorganellar Ca2+ transfer and the production of mitochondrial superoxide anion (O2) and hydrogen peroxide (H2O2) in irradiated and bystander B16-F10 mouse melanoma cancer cells. We determined that focal PS photoactivation in a single cell triggers Ca2+ release from the endoplasmic reticulum (ER) also in the surrounding nonexposed cells, paralleled by mitochondrial Ca2+ uptake. Efficient Ca2+ efflux from the ER was required to promote mitochondrial O2 production in these bystander cells. Our results support a key role for ER–mitochondria communication in the induction of ROS-mediated apoptosis in both direct and indirect photodynamical cancer cell killing.

1. Introduction

PS photoactivation is a well-established therapeutic approach used to promote cell killing based on the interaction between visible light and matter [1,2]. The use of PS drugs in the clinic is termed “photodynamic therapy” (PDT), which is successfully targeted to cutaneous cancers, infections, and other pathologies [3,4,5,6,7]. In PDT, wavelength-selective light exposure of cells loaded with a PS promotes the inert PS molecule to a relatively long-lived excited state in which it interacts with molecular oxygen (O2). Primary products of PS activation are singlet oxygen (1O2) and O2, which in turn initiate a cascade of secondary reactions, leading to the formation of H2O2, hydroxyl radical (OH), and oxidation of substrates [8,9]. These events are followed by activation of numerous cellular pathways, including signaling by Ca2+ and nitric oxide (NO), terminating with cellular damage or demise [10].
The damage caused by PS excitation propagates from directly irradiated cells to surrounding nonexposed cells, a phenomenon that occurs also in radiotherapy and in both cases is referred to as “bystander effect” [11,12]. Primary ROS produced by PS excitation are short-lived molecules which are unlikely to act as molecular messengers at distance [13,14]. On the contrary, secondary ROS byproducts, Ca2+ and NO have the potential to mediate bystander responses via paracrine pathways and/or direct cell–cell communication through gap junction channels [15,16,17,18,19,20]. In particular Ca2+, a long-range cellular messenger, is thought to be responsible for regeneration of ROS at distance (hundreds of microns) following PS activation [21]. In addition, membrane-permeant secondary ROS such as H2O2, which has a half-life of ~1 ms [22], can diffuse over distances of the order of the cell size, accumulate in the extracellular medium, and trigger intercellular signaling pathways [23].
Although the major molecular players of cellular responses to PS-mediated insults have been identified [20,21], a comprehensive understanding of their interplay in the induction of cell death at distance is currently missing. Of note, interorganellar Ca2+ signaling plays a crucial role in the activation of cell death pathways [24], but little attention has been paid so far in tracking the kinetics of PS excitation-induced Ca2+ mobilization at the subcellular level. Significant knowledge advancement is required in order to provide novel insights into the mechanisms of cytotoxicity regeneration in bystander cells, which can ameliorate treatment and reduce unwanted side effects.
In a prior study using the PS Aluminum Phthalocyanine Chloride, we characterized some of the downstream effects elicited by its focal activation in a single cell, which caused the propagation of an intercellular cytosolic Ca2+ wave and the execution of cytochrome c-dependent apoptosis in bystander cells [16]. Here, we extended those results by investigating interorganellar Ca2+ signaling using genetically encoded fluorescent biosensors targeted to the ER or mitochondria. In parallel, we tracked the kinetics of H2O2 in bystander cells and investigated the dependence of mitochondrial Ca2+ uptake and ROS production on the PS activation-induced Ca2+ efflux from the ER.

2. Materials and Methods

2.1. Cell Culture Preparation for Live-Cell Imaging

The B16-F10 mouse melanoma cell line was purchased from American Type Culture Collection (Cat. No. CRL-6475, ATCC, Manassas, VA, USA). Cells were cultured in RPMI 1640-GlutaMAX (Cat. No. 61870-010, Thermo Fisher Scientific, Waltham, MA, USA) supplemented with heat-inactivated fetal bovine serum (FBS, 10% v/v, Cat. No. 10270-106, Thermo Fisher Scientific) and Penicillin/Streptomycin (100 U/mL, Cat. No. 15070-063, Thermo Fisher Scientific) and routinely tested using 4′,6-diamidino-2-phenylindole (DAPI, Cat. No. D1306, Thermo Fisher Scientific) staining to exclude mycoplasma contamination.
Cells were plated on 12 mm round glass coverslips treated with Poly-L-lysine (0.01%, Cat. No. P2636, Sigma-Aldrich, St. Louis, MO, USA). For cell viability assays or live-cell imaging with fluorescent cell permeant indicators, cells were plated at 50% confluence and used the following day. For transient expression of genetically encoded fluorescent biosensors, cells were plated at 30% confluence and transfected with the biosensor plasmid using Lipofectamine 2000 (Cat. No. 11668-027, Thermo Fisher Scientific) after 24 h. Experiments were performed the next day.

2.2. Focal PS Activation in Sensitized Cells

B16-F10 cell cultures were incubated with the PS Aluminum Phthalocyanine Chloride (10 μM, Cat. No. 362530, Sigma-Aldrich) for 1 h at 37 °C in serum-free RPMI medium complemented with Pluronic F-127 (1% v/v, Cat. No. 20053, AAT Bioquest, Sunnyvale, CA, USA). PS-loaded cultures were transferred to the microscope stage and incubated with a normal extracellular medium (NES) containing: 138 mM NaCl, 5 mM KCl, 2 mM CaCl2, 0.4 mM NaH2PO4, 6 mM D-Glucose, 10 mM HEPES (all from Sigma-Aldrich), pH 7.3.
For PS excitation (Figures 1–7), we used a fiber-coupled 671 nm diode-pumped solid-state laser (Shanghai Dream Lasers Technology Co., Shanghai, China). The same photoactivation system, when needed, was adapted to the optics and electronics of two different upright microscopes: a custom spinning disk confocal microscope [25] and a partially custom-made two-photon microscope based on the Bergamo II architecture (Thorlabs, Inc., Newton, NJ, USA). In both cases, the 671 nm laser light emitted from a multimode fiber optics was recollimated using an achromatic doublet, and the beam was injected into the microscope optical path just above the objective via reflection at 45° off a dichroic mirror (650 nm shortpass dichroic, Cat. No. 69-217, Edmund Optics, Barrington, NJ, USA, for the spinning disk microscope, 600–750 nm notch dichroic custom-made by Semrock, Rochester, NY, USA, for the two-photon microscope). The recollimated laser beam was focused by the objective into a 10 μm diameter spot (see Supplementary Materials, Figure S1), which allowed spatially confined irradiation of a single cell in the culture (i.e., “focal” irradiation). Photostimulation consisted in delivering a series of photoactivation flashes in the time interval between consecutive frames. To this end, laser emission was controlled electronically by transistor–-transistor logic (TTL) commands generated by a programmable electronic platform (Arduino Uno Rev3, Cat. No. A000066, Arduino, Somerville, MA, USA, code available in Supplementary Materials). The overall duration of the irradiation protocol was 100 s. Standard laser exposure was set at 250 ms per second, corresponding to a total exposure of 25 s and a total optical energy of 100 mJ (corresponding to ~3∙1017 photons per irradiated cell) at an irradiance f ~5∙106 mW/cm2. Hereafter, we refer to these irradiation conditions as standard stimulation (SS) conditions. All the results described in this article were obtained in SS conditions, except for data shown in Figure 3, Figure 4, and Video 1 (see Supplementary Materials), where we modulated the delivered optical energy by tuning both laser power and photoactivation flash duration. We defined three other stimulation conditions that we refer to as: high irradiance (HI) conditions, ~7∙106 mW/cm2 (~6∙1017 photons per irradiated cell), medium irradiance (MI) conditions, ~4∙106 mW/cm2 (~2.5∙1017 photons per irradiated cell), and low irradiance (LI) conditions, ~7∙103 mW/cm2 (~6∙1014 photons per irradiated cell).
Hereafter, to describe bystander effects triggered by focal PS photoactivation, we refer to the nearest neighbors of the irradiated cell as “cells of the 1st order”, to the second neighbors as “cells of the 2nd order”, and so on. The single-cell analysis was limited to cells of the 5th order by the size of the field of view (~200 μm in diameter).

2.3. Cell Viability Assays

PS-loaded B16-F10 cell cultures were focally irradiated using the spinning disk microscope setup. After PS activation, cells were incubated at room temperature with cell viability assay solutions, as detailed hereafter.

2.3.1. Live/Dead Assay

At different time points from the end of photostimulation, cultures were incubated for 15 minutes in NES supplemented with the components of the LIVE/DEAD Viability/Toxicity Kit (Cat. No. L3224, Thermo Fisher Scientific), therefore, green fluorescent Calcein acetoxymethyl ester (AM, 5 µM) and red fluorescent Ethidium homodimer-1 (8 µM). Thereafter, the staining medium was replaced by NES, and fluorescence images were acquired.

2.3.2. Apoptosis Assay

For this assay, we used the Polarity Sensitive Indicator of Viability Apoptosis (pSIVA) Microscopy Kit (Cat. No. NBP2-29382, Novus Biologicals, Centennial, CO, USA). The assay solution consisted of pSIVA conjugated to the green fluorescent IANBD dye (pSIVA-IANBD) and red fluorescent propidium iodide (PI, 5 µM) dissolved in NES. Time-lapse fluorescence microscopy was performed for 2 h after the end of laser irradiation.

2.4. Imaging of Ca2+, O2∙, H2O2, and Caspase-3 Activation

Cytosolic Ca2+ was monitored with green fluorescent Fluo-4 AM Ca2+ dye (5 μM, Cat. No. F14201, Thermo Fisher Scientific). Mitochondrial O2 signals were visualized by red fluorescent MitoSOX Red (5 μM, Cat. No. M36008, Thermo Fisher Scientific). Indicators were dissolved in NES together with the PS and loaded into cells just before laser irradiation (see Section 2.2., above).
Intraorganellar Ca2+, H2O2 production, and caspase-3 activation were visualized using genetically encoded fluorescent biosensors (all plasmids were purchased from Addgene, Watertown, MA, USA). Ca2+ signaling in the ER was monitored by R-CEPIA1er or G-CEPIA1er (plasmids #58216 and #58215, a gift from Dr. Masamitsu Iino), respectively a red fluorescent and green fluorescent Ca2+ biosensor targeted to the ER. Green fluorescent CEPIA2mt (plasmid #58218, a gift from Dr. Masamitsu Iino) was used to selectively monitor mitochondrial Ca2+. H2O2 production was tracked using red fluorescent HyPerRed (plasmid #48249, a gift from Dr. Vsevolod Belousov). Caspase-3 activation was detected by a green fluorescent translocation-based biosensor, GANLS-DEVD-BNES (plasmid #50835, a gift from Dr. Robert Campbell).
Fluo-4, MitoSOX Red, G-CEPIA1er, CEPIA2mt, and GANLS-DEVD-BNES were excited by a 488 nm diode laser (Cat. No. COMPACT-150G-488-SM, World Star Tech, Markham, Ontario, Canada). R-CEPIA1er and HyPerRed were excited by a 565 nm light emitting diode (LED, mounted, Cat. No. M565L3, Thorlabs, Inc.) filtered by a suitable optical density (OD) 6 excitation filter (Cat. No. 67-019, Edmund Optics). Green fluorescence emission signals were collected though a 535/30 nm band-pass filter (Cat. No. ET535/30M, Chroma Technology Corp., Bellows Falls, VT, USA); red fluorescence emission signals were collected through a 590 nm long-pass filter (Cat. No. E590lpv2, Chroma Technology Corp.).
Images were acquired at 3–7 frame/s by a sCMOS camera (pco.edge, PCO AG, Kelheim, Germany), using a water immersion objective (NIKON FLUOR 60× WATER, NA = 1.0, Nikon Corporation, Tokyo, Japan) coupled to the spinning disk confocal microscope (see Section 2.2 above).

2.4.1. Depletion of ER Ca2+ Store and PS Activation

Depletion of ER Ca2+ store was performed in G-CEPIA1er-expressing cells using Thapsigargin (Tg, 3 μM; Cat. No. T9033, Sigma-Aldrich) dissolved in NES. Tg was administered through a micropipette attached to a pneumatic Pico Pump (Cat. No. PV820, World Precision Instruments, Sarasota, FL, USA). Micropipettes were fabricated from glass capillaries (Cat. No. G85150T-4, Harvard Apparatus, Holliston, MA, USA) using a double-stage vertical puller (Cat. No. PP-830, Narishige Group, Tokyo, Japan). The kinetics of Ca2+ efflux was monitored by imaging the cells under the spinning disk microscope until ER Ca2+ concentration ([Ca2+]ER) reached a steady state (see Supplementary Materials, Figure S5; average time constant τ = 206 ± 58 s, n = 6 cells).
PS-loaded cells (expressing G-CEPIA1er or CEPIA2mt or loaded with MitoSOX Red) were superfused with Tg-containing NES for 6 minutes and then focally irradiated and imaged as described above.

2.5. Simultaneous Two-Photon Imaging of ER and Mitochondrial Ca2+ in Cells Co-Expressing R-CEPIA1er and CEPIA2mt Biosensors

Two-photon excitation of both biosensors was provided by the beam of an optical parametric oscillator (MPX Chameleon Compact OPO, Coherent, Inc., Santa Clara, CA, USA) tuned to 1025 nm, coupled to the Bergamo II microscope (Thorlabs, Inc.) and fed by a femtosecond pulsed Titanium-sapphire pump laser (Chameleon Ultra II Laser, Coherent, Inc.). The microscope was equipped with a water immersion objective designed for multiphoton imaging (XLPLN25XWMP2, 25×, NA 1.05, Olympus Corporation, Tokyo, Japan). Fluorescence emission signals were selected by band-pass filters (612/69 nm, Cat. No. FF01-612/69-25, Semrock, for R-CEPIA1er; 525/40 nm, Cat. No. FF02-525/40-25, Semrock, for CEPIA2mt) and detected by cooled GaAsP photomultiplier modules (Cat. No. H7422-40, Hamamatsu Photonics K.K., Shizuoka, Japan). Images were acquired simultaneously in these two emission channels at 3 frames/s (Hz).

2.6. Data Analysis and Statistics

Image processing and data analysis were carried out using Matlab (R2019a, The MathWorks, Inc., Natick, MA, USA) and the open-source software ImageJ/Fiji (ImageJ-win64). Fluorescence signals were extracted from sequences of recorded frames as the average pixel values within selected regions of interest (ROIs) after uniform background subtraction. Image background was computed as the average pixel value within a square ROI, placed in a region of the image where there were no detectable fluorophores. Fluorescence traces were computed as relative changes of the instantaneous fluorescence emission intensity (F(t)) with respect to the average prestimulus value (F0), that is as:
dF/F0 = [F(t) − F0]/F0.
For the irreversible indicator MitoSOX Red, the change in mitochondrial O2 concentration was evaluated as the time derivative of the acquired dF/F0 fluorescence trace using the Matlab function diff. Photobleaching correction was performed by fitting a single exponential function to the prestimulus time course (baseline) of each trace, and extrapolating the fitting function to the overall acquisition time interval. In the graphs, mean fluorescence traces are shown as point-by-point mean ± standard error of the mean (s.e.m.) for the indicated number of independent experiments. In histograms, mean values are quoted ± s.e.m.
In order to construct the optimal experimental design and estimate the sample size of the groups for each type of experiment, we set a probability α = 5% for the type I error in the ANOVA test. Then, fixing β = 4α = 20% so as to obtain a test power of 1 − β = 80%, we computed the number n of each of the two samples to be compared using the formula:
n = 2[(zα/2 + zβ)∙σ/Δ]2,
with zα/2 = 1.96 and zβ = 1.28. We quantified the variability of the data (variance, σ2) and established the minimum difference Δ = μ1 − μ2 between averages that had a biological significance. Statistical comparisons of means were made by ANOVA (independent samples) or by paired sample t-test (dependent samples), where p-value (P) < 0.05 indicates statistical significance. Asterisks were used to indicate significant differences as follows: *, P ≤ 0.05; ** P ≤ 0.01; *** P ≤ 0.001.

3. Results

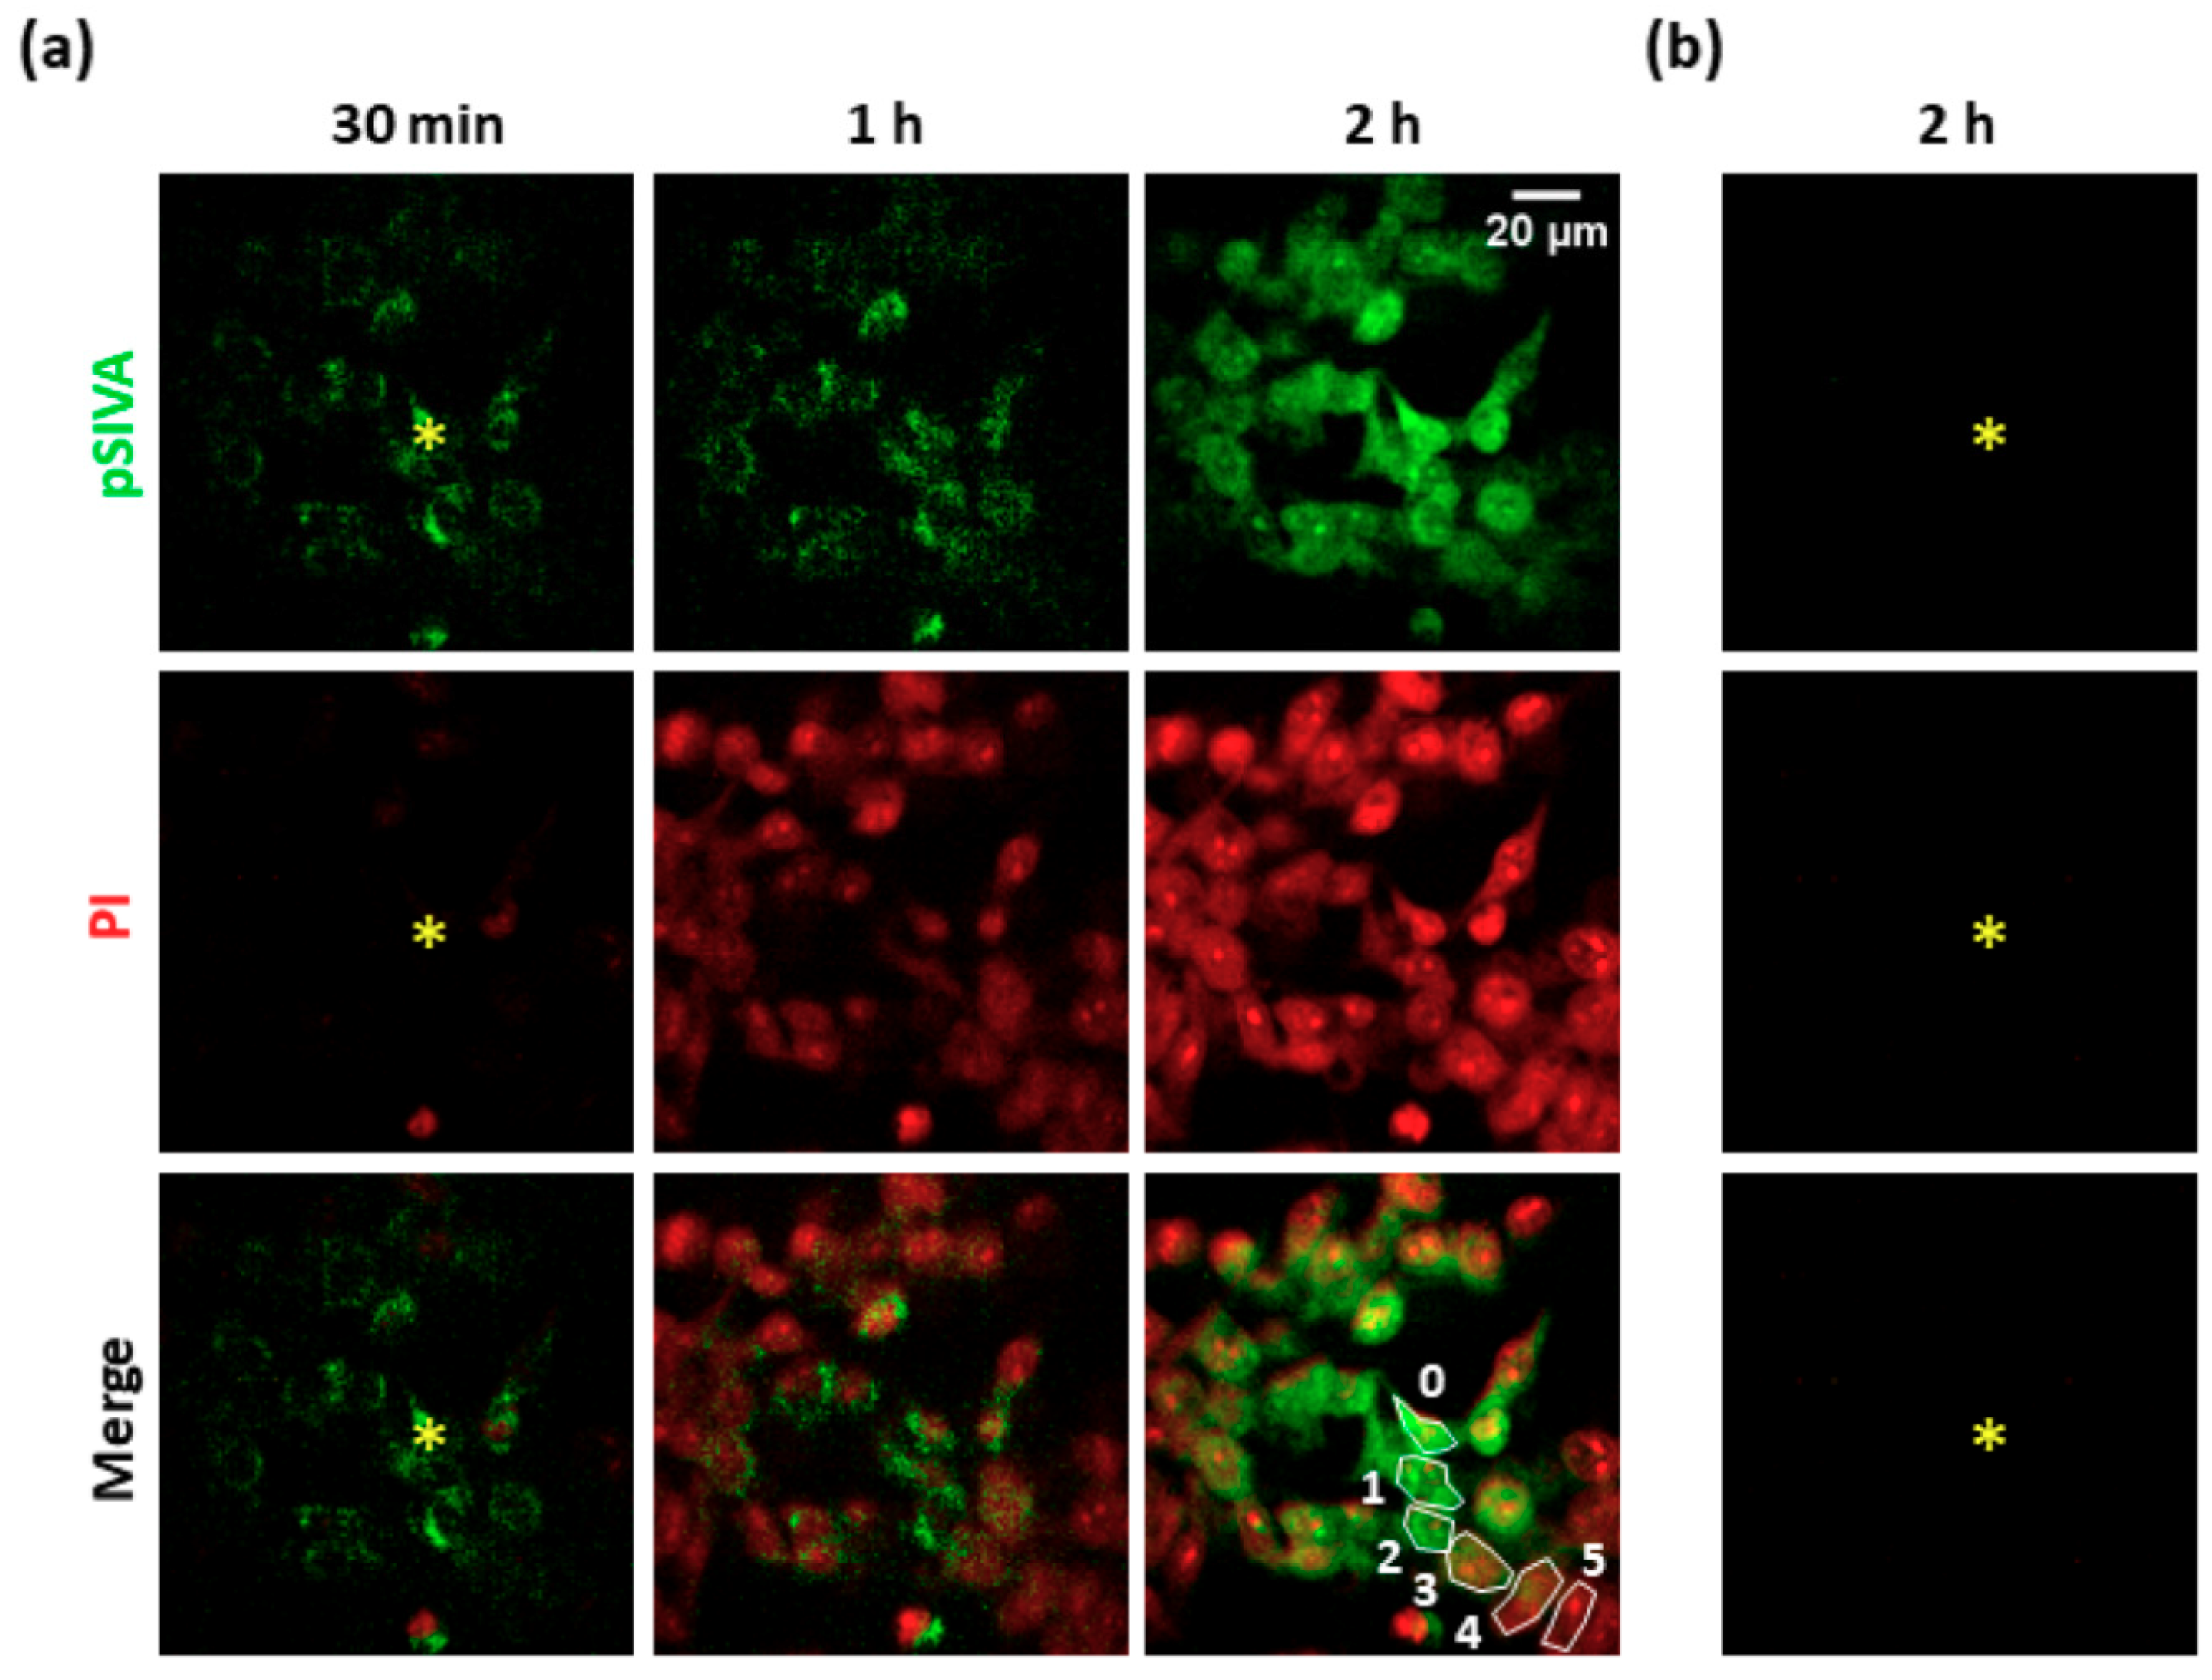
3.1. Focal PS Activation Induces Apoptosis in Bystander Cells

To investigate the effects of PS activation, we exposed B16-F10 cell cultures to focal irradiation under SS conditions (see Materials and Methods, Section 2.2). At the end of photostimulation, we used a live/dead colorimetric assay to test the effectiveness of the photoactivation protocol. We detected impairment of plasma membrane integrity within 15 min both in the directly exposed cell and in the surrounding nonirradiated (i.e., bystander) cells (see Supplementary Materials, Figure S2). Next, we performed time-lapse confocal fluorescence microscopy to investigate the occurrence of apoptotic processes using the pSIVA-IANBD polarity sensitive probe, which binds to phosphatidylserine exposed on the surface of apoptotic cells, and propidium iodide (PI), which selectively stains the nuclei of damaged cells. As shown in Figure 1, the irradiated cell and surrounding bystander cells showed detectable pSIVA green fluorescence signals ~30 min after PS excitation was terminated. After one hour, PI nuclear staining was detectable in five orders of bystander cells (i.e., within an area of radius ~80 μm from the irradiated cell). Dead or late apoptotic cells were revealed in the whole field of view (radius ~100 μm) within two hours of photostimulation. In a separate set of experiments, we used B16-F10 cell cultures expressing GANLS-DEVD-BNES (see Materials and Methods, Section 2.1), a genetically encoded fluorescent biosensor that decreases its fluorescence emission upon activation of caspase-3 [26]. As shown in Supplementary Materials, Figure S3, the fluorescence emission of GANLS-DEVD-BNES decreased by 44 ± 1% in bystander cells of the 1st order, by 32 ± 1% in the 2nd order, by 30 ± 1% in the 3rd order, and 28 ± 1% in the 4th order.
Together, these results indicate that PS activation in a single B16-F10 cell triggered pro-apoptotic stimuli that were transmitted to bystander nonexposed cells, in accord with prior work in different tumor cell lines [16].

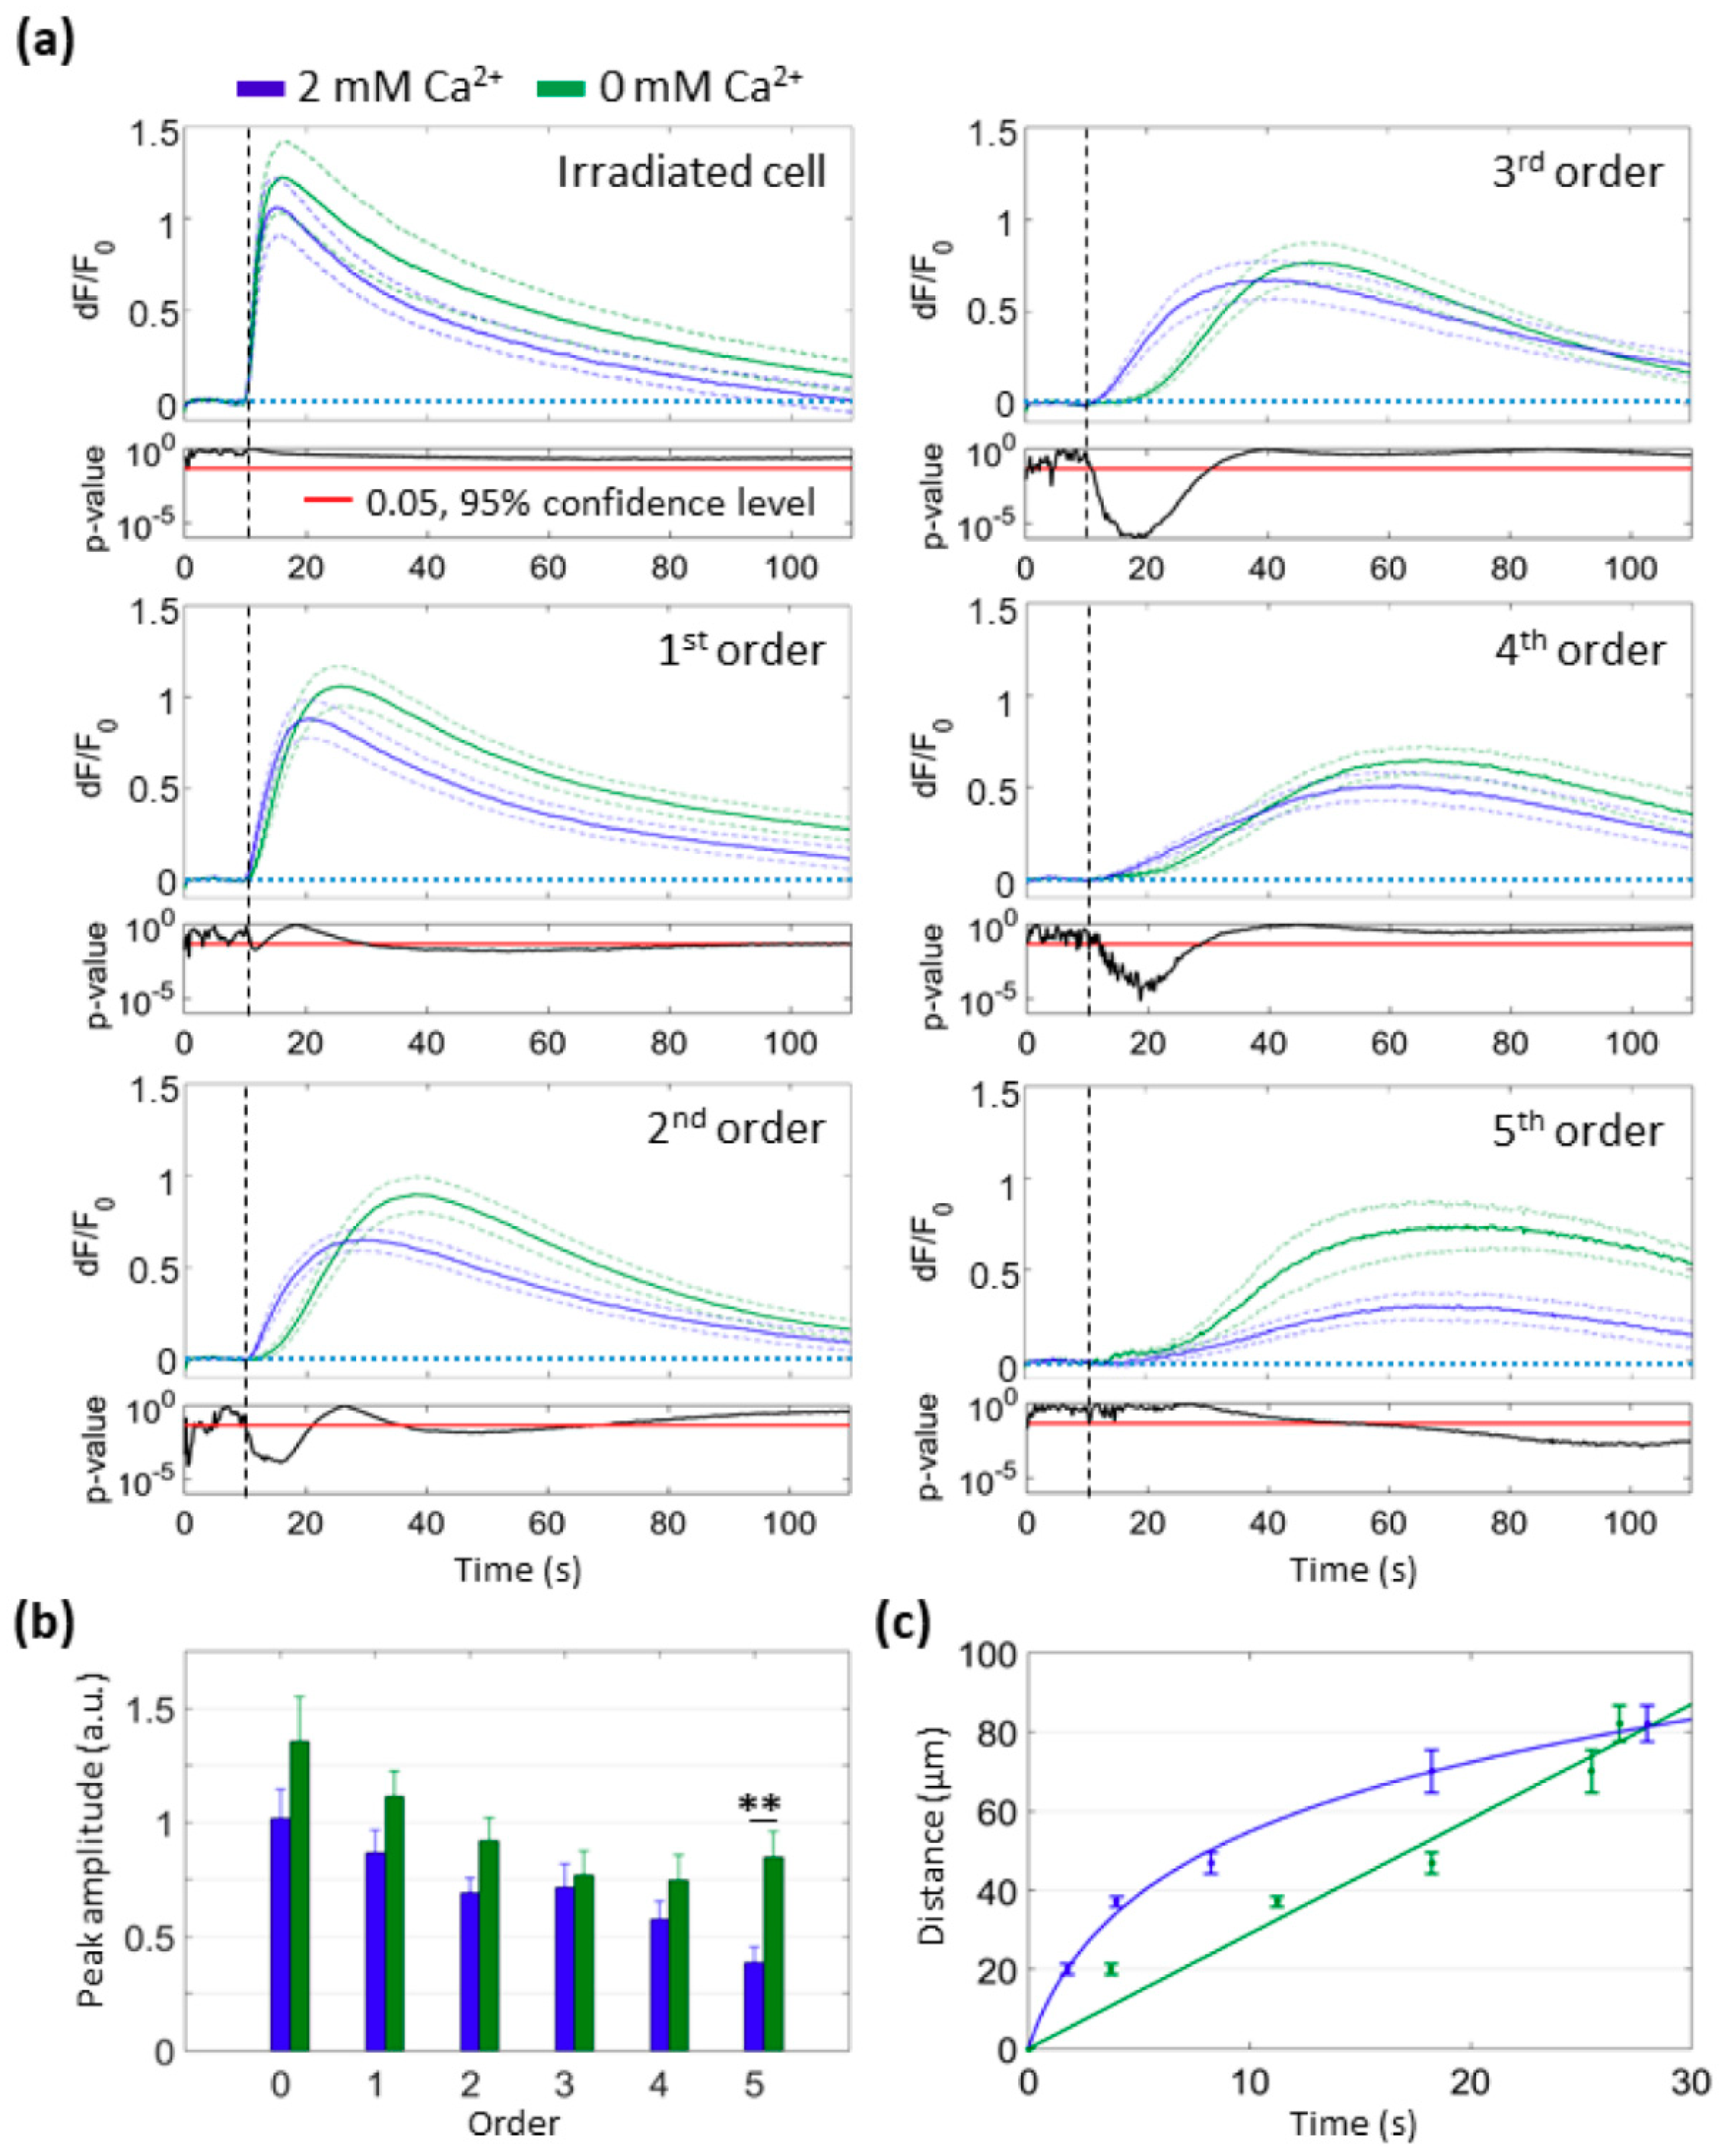
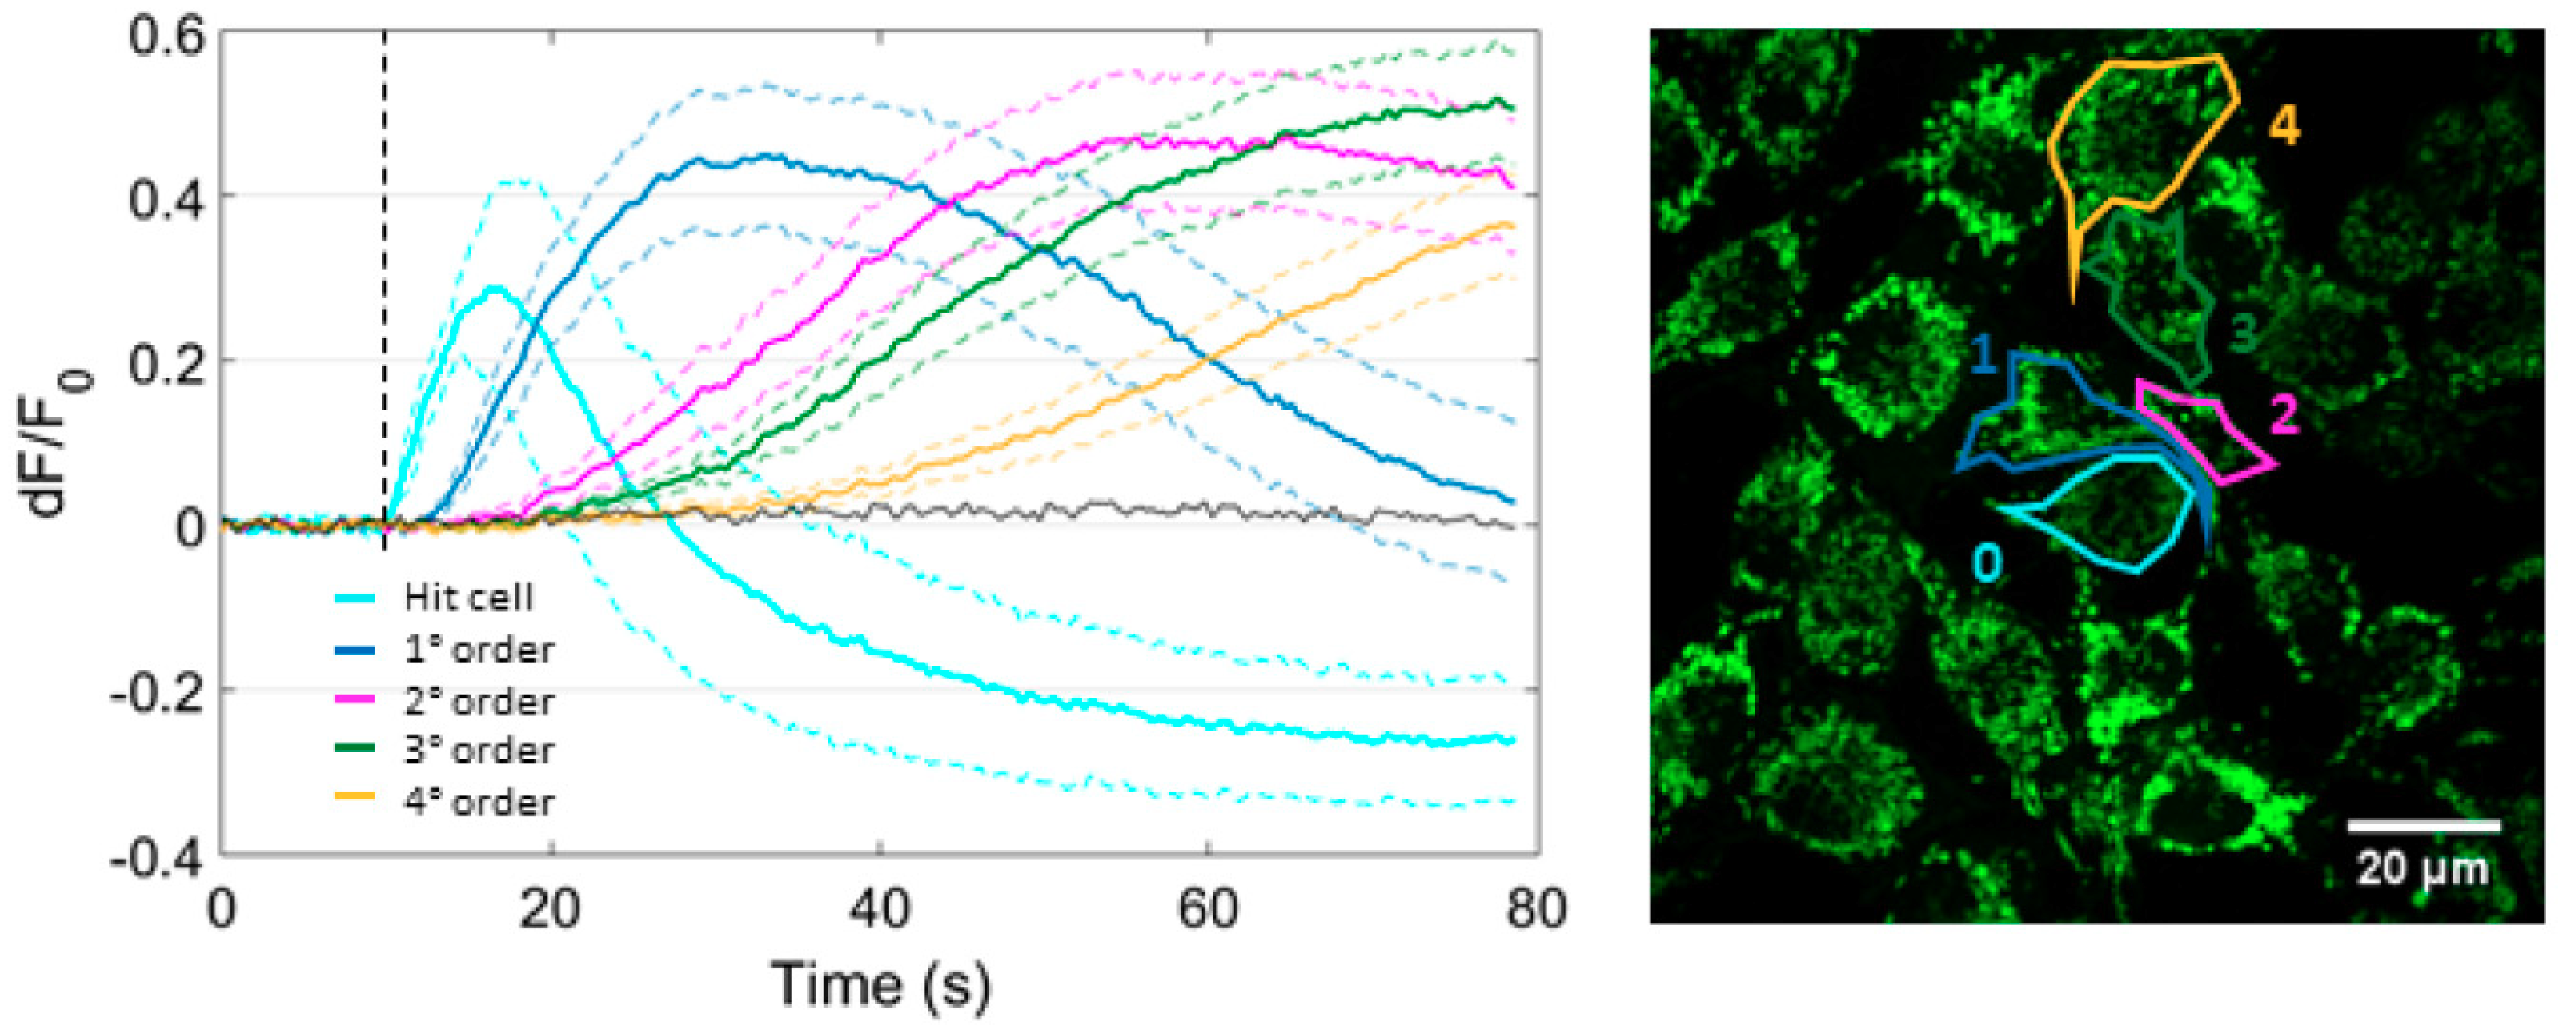
3.2. Focal PS Activation Triggers an Intercellular Cytosolic Ca2+ Wave that Spreads Radially across Bystander Cells Both in the Presence and in the Absence of Extracellular Ca2+

In prior work, we showed that changes of cytosolic Ca2+ concentration ([Ca2+]c) in C26GM and MCA-203 tumor cells propagate as a wave from the irradiated cell to bystander cells, while NO diffuses rapidly out of the irradiated cell [16]. Here, we monitored cytosolic Ca2+ signaling with Fluo-4 in B16-F10 cultures. As shown in Figure 2, cytosolic Ca2+ responses were detected in all cells of the field of view (i.e., at least up to the 5th order of bystander cells) within one minute of PS photoactivation under SS conditions. To determine whether these [Ca2+]c elevations were due to Ca2+ influx and/or release from intercellular Ca2+ stores, we repeated focal PS activation experiments in a Ca2+-free extracellular medium (see Materials and Methods, Section 2.2). Data analysis showed no statistically different [Ca2+]c peaks up to the 4th order of bystander cells (Figure 2b), indicating that the increase of [Ca2+]c was mainly due to the mobilization of Ca2+ from the internal sources.
However, the kinetics of wave propagation was significantly different in the two experimental conditions. Namely, in 2 mM extracellular Ca2+ concentration ([Ca2+]e), the propagation speed was larger (5.4 ± 0.8 µm/s, n = 6 independent experiments) within cells of the 3rd order (i.e., ~50 μm from the irradiated cell) and lower in bystander cells of higher orders (2.8 ± 0.4 μm/s, n = 6 independent experiments, P = 0.006). In 0 mM [Ca2+]e, the difference between the wave speeds in 3rd and 5th order cells approached statistical significance (3.8 ± 0.7 µm/s and 2.1 ± 0.2 μm/s, n = 6 independent experiments, P = 0.06). To a first approximation, the kinetics of wave propagation were fitted to a logarithmic function for the 2 mM condition and to a linear function for the 0 mM condition (Figure 2c). Moreover, in cells of the 5th order, the peak amplitude of the Fluo-4 signal, the area subtended by the signal, and the slope of the rising phase of the signal were all significantly larger in 0 mM [Ca2+]e than in 2 mM [Ca2+]e (Figure 2b; see also Supplementary Materials Figure S4).
In summary, the amplitude of cytosolic Ca2+ signals in 2 mM [Ca2+]e decreased with distance from the source, whereas in 0 mM [Ca2+]e we observed an opposite trend. This paradoxical effect supports the notion that intracellular Ca2+ stores play a critical role in the bystander signals triggered by PS activation.

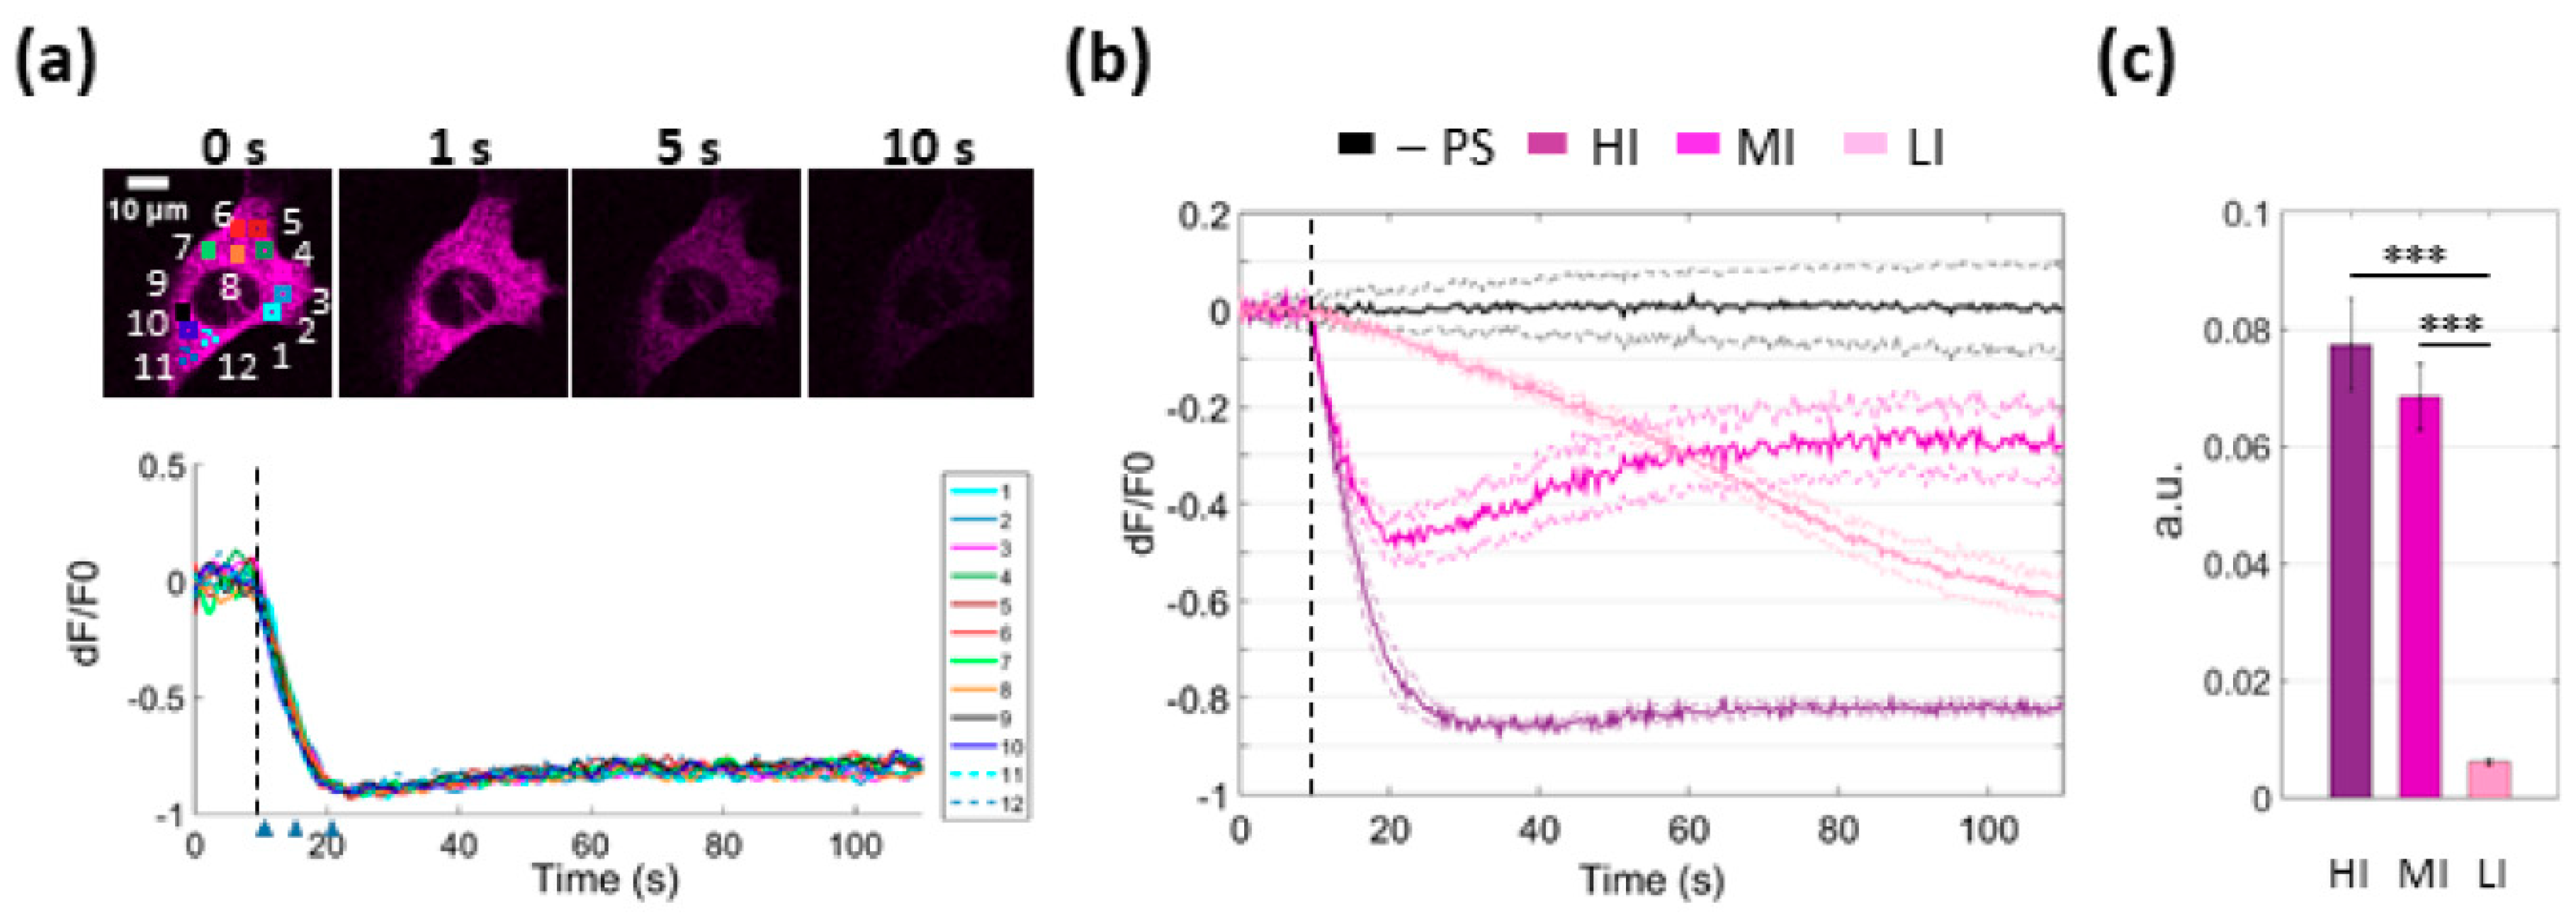
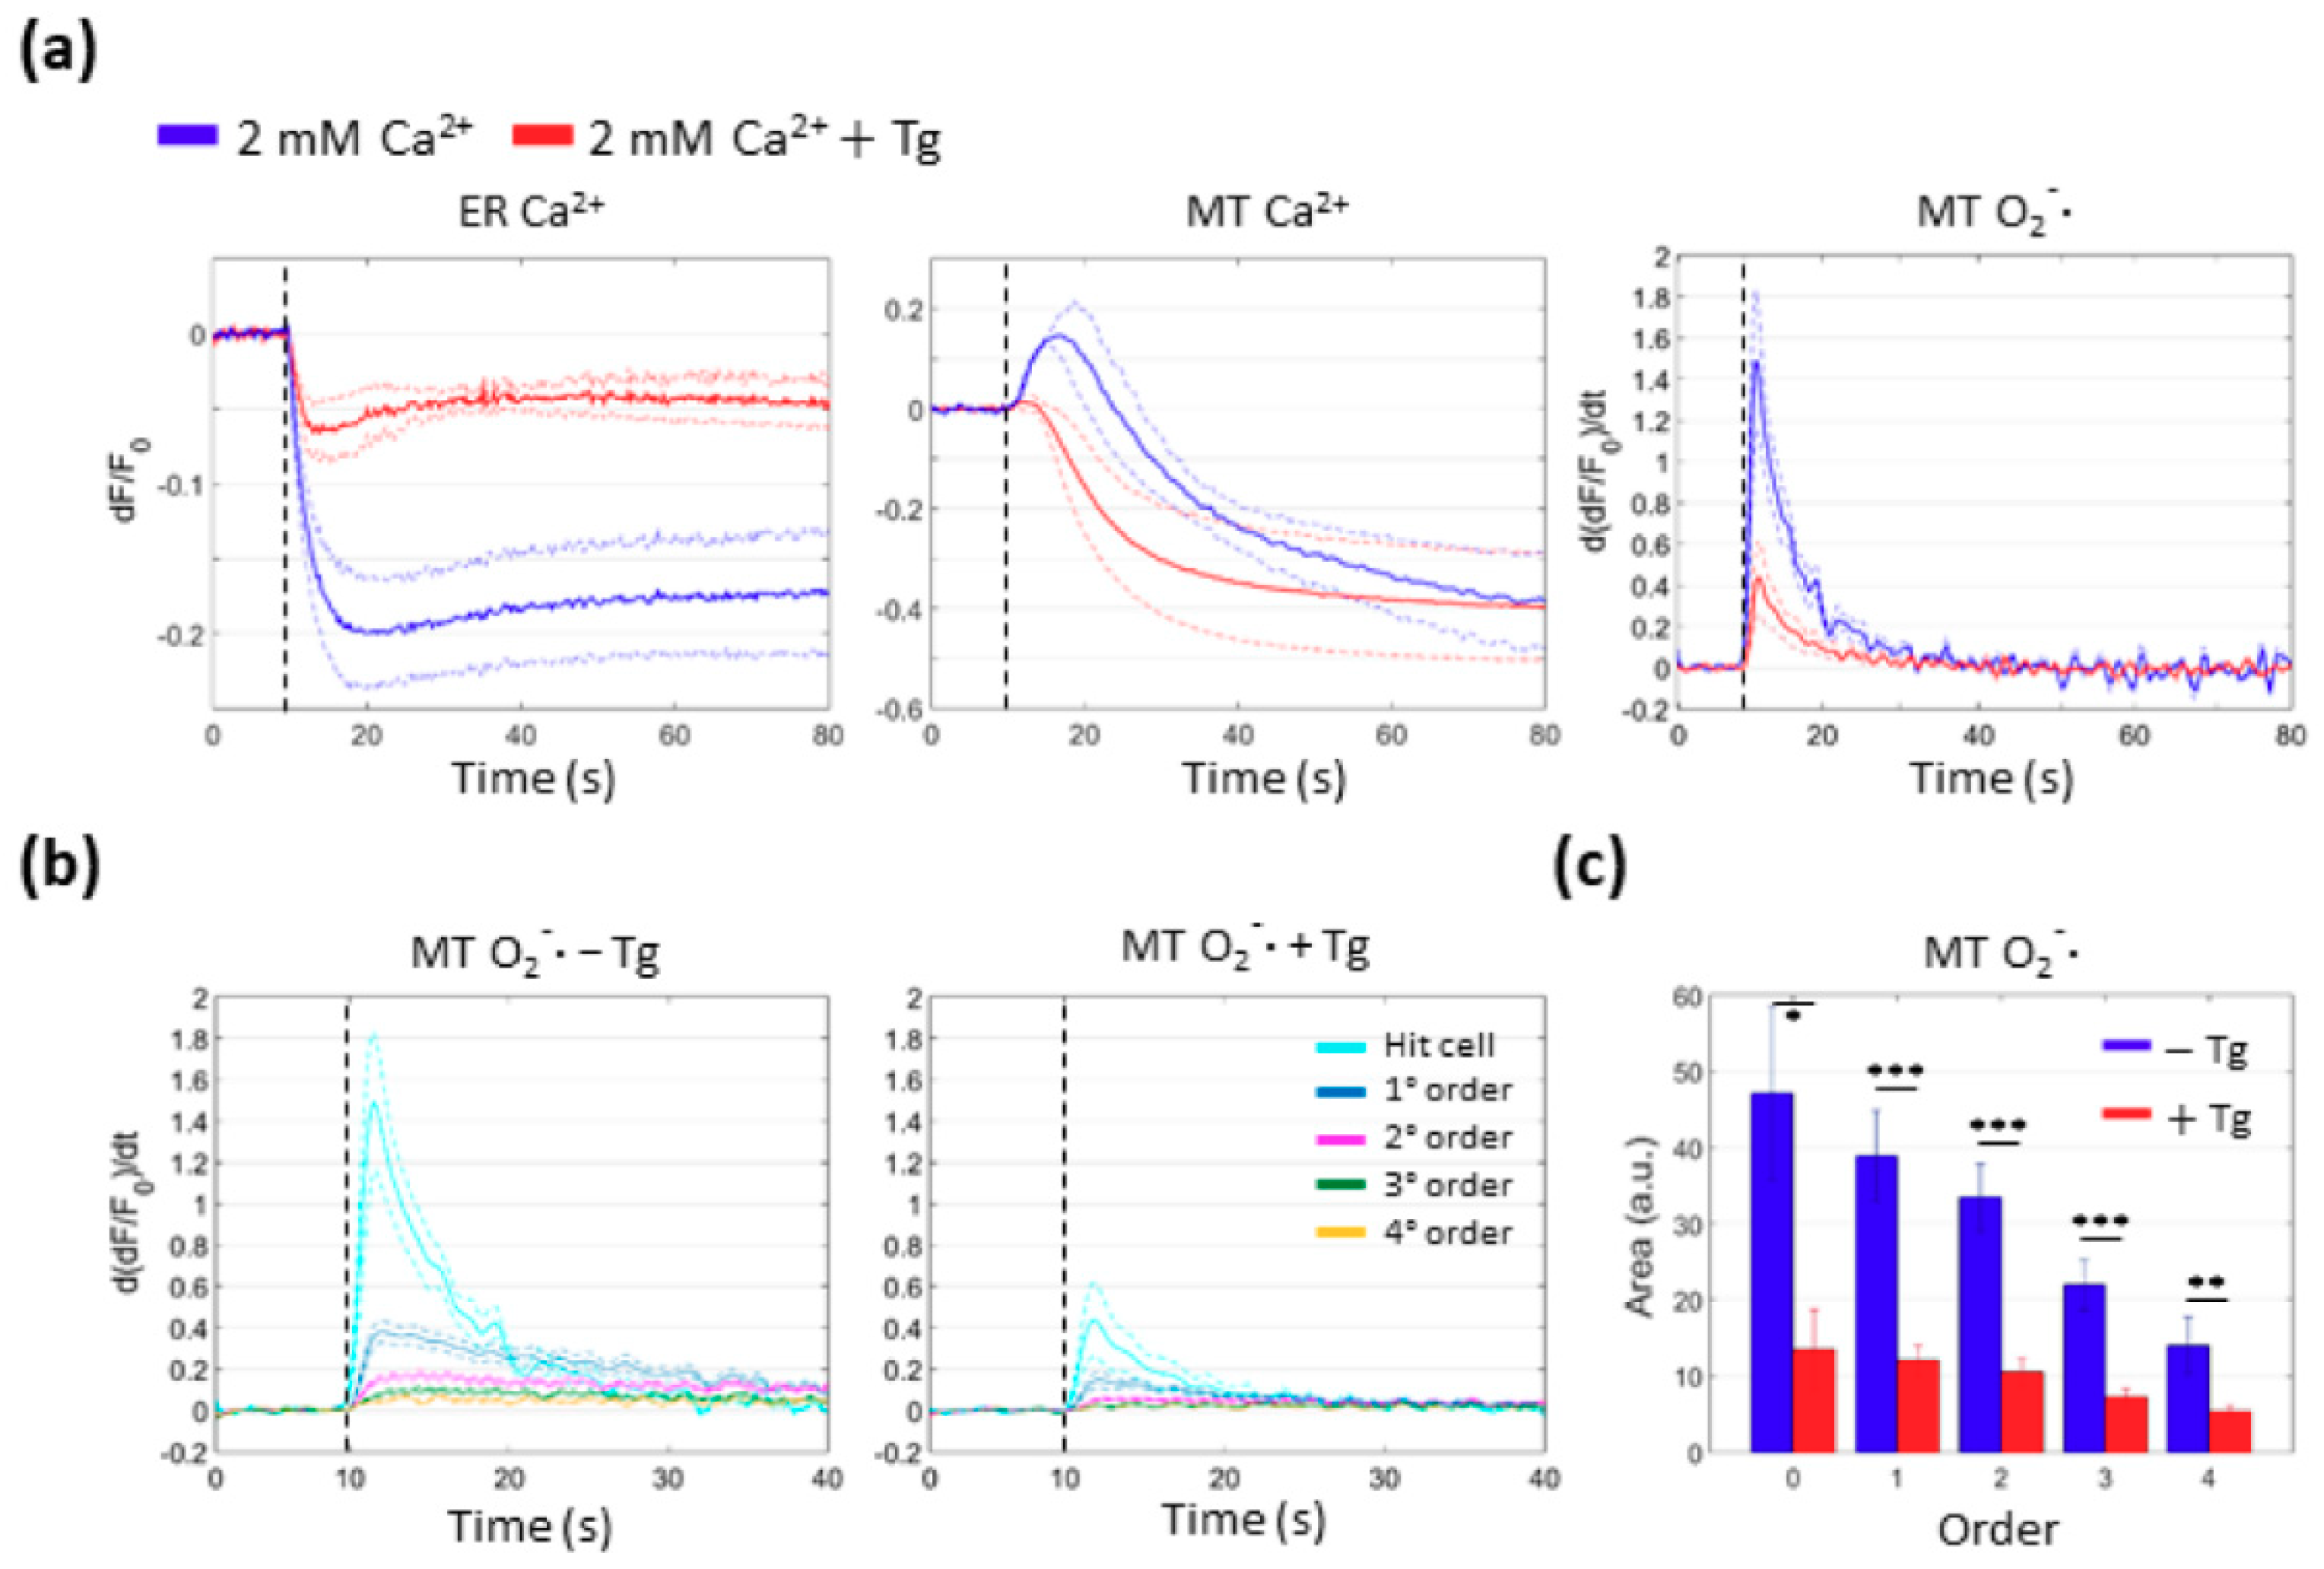
3.3. PS Activation Triggers Ca2+ Release from the ER

To determine whether the ER is the main source of the observed cytosolic Ca2+ rise upon PS activation, we used B16-F10 cells expressing R-CEPIA1er, a red-fluorescent Ca2+ biosensor targeted to the ER [27]. Imaging of PS-loaded cells revealed a rapid drop of the [Ca2+]ER following photostimulation under HI conditions (Figure 3a). This characteristic drop was never observed in cells not loaded with the PS, indicating that the effect was not due to photodamage of either the cell or the R-CEPIA1er biosensor by the laser used to activate the PS (Figure 3b, black traces). R-CEPIA1er signals from different subcellular ROIs were superimposable (Figure 3a), indicating homogeneity of Ca2+ release from the ER in these conditions. We tested also different irradiation levels and determined that HI conditions compromised irreversibly the refilling capability of the ER (Figure 3b). Partial replenishment of ER Ca2+ content occurred under MI conditions. LI conditions still induced Ca2+ release from the ER, albeit at significantly diminished rates. ER Ca2+ release rates under HI and MI conditions were not significantly different, whereas the rate measured under LI conditions was about 10 times lower (Figure 3c).

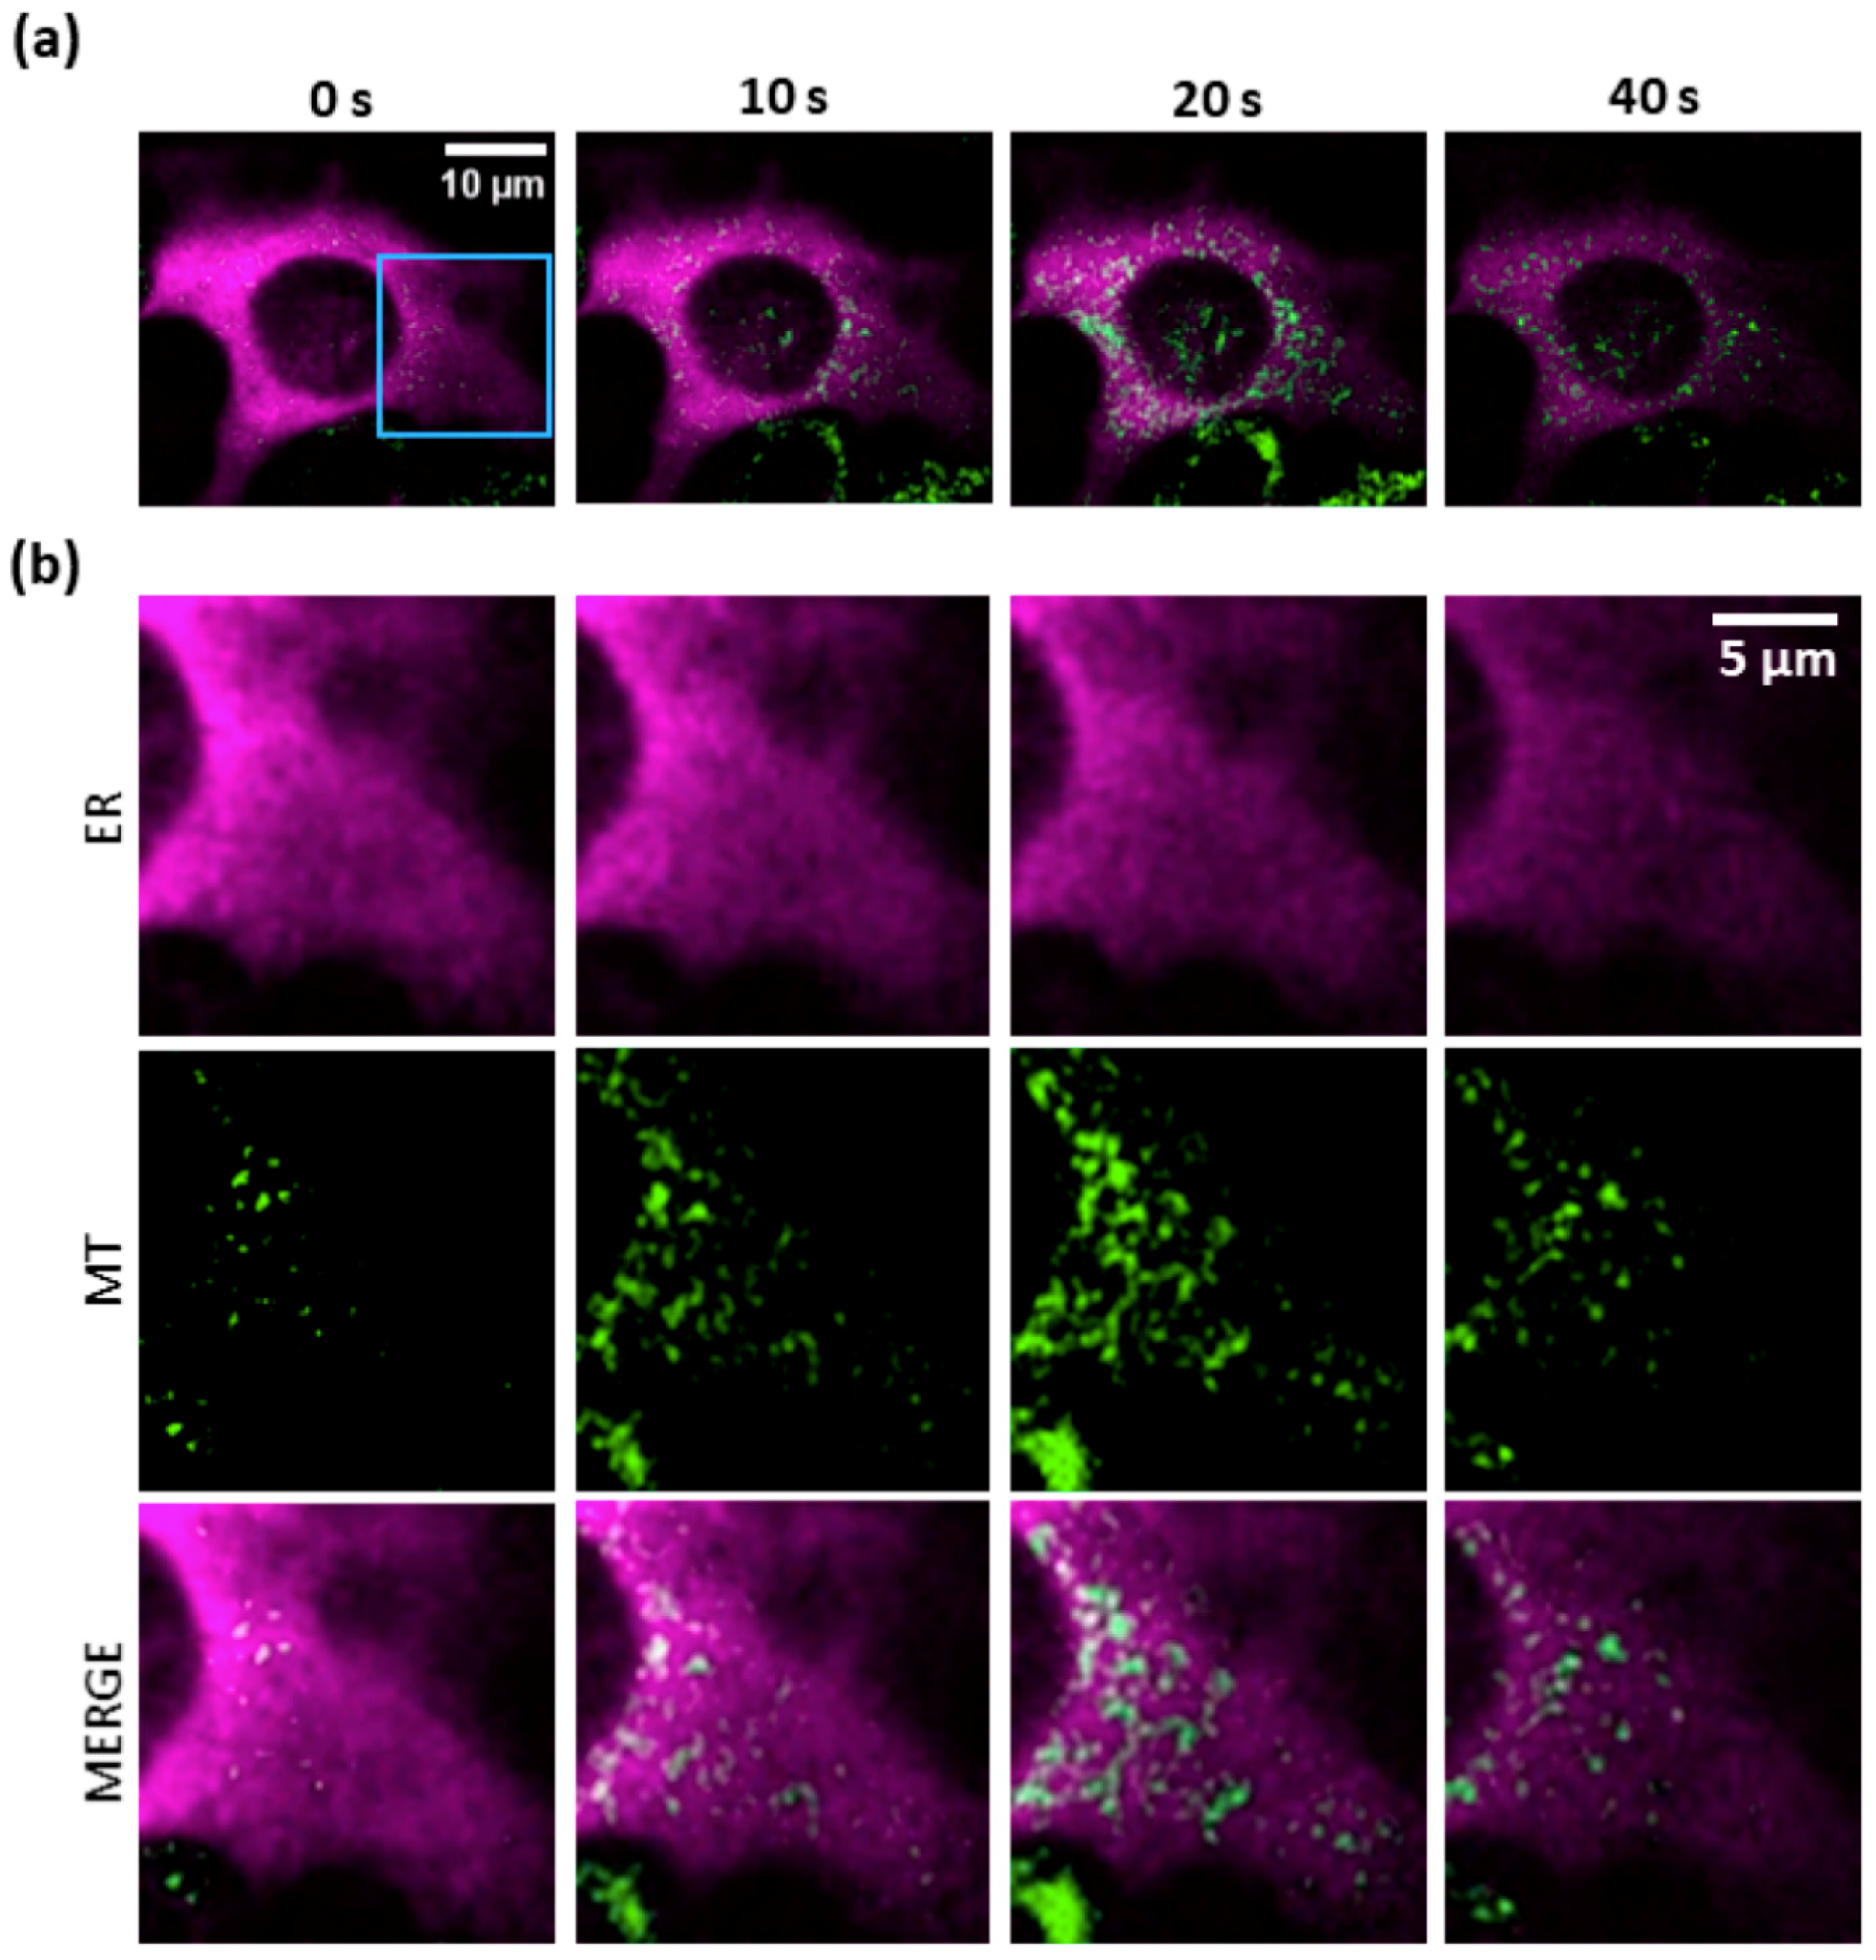
3.4. Mitochondria Attempt to Buffer the Ca2+ Released from the ER Following PS Activation

Release of Ca2+ ions from the ER is expected to activate mechanisms that buffer Ca2+ to avoid overloading the cytoplasm [28]. Figure 4 shows that LI photostimulation was sufficient to induce a coordinated mitochondrial Ca2+ uptake which paralleled Ca2+ release from the ER within the first 20 s of laser exposure. For these experiments, we used CEPIA2mt, a green fluorescent mitochondrial Ca2+ biosensor [27], in combination with multicolor multiphoton imaging of PS-loaded B16-F10 cells co-expressing R-CEPIA1er and CEPIA2mt (see Materials and Methods, Section 2.5). Note that, after an initial increase of Ca2+ concentration in the mitochondrial matrix, mitochondria started to leak out Ca2+ ions, as shown by the dimming of the CEPIA2mt signal (which was not due to photobleaching; see also Supplementary Materials, Video V1).
Next, we monitored mitochondrial Ca2+ to determine whether or not uptake occurred in bystander cells under SS conditions. As shown in Figure 5, the mean mitochondrial Ca2+ concentration ([Ca2+]m) increased in each order of bystander cells within the field of view and was progressively delayed with increasing distance from the site of photostimulation (see also Supplementary Materials, Video V2). In the irradiated cell, [Ca2+]m rose to a peak within ~6 s from the onset of laser irradiation, decreased toward the baseline level in ~11 s, and thereafter kept following below this level. In cells of the 1st order, [Ca2+]m fell towards the prestimulus level by the end of observation time window (80 s). At this time point, [Ca2+]m was still elevated in cells of higher orders (Figure 5).

3.5. Mitochondrial Ca2+ Uptake and O2∙ Production Depend on Ca2+ Release from the ER

The results reported above suggested a dependence of mitochondrial Ca2+ uptake on Ca2+ release from the ER. In order to test this hypothesis, we performed PS activation under SS conditions in cells that had been previously treated with Thapsigargin (Tg), a specific and irreversible inhibitor of sarco/endoplasmic reticulum Ca2+-ATPase (SERCA) pumps (see Materials and Methods, Section 2.4.1, and Supplementary Materials, Figure S5). Ca2+ release from the ER was significantly reduced after the exposure to Tg compared with control conditions (Figure 6a). Importantly, mitochondrial Ca2+ uptake was suppressed and fluorescence emission from the mitochondrial Ca2+ biosensor decreased below the prestimulus level ~5 s (n = 3 cells) after the onset of photostimulation.
Cytotoxic effects due to PS excitation are mainly attributed to downstream ROS cascades [9]. To characterize the dynamics of ROS production under SS conditions, we loaded B16-F10 cells with MitoSOX Red, a fluorescent indicator selective for mitochondrial O2. The response of MitoSOX Red was extremely rapid in the irradiated cell, as expected, since O2 is a product of primary (type I) photochemical reactions triggered by PS activation [29]. Surprisingly, we detected O2 signals also in bystander cells up to the 4th order within seconds (see Supplementary Materials, Video V3), indicating that O2 production in these cells proceeded by a different pathway, independent of direct PS activation. Of note, mitochondrial O2 production was considerably inhibited, both in the irradiated cell and in bystander cells, by pretreatment with Tg, indicating that it depended on Ca2+ release from the ER (Figure 6b,c).
Together, these results support the notion that mitochondrial Ca2+ uptake spreads cytotoxic effects triggered by PS activation in the irradiated cell by promoting additional mitochondrial ROS production in bystander cells. Ca2+ release from the ER is key to this process, and ultimately leads to the spreading of apoptosis to bystander cells, as shown in Figure 1.

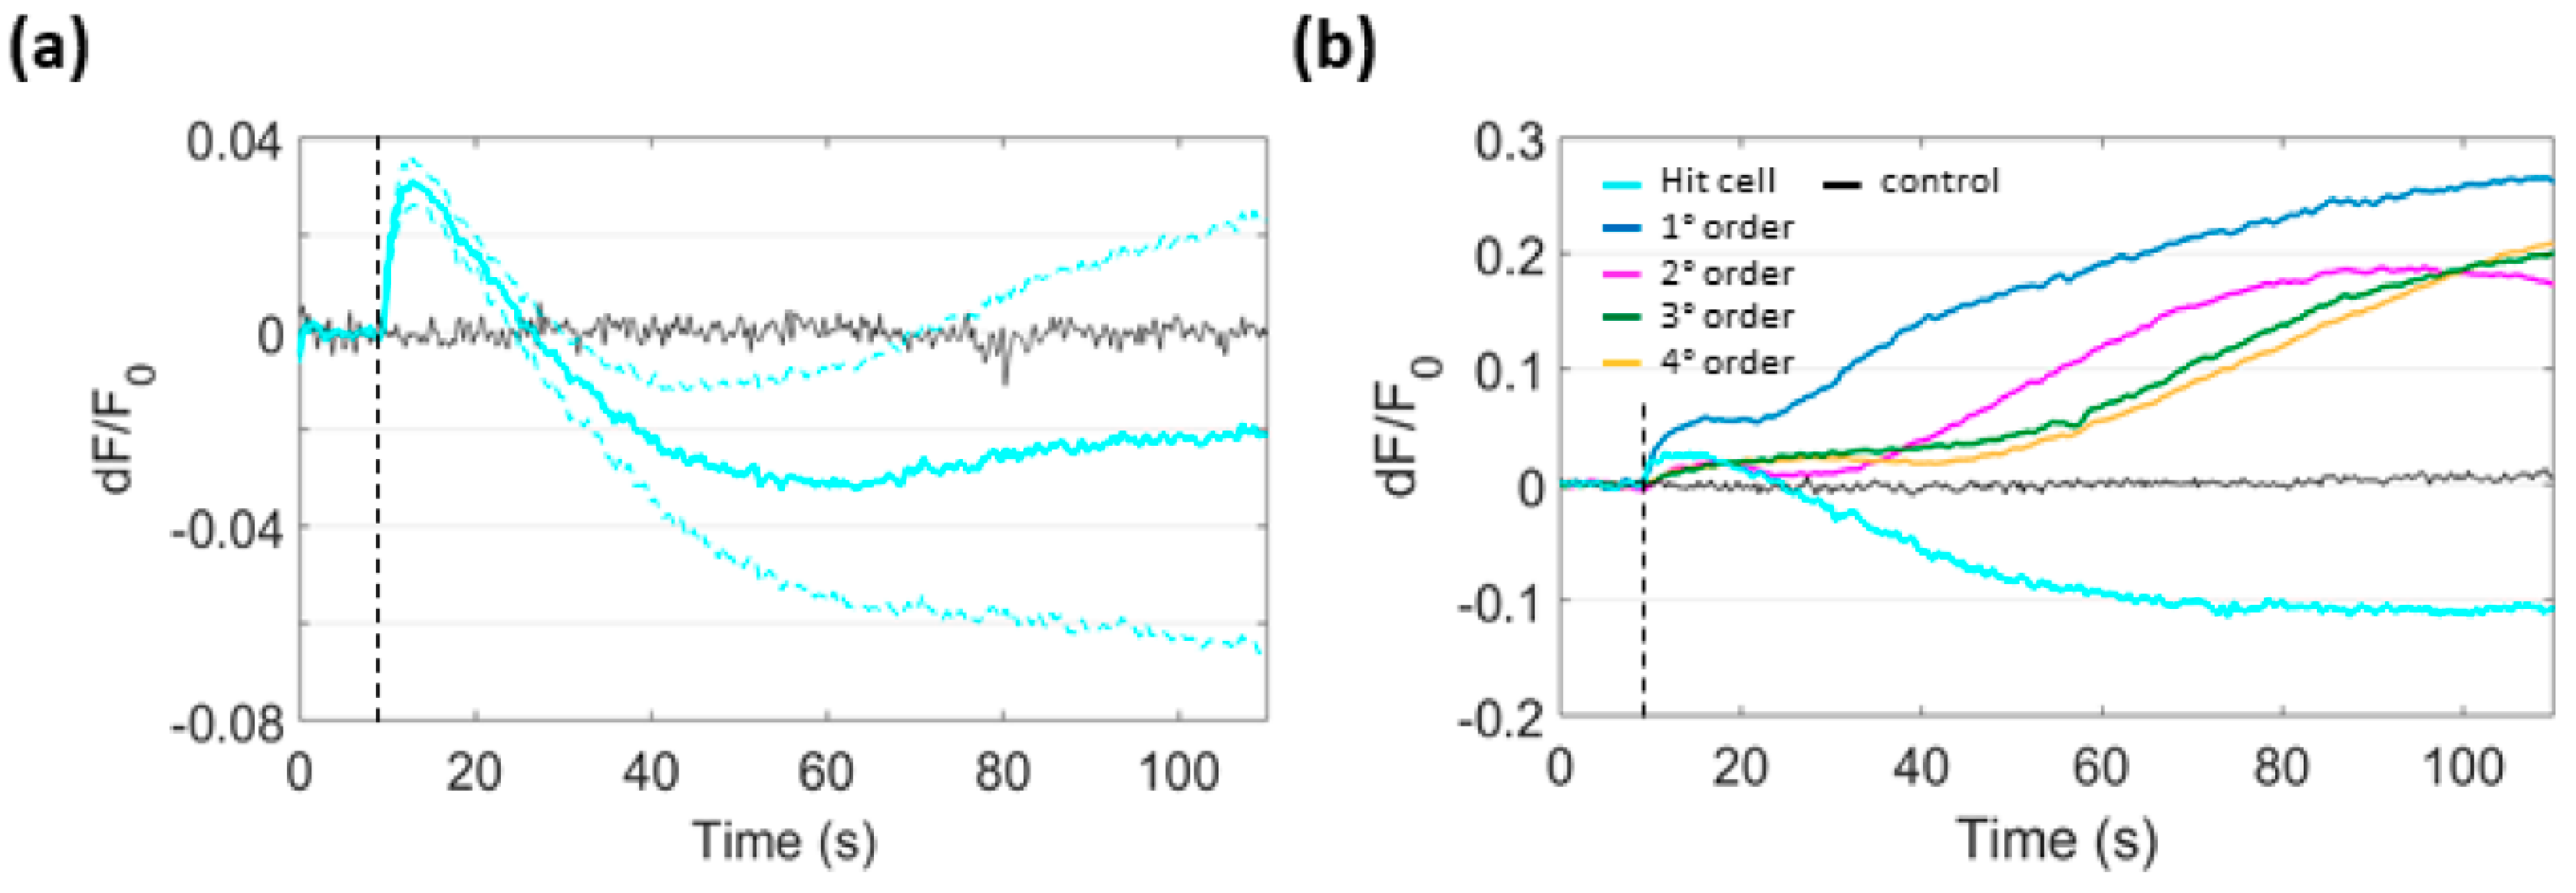
3.6. Focal PS Activation Promotes H2O2 Production in Bystander Cells

In cells, spontaneous dismutation or enzymatic reactions convert O2 to H2O2 [30]. To determine whether this pathway was activated following PS excitation, we used B16-F10 cells expressing HyPerRed, a red fluorescent selective biosensor which can track H2O2 concentration changes [31]. Figure 7a shows instantaneous production of H2O2 in the irradiated cell following focal PS activation. Similar to mitochondrial Ca2+ biosensors, also HyPerRed fluoresce emission fell below prestimulus level after rising to a peak soon after PS activation. Within few seconds, H2O2 production proceeded with peculiar bimodal kinetics also in bystander cells from the 1st to the 4th order (Figure 7b).

4. Discussion

In the present study, we explored selected signaling pathways triggered by focal PS activation and the propagation of signals related to these pathways to surrounding nonexposed (bystander) cells. Our results can be summarized as follows: (i) focal excitation of the PS (Aluminum Phthalocyanine Chloride) promoted apoptosis in both irradiated and bystander cells; (ii) the cytosolic Ca2+ rise triggered by photoactivation of the PS was mainly due to Ca2+ release from intercellular Ca2+ stores both in the irradiated cell and in the bystander cells up to a distance of ~80 µm; (iii) Ca2+ ions released by the ER following PS activation were partially transferred to the mitochondrial matrix; (iv) pre-emptying of ER Ca2+ store by the irreversible SERCA pump inhibitor Thapsigargin prevented both photoactivation-induced Ca2+ uptake and O2 production in mitochondria; (v) H2O2 levels rose with a bimodal kinetics in bystander cells within seconds of PS excitation.

4.1. PS Activation-Induced Ca2+ Signaling in the ER

The excitation of photosensitized cells causes the rise of [Ca2+]c in a plethora of cellular systems [16,32,33,34,35]. Surprisingly, in our system, peak amplitudes of cytosolic Ca2+ signals were systematically, albeit not significantly, higher in 0 mM [Ca2+]e compared with 2 mM [Ca2+]e in all cells. In addition, the peak amplitude, the area subtended by the signal, and the slope of the linear rising signal in furthest bystander cells were all significantly larger in 0 mM [Ca2+]e than in 2 mM [Ca2+]e., indicating that the propagation of the cytosolic Ca2+ wave was strengthened in the absence of extracellular Ca2+.
It is well known that different mechanisms contribute to the spatiotemporal shaping of cytosolic Ca2+ signals [28,36]. Among them, store-operated Ca2+ entry (SOCE) is the major route of Ca2+ influx in nonexcitable cells [36,37]. When the ER Ca2+ store is depleted, extracellular Ca2+ ions enter the cell through plasma membrane (PM) channels at ER–PM contacts and are rapidly redistributed to the whole ER lumen [38]. It has been reported that in the presence of a prolonged Ca2+-mobilizing stimulus, external Ca2+ influx by SOCE serves as “driving force” for continuous Ca2+ release in the cytoplasm [39]. This process might play a role in cellular response to photodynamic insult. In fact, ER could function as a bypass route for Ca2+ from extracellular space to cytosol. If this was the case, the extracellular space would provide an additional Ca2+ source that would allow the cell to partially save the ER Ca2+ store. On the contrary, in 0 mM [Ca2+]e ER stress would be stronger, resulting in delayed reactions towards recovery of Ca2+ homeostasis, larger cytosolic Ca2+ signals, and possibly enhanced cellular damage. Several studies support the idea that Ca2+ concentration in the ER controls cellular sensitivity to apoptosis depending on the amount of Ca2+ released following a Ca2+-mobilizing stimulus [40,41], including PS activation [35,42]. Hence, it would be interesting to investigate the amount of Ca2+ released, as well as the extension of Ca2+ wave propagation, in 0 mM [Ca2+]e and whether inhibition of external Ca2+ influx could enhance cytotoxic stimuli transmission.
Our findings also revealed that Ca2+ release from the ER following PS activation was nonlinearly dependent on the irradiance. In fact, the lowest irradiance we tested (~7∙103 mW/cm2) was comparatively more efficient at depleting ER Ca2+ store than the medium irradiance, which was 3 orders of magnitude higher (~4∙106 mW/cm2), albeit in the first case ER emptying proceeded far more slowly. The simplest explanation is that efficiency of photochemical reactions triggered by PS excitation depends on O2 availability, which limits the rate of 1O2 and O2 production, and, ultimately, sets an upper boundary for photodynamic cell-killing efficiency [9,43].
Together, our data suggest a central role for intracellular Ca2+ stores in the bystander signals triggered by PS activation. Recent work in intact cells by Joseph and colleagues demonstrated that “sensitization of inositol 1,4,5-trisphosphate receptor (IP3R)-mediated Ca2+ release is associated with oxidative stress” [44]. In particular, both O2 and its breakdown product H2O2 directly activate IP3Rs [45,46]. Therefore, we speculate that ROS produced in primary and secondary photochemical reactions [29] triggered interorganellar Ca2+ signaling by direct activation of IP3Rs in the ER membrane. Of note, ER-refilling mechanisms were inhibited at the highest irradiance we used (~7∙106 mW/cm2), which is consistent with the notion that ROS inhibits SERCA pumping activity [47,48].

4.2. PS Activation-Induced Ca2+ Signaling in Mitochondria

Besides ER and extracellular space, mitochondria are known to shape the spatiotemporal profile of cytoplasmic Ca2+ signals, acting as Ca2+ sinks [28,49]. In our experiments, a fluorescent biosensor targeted to the inner mitochondrial matrix (IMM) signaled Ca2+ uptake, implying a role for ER–mitochondria tethering in photoactivation-dependent Ca2+ signaling. At ER–mitochondria contacts, physical membranous structures named mitochondrial-associated membranes (MAMs) form bridges which allow dynamic interactions between the two organelles [36]. During IP3R-mediated Ca2+ release from the ER, Ca2+ concentration at MAMs can locally reach even one order of magnitude higher values (~10 µM) than average [Ca2+]c, overcoming the opening threshold of the mitochondrial Ca2+ uniporter (MCU), the main Ca2+-selective channel responsible for fast Ca2+ accumulation in the IMM [36,50]. We have demonstrated here that mitochondrial Ca2+ uptake is involved in bystander Ca2+ signaling, generating an intercellular mitochondrial Ca2+ wave. That is, the increase in [Ca2+]m progressively propagated to nonexposed bystander cells up to a distance of ~80 μm within 30 s of PS activation. The [Ca2+]m increase lasted more than 60 s in bystander cells. In contrast, it rose to a peak and subsequently displayed a descending phase decreasing below prestimulus levels in the irradiated cell. Both Ca2+ overload and ROS elevation in mitochondria promote the opening of mitochondria permeability transition pores (mPTPs) [51,52]. The mPTP is a high-conductance nonselective channel in the IMM, the persistent opening of which induces IMM depolarization, cessation of oxidative phosphorylation, ROS production, Ca2+ efflux, and finally matrix swelling and outer mitochondrial membrane rupture, with consequent release of cytochrome c and other pro-apoptotic factors [52,53,54]. In prior work, we found that activation of the same PS used in the present studies causes cytochrome c release in bystander cells [16]. The mitochondrial permeability transition (PT) promotes apoptosis or necrosis, depending on the severity of the insult it mediates [53]. Our findings showed that apoptotic processes were activated in the irradiated and bystander cells. Hence, we hypothesize that PS excitation involved the mitochondrial PT and triggered the intrinsic or “mitochondrial” apoptotic pathway, which involves cytochrome c release from mitochondria and activation of caspase-9/-3 [55]. Further experiments tracking the kinetics of caspases activation in bystander cells are required to clarify the connection between interorganellar Ca2+ signaling and bystander cell killing.

4.3. Ca2+ Signaling and ROS Interplay in PS Activation-Induced Bystander Responses

Ca2+ and ROS signaling pathways are tightly interconnected in a mutual interplay: Ca2+ increase in the mitochondrial matrix drives ROS formation as a product of upregulated oxidative metabolism [30,48] and, in turn, ROS modulate Ca2+ signaling through interactions with PM Ca2+ channels, activation of intercellular Ca2+ release channels and inhibition of Ca2+ ATPases [48,56,57]. Moreover, they are both involved in cellular responses to PS excitation in cells and are key regulators of cell death processes. Nonetheless, the signaling scheme leading to the activation of cell death pathways following photostimulation remains unclear, especially the propagation of cytotoxic stimuli in bystander effects [21,58]. Several studies proposed ROS as mediators of bystander responses [19,23]. Here, we showed that an intercellular wave of mitochondrial O2 production spread from the irradiated cell towards nearby bystander cells within seconds of PS excitation. Importantly, we determined that Ca2+ efflux from the ER was required for mitochondrial Ca2+ overload and O2 production in both the irradiated and bystander cells. Therefore, our data indicate that ER–mitochondria Ca2+ transfer is crucial for the spreading of cytotoxic effects triggered by PS activation by promoting additional mitochondrial ROS production in bystander cells. It is even more likely to expect exacerbation of oxidative stress following PS activation because of the hypoxic condition due to photodynamic O2 consumption. In fact, recently published data reported that MCU is targeted by ROS in hypoxia conditions, stimulating mitochondrial Ca2+ accumulation [59]. Accordingly, we tracked a bimodal kinetics in the increase of H2O2 level in bystander cells after PS activation.

5. Conclusions

Collectively, our data support the hypothesis of a central role for ER–mitochondria communication in the induction of a mitochondrial Ca2+-driven second generation of ROS, which can be crucial for the induction of apoptotic pathways in bystander cells. In this process, ER stress is key to the modulation of Ca2+ signaling triggered by PS activation and, therefore, to the propagation of cytotoxic stimuli to nonexposed bystander cells.

Supplementary Materials

The following are available online at https://www.mdpi.com/2073-4409/8/10/1175/s1, Figure S1: Photoactivation area; Figure S2: Cell death process in PS-loaded B16-F10 cell cultures exposed single-cell irradiation; Figure S3: Focal PS excitation triggers Caspase-3 activation in the irradiated and bystander cells. Figure S4: Analysis of cytosolic Ca2+ signals triggered in bystander cells following single-cell PS activation in the presence or in the absence of extracellular Ca2+; Figure S5: Kinetics of ER Ca2+ store empting by Thapsigargin (Tg); Video V1: Simultaneous two-color confocal multiphoton imaging of interorganellar Ca2+ transfer following PS activation; Video V2: Propagation of intercellular mitochondrial Ca2+ wave following focal PS activation; Video V3: Mitochondrial O2∙ production in bystander cells following focal PS activation.

Author Contributions

Conceptualization, F.M. (Fabio Mammano); methodology, C.P., F.M. (Flavia Mazzarda), G.Z. and C.N.; software, C.P.; investigation, formal analysis, data curation, visualization and writing—original draft preparation, C.N.; writing—review and editing, F.M. (Fabio Mammano); supervision, A.M.S.; project administration, resources and funding acquisition, F.M. (Fabio Mammano).

Funding

This research was funded by the National Research Council of Italy (CNR), Grant No. DSB.AD008.370.003\TERABIO-IBCN to F.M. (Fabio Mammano).

Conflicts of Interest

The authors declare no conflict of interest. The funders had no role in the design of the study; in the collection, analyses, or interpretation of data; in the writing of the manuscript, or in the decision to publish the results.

Abbreviations

AMAcetoxymethyl esterNONitric oxide
Ca2+CalciumO2Molecular oxygen
[Ca2+]cCytosolic calcium concentration1O2Singlet oxygen
[Ca2+]EREndoplasmic reticulum calcium concentrationO2Superoxide anion
[Ca2+]eExtracellular calcium concentrationODOptical density
[Ca2+]mMitochondrial calcium concentrationOHHydroxyl radical
DAPI4′,6-diamidino-2-phenylindolePp-value
EREndoplasmic reticulumPDTPhotodynamic therapy
FBSFetal bovine serumPIPropidium iodide
HIHigh irradiancePMPlasma membrane
H2O2Hydrogen peroxidePSPhotosensitizer
IMMInner mitochondrial membranepSIVAPolarity Sensitive Indicator of Viability Apoptosis
IP3RsInositol 1,4,5-trisphosphate receptorsPTPermeability transition
LEDLight emitting diodeROIsRegions of interest
LILow irradianceROSReactive oxygen species
MAMsMitochondria-associated membraness.e.m.Standard error of the mean
MCUMitochondrial calcium uniporterSERCASarco/endoplasmic reticulum calcium ATPase
MIMedium irradianceSOCEStore-operated calcium entry
mPTPsMitochondrial permeability transition poresSSStandard stimulation
MTMitochondriaTgThapsigargin
NESNormal extracellular solutionTTLTransistor-transistor logic

References

  1. Dolmans, D.E.; Fukumura, D.; Jain, R.K. Photodynamic therapy for cancer. Nat. Rev. Cancer 2003, 3, 380–387. [Google Scholar] [CrossRef]
  2. Moan, J.; Peng, Q. An outline of the hundred-year history of PDT. Anticancer. Res. 2003, 23, 3591–3600. [Google Scholar] [PubMed]
  3. Castano, A.P.; Mroz, P.; Hamblin, M.R. Photodynamic therapy and anti-tumour immunity. Nat. Rev. Cancer 2006, 6, 535–545. [Google Scholar] [CrossRef] [PubMed] [Green Version]
  4. Allison, R.R.; Bagnato, V.S.; Sibata, C.H. Future of oncologic photodynamic therapy. Future Oncol. 2010, 6, 929–940. [Google Scholar] [CrossRef] [Green Version]
  5. Zhang, W.; Zhang, A.; Sun, W.; Yue, Y.; Li, H. Efficacy and safety of photodynamic therapy for cervical intraepithelial neoplasia and human papilloma virus infection: A systematic review and meta-analysis of randomized clinical trials. Medicine 2018, 97, e10864. [Google Scholar] [CrossRef] [PubMed]
  6. Santezi, C.; Reina, B.D.; Dovigo, L.N. Curcumin-mediated Photodynamic Therapy for the treatment of oral infections—A review. Photodiagn. Photodyn. Ther. 2018, 21, 409–415. [Google Scholar] [CrossRef]
  7. Ho, Y.F.; Chao, A.; Chen, K.J.; Chao, A.N.; Wang, N.K.; Liu, L.; Chen, Y.P.; Hwang, Y.S.; Wu, W.C.; Lai, C.C.; et al. Clinical outcomes and predictors of response to photodynamic therapy in symptomatic circumscribed choroidal hemangioma: A retrospective case series. PLoS ONE 2018, 13, e0197088. [Google Scholar] [CrossRef]
  8. Castano, A.P.; Demidova, T.N.; Hamblin, M.R. Mechanisms in photodynamic therapy: Part one—Photosensitizers, photochemistry and cellular localization. Photodiagn. Photodyn. Ther. 2004, 1, 279–293. [Google Scholar] [CrossRef]
  9. Ochsner, M. Photophysical and photobiological processes in the photodynamic therapy of tumours. J. Photochem. Photobiol. B 1997, 39, 1–18. [Google Scholar] [CrossRef]
  10. Castano, A.P.; Demidova, T.N.; Hamblin, M.R. Mechanisms in photodynamic therapy: Part two–Cellular signaling, cell metabolism and modes of cell death. Photodiagn. Photodyn. Ther. 2005, 2, 1–23. [Google Scholar] [CrossRef]
  11. Mothersill, C.; Seymour, C.B. Radiation-induced bystander effects—Implications for cancer. Nat. Rev. Cancer 2004, 4, 158–164. [Google Scholar] [CrossRef]
  12. Dahle, J.; Bagdonas, S.; Kaalhus, O.; Olsen, G.; Steen, H.B.; Moan, J. The bystander effect in photodynamic inactivation of cells. Biochim. Biophys. Acta 2000, 1475, 273–280. [Google Scholar] [CrossRef]
  13. Skovsen, E.; Snyder, J.W.; Lambert, J.D.; Ogilby, P.R. Lifetime and diffusion of singlet oxygen in a cell. J. Phys. Chem. B 2005, 109, 8570–8573. [Google Scholar] [CrossRef]
  14. Redmond, R.W.; Kochevar, I.E. Spatially resolved cellular responses to singlet oxygen. Photochem. Photobiol. 2006, 82, 1178–1186. [Google Scholar] [CrossRef]
  15. Prise, K.M.; O’Sullivan, J.M. Radiation-induced bystander signalling in cancer therapy. Nat. Rev. Cancer 2009, 9, 351–360. [Google Scholar] [CrossRef]
  16. Calì, B.; Ceolin, S.; Ceriani, F.; Bortolozzi, M.; Agnellini, A.H.; Zorzi, V.; Predonzani, A.; Bronte, V.; Molon, B.; Mammano, F. Critical role of gap junction communication, calcium and nitric oxide signaling in bystander responses to focal photodynamic injury. Oncotarget 2015, 6, 10161–10174. [Google Scholar] [CrossRef] [PubMed] [Green Version]
  17. Feine, I.; Pinkas, I.; Salomon, Y.; Scherz, A. Local oxidative stress expansion through endothelial cells—A key role for gap junction intercellular communication. PLoS ONE 2012, 7, e41633. [Google Scholar] [CrossRef]
  18. Alexandre, J.; Hu, Y.; Lu, W.; Pelicano, H.; Huang, P. Novel action of paclitaxel against cancer cells: Bystander effect mediated by reactive oxygen species. Cancer Res. 2007, 67, 3512–3517. [Google Scholar] [CrossRef] [PubMed]
  19. Rubio, N.; Fleury, S.P.; Redmond, R.W. Spatial and temporal dynamics of in vitro photodynamic cell killing: Extracellular hydrogen peroxide mediates neighbouring cell death. Photochem. Photobiol. Sci. 2009, 8, 457–464. [Google Scholar] [CrossRef] [PubMed]
  20. Reeves, K.J.; Reed, M.W.; Brown, N.J. Is nitric oxide important in photodynamic therapy? J. Photochem. Photobiol. B 2009, 95, 141–147. [Google Scholar] [CrossRef] [PubMed]
  21. Hoorelbeke, D.; Decrock, E.; Van Haver, V.; De Bock, M.; Leybaert, L. Calcium, a pivotal player in photodynamic therapy? Biochim. Biophys. Acta Mol. Cell Res. 2018, 1865, 1805–1814. [Google Scholar] [CrossRef]
  22. D’Autréaux, B.; Toledano, M.B. ROS as signalling molecules: Mechanisms that generate specificity in ROS homeostasis. Nat. Rev. Mol. Cell Biol. 2007, 8, 813–824. [Google Scholar] [CrossRef] [PubMed]
  23. Rubio, N.; Rajadurai, A.; Held, K.D.; Prise, K.M.; Liber, H.L.; Redmond, R.W. Real-time imaging of novel spatial and temporal responses to photodynamic stress. Free Radic. Biol. Med. 2009, 47, 283–290. [Google Scholar] [CrossRef] [PubMed]
  24. Pinton, P.; Giorgi, C.; Siviero, R.; Zecchini, E.; Rizzuto, R. Calcium and apoptosis: ER-mitochondria Ca2+ transfer in the control of apoptosis. Oncogene 2008, 27, 6407–6418. [Google Scholar] [CrossRef] [PubMed]
  25. Ceriani, F.; Ciubotaru, C.D.; Bortolozzi, M.; Mammano, F. Design and construction of a cost-effective spinning disk system for live imaging of inner ear tissue. In Auditory and Vestibular Research; Humana Press: New York, NY, USA, 2016; pp. 223–241. [Google Scholar]
  26. Ding, Y.; Li, J.; Enterina, J.R.; Shen, Y.; Zhang, I.; Tewson, P.H.; Mo, G.C.; Zhang, J.; Quinn, A.M.; Hughes, T.E.; et al. Ratiometric biosensors based on dimerization-dependent fluorescent protein exchange. Nat. Methods 2015, 12, 195–198. [Google Scholar] [CrossRef] [PubMed]
  27. Suzuki, J.; Kanemaru, K.; Ishii, K.; Ohkura, M.; Okubo, Y.; Iino, M. Imaging intraorganellar Ca2+ at subcellular resolution using CEPIA. Nat. Commun. 2014, 5, 4153. [Google Scholar] [CrossRef]
  28. Rizzuto, R.; De Stefani, D.; Raffaello, A.; Mammucari, C. Mitochondria as sensors and regulators of calcium signalling. Nat. Rev. Mol. Cell Biol. 2012, 13, 566–578. [Google Scholar] [CrossRef] [PubMed]
  29. Plaetzer, K.; Krammer, B.; Berlanda, J.; Berr, F.; Kiesslich, T. Photophysics and photochemistry of photodynamic therapy: Fundamental aspects. Lasers Med. Sci. 2009, 24, 259–268. [Google Scholar] [CrossRef]
  30. Brookes, P.S.; Yoon, Y.; Robotham, J.L.; Anders, M.W.; Sheu, S.S. Calcium, ATP, and ROS: A mitochondrial love-hate triangle. Am. J. Physiol. Cell Physiol. 2004, 287, C817–C833. [Google Scholar] [CrossRef]
  31. Ermakova, Y.G.; Bilan, D.S.; Matlashov, M.E.; Mishina, N.M.; Markvicheva, K.N.; Subach, O.M.; Subach, F.V.; Bogeski, I.; Hoth, M.; Enikolopov, G.; et al. Red fluorescent genetically encoded indicator for intracellular hydrogen peroxide. Nat. Commun. 2014, 5, 5222. [Google Scholar] [CrossRef]
  32. Buytaert, E.; Callewaert, G.; Hendrickx, N.; Scorrano, L.; Hartmann, D.; Missiaen, L.; Vandenheede, J.R.; Heirman, I.; Grooten, J.; Agostinis, P. Role of endoplasmic reticulum depletion and multidomain proapoptotic BAX and BAK proteins in shaping cell death after hypericin-mediated photodynamic therapy. FASEB J. 2006, 20, 756–758. [Google Scholar] [CrossRef] [PubMed]
  33. Hubmer, A.; Hermann, A.; Uberriegler, K.; Krammer, B. Role of calcium in photodynamically induced cell damage of human fibroblasts. Photochem. Photobiol. 1996, 64, 211–215. [Google Scholar] [CrossRef]
  34. Penning, L.C.; Rasch, M.H.; Ben-Hur, E.; Dubbelman, T.M.; Havelaar, A.C.; Van der Zee, J.; Van Steveninck, J. A role for the transient increase of cytoplasmic free calcium in cell rescue after photodynamic treatment. Biochim. Biophys. Acta 1992, 1107, 255–260. [Google Scholar] [CrossRef]
  35. Giorgi, C.; Bonora, M.; Missiroli, S.; Poletti, F.; Ramirez, F.G.; Morciano, G.; Morganti, C.; Pandolfi, P.P.; Mammano, F.; Pinton, P. Intravital imaging reveals p53-dependent cancer cell death induced by phototherapy via calcium signaling. Oncotarget 2015, 6, 1435–1445. [Google Scholar] [CrossRef]
  36. Giorgi, C.; Danese, A.; Missiroli, S.; Patergnani, S.; Pinton, P. Calcium Dynamics as a Machine for Decoding Signals. Trends Cell Biol. 2018, 28, 258–273. [Google Scholar] [CrossRef]
  37. Villalobos, C.; Gutiérrez, L.G.; Hernández-Morales, M.; Del Bosque, D.; Núñez, L. Mitochondrial control of store-operated Ca. Pharmacol. Res. 2018, 135, 136–143. [Google Scholar] [CrossRef] [PubMed]
  38. Stathopulos, P.B.; Schindl, R.; Fahrner, M.; Zheng, L.; Gasmi-Seabrook, G.M.; Muik, M.; Romanin, C.; Ikura, M. STIM1/Orai1 coiled-coil interplay in the regulation of store-operated calcium entry. Nat. Commun. 2013, 4, 2963. [Google Scholar] [CrossRef] [PubMed]
  39. Szabadkai, G.; Simoni, A.M.; Rizzuto, R. Mitochondrial Ca2+ uptake requires sustained Ca2+ release from the endoplasmic reticulum. J. Biol. Chem. 2003, 278, 15153–15161. [Google Scholar] [CrossRef]
  40. Giorgi, C.; Ito, K.; Lin, H.K.; Santangelo, C.; Wieckowski, M.R.; Lebiedzinska, M.; Bononi, A.; Bonora, M.; Duszynski, J.; Bernardi, R.; et al. PML regulates apoptosis at endoplasmic reticulum by modulating calcium release. Science 2010, 330, 1247–1251. [Google Scholar] [CrossRef]
  41. Pinton, P.; Ferrari, D.; Rapizzi, E.; Di Virgilio, F.; Pozzan, T.; Rizzuto, R. The Ca2+ concentration of the endoplasmic reticulum is a key determinant of ceramide-induced apoptosis: Significance for the molecular mechanism of Bcl-2 action. EMBO J. 2001, 20, 2690–2701. [Google Scholar] [CrossRef] [PubMed]
  42. Shahzidi, S.; Cunderlíková, B.; Więdłocha, A.; Zhen, Y.; Vasovič, V.; Nesland, J.M.; Peng, Q. Simultaneously targeting mitochondria and endoplasmic reticulum by photodynamic therapy induces apoptosis in human lymphoma cells. Photochem. Photobiol. Sci. 2011, 10, 1773–1782. [Google Scholar] [CrossRef] [PubMed]
  43. Schunck, T.; Poulet, P. Oxygen consumption through metabolism and photodynamic reactions in cells cultured on microbeads. Phys. Med. Biol. 2000, 45, 103–119. [Google Scholar] [CrossRef] [PubMed]
  44. Joseph, S.K.; Young, M.P.; Alzayady, K.; Yule, D.I.; Ali, M.; Booth, D.M.; Hajnóczky, G. Redox regulation of type-I inositol trisphosphate receptors in intact mammalian cells. J. Biol. Chem. 2018, 293, 17464–17476. [Google Scholar] [CrossRef] [PubMed] [Green Version]
  45. Bánsághi, S.; Golenár, T.; Madesh, M.; Csordás, G.; RamachandraRao, S.; Sharma, K.; Yule, D.I.; Joseph, S.K.; Hajnóczky, G. Isoform- and species-specific control of inositol 1,4,5-trisphosphate (IP3) receptors by reactive oxygen species. J. Biol. Chem. 2014, 289, 8170–8181. [Google Scholar] [CrossRef] [PubMed]
  46. Zheng, Y.; Shen, X. H2O2 directly activates inositol 1,4,5-trisphosphate receptors in endothelial cells. Redox Rep. 2005, 10, 29–36. [Google Scholar] [CrossRef] [PubMed]
  47. Kaplan, P.; Babusikova, E.; Lehotsky, J.; Dobrota, D. Free radical-induced protein modification and inhibition of Ca2+-ATPase of cardiac sarcoplasmic reticulum. Mol. Cell. Biochem. 2003, 248, 41–47. [Google Scholar] [CrossRef] [PubMed]
  48. Görlach, A.; Bertram, K.; Hudecova, S.; Krizanova, O. Calcium and ROS: A mutual interplay. Redox Biol. 2015, 6, 260–271. [Google Scholar] [CrossRef] [Green Version]
  49. Giorgi, C.; Marchi, S.; Pinton, P. The machineries, regulation and cellular functions of mitochondrial calcium. Nat. Rev. Mol. Cell Biol. 2018, 19, 713–730. [Google Scholar] [CrossRef]
  50. De Stefani, D.; Raffaello, A.; Teardo, E.; Szabò, I.; Rizzuto, R. A forty-kilodalton protein of the inner membrane is the mitochondrial calcium uniporter. Nature 2011, 476, 336–340. [Google Scholar] [CrossRef]
  51. Bernardi, P. Mitochondrial transport of cations: Channels, exchangers, and permeability transition. Physiol. Rev. 1999, 79, 1127–1155. [Google Scholar] [CrossRef]
  52. Rasola, A.; Sciacovelli, M.; Pantic, B.; Bernardi, P. Signal transduction to the permeability transition pore. FEBS Lett. 2010, 584, 1989–1996. [Google Scholar] [CrossRef] [PubMed] [Green Version]
  53. Rasola, A.; Bernardi, P. Mitochondrial permeability transition in Ca(2+)-dependent apoptosis and necrosis. Cell Calcium 2011, 50, 222–233. [Google Scholar] [CrossRef] [PubMed]
  54. Zhivotovsky, B.; Orrenius, S. Calcium and cell death mechanisms: A perspective from the cell death community. Cell Calcium 2011, 50, 211–221. [Google Scholar] [CrossRef] [PubMed]
  55. Nagata, S. Apoptosis and Clearance of Apoptotic Cells. Annu. Rev. Immunol. 2018, 36, 489–517. [Google Scholar] [CrossRef]
  56. Yan, Y.; Wei, C.L.; Zhang, W.R.; Cheng, H.P.; Liu, J. Cross-talk between calcium and reactive oxygen species signaling. Acta Pharmacol. Sin. 2006, 27, 821–826. [Google Scholar] [CrossRef] [PubMed]
  57. Camello-Almaraz, C.; Gomez-Pinilla, P.J.; Pozo, M.J.; Camello, P.J. Mitochondrial reactive oxygen species and Ca2+ signaling. Am. J. Physiol. Cell Physiol. 2006, 291, C1082–C1088. [Google Scholar] [CrossRef] [PubMed]
  58. Moor, A.C. Signaling pathways in cell death and survival after photodynamic therapy. J. Photochem. Photobiol. B 2000, 57, 1–13. [Google Scholar] [CrossRef]
  59. Dong, Z.; Shanmughapriya, S.; Tomar, D.; Siddiqui, N.; Lynch, S.; Nemani, N.; Breves, S.L.; Zhang, X.; Tripathi, A.; Palaniappan, P.; et al. Mitochondrial Ca2+ Uniporter Is a Mitochondrial Luminal Redox Sensor that Augments MCU Channel Activity. Mol. Cell 2017, 65, 1014–1028.e7. [Google Scholar] [CrossRef]
Figure 1. Apoptosis induction in a PS-loaded B16-F10 cell culture exposed to single-cell irradiation. (a) The irradiated cell is marked with the yellow asterisk. Time t = 0 corresponds to the end of the photoactivation protocol (SS conditions, see Materials and Methods, Section 2.2). Green fluorescence emission indicates pSIVA-IANBD (pSIVA) probe activation in apoptotic cells; red fluorescence emission indicates propidium iodide (PI), which labels damaged or late apoptotic cells. (b) Control experiment performed in a cell culture exposed to single-cell irradiation in the absence of PS. PS: photosensitizer. SS: standard stimulation.
Cells 08 01175 g001
Figure 2. Kinetics of cytosolic Ca2+ response to focal PS activation in the presence or in the absence of extracellular Ca2+. Each single-cell Fluo-4 fluorescence trace was computed as pixel signal average within a ROI contouring the whole cell area (SS conditions, see Materials and Methods, Section 2.2). (a) Mean dF/F0 fluorescence traces (solid lines) ± s.e.m. (dashed lines) were computed as average of n = 6 independent experiments for 2 mM [Ca2+]e (blue traces) or 0 mM [Ca2+]e (green traces) conditions. At the bottom of each graph, point-by-point p-values between the curves are shown in log scale. Vertical dashed lines mark the onset of laser exposure. (b) The histogram shows mean peak amplitude of Ca2+ signals as a function of cell order in 2 mM [Ca2+]e (blue bars) or 0 mM [Ca2+]e (green bars) condition (irradiated cell = 0 order, ** P = 0.006). (c) Average distance of the given bystander cell order from the irradiated cell vs. average time-to-half-peak. The latter was set to zero (on the x-axis) in the irradiated cell. Interpolating curves were obtained by logarithmic (2 mM [Ca2+]e, blue) or linear (0 mM [Ca2+]e, green) least-square curve fitting. ROI: regions of interest. s.e.m.: standard error of the mean.
Cells 08 01175 g002
Figure 3. PS activation triggers Ca2+ release from the endoplasmic reticulum (ER). [Ca2+]ER was visualized in B16-F10 cells expressing R-CEPIA1er, a Ca2+ biosensor targeted to the ER. (a) Imaging of a PS-loaded cell exposed to photostimulation at high irradiance (HI, see below and Materials and Methods, Section 2.2). Top: frames acquired at different time points from the onset of laser irradiation. Bottom: dF/F0 fluorescence traces were obtained as average pixel signals within the ROIs drawn above. The experiment shown is representative of n = 9 independent experiments. (b) Mean Ca2+ release from the ER at different irradiances: high (HI, ~7∙106 mW/cm2), medium (MI, ~4∙106 mW/cm2) or low (LI, ~7∙103 mW/cm2). Single-cell fluorescence traces were computed as pixel signal average within ROIs contouring the whole cell area. Shown are average dF/F0 fluorescence traces (solid lines) ± s.e.m. (dashed lines) from at least n = 7 cells for each experimental condition. The black trace represents the signal obtained in the absence of PS under HI conditions. Vertical dashed lines mark the onset of photostimulation. (c) The histogram shows release rates computed as slope of the linear descending phase of signals under the indicated laser irradiance conditions (*** P < 10−5).
Cells 08 01175 g003
Figure 4. Simultaneous two-color confocal multiphoton imaging of PS activation-induced Ca2+ transfer from the ER to mitochondria (MT). PS-loaded B16-F10 cells co-expressing R-CEPIA1er (a red fluorescent Ca2+ biosensor, here shown in purple color, targeted to the ER) and CEPIA2mt (a green fluorescent Ca2+ biosensor targeted to mitochondria) were exposed to low-irradiance (LI, ~7∙103 mW/cm2) photostimulation (see Materials and Methods, Section 2.2). Shown results are representative of n = 5 independent experiments. (a) Dual-color images of ER (magenta) and mitochondrial (green) Ca2+ signals, at different time points from the onset of photostimulation (t = 0). At each time point, the detail within the blue square in panel (a) is shown magnified in (b).
Cells 08 01175 g004
Figure 5. Focal irradiation of PS-loaded cells triggers an intercellular mitochondrial Ca2+ wave. PS-loaded B16-F10 cell cultures expressing CEPIA2mt (a green fluorescent Ca2+ biosensor targeted to mitochondria) were exposed to SS conditions (see Materials and Methods, Section 2.2). The graph on the left displays mean dF/F0 fluorescence traces (solid lines) ± s.e.m. (dashed lined) computed as average of n = 4 independent experiments for each bystander cell order. Single-cell traces were obtained as average pixel signals within ROIs contouring the whole cell area, as shown in the fluorescence image on the right. The black trace is a representative result obtained in the absence of PS. The vertical dashed line marks the onset of laser irradiation.
Cells 08 01175 g005
Figure 6. The extent of mitochondrial Ca2+ uptake and O2∙ production following PS activation depends on Ca2+ release from the ER. (a) Fluorescence signals from photostimulated B16-F10 cells expressing G-CEPIA1er, a Ca2+ biosensor targeted to the ER (ER Ca2+), CEPIA2mt, a Ca2+ biosensor targeted to mitochondria (MT Ca2+), or loaded with MitoSOX Red, an irreversible selective mitochondrial O2∙ indicator (MT O2∙), obtained in the absence (blue traces) or in the presence (red traces) of Thapsigargin (Tg, 3 μM) under SS conditions (see Materials and Methods, Section 2.2). Single-cell fluorescence traces were computed as average pixel signals within ROIs contouring the whole cell area. For ER Ca2+ and MT Ca2+, shown are average dF/F0 fluorescence traces (solid lines) ± s.e.m. (dashed lines), computed for at least n = 3 independent experiments for each condition. For MT O2∙, shown are average time derivatives of dF/F0 MitoSOX Red signals (solid lines) ± s.e.m. (dashed lines) (see Materials and Methods, Section 2.6), computed for n = 6 independent experiments for each condition. Vertical dashed lines mark the onset of laser irradiation. (b) Mitochondrial O2∙ production in the irradiated and bystander cells in the absence (left) or in the presence (right) of Tg. (c) The histogram shows mean values of the area subtended by the curves in (b) in the absence or in the presence of Tg for each order of bystander cells (* P < 0.05, ** P < 0.01, *** P < 0.001).
Cells 08 01175 g006
Figure 7. H2O2 production following focal PS activation in B16-F10 cells expressing HyPerRed. (a) HyPerRed fluorescence change in the irradiated cell; shown are mean (solid trace) ± s.e.m. (dashed traces) for n = 6 experiments. (b) HyPerRed fluorescence change in bystander cells: the experiment shown is representative of n = 3 independent experiments conducted under SS conditions (which all gave similar results). Single-cell dF/F0 fluorescence traces were computed as average pixel signals within ROIs contouring the whole cell area. Black traces in (a) and in (b) are representative signals obtained in the absence of PS. Vertical dashed lines mark the onset of laser irradiation.
Cells 08 01175 g007

