Article

Heterotrimeric G Protein–RasGAP Coupling Drives Adaptation During Chemotaxis

Chemotaxis Signaling Section, Laboratory of Immunogenetics, National Institute of Allergy and Infectious Diseases, National Institutes of Health, 5625 Fishers Lane, Rockville, MD 20850, USA
*
Author to whom correspondence should be addressed.
Cells 2026, 15(9), 819; https://doi.org/10.3390/cells15090819
Submission received: 24 February 2026 / Revised: 22 April 2026 / Accepted: 24 April 2026 / Published: 30 April 2026
(This article belongs to the Section Cell Signaling)

Highlights

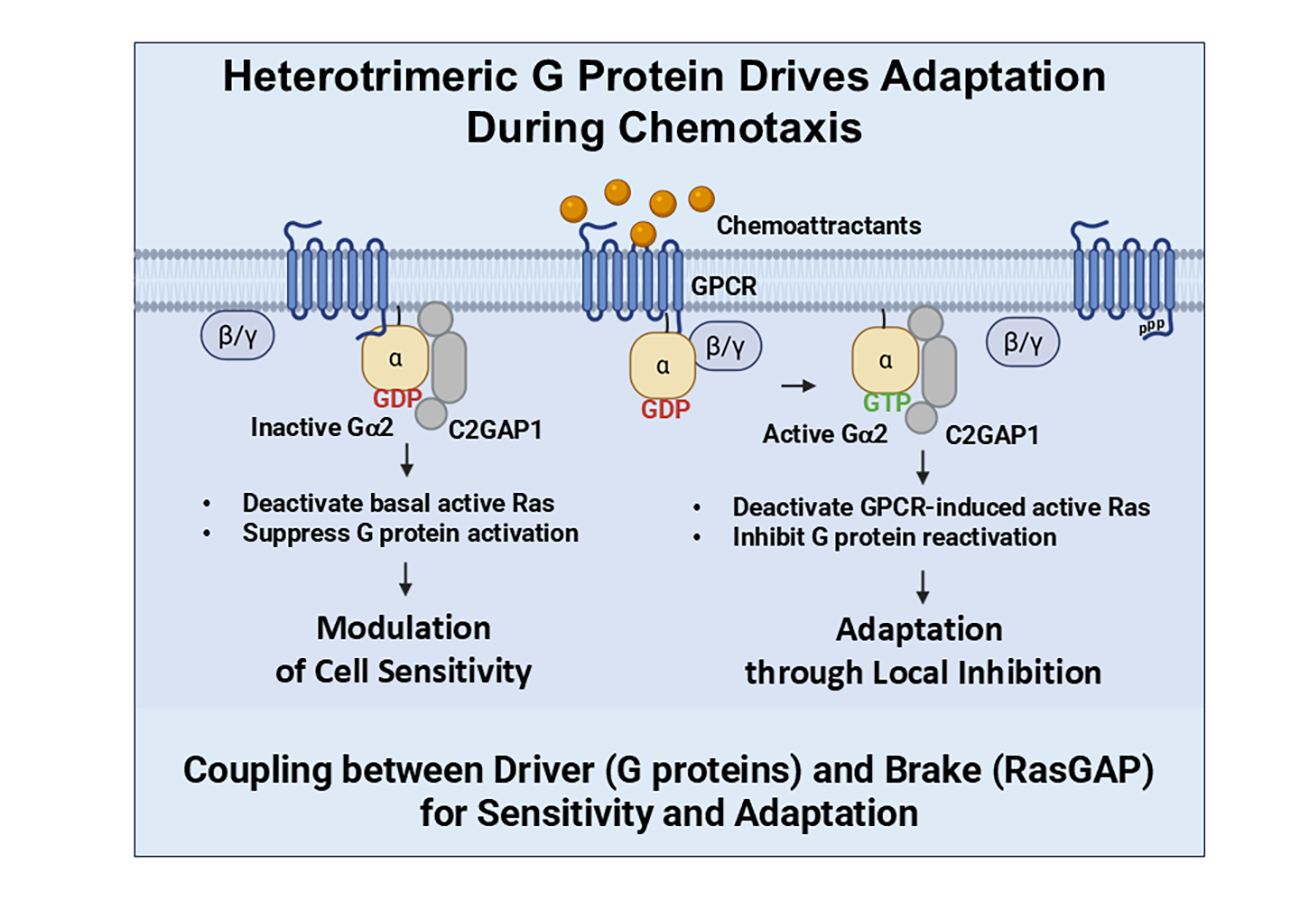
Chemotaxis, the directional migration of cells along chemoattractant gradients, underlies processes such as neuron patterning, lymphocyte recruitment, cancer metastasis, and Dictyostelium discoideum development. The hallmark of eukaryotic chemotaxis is the ability to sense and respond to gradients spanning wide concentration ranges through cellular adaptation. This process involves three interconnected modules: gradient sensing, cell polarity, and migration, with gradient sensing serving as the foundation. While many components of G-protein-coupled receptor (GPCR)-mediated signaling are known, the molecular mechanisms driving adaptation remain unclear. Here, we show that the heterotrimeric G protein α subunit interacts with RasGAP C2GAP1 to mediate adaptation through local inhibition during gradient sensing and chemotaxis.
What are the main findings?
  • C2GAP1 is essential for concentration-dependent adaptation during gradient sensing, builds local inhibition, and facilitates rapid reorientation in dynamic gradients.
  • The direct association between C2GAP1 and Gα2, with preferential interaction with activated Gα2, attenuates both Ras activity and heterotrimeric G-protein activation.
What is the implication of the main finding?
  • Activated Gα2 directly recruits its own negative regulator C2GAP1, forming a self-limiting adaptive feedback circuit.
  • The coupling of Gα2 and C2GAP1 in an actin-independent fashion constitutes the core components of adaptation during gradient sensing and chemotaxis to enable signaling amplitude and modulate the dynamic range of gradient sensing.

Abstract
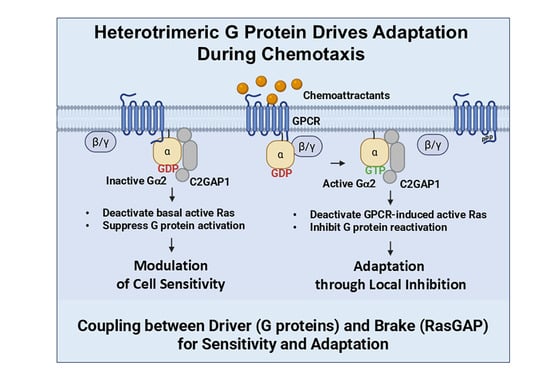
Chemotaxis enables eukaryotic cells to detect and migrate along extracellular chemoattractant gradients spanning several orders of magnitude. This remarkable dynamic range relies on adaptation, a process that allows cells to reset their signaling machinery while preserving sensitivity to incremental changes in stimulus intensity. Although numerous actin-dependent feedback mechanisms have been characterized, the molecular basis of adaptation within an actin-independent core gradient-sensing module remains poorly understood. Here, we identify the Ras GTPase-activating protein, C2GAP1, as a critical F-actin-independent effector of the heterotrimeric G protein, Gα2, in Dictyostelium discoideum. Using cytoskeleton-free gradient-sensing cells, quantitative imaging, biochemical assays, FRET-based G-protein activation measurements, and structural modeling, we demonstrate that C2GAP1 controls concentration-dependent adaptation during gradient sensing. Mechanistically, C2GAP1 directly associates with Gα2 in both GDP- and GTP-bound states, with preferential binding to activated Gα2, thereby sustaining membrane recruitment and locally attenuating Ras and downstream signaling. Loss of C2GAP1 enhances G-protein activation, disrupts local inhibition, and impairs rapid reorientation in dynamic gradients. These findings define a direct coupling between heterotrimeric G proteins and the RasGAP, C2GAP1, as a core adaptive module that enables gradient sensing across a wide concentration range.

Graphical Abstract

1. Introduction

Chemotaxis is a form of directional cell migration guided by chemoattractant gradients. This cellular behavior play- essential roles in numerous physiological processes, such as neuron patterning, recruitment of lymphocytes, angiogenesis, and metastasis of cancer cells [1,2,3]. The social amoeba Dictyostelium discoideum has served as a powerful model system for dissecting the conserved signaling architecture of eukaryotic chemotaxis [4,5]. In this system, chemotactic responses to cyclic AMP (cAMP) are mediated by the GPCR cAMP receptor 1 (cAR1), which couples to the heterotrimeric G protein composed of Gα2 and Gβγ subunits [6]. Upon ligand binding, cAR1 activates heterotrimeric G-proteins through dissociation of Gα2 from Gβγ, thereby initiating downstream signaling cascades that drive directed migration [7,8,9]. The molecular mechanisms governing cAR1/Gα2Gβγ-mediated chemotaxis have been extensively investigated. Downstream of G-protein activation, Ras proteins serve as central signaling nodes that activate multiple pathways—PI3K, TORC2, PLA2, ElmoE, and soluble guanylyl cyclase (sGC)—which together coordinate chemotactic signaling and cell movement [10,11,12,13,14].
Several regulatory mechanisms acting at the level of G proteins have been described. Ligand-induced phosphorylation of cAR1 reduces its coupling to heterotrimeric G proteins and functions as a receptor desensitization mechanism [15,16,17]. G-protein-interacting protein 1 (GIP1) binds Gα2 and facilitates its shuttling between the cytosol and plasma membrane, ensuring sufficient availability of G proteins at the membrane during chemotaxis [18]. ElmoE is an effector of Gβ that associates with Gβ to activate Rac and thereby promote cell migration [14]. In addition, the nonreceptor guanine nucleotide exchange factor (GEF) Ric8 acts as a Gα2 effector to amplify Gα2 signaling [19]. Importantly, chemotaxis is a coordinated process comprising three conceptually distinct but interconnected modules: gradient sensing, cell polarity, and cell migration. Gradient sensing can be uncoupled from both initial polarity establishment and actin-based motility [6]. For example, cells treated with actin polymerization inhibitors lose their filamentous actin-based cytoskeleton and become immobile; nevertheless, they retain the ability to sense a chemoattractant gradient. This observation demonstrates that the core gradient-sensing machinery operates independently of F-actin-based cytoskeletal structures. In contrast, the functions of ElmoE and Ric8 require an intact actin cytoskeleton, indicating that these regulators operate within F-actin-dependent feedback loops rather than within the actin-independent core gradient-sensing module. Thus, despite extensive characterization of actin-dependent signaling pathways, the key components that constitute the actin-independent core machinery responsible for gradient sensing remain largely unidentified and represent a critical gap in our understanding of eukaryotic chemotaxis.
Chemotactic cells detect and respond to an enormous concentration range of chemoattractants. For example, D. discoideum cells chemotax toward their chemoattractant cAMP gradients from 10−9 to 10−5 M [20]. To chemotax through gradients with such a large concentration range, cells employ a mechanism called adaptation [6]. The temporal properties of adaptation were first characterized using uniformly applied chemoattractant stimuli [21,22]. In response to sustained stimuli, cells exhibit a transient signaling response that subsequently returns toward baseline despite the continued presence of the stimulus, a phenomenon of adaptation. A defining feature of adaptation is that cells become insensitive to the persistent stimulus while retaining the ability to respond to further increases in chemoattractant concentration. In D. discoideum, cAR1 GPCR (cAMP receptor)-mediated phosphatidylinositol (3,4,5)-trisphosphate (PIP3) responses display all hallmark features of chemoattractant sensing and adaptation [6]. When cAMP is applied uniformly, the signaling pathway leading to PIP3 production can be divided into four sequential steps with distinct kinetics. First, cAMP binds to the cAR1 receptor [23,24]. Second, activated cAR1 induces a persistent dissociation/activation of heterotrimeric G-proteins (Gα2Gβγ) [7,8], indicating that adaptation occurs downstream of G protein activation. Third, Ras proteins are activated by GEFs, which catalyze the exchange of Ras-GDP for Ras-GTP; Ras-GTP is subsequently inactivated by Ras GTPase-activating proteins (RasGAPs), which stimulate its intrinsic GTPase activity [11,25,26,27]. Uniform cAMP stimulation elicits a transient Ras activation followed by concentration-dependent, imperfect adaptation [28,29]. Fourth, Ras-activated PI3K phosphorylates phosphatidylinositol 4,5-bisphosphate (PtdIns(4,5)P2, PIP2) to phosphatidylinositol (3,4,5)-trisphosphate (PtdIns(3,4,5)P3, PIP3) in the membrane; while the lipid phosphatase PTEN transiently dissociates from the membrane to permit accumulation of PIP3 and then returns to dephosphorylate PIP3 back to PIP2 [12,13]. Collectively, these observations identify Ras activation as the earliest step in the GPCR-mediated signaling cascade that exhibits adaptive behavior.
The D. discoideum genome encodes at least 18 putative RasGAP proteins, suggesting extensive regulatory potential at the level of Ras inactivation. To date, two RasGAPs, DdNF1 (ddnf1) and C2GAP1 (c2gapA), have been shown to play critical roles in cAMP-induced adaptation and chemotaxis [28,30,31]. It is widely believed that chemotaxis across a broad range of chemoattractant concentrations relies on precise spatiotemporal regulation of Ras activity through coordinated adaptation mechanisms. Adaptation is often manifested by cell responses upon uniformly applied chemoattractant stimulation (uniform stimulation) [21,32]. Under uniform stimulation in F-actin-free cells, WT cells exhibit transient Ras activation, whereas ddnf1 cells show prolonged Ras activation [30]. In response to the same stimulation, c2gapA cells also display an initial transient Ras activation similar to WT cells, but fail to maintain adaptation during sustained stimulation [28]. The Ras activation profiles observed in WT, ddnf1, and c2gapA cells suggest that multiple RasGAP proteins cooperate to mediate Ras adaptation. Specifically, F-actin-independent adaptation of Ras signaling appears to involve two sequential phases: an initial transient activation followed by persistent adaptation. Both DdNF1 and C2GAP1 are required for this adaptive process, but they seem to function at distinct steps. DdNF1 appears to mediate the rapid attenuation of Ras activation during the initial phase, whereas C2GAP1 plays a more prominent role in sustaining long-term adaptation during the later phase, particularly under gradient-sensing conditions. However, the molecular basis by which GPCR signaling controls the spatial and temporal dynamics of RasGAPs for adaptation during gradient sensing remains poorly understood.
In the present study, we characterized the spatiotemporal dynamics of gradient sensing in cytoskeleton-free, gradient-sensing cells in the presence or absence of C2GAP1 (c2gapA) in response to steady and dynamically changing gradients. We found that exposure to a chemoattractant gradient induces cAMP concentration-dependent plasma membrane recruitment of C2GAP1, and that c2gapA cells are impaired in the high-concentration-dependent adaptation process during gradient sensing. Our data further provide a molecular mechanism in which C2GAP1 interacts with Gα2 to restrain G-protein activation, thereby maintaining cellular sensitivity, and attenuating Ras activation during concentration-dependent adaptation and local inhibition during gradient sensing. Together, these functions enable rapid orientation in steady gradients and efficient reorientation in dynamically changing gradients.

2. Materials and Methods

2.1. Cell Lines, Cell Growth and Differentiation

Dictyostelium discoideum wild-type cells lines were acquired from Dictybase.org. The c2gapA cell line was constructed as previously reported [28]. Cell growth, transformation, and differentiation were carried out as previously described [12].

2.2. Imaging and Data Processing

Differentiated cells (5 × 10⁴) in DB buffer with 2.5 mM caffeine were plated and allowed to adhere to the cover glass of a 4-well or a 1-well chamber (Nalge Nunc International, Naperville, IL, USA) for 10 min and then covered with DB buffer for the live cell imaging experiment. If necessary, cells were treated with 5.0 μM Lat B (Molecular Probes, Eugene, OR, USA) for 10 min prior to the experiments. Cells were imaged using a Carole Zeiss Laser Scanning Microscope Zen 780 (Carl Zeiss, Thornwood, NY, USA), with a 40x/NA 1.3 Oil DIC Plan-Apochromatic objective. To obtain cytoskeleton-free, immobile cells, cells were treated with 5 μM latrunculin B (Thermo Fisher Scientific Inc., Waltham, MA, USA) at a final concentration at room temperature for 10 min prior to the experiments. To establish a steady gradient for chemotaxis or gradient-sensing measurements, we set the FemtoJet (FemtoJet and micromanipulator 5171, Eppendorf, Germany) with Pc = 70 and Pi = 70 to ensure the injection of a constant and small volume of cAMP and Alexa 594 into a one-well chamber (Thermo Fisher Scientific Inc., Waltham, MA, USA) as previously described [33]. Under this condition, a stable gradient was established within 100 μm around the tip of the micropipette. To visualize the gradient, cAMP was mixed with Alexa 594 (Thermo Fisher Scientific Inc., Waltham, MA, USA) at a final concentration of 0.1 mg/mL. To suddenly expose a cell to a stable gradient or reapplication of the identical gradient to the same cell, a micropipette filled with a mixture of cAMP and 0.1 g/mL Alexa 594 linked with a FemtoJet was positioned 1000 μm away from the cells and was then quickly moved to a position within 100 μm of the cells. During the experiments, we only changed the distance between the micropipette and the cells. The speed of movement determines how fast a stable gradient can form around a cell. Images were processed and analyzed by Zen 780 software (Zen Black). Images were further processed in Adobe Photoshop (Adobe Systems, San Jose, CA, USA), and the intensity of the ROI (region of interest) was explored and analyzed with Microsoft Office Excel (Redmond, WA, USA). To measure the membrane translocation of the indicated protein, we first measured the intensity change in the cytoplasm in response to uniformly applied stimuli or in the gradient over time. To obtain the relative intensity change in each individual cell during the time lapse, we divided its intensity at a given time (It) by its intensity at time 0 (I0); consequently, the relative intensity of any cells at time 0 became 1. To compensate for significant photobleaching that occurs with long-time acquisition, we also normalized the intensity relative to the photobleaching of the cells. We then divided the normalized intensity at time 0 s (I0) by the normalized intensity at the given time (It) to convert the normalized intensity change in the cytoplasm to membrane translocation. Lastly, we calculated and presented the mean and standard deviation (Mean ± SD) of peak membrane translocation from more than 5 independent cells.

2.3. Immunoblotting

Mouse monoclonal anti-GFP antibodies were purchased from Clontech Laboratories, Inc. (Mountain View, CA, USA). The anti-Gα2 rabbit antibody from Peter Devreotes, Johns Hopkins University. Anti-pan Ras mouse monoclonal antibody from EMD Millipore (Darmstadt, Germany) was used to detect D. discoideum Ras proteins. HRP-conjugated anti-mouse or anti-rabbit IgG was obtained from Jackson ImmunoResearch (West Grove, PA, USA).

2.4. Membrane Translocation Assay

The experiment was done as previously described [34].

2.5. Immunoprecipitation Assay

Differentiated C2GAP1-YFP expressing cells were suspended at 2 × 10⁷ with PM buffer with 2.5 mM caffeine and kept on ice before the assay. Cells were stimulated with 10 μM cAMP. 0.5 mL aliquots of cells at indicated time points were lysed with 10 mL immunoprecipitation buffer (IB, 20 mM Tris, pH8.0, 20 mM MgCl2, 10% glycerol, 2 mM Na3VO4, 0.25% NP40, and one tablet of Complete 1× EDTA-free proteinase inhibitor) for 30 min on ice. Cell extracts were centrifuged at 16,000× g for 10 min at 4 °C. Supernatant fractions were collected and incubated with 25 μL anti-GFP agarose beads (Proteintec, Rosemont, IL, USA) at 4 °C for 2 h. Beads were washed four times with immunoprecipitation buffer and proteins were eluted by boiling the beads in 50 μL SDS sample buffer (Bio-Rad, Hercules, CA, USA).

2.6. AlphaFold3-Assisted Analysis of Gα2-C2GAP1 Interaction Using NIH Biowulf Cluster

Protein–protein complex models were generated using AlphaFold3 version 3.0.1 (DeepMind, London, UK, 2024) installed as a singularity container with af3 wrapper script (https://github.com/NIH-HPC/af3) (accessed on 2 February 2026) on the NIH Biowulf high-performance computing cluster. Model parameters were downloaded from Google DeepMind with permission for non-commercial use. Protein sequences were obtained from dictyBase.org. Jobs were submitted using the default AlphaFold3 (AF3) settings. Predictions were generated for Gα2 (-GDP or -GTP bound), C2GAP1, Gβ, and Gγ along with six interactions, including Gα2GβGγ (-GDP or -GTP bound), C2GAP1-Gα2 (-GDP or -GTP bound), and Gα2GβGγ (-GDP or -GTP bound)-C2GAP1. Five predictions were generated for each job with the top-ranked structure saved in CIF and JSON format and then accessed and visualized in ChimeraX version 1.11.1. Model accuracy was annotated in ChimeraX using the AlphaFold palette, with color-scheme mapped to per-residue confidence scores (pLDDT) accessed from the B-factor column of each respective CIF file. The parameters of the binding affinity for predicted structures were calculated using PRODIGY based on instructions from https://github.com/haddocking/prodigy (accessed on 2 February 2026) [35].

3. Results

3.1. c2gapA Cells Fail to Exhibit Chemoattractant Concentration-Dependent Adaptation upon Exposure to a Steady Gradient

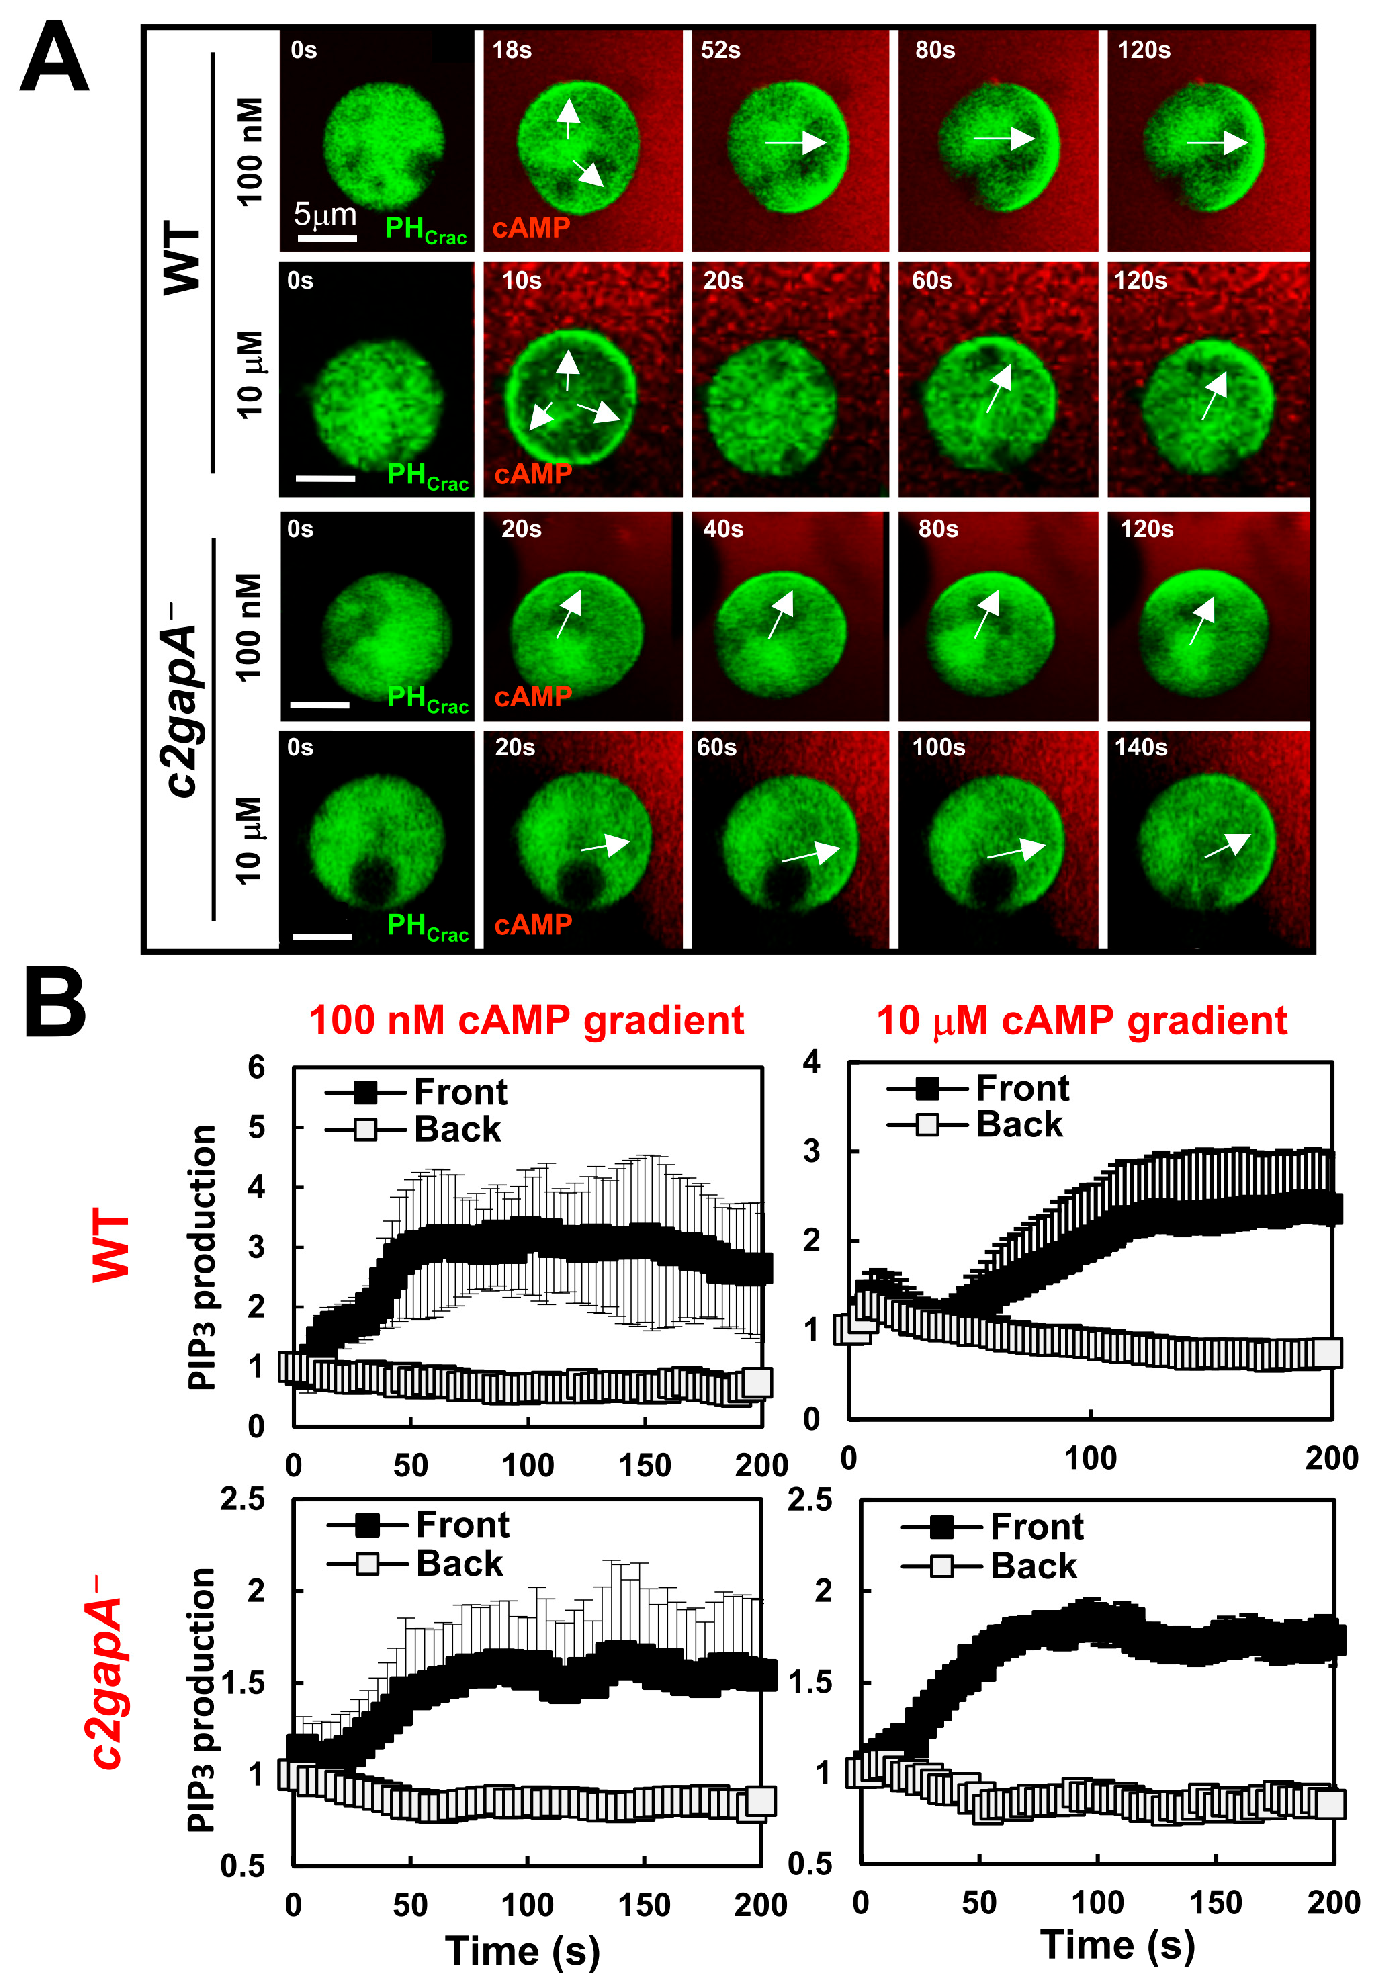
Chemotaxis is a coordinated process involving three key aspects: gradient sensing machinery, cell polarity, and cell migration. Gradient sensing can be uncoupled from initial cell polarity and cell migration [6]. For example, a cell treated with actin polymerization inhibitors loses its filamentous actin-based cytoskeleton and initial polarity, and subsequently becomes immobile, yet retains the ability to sense a chemoattractant gradient. This immobile cell provides a simplified experimental system to specifically investigate the gradient-sensing mechanisms. Using this approach, we previously determined the spatiotemporal dynamics of key signaling components during the polarization processes, including polarized PIP3 production/accumulation in the front of cells in response to exposure to a steady chemoattractant gradient [33]. A defining feature of gradient-sensing cells is their ability to efficiently establish intracellular polarity, manifested as a sharp accumulation of PIP3 in the front of cells toward the source of a chemoattractant, in a concentration-dependent fashion [33,36]. To understand the role of C2GAP1 in the adaptation process of gradient sensing, we first monitored PIP3 dynamics using a PIP3 biosensor, PHCrac-GFP, in both WT and c2gapA cells exposed to cAMP gradients of varying concentrations (Figure 1A and Video S1). WT and c2gapA cells expressing PHCrac-GFP (green) were treated with 5 μM Latrunculin B for 10 min prior to imaging to diminish cell polarity and cell migration. To visualize gradients, cAMP was mixed with Alexa594 (red) [37]. Upon exposure to a relatively low cAMP concentration gradient (100 nM), WT cells exhibited a single-phase PIP3 response, characterized by PHCrac-GFP translocation only to the front and lateral regions of cells, with minimal accumulation at the rear. The accumulation of PHCrac-GFP facing the gradient is also called a PHCrac crescent [6]. In contrast, exposure to a high, saturating cAMP gradient (10 μM) induced a biphasic response in WT cells, consisting of an initial, uniform PHCrac-GFP translocation to the entire cell periphery, followed by withdrawal from the plasma membrane and a second, localized PHCrac-GFP accumulation (PH crescent, a PIP3 polarization) at the front, facing the gradient (Figure 1A, top panel). The observed termination of the initial PIP3 production reflects a typical adaptation process during gradient sensing and is consistent with previous reports [33,36]. We next examined PIP3 dynamics in c2gapA cells exposed to either 100 nM or 10 μM cAMP gradients. In contrast to WT cells, c2gapA cells displayed persistent PHCrac-GFP accumulations at the cell front under both concentrations, indicating a failure in adaptation during gradient sensing (Figure 1A, lower panel). The quantitative analysis of PIP3 dynamics during gradient sensing, assessed by measuring PH-GFP localization in the front and back (rear) regions of cells across multiple cells, further confirms this conclusion (Figure 1B). The above result demonstrates that C2GAP1 plays an essential role in PIP3 adaptation during gradient sensing in response to a gradient at high concentrations.

3.2. c2gapA Cells Show an Altered PTEN Dynamics upon Exposure to a Steady Gradient

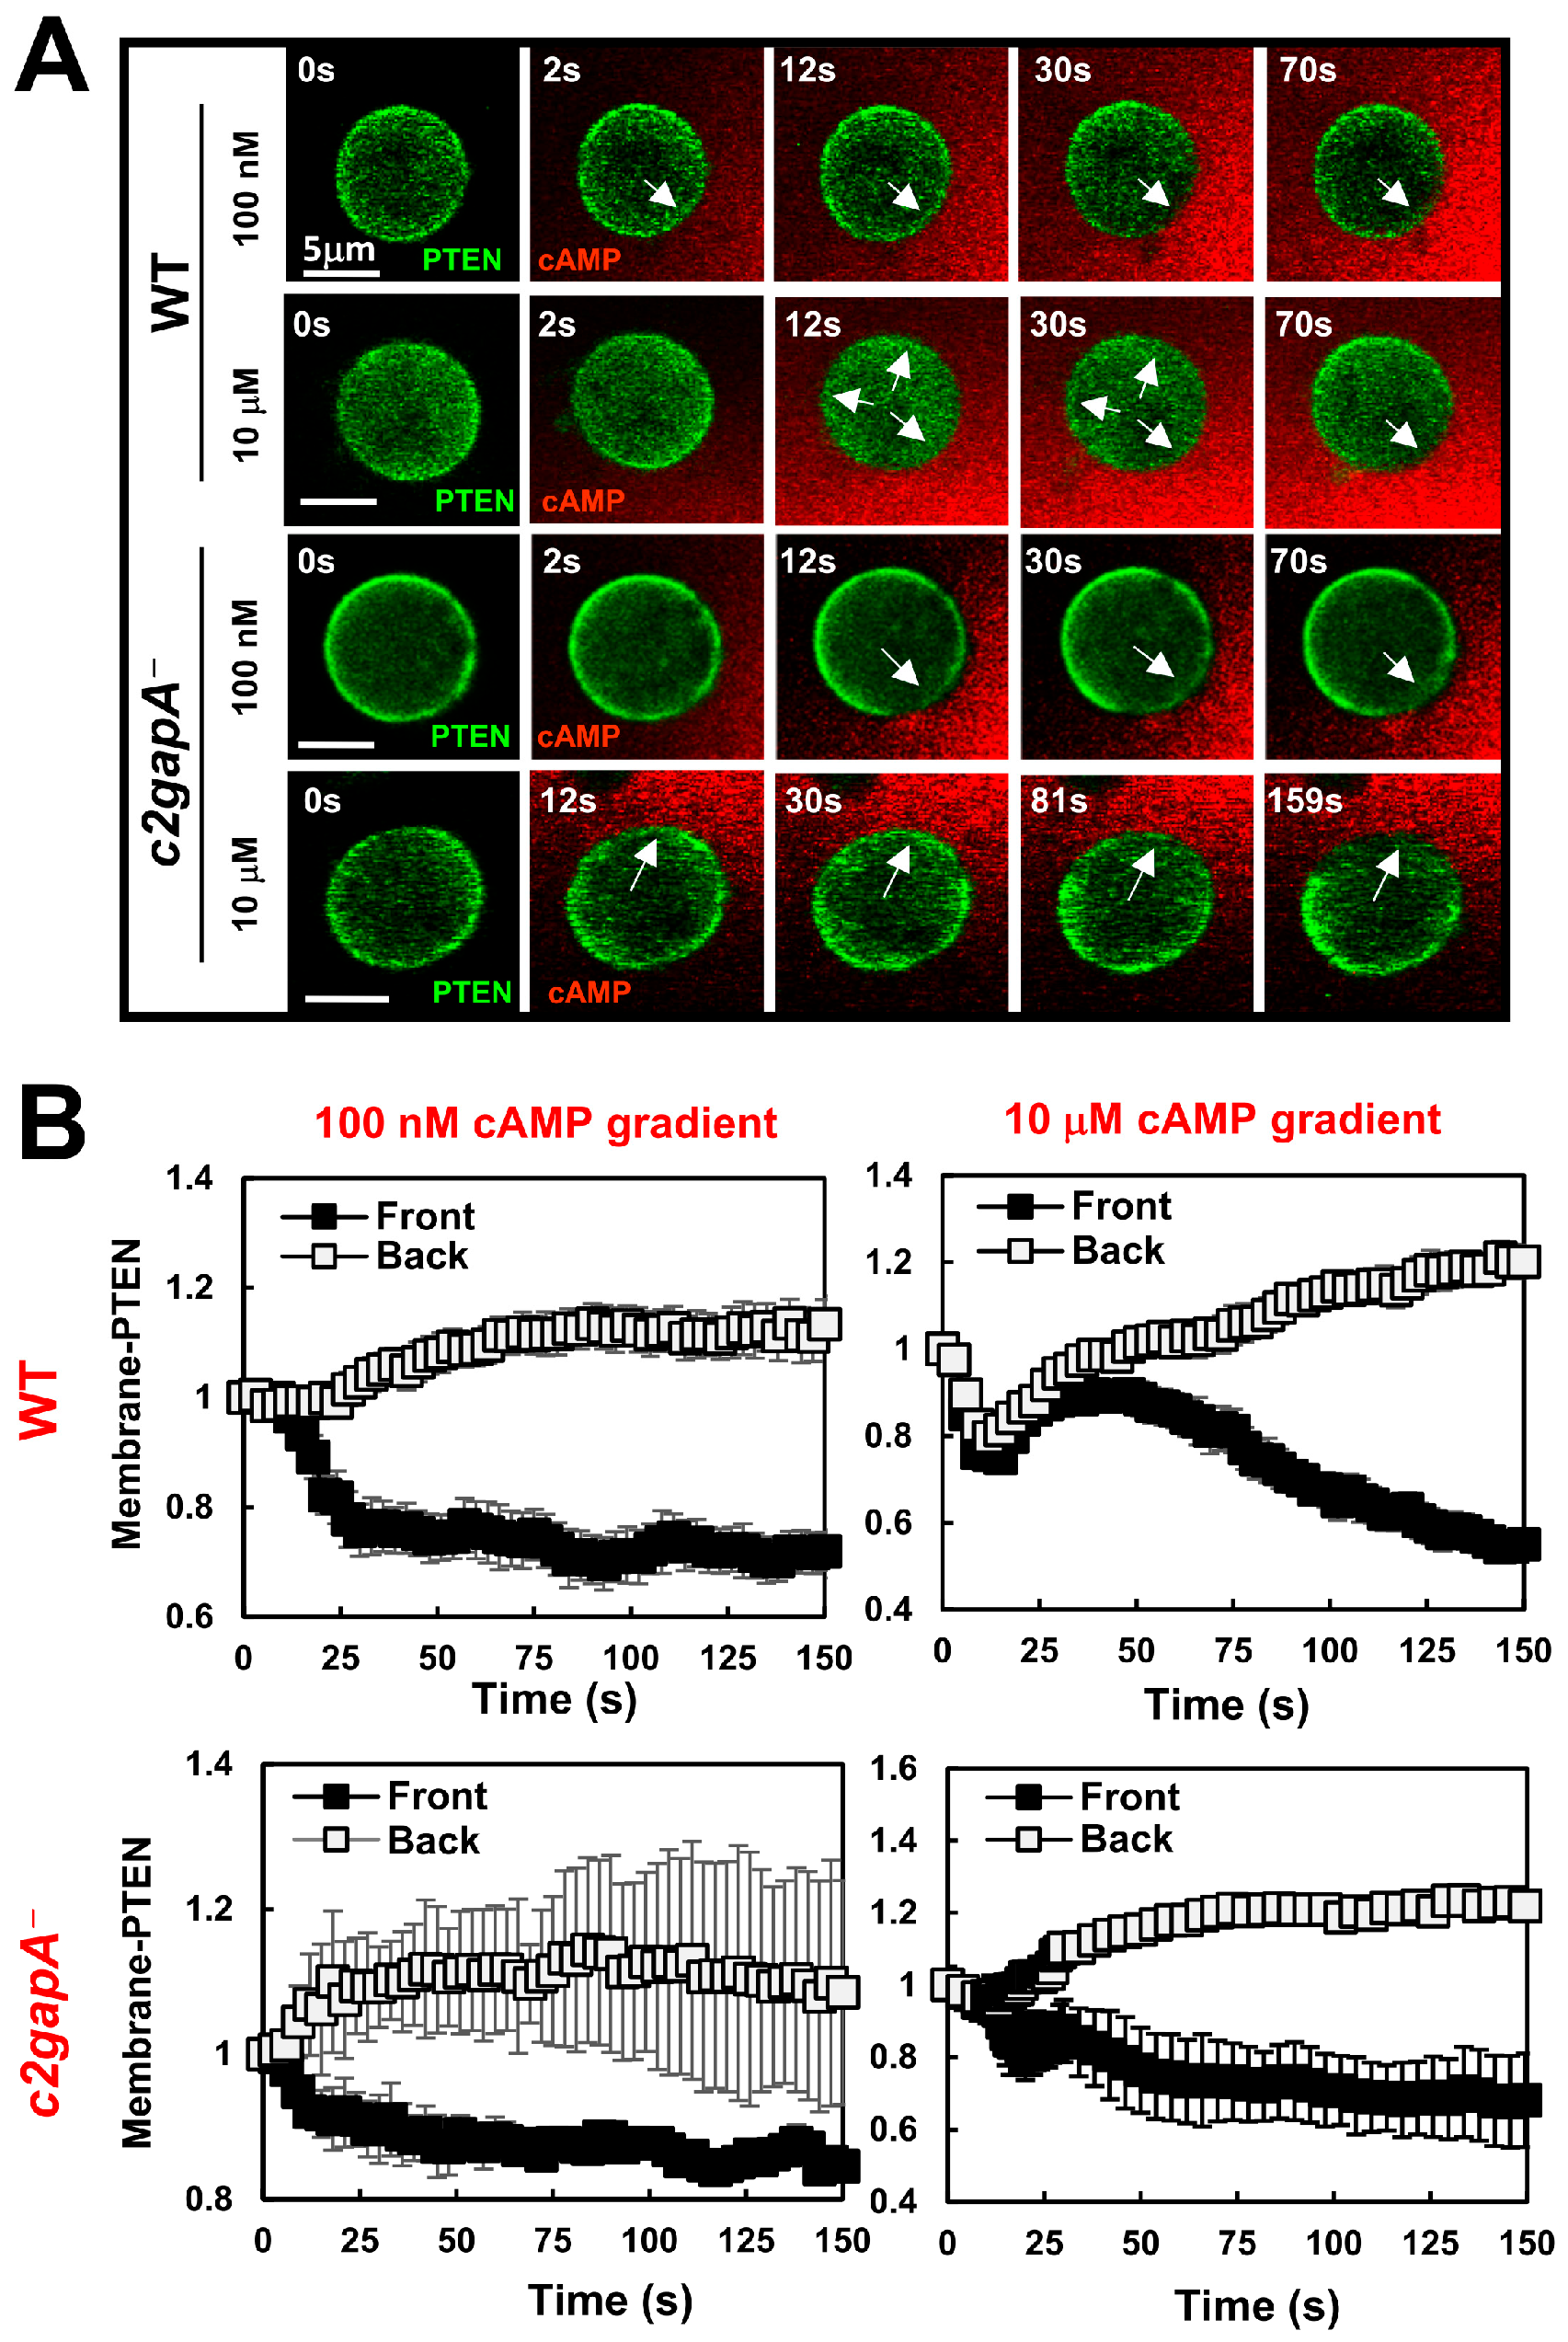
Phosphatase PTEN is a key molecule that dephosphorylates PIP3 and modulates PIP3 production during gradient sensing and chemotaxis [12,13]. We next monitored PTEN dynamics in WT and c2gapA cells upon exposure to steady cAMP gradients at varying concentrations (Figure 2A and Video S2). WT and c2gapA cells expressing PTEN-GFP (green) were treated with 5 μM Latrunculin B for 10 min prior to imaging. cAMP was mixed with Alexa594 (red) to visualize the gradient. PTEN-GFP localized to the plasma membrane in both unstimulated, resting WT and c2gapA cells, as previously reported [13]. Upon exposure to a relatively low cAMP concentration gradient (100 nM), WT cells exhibited a single-phase PTEN response, characterized by withdrawal of PTEN-GFP from the front and lateral regions of cells (Figure 2A, upper panel). In contrast, exposure to a high, saturating cAMP gradient (10 μM) induced a biphasic PTEN response in WT cells, consisting of an initial, uniform withdrawal of PTEN-GFP from the entire cell periphery to the cytoplasm, followed by re-localization of PTEN-GFP from the cytoplasm to the rear of cells. This adaptive redistribution of PTEN restricts PIP3 accumulation to the cell front and is a hallmark of proper gradient sensing [33,36]. We next examined PTEN-GFP dynamics in c2gapA cells exposed to either 100 nM or 10 μM cAMP gradients (Figure 2A, lower panel). In contrast to WT cells, c2gapA cells displayed persistent withdrawal of PTEN-GFP at the cell front under both concentrations. This defective PTEN adaptation is consistent with the spatiotemporal PIP3 dynamics shown in Figure 1, resulting in sustained or excessive PIP3 accumulation at the leading edge. The quantitative analysis of PTEN dynamics during gradient sensing, assessed by PM-localization of PTEN-GFP in the front and back regions across multiple cells, further verifies the above conclusion (Figure 2B). In conclusion, the above results indicate that C2GAP1 plays an essential role in PTEN adaptative response during gradient sensing, especially in gradients at high concentrations.

3.3. F-Actin-Independent, cAMP Concentration-Dependent PM Targeting of C2GAP1 During Gradient Sensing

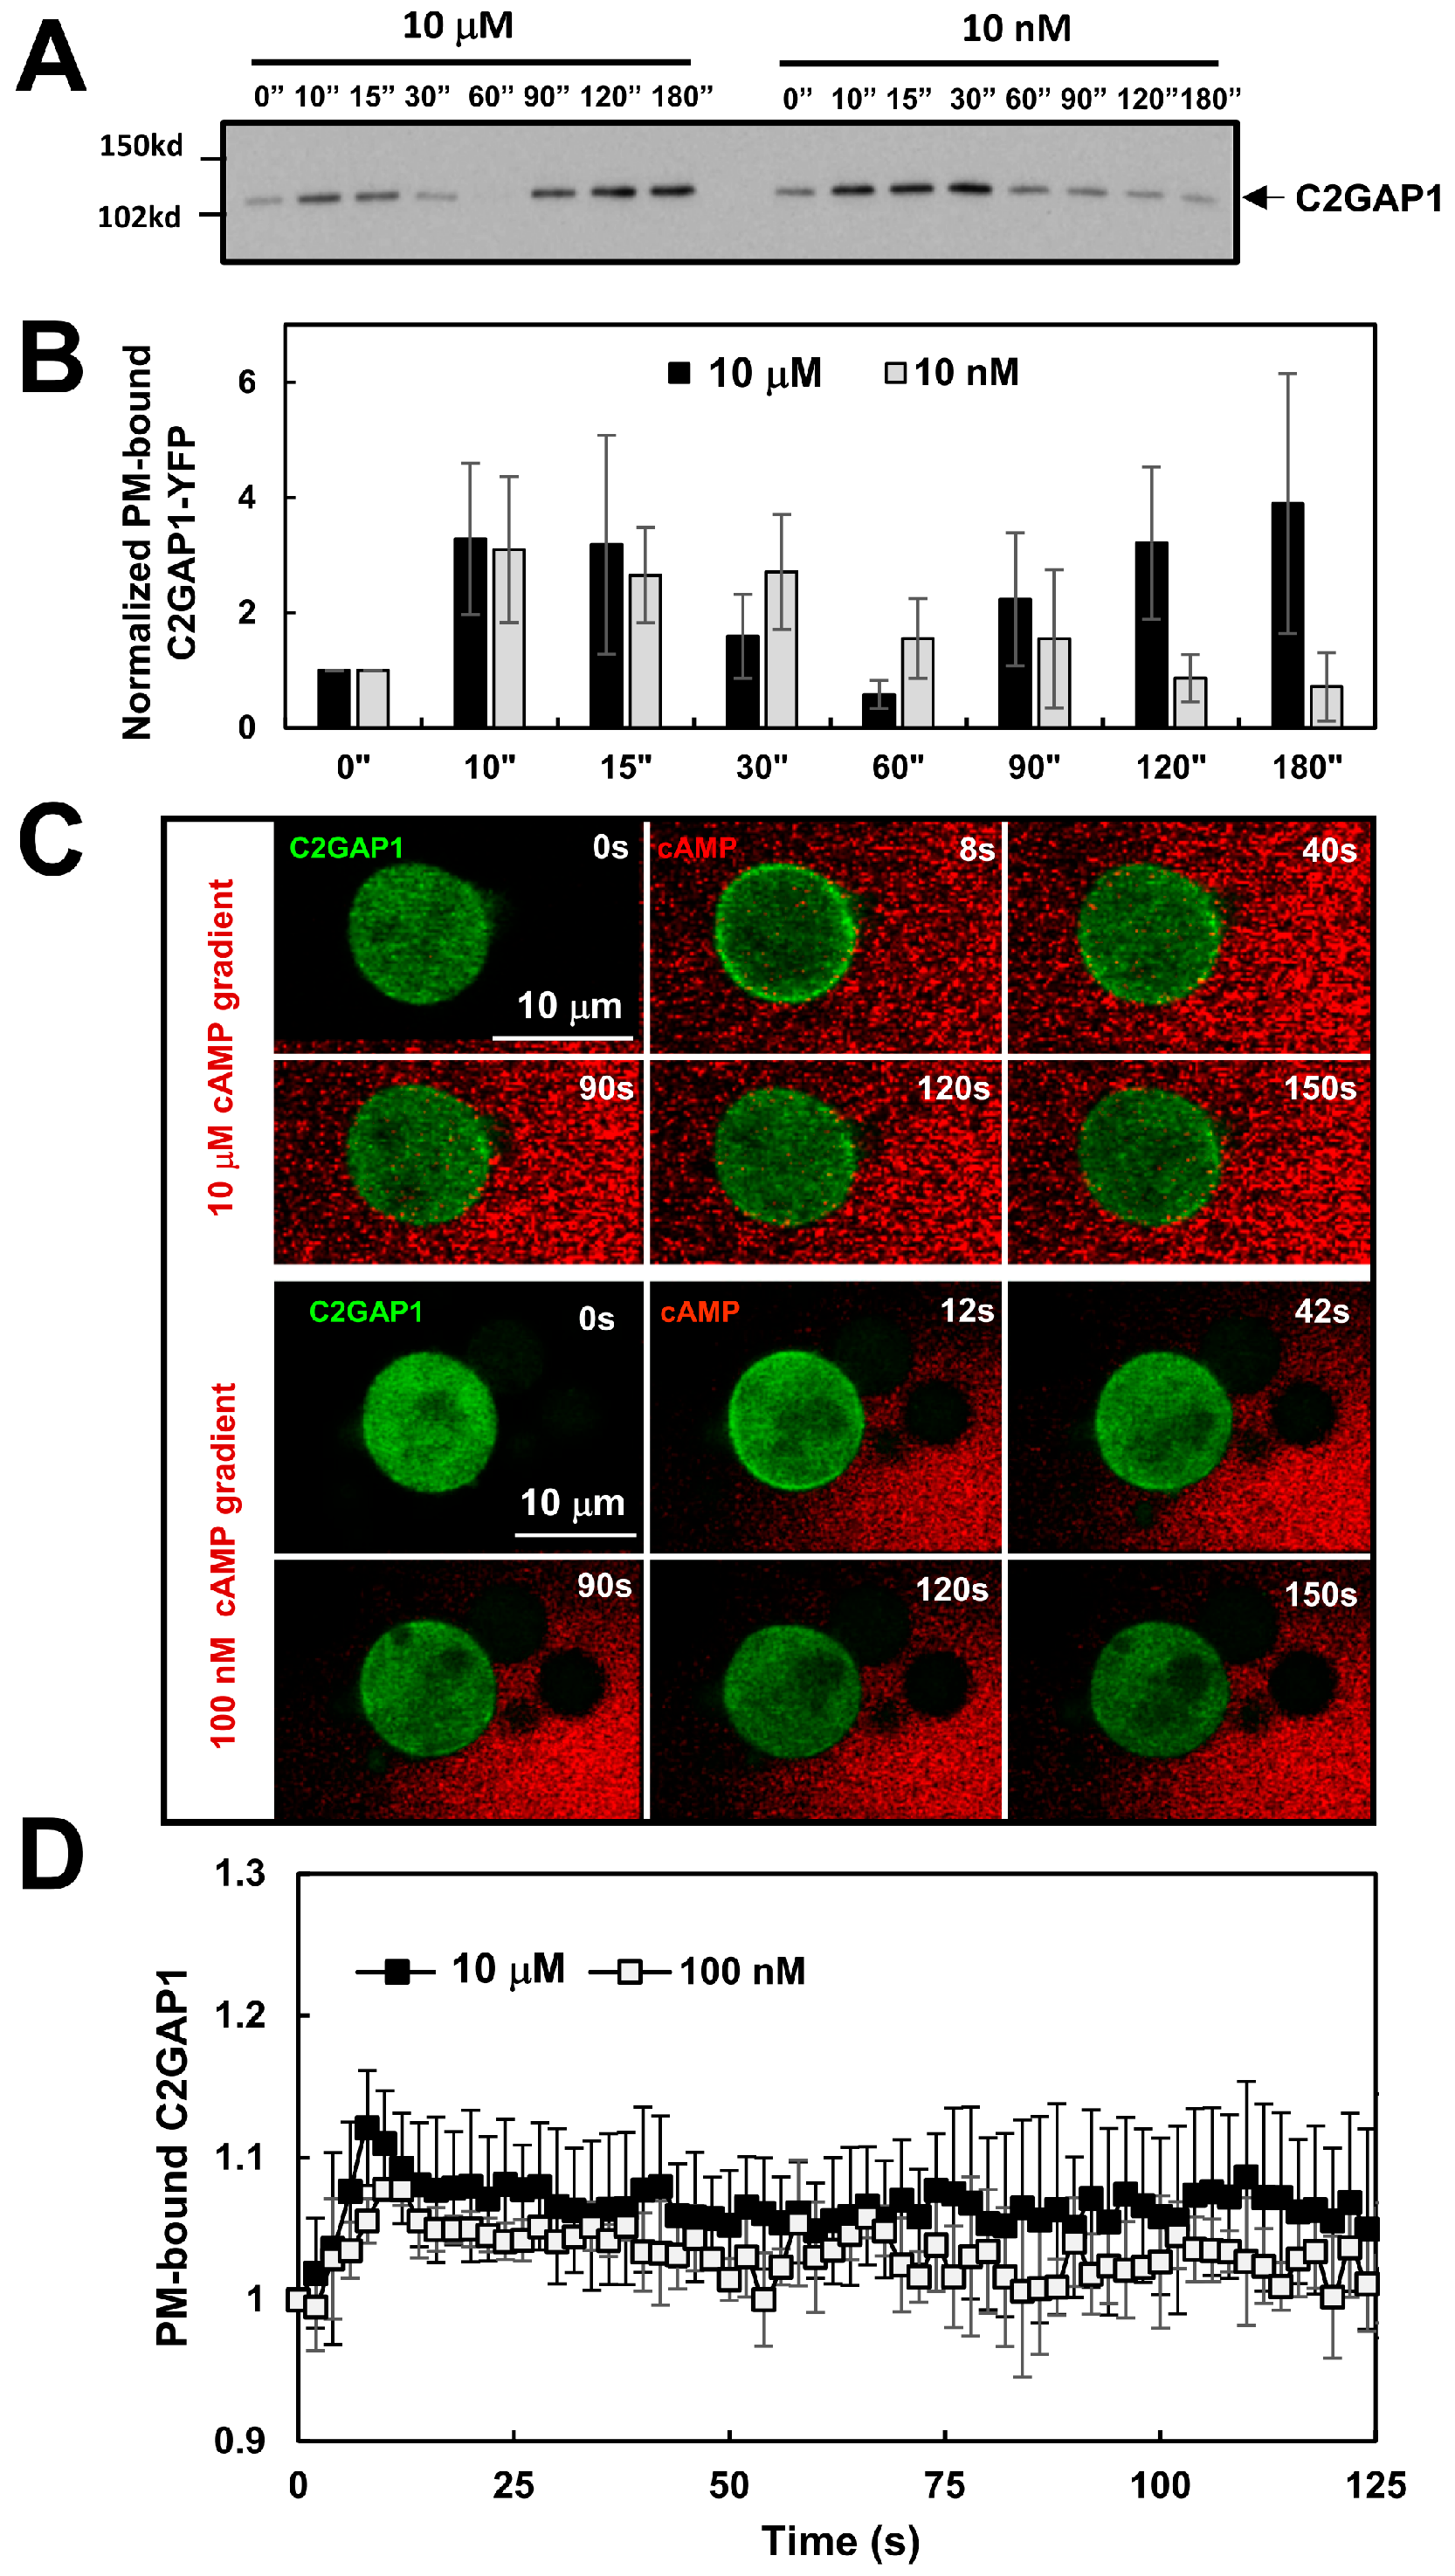
To understand the F-actin-independent, chemoattractant concentration-dependent adaptation in gradient sensing, we next examined whether C2GAP1 translocates to the plasma membrane (PM) in an F-actin-independent, cAMP concentration-dependent manner. We first assessed PM translocation of C2GAP1–YFP biochemically in a large population of Latrunculin B-treated cells stimulated with either high (10 μM) or low (100 nM) cAMP. Plasma membrane fractions were isolated before and after cAMP stimulation as previously described [34]. Consistent with previous reports [31], we detected PM-bound C2GAP1 in resting, F-actin-free unstimulated cells and observed a clear cAMP concentration-dependent PM translation of C2GAP1-YFP (Figure 3A). Uniform stimulation at a high, saturating concentration of cAMP (10 μM) induced a biphasic PM translocation of C2GAP1: a rapid initial recruitment peaking at ~10–15 s, followed by dissociation from the PM by ~60 s, and subsequently a second, sustained PM localization lasting up to 180 s. In contrast, stimulation at a low concentration of cAMP (10 nM) elicited a single-phase response characterized by a slow but prolonged PM recruitment between ~10 and 30 s, followed by a return to pre-stimulation levels. Quantitative analysis of three independent experiments confirmed these observations (Figure 3B and Figure S1).
We next monitored the spatiotemporal PM translocation of C2GAP1-YFP in cells upon exposure to a steady cAMP gradient by confocal microscopy (Figure 3C and Video S3). c2gapA cells expressing C2GAP1-YFP (green) were treated with 5 μM Latrunculin B for 10 min prior to imaging. cAMP was mixed with Alexa594 (red) to visualize the gradient. Consistent with the result shown in Figure 3A, C2GAP1-YFP displayed notable PM localization in resting, F-actin-free cells. Upon exposure to a high, saturating cAMP (10 μM) gradient, cells exhibited an initial PM translocation peak around ~ 8 s, followed by a withdrawal from the PM and were maintaining a sustained level on the PM (Figure 3C, upper panel). Notably, C2GAP1-YFP accumulated more prominently in the front than at the rear. Upon exposure to a low-concentration cAMP (100 nM) gradient, a similar response pattern was observed, although the peak translocation occurred more slowly at 12 s (Figure 3C, lower panel). Quantitative analysis of membrane translocation, assessed by cytosolic C2GAP1 depletion, confirmed these observations and further revealed a concentration-dependent response (Figure 3D). Collectively, these results demonstrate that C2GAP1 accumulates in the plasma membrane in an F-actin-independent, cAMP concentration-dependent manner during gradient sensing. Conclusively, C2GAP1 localizes on the plasma membrane in resting cells and chemoattractant gradients of both high and low concentrations trigger its translocation to the plasma membrane in an F-actin-independent manner. More importantly, the sustained plasma membrane localization of C2GAP1 following the initial translocation is concentration-dependent, being greater at the front than at the back of cells.

3.4. cAMP Concentration-Dependent Inhibitory Process of Gradient-Sensing Cells

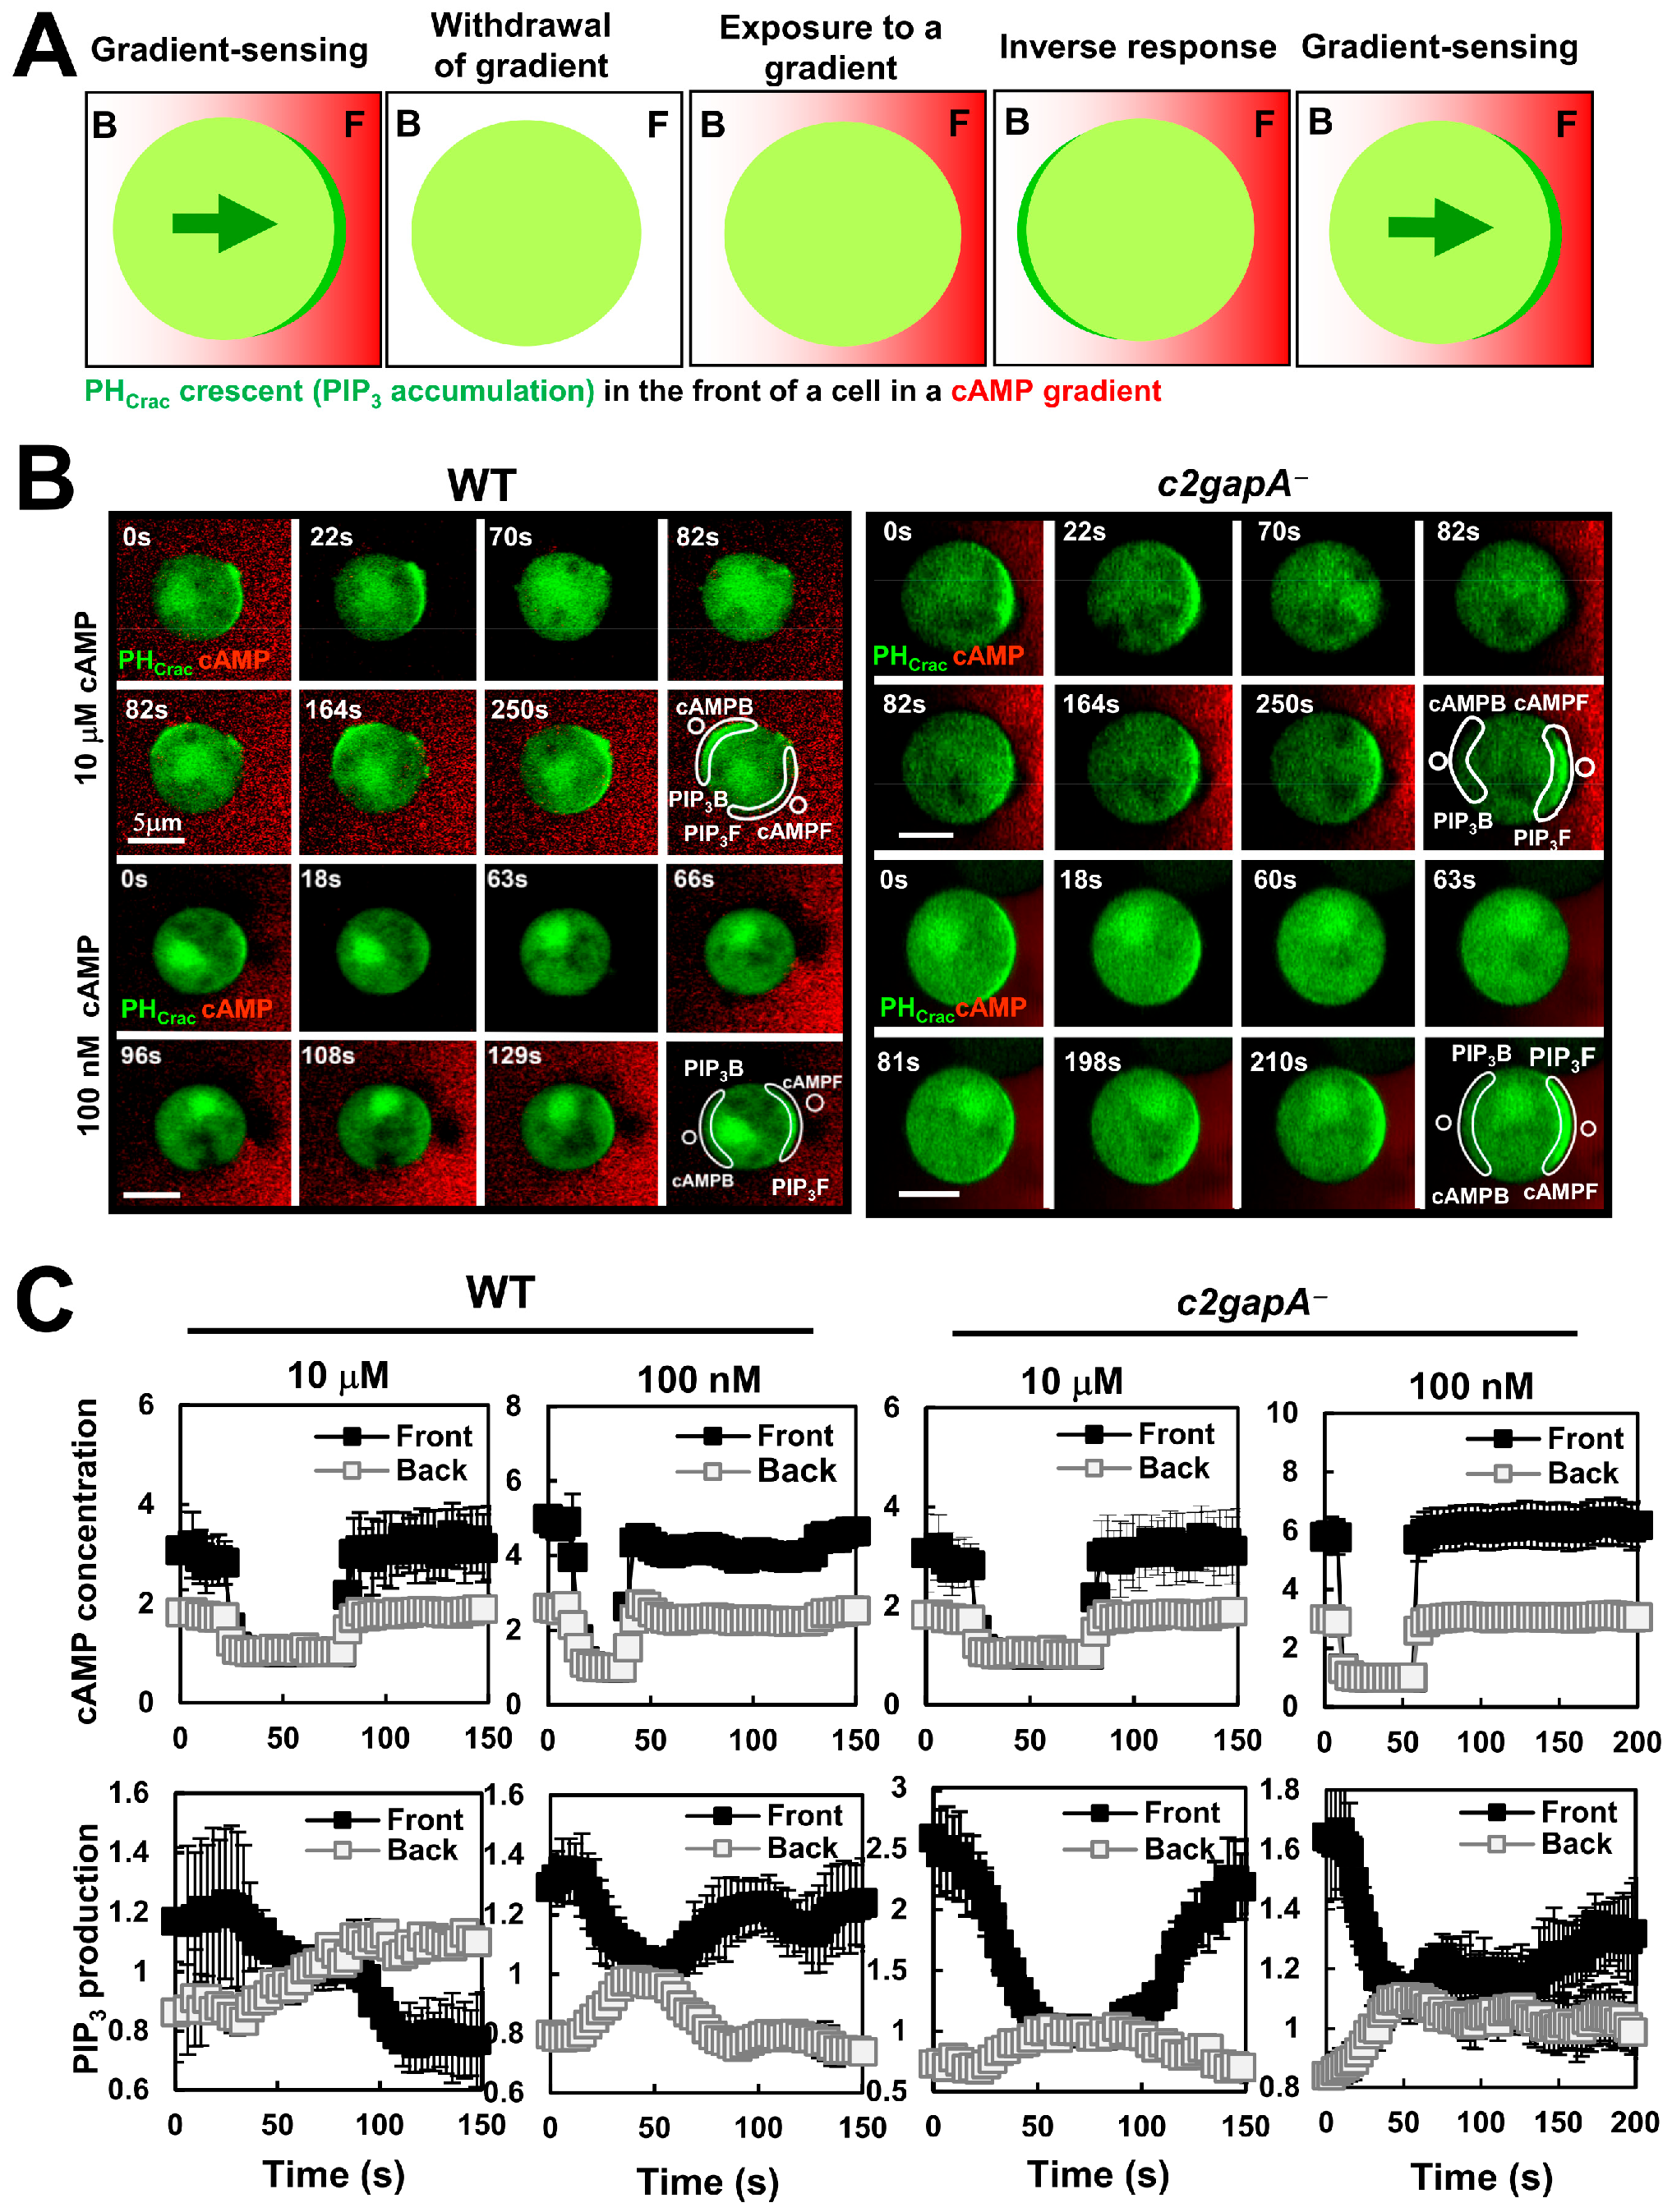
One key feature of F-actin-free, PIP3-polarized gradient-sensing cells is that cells accumulate stronger inhibition in the front of cells facing a steady, persistent gradient [36,38]. This stronger inhibition was experimentally verified [38]. The experimental design is shown in Figure 4A. Cells initially exposed to a steady gradient displayed stable PHCrac-GFP crescents oriented toward the gradient source. Next, the gradient was removed, and the PHCrac-GFP crescents gradually diminished and disappeared in the front. Upon reapplication of a second stimulation (either a uniform or a gradient), PHCrac-GFP translocated exclusively at the original rear of the cells. We refer to this behavior as an inversed response. An inverse response was also elicited upon reapplication of the same gradient, whereby cells effectively experienced a higher stimulus at the front relative to the rear (Figure 4A). The eventual disappearance of the inversed response, or its reorientation and re-accumulation of PHCrac-GFP at the front facing the gradient source, demonstrates that cells retain their ability to sense and respond to the gradient [38]. We designated this increased sensitivity at the rear of PIP3-polarized cells as inverse sensitivity, reflecting the preferential responsiveness of the original back due to the higher inhibition in the front of gradient-sensing cells. To further elucidate the nature of inverse sensitivity, we investigated whether it depends on the cAMP concentration of the gradient. To address this, we investigated the inversed sensitivity of PIP3-polarized cells exposed to either high (10 μM) or low (100 nM) cAMP gradient. After cells established a stable PHCrac crescent, the initial gradient was removed to allow dissipation of front-facing PHCrac-GFP accumulation. An identical, second gradient was reintroduced, and cellular response was monitored (Figure 4B, Video S4). We found that PIP3-polarized cells exposed to 10 μM cAMP gradients frequently (~93.6%) displayed inverse sensitivity (Figure 4B, left upper panel). In contrast, only ~8.2% of cells exposed to 100 nM cAMP gradients exhibited an inverse response (Figure 4B, left lower panel). The selected areas shown in the montages indicate the regions used for quantitative measurement of cAMP gradient sensing and PHCrac-GFP PM translocation. Quantitative analysis confirmed that identical gradients were applied to the cells and revealed the spatiotemporal dynamics of PIP3 accumulation at both the front and back of the cells (Figure 4C). Taken together, these results demonstrate that an F-actin-independent, cAMP concentration-dependent local inhibitory process is an intrinsic component of gradient sensing.

3.5. c2gapA Cell Fails to Display a Higher Inhibition in the Front During Gradient Sensing

C2GAP1 accumulates at the plasma membrane in a cAMP concentration-dependent manner, more at the front than at the back, in cells exposed to a cAMP gradient (Figure 3). We next investigated whether C2GAP1 contributes to the cAMP concentration-dependent inhibitory mechanism. To address this, we examined whether gradient-sensing, PIP3-polarized c2gapA cells exhibit concentration-dependent inverse sensitivity. c2gapA cells expressing the PIP3 biosensor PHCrac-GFP (green) were treated with 5 μM Latrunculin B for 10 min prior to the experiment and cAMP was mixed with Alexa594 (red). Upon exposure to either 10 μM or 100 nM cAMP gradients, c2gapA cells displayed PH-GFP accumulation (PH crescents) at the front facing the gradient (Figure 4A, right panel; Video S4). Removal of either gradient caused PHCrac crescents to gradually diminish and disappear. Upon re-exposure to the identical gradient, PHCrac-GFP translocated to the original front, instead of the back, of c2gapA cells. The selected areas shown in the montages indicate the regions used for quantitative measurement of cAMP gradient sensing and PIP3 accumulation. Quantitative analysis confirmed that identical gradients were applied and revealed the spatiotemporal dynamics of PIP3 accumulation at both the front and back of the cells (Figure 4C). Collectively, these results demonstrate that C2GAP1 plays an essential role in establishing cAMP concentration-dependent, local inhibition during gradient sensing.

3.6. Dynamics of C2GAP1 PM Localization in Response to Removal and Second Application of cAMP Gradient

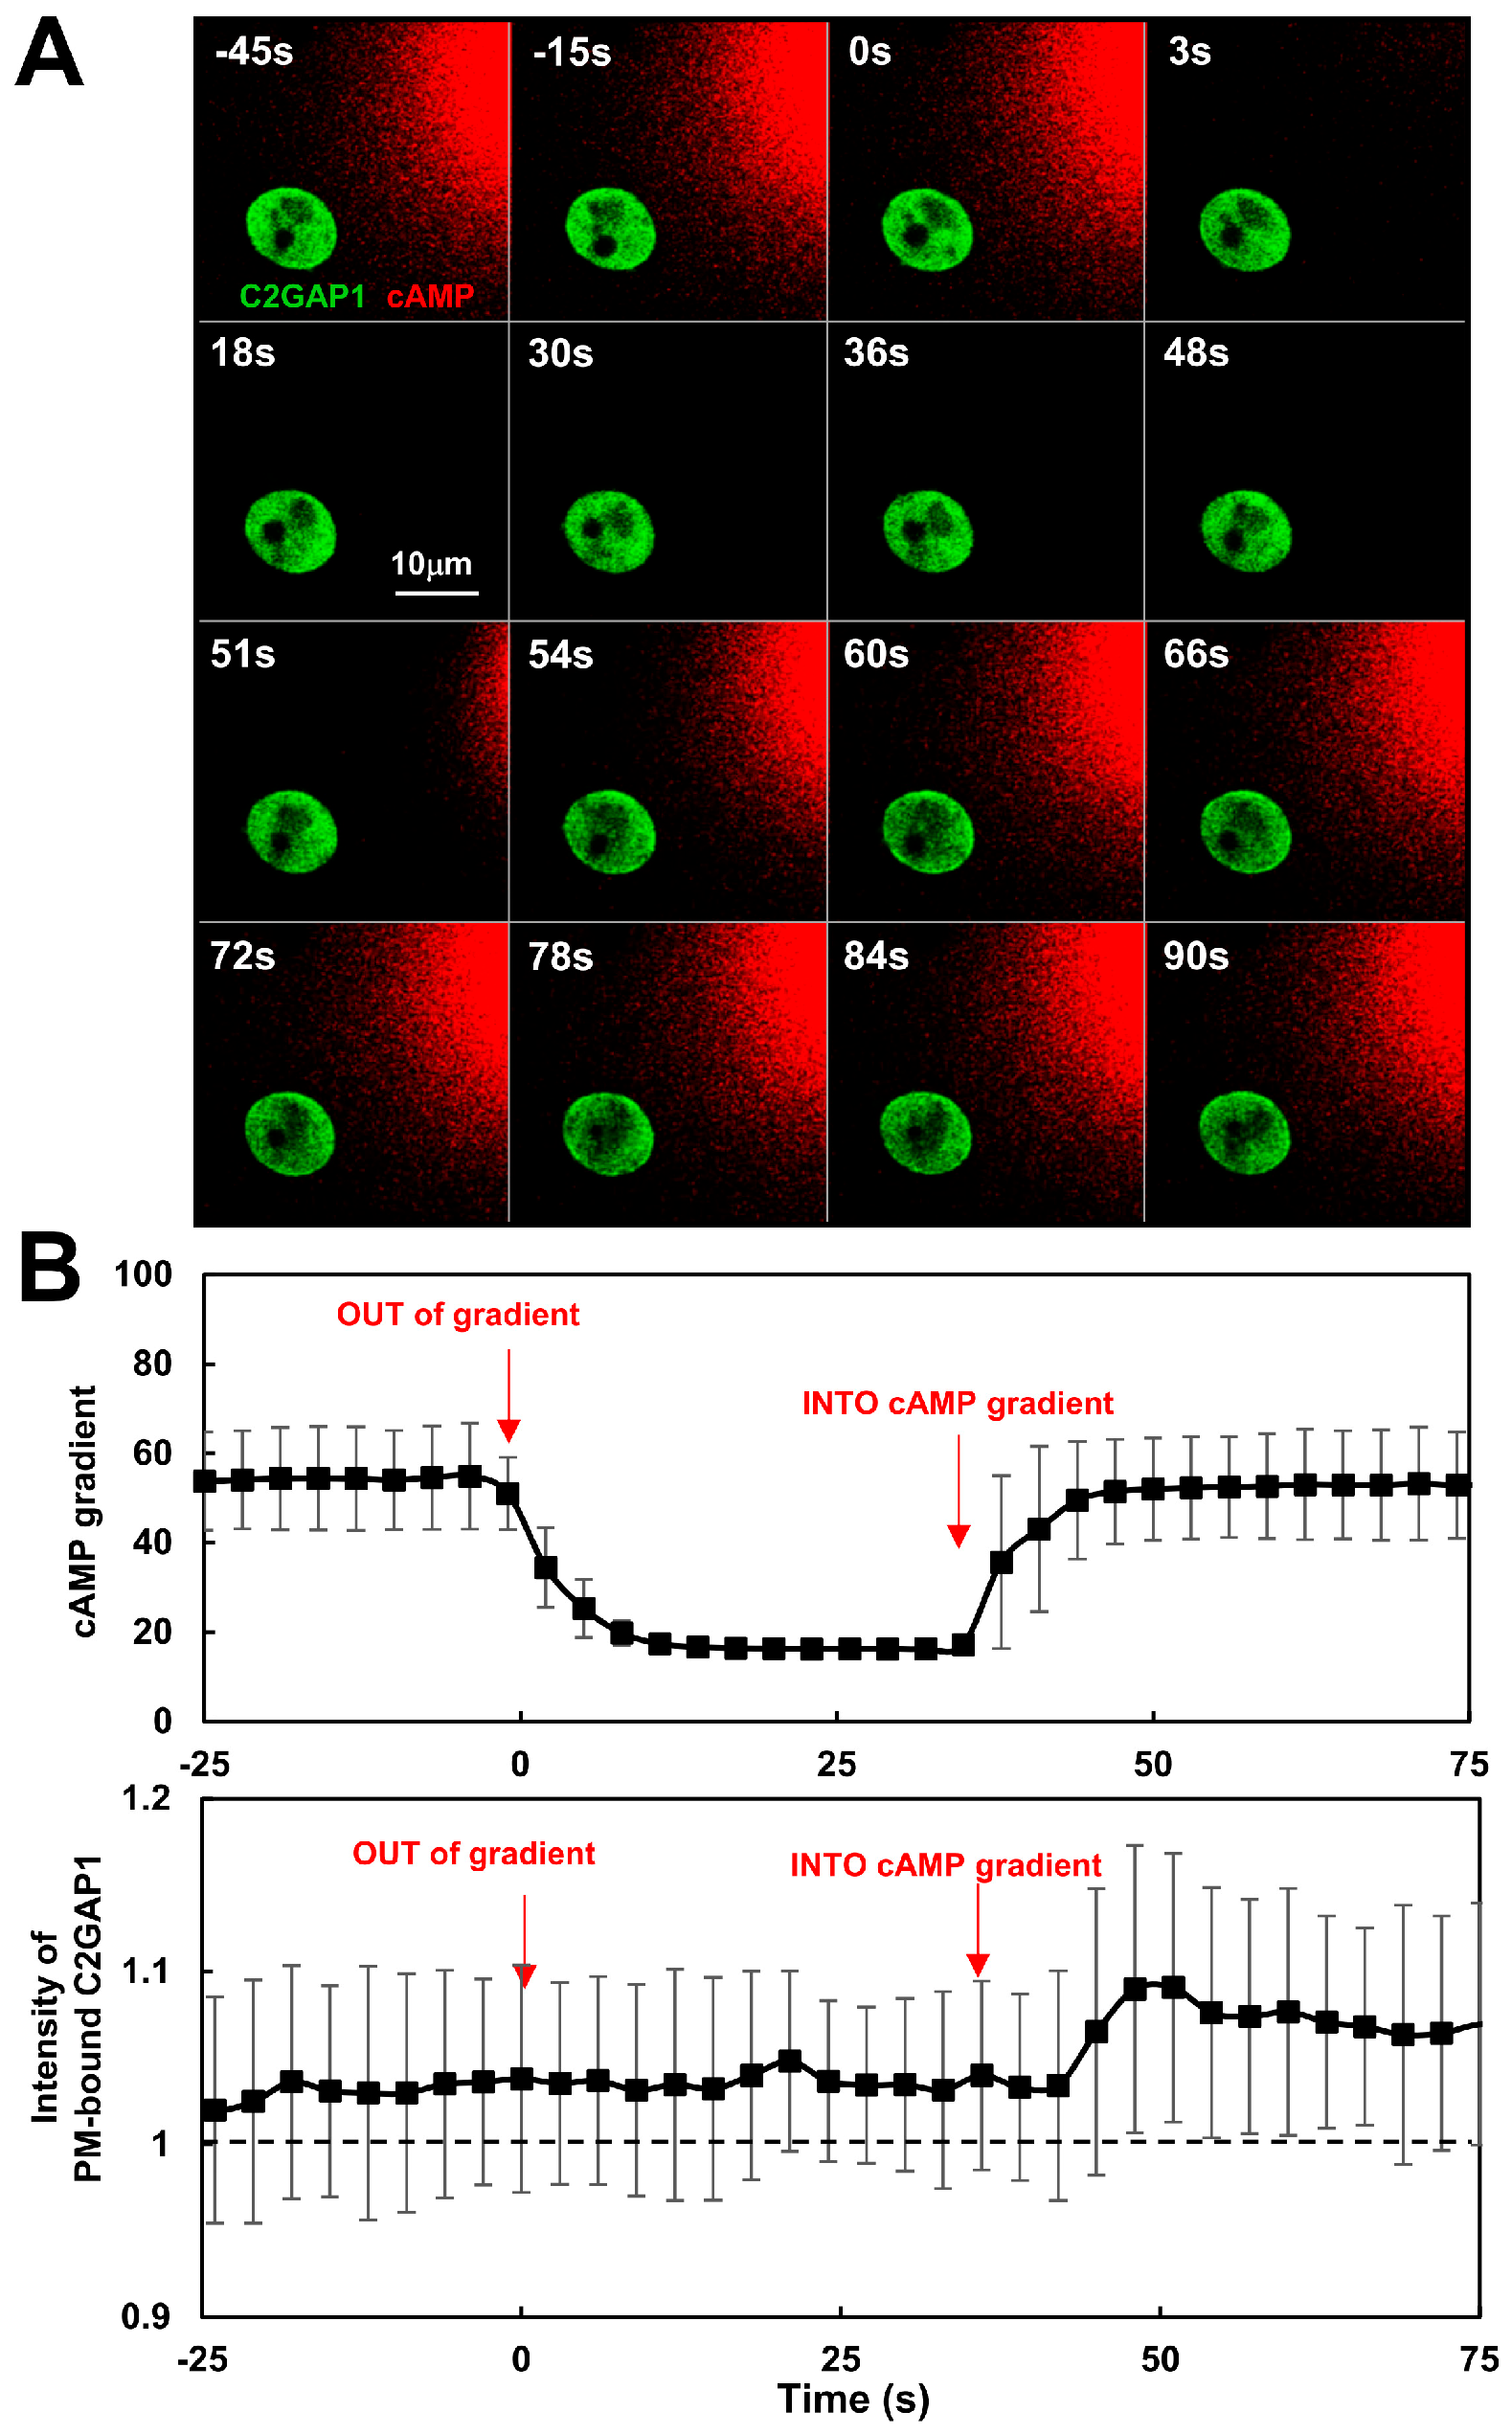
To investigate the mechanism by which C2GAP1 mediates this concentration-dependent inhibition, we monitored plasma membrane localization of C2GAP1 following gradient removal and reapplication (Figure 5A; Video S5). Chemotactic C2GAP1-YFP (green)-expressing c2gapA cells treated with latrunculin B (5 μM) were exposed to a 10 μM cAMP gradient (red). After exposure to a steady gradient for more than 200 s, the gradient was removed and this time point was designated as 0 s. At 54 s, an identical gradient was reintroduced, inducing a second translocation of C2GAP1-YFP to the plasma membrane followed by partial withdrawal. Quantitative analysis confirmed removal of the initial gradient and subsequent reapplication of an identical gradient (Figure 5B). Plasma membrane localization of C2GAP1 at the time of initial gradient exposure was normalized to 1; notably, membrane-bound C2GAP1 remained above this level at 0 s, indicating persistent plasma membrane association, consistent with Figure 3D. A complete dataset of gradient measurements and C2GAP1 PM translocation during initial exposure, gradient removal, and re-exposure is shown in Figure S2. Importantly, C2GAP1-YFP did not significantly dissociate from the plasma membrane following gradient removal, suggesting that C2GAP1 persists at the membrane to provide sustained inhibitory signaling during subsequent gradient sensing.

3.7. C2GAP1 Interacts with Gα2 to Decrease Cell Sensitivity and the Activation of Heterotrimeric G Protein upon cAMP Stimulation

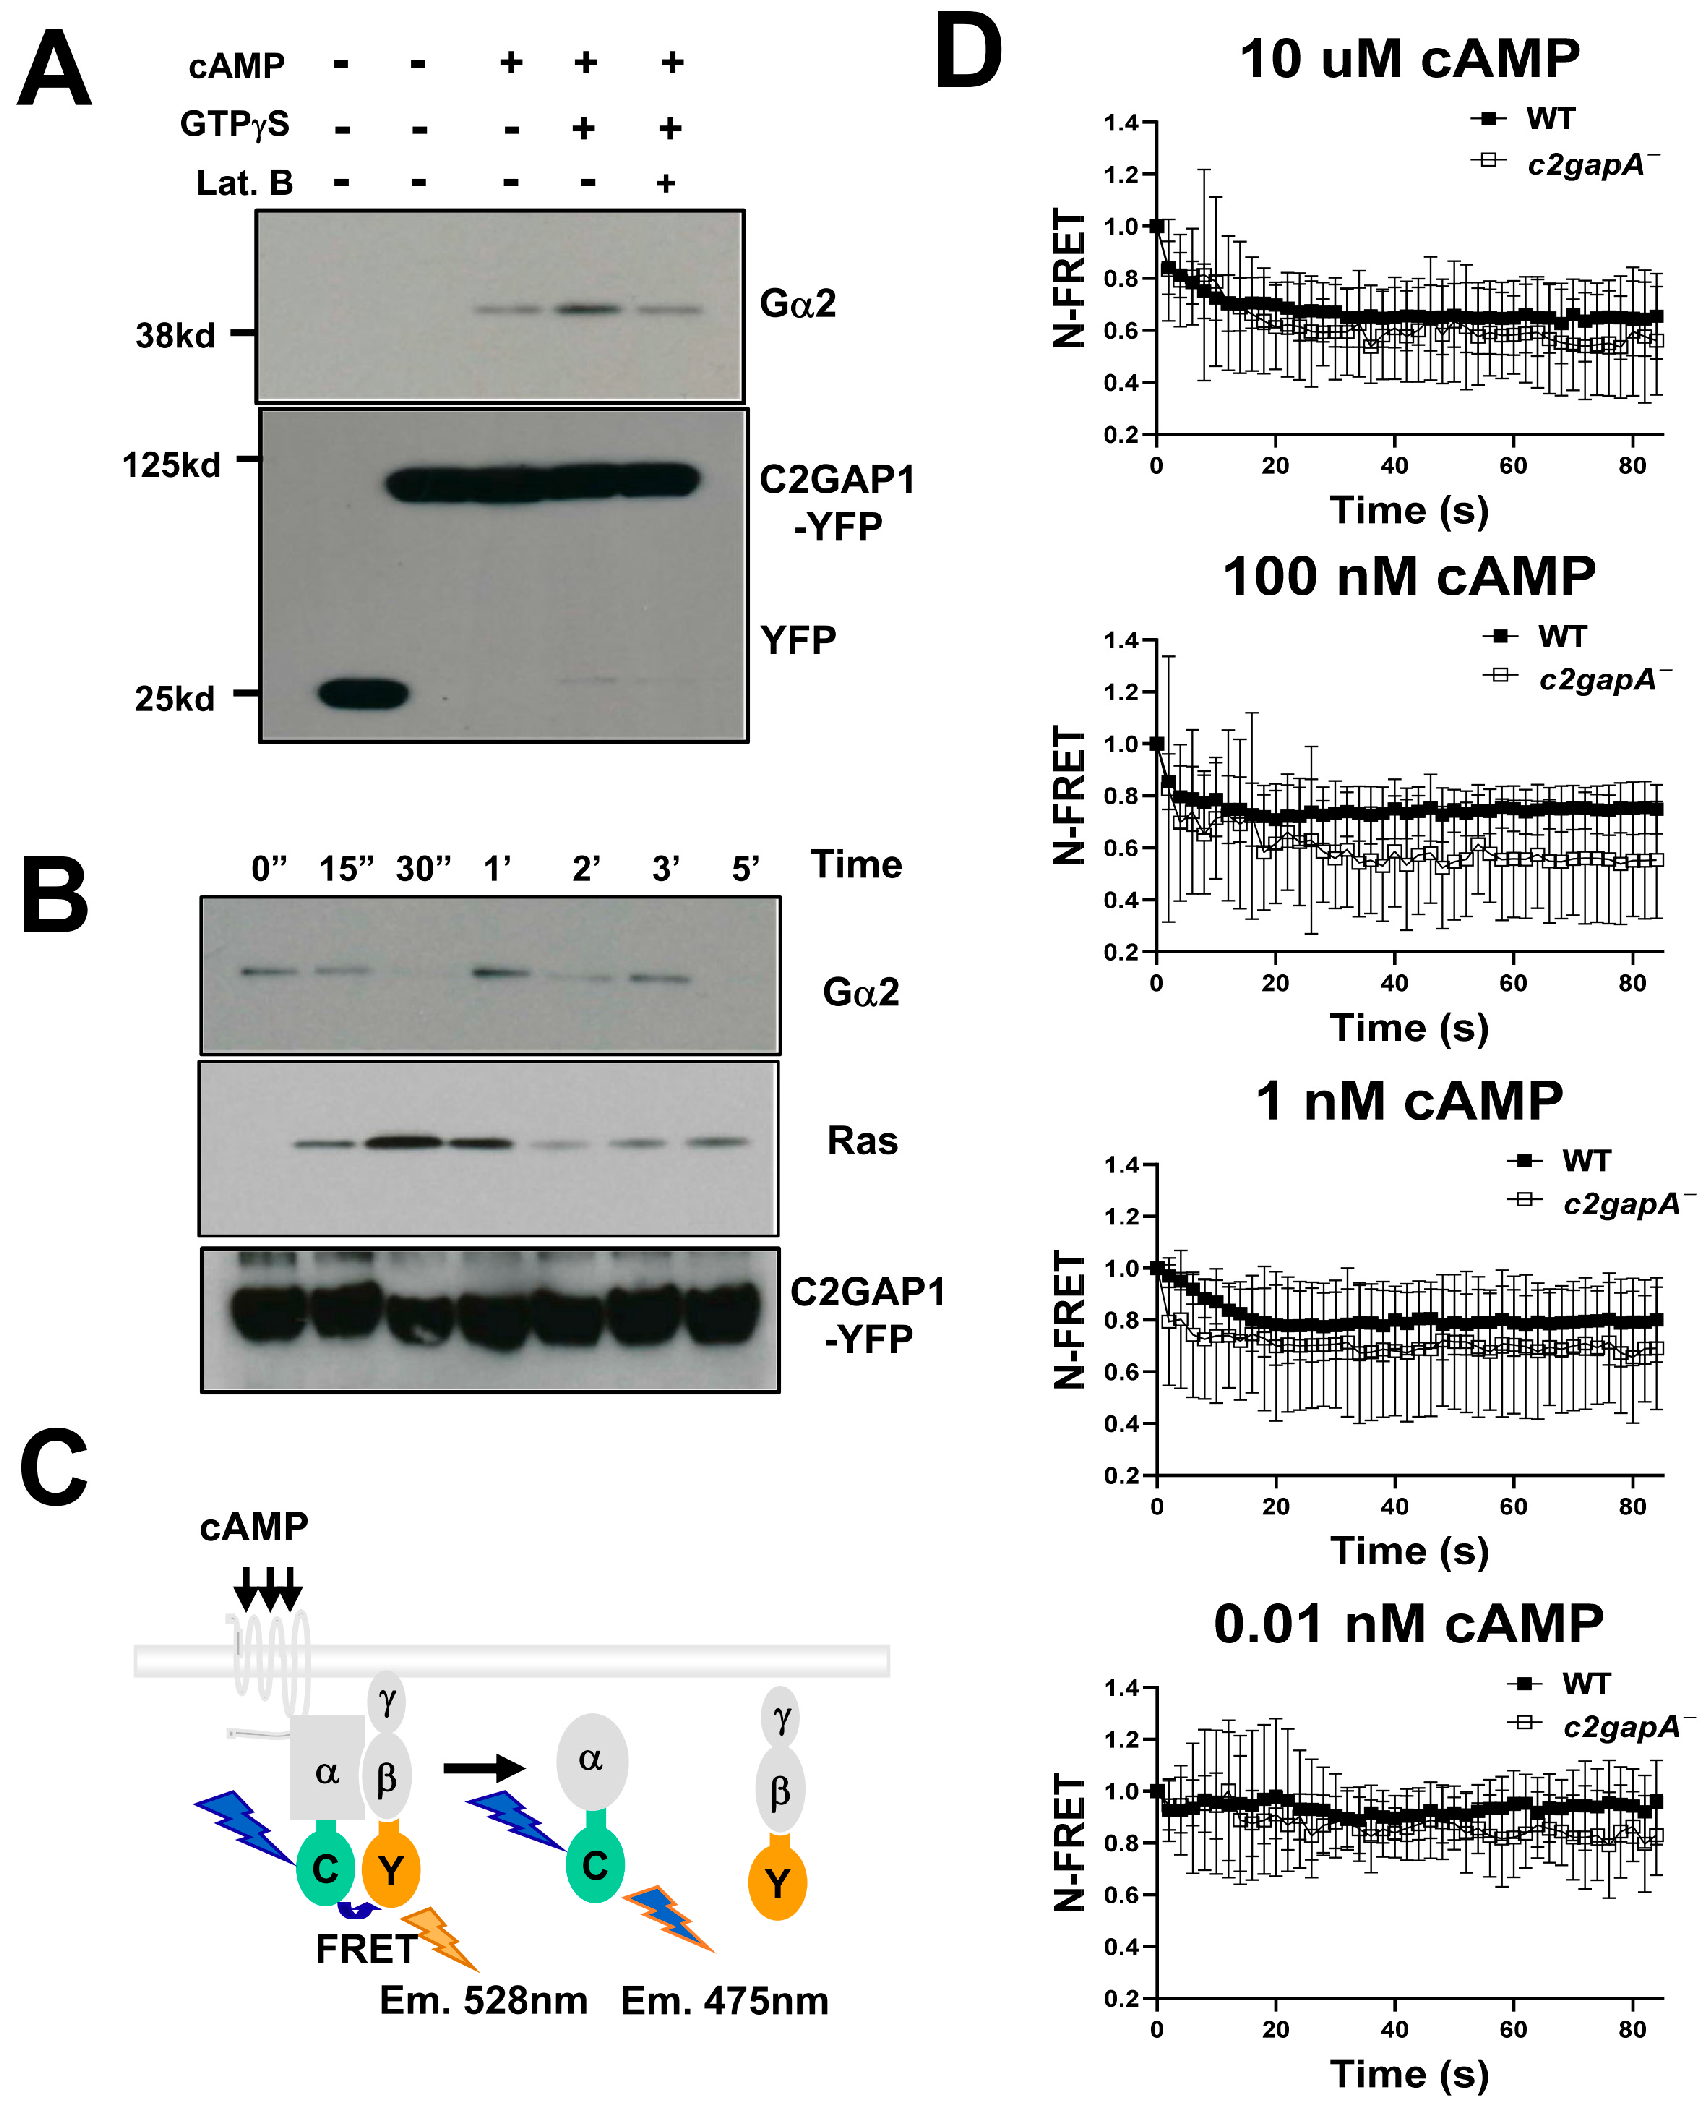
To better understand the molecular mechanisms by which C2GAP1 modulates Ras signaling to establish a concentration-dependent inhibitory process to achieve the proper PIP3 dynamics, we sought to identify additional molecules that interact with C2GAP1 under different conditions by co-immunoprecipitation (co-IP) assays (Figure 6A). Cells expressing YFP protein alone were used as a negative control. cAMP-chemotactic C2GAP1-YFP-expressing cells were treated with either cAMP, hydrolysis-resistant GTPγS, or latrunculin B and then subjected to a co-IP experiment and immunoblotting of the indicated proteins. Notably, we identified Gα2 as an interacting partner of C2GAP1 with or without cAMP stimulation (Figure 6A). cAMP chemoattractant-competent cells express endogenous levels of Gα2 that is the α subunit of the heterotrimeric G protein essential for cAMP gradient sensing in F-actin-free cells [33,38]. Importantly, the association between Gα2 and C2GAP1 persisted in cells treated with an actin polymerization inhibitor, latrunculin B, when the F-actin-mediated positive or negative feedback loop was diminished, indicating that the Gα2-C2GAP1 interaction is a core component of the gradient-sensing machinery.
To further characterize the dynamics of the association, we determined the temporal profile of the C2GAP1-Gα2 interaction in response to cAMP stimulation (Figure 6B). The C2GAP1-Ras interaction was used as a positive control, and as previously reported, a transient association between C2GAP1 and Ras was observed [28]. Consistent with the result shown in Figure 6A, an association between Gα2 and C2GAP1 was present in the cells prior to stimulation. This interaction persisted but decreased markedly at 15 s after cAMP stimulation and became undetectable at 30 s, followed by a second peak at approximately 1 min post stimulation and subsequent oscillatory behavior. These interaction dynamics are consistent with previous observations that a fraction of C2GAP1 localizes to the plasma membrane and protrusive regions in resting cells, and that cAMP stimulation induces an initial plasma membrane translocation of C2GAP1 at ~15 s, followed by withdrawal at ~30 s, a second translocation at ~1 min, and subsequent oscillatory recruitment [28,31]. Notably, the second peak of the Gα2–C2GAP1 interaction coincided with the second wave of C2GAP1 plasma membrane localization during gradient sensing.
To assess the role of the Gα2-C2GAP1 interaction in heterotrimeric G protein activation, we measured G protein activation by monitoring fluorescence resonance energy transfer (FRET) between Gα2-CFP (FRET donor) and Gβ-YFP (FRET acceptor) in WT and c2gapA cells by confocal live cell imaging as previously reported [33]. A schematic illustrating G protein activation upon cAMP stimulation, measured as a loss of FRET-between Gα2-CFP and Gβ-YFP, is shown in Figure 6C. Sensitized emission of FRET efficiency was used to quantify FRET loss [39]. In WT cells, cAMP stimulation at a final concentration of 10 μM induced a decrease in FRET efficiency (Figure 6D), consistent with previous reports [39,40]. c2gapA cells exhibited a notably greater loss of FRET in response to the same 10 μM cAMP stimulation. This enhanced FRET loss was also observed in c2gapA cells stimulated with lower concentrations of cAMP (100 nM and 1 nM). More importantly, c2gapA cells responded to 0.01 nM cAMP stimulation, whereas WT cells no longer did. Together, these results demonstrate that the Gα2–C2GAP1 interaction not only sustains C2GAP1 at the plasma membrane to inhibit Ras signaling, thereby reducing cell sensitivity and promoting proper adaptation, but also attenuates heterotrimeric G protein activation in response to cAMP stimulation. Moreover, the C2GAP1–Gα2 interaction suppresses G protein activation in resting cells, further decreasing cellular sensitivity to chemoattractant stimulation.

3.8. Simulation of the Gα2-C2GAP1 Interaction

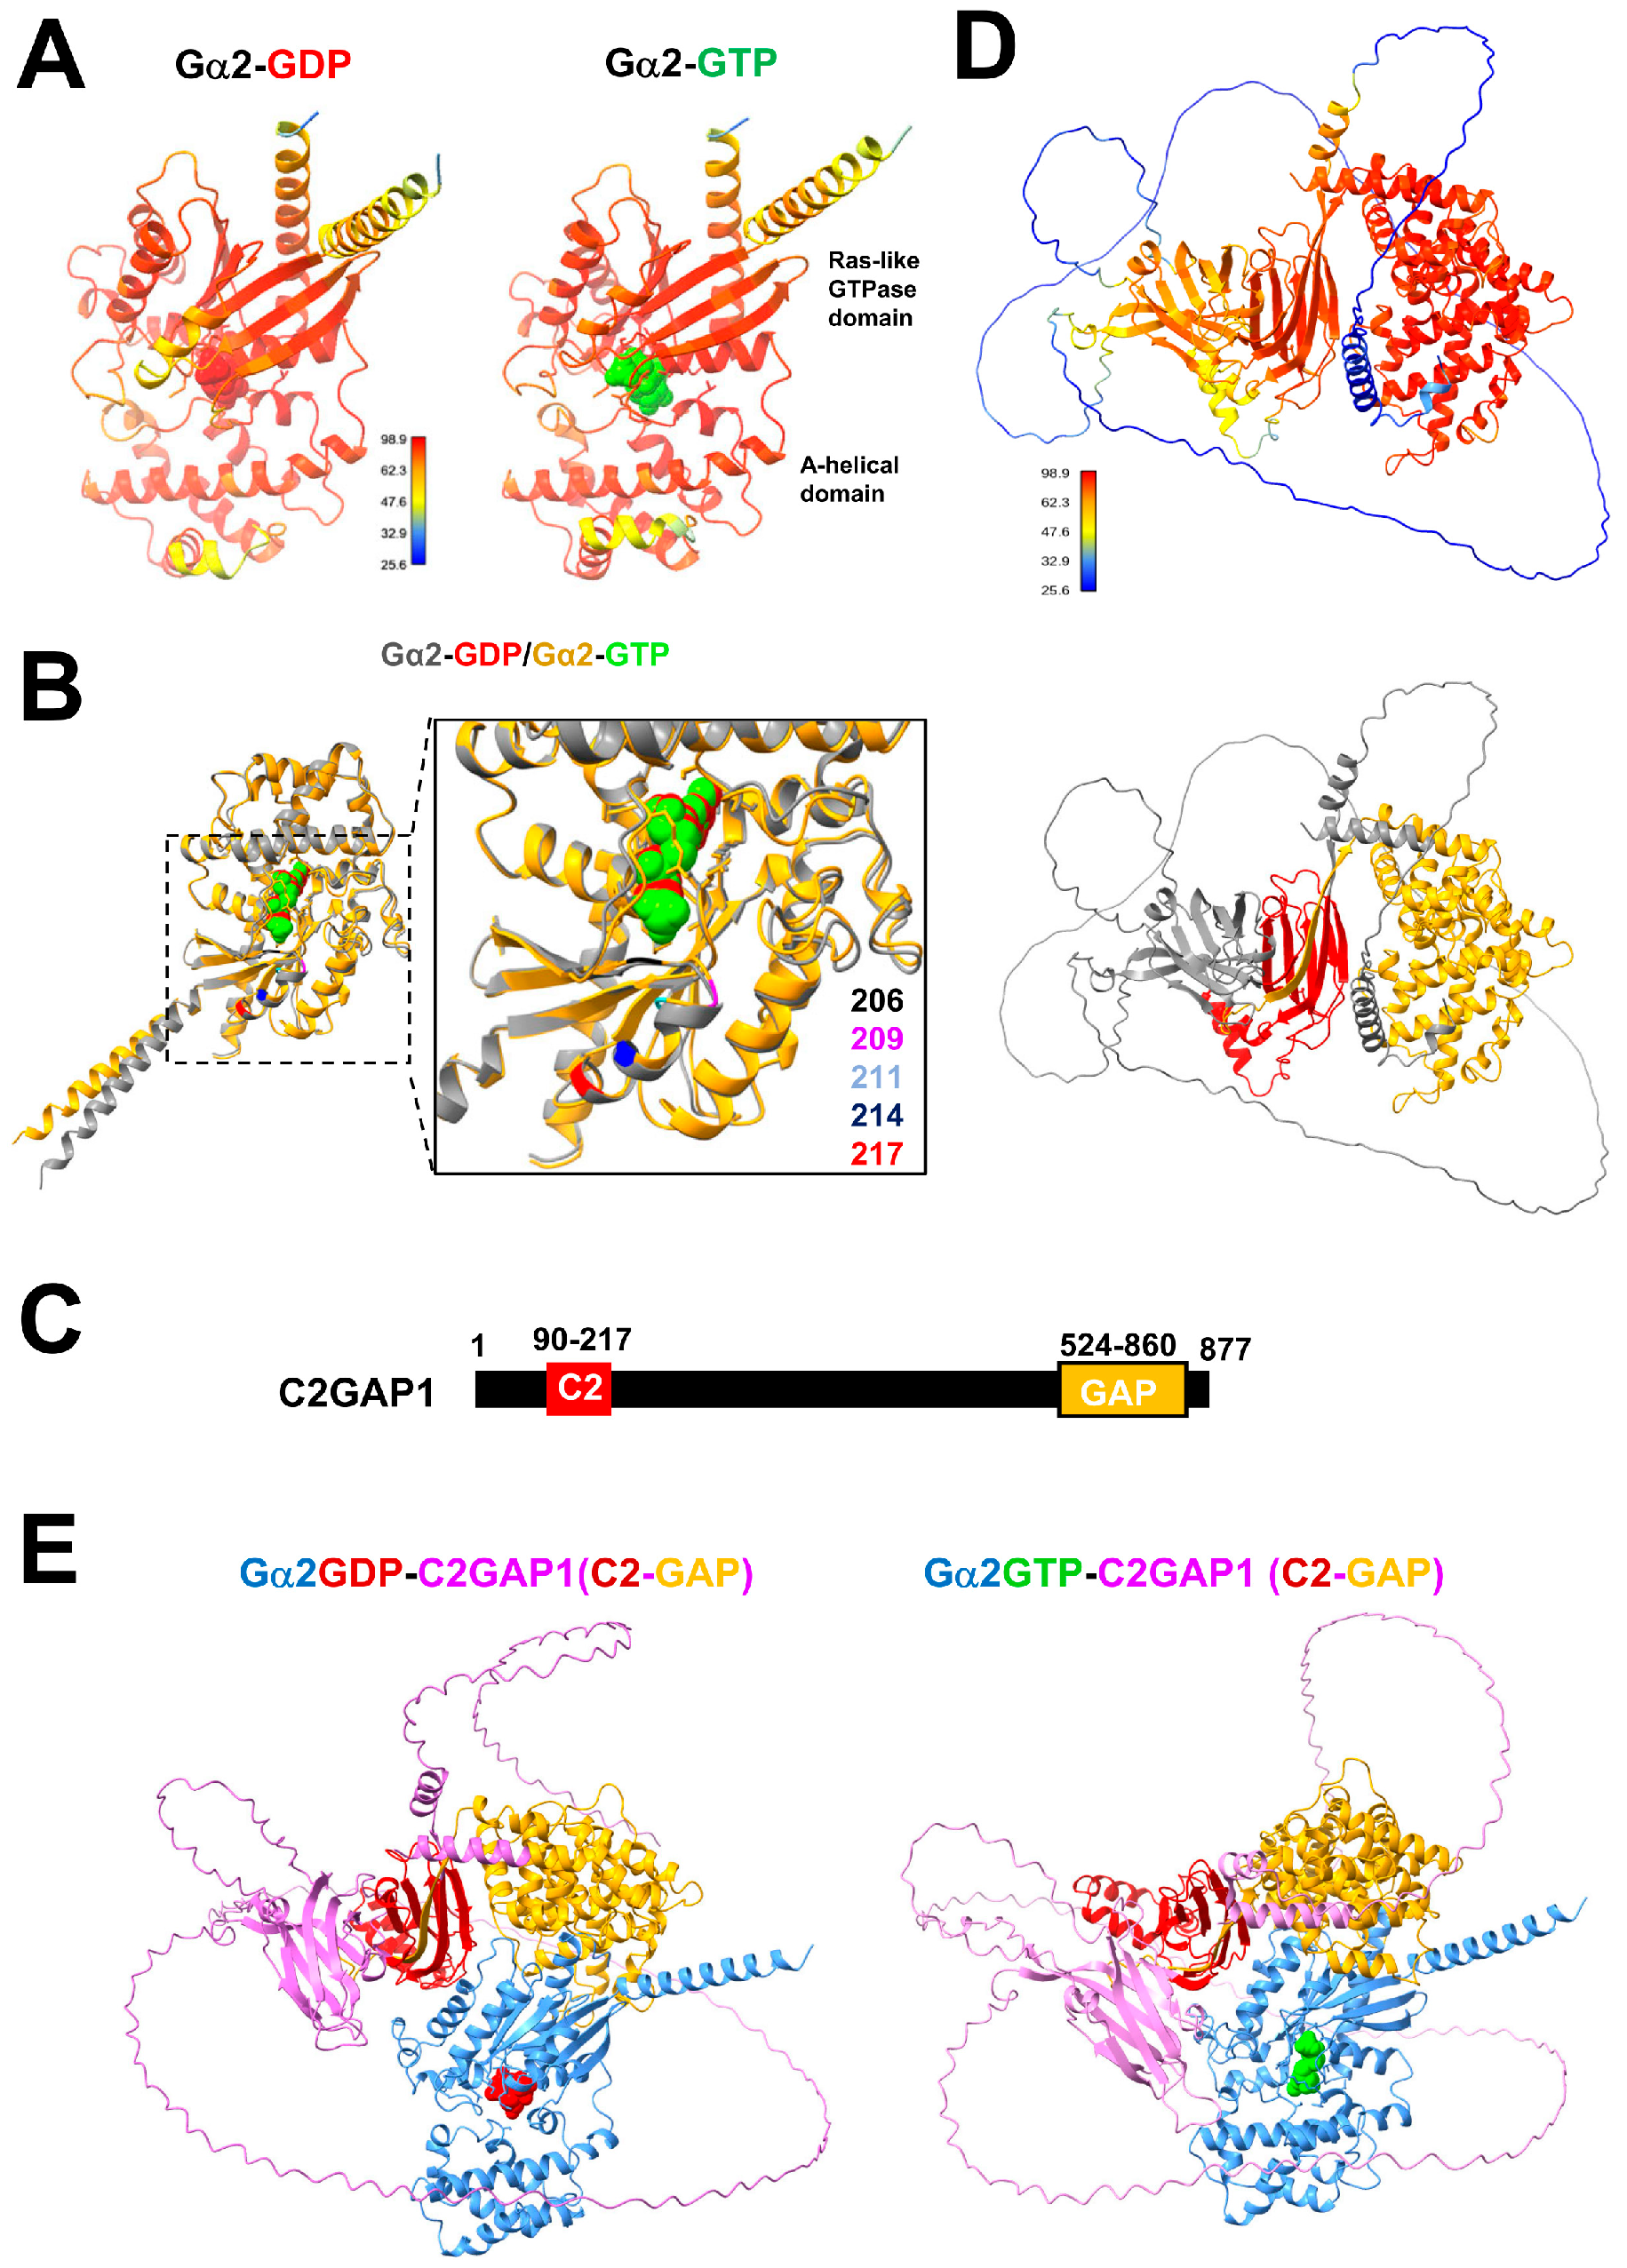
In resting cells, the majority of heteromeric G protein exists in the inactive GDP-bound form, Gα2(GDP)Gβγ. Saturating cAMP stimulation (10 μM cAMP; Figure 6B) induces maximal dissociation of the heterotrimer, leading to activation of Gα2-GTP and release of free Gβγ. Notably, Gα2–C2GAP1 association is detected both before and after cAMP stimulation, indicating that C2GAP1 can interact with Gα2 in either its inactive (GDP-bound) or active (GTP-bound) state. To gain mechanistic insight into this dynamic interaction, we modeled the structures and binding properties of Gα2 and C2GAP1 using AlphaFold 3 (Figure 7). We first predicted the structures of Gα2 in its GDP- and GTP-bound forms (Figure 7A). Gα2 adopts the canonical architecture composed of a Ras-like GTPase domain and an α-helical domain, separated by a deep cleft that accommodates GDP or GTP. The switch regions of Gα2 are similarly conserved (Figure 7B) [41]. These predicted structures show substantial overlap with mammalian Gαi2 (Figure S3A). We also modeled the Gβ and Gγ subunits: Gβ forms a seven-bladed β-propeller, with each blade consisting of four-stranded antiparallel β-sheets, whereas Gγ adopts a coiled-coil structure (Figure S3B), both closely resembling their mammalian counterparts (Figure S3C). The predicted heterotrimeric G protein complex (Gα2Gβγ) exhibits a conserved overall architecture relative to mammalian structures (Figure S3D) [42].
With these conserved structural features established for Dictyostelium heterotrimeric G proteins, we next predicted the structure of C2GAP1 (Figure 7C,D). The domain architecture for both the C2 and RasGAP domains was predicted with high confidence. We then modeled the complexes between C2GAP1 and Gα2 in either the GDP- or GTP-bound state (Figure 7E). We have previously shown that C2GAP1 binds multiple phospholipids on the plasma membrane through its C2 domain [31]. Surprisingly, both C2 and GAP domains interact with the Ras GTPase domain of Gα2 in both nucleotide states. Notably, an additional region of C2GAP1 located between the C2 and GAP domains provides extra contacts with the GTPase domain of Gα2 specifically in the GTP-bound state (Figure S4A). Binding free-energy calculations yielded predicted values of −9.8 kcal/mol for C2GAP1–Gα2-GDP and −11.2 kcal/mol for C2GAP1–Gα2-GTP, corresponding to inferred dissociation constants of ~6.8 × 10⁻⁸ M and ~6.3 × 10⁻⁹ M, respectively (Figure S4B). By nature of the simulations, these values should be interpreted qualitatively rather than quantitatively. Nevertheless, the results indicate an approximately one-order-of-magnitude stronger affinity of C2GAP1 for Gα2-GTP compared with Gα2-GDP. Together, these simulations support a model in which C2GAP1 associates with Gα2 in both its inactive and active states but preferentially binds activated Gα2-GTP. This enhanced interaction provides a molecular mechanism for the increased plasma membrane recruitment of C2GAP1 during cAMP gradient sensing.

3.9. c2gapA Cells Display Significantly Impaired Reorientation in Response to a Changing Gradient

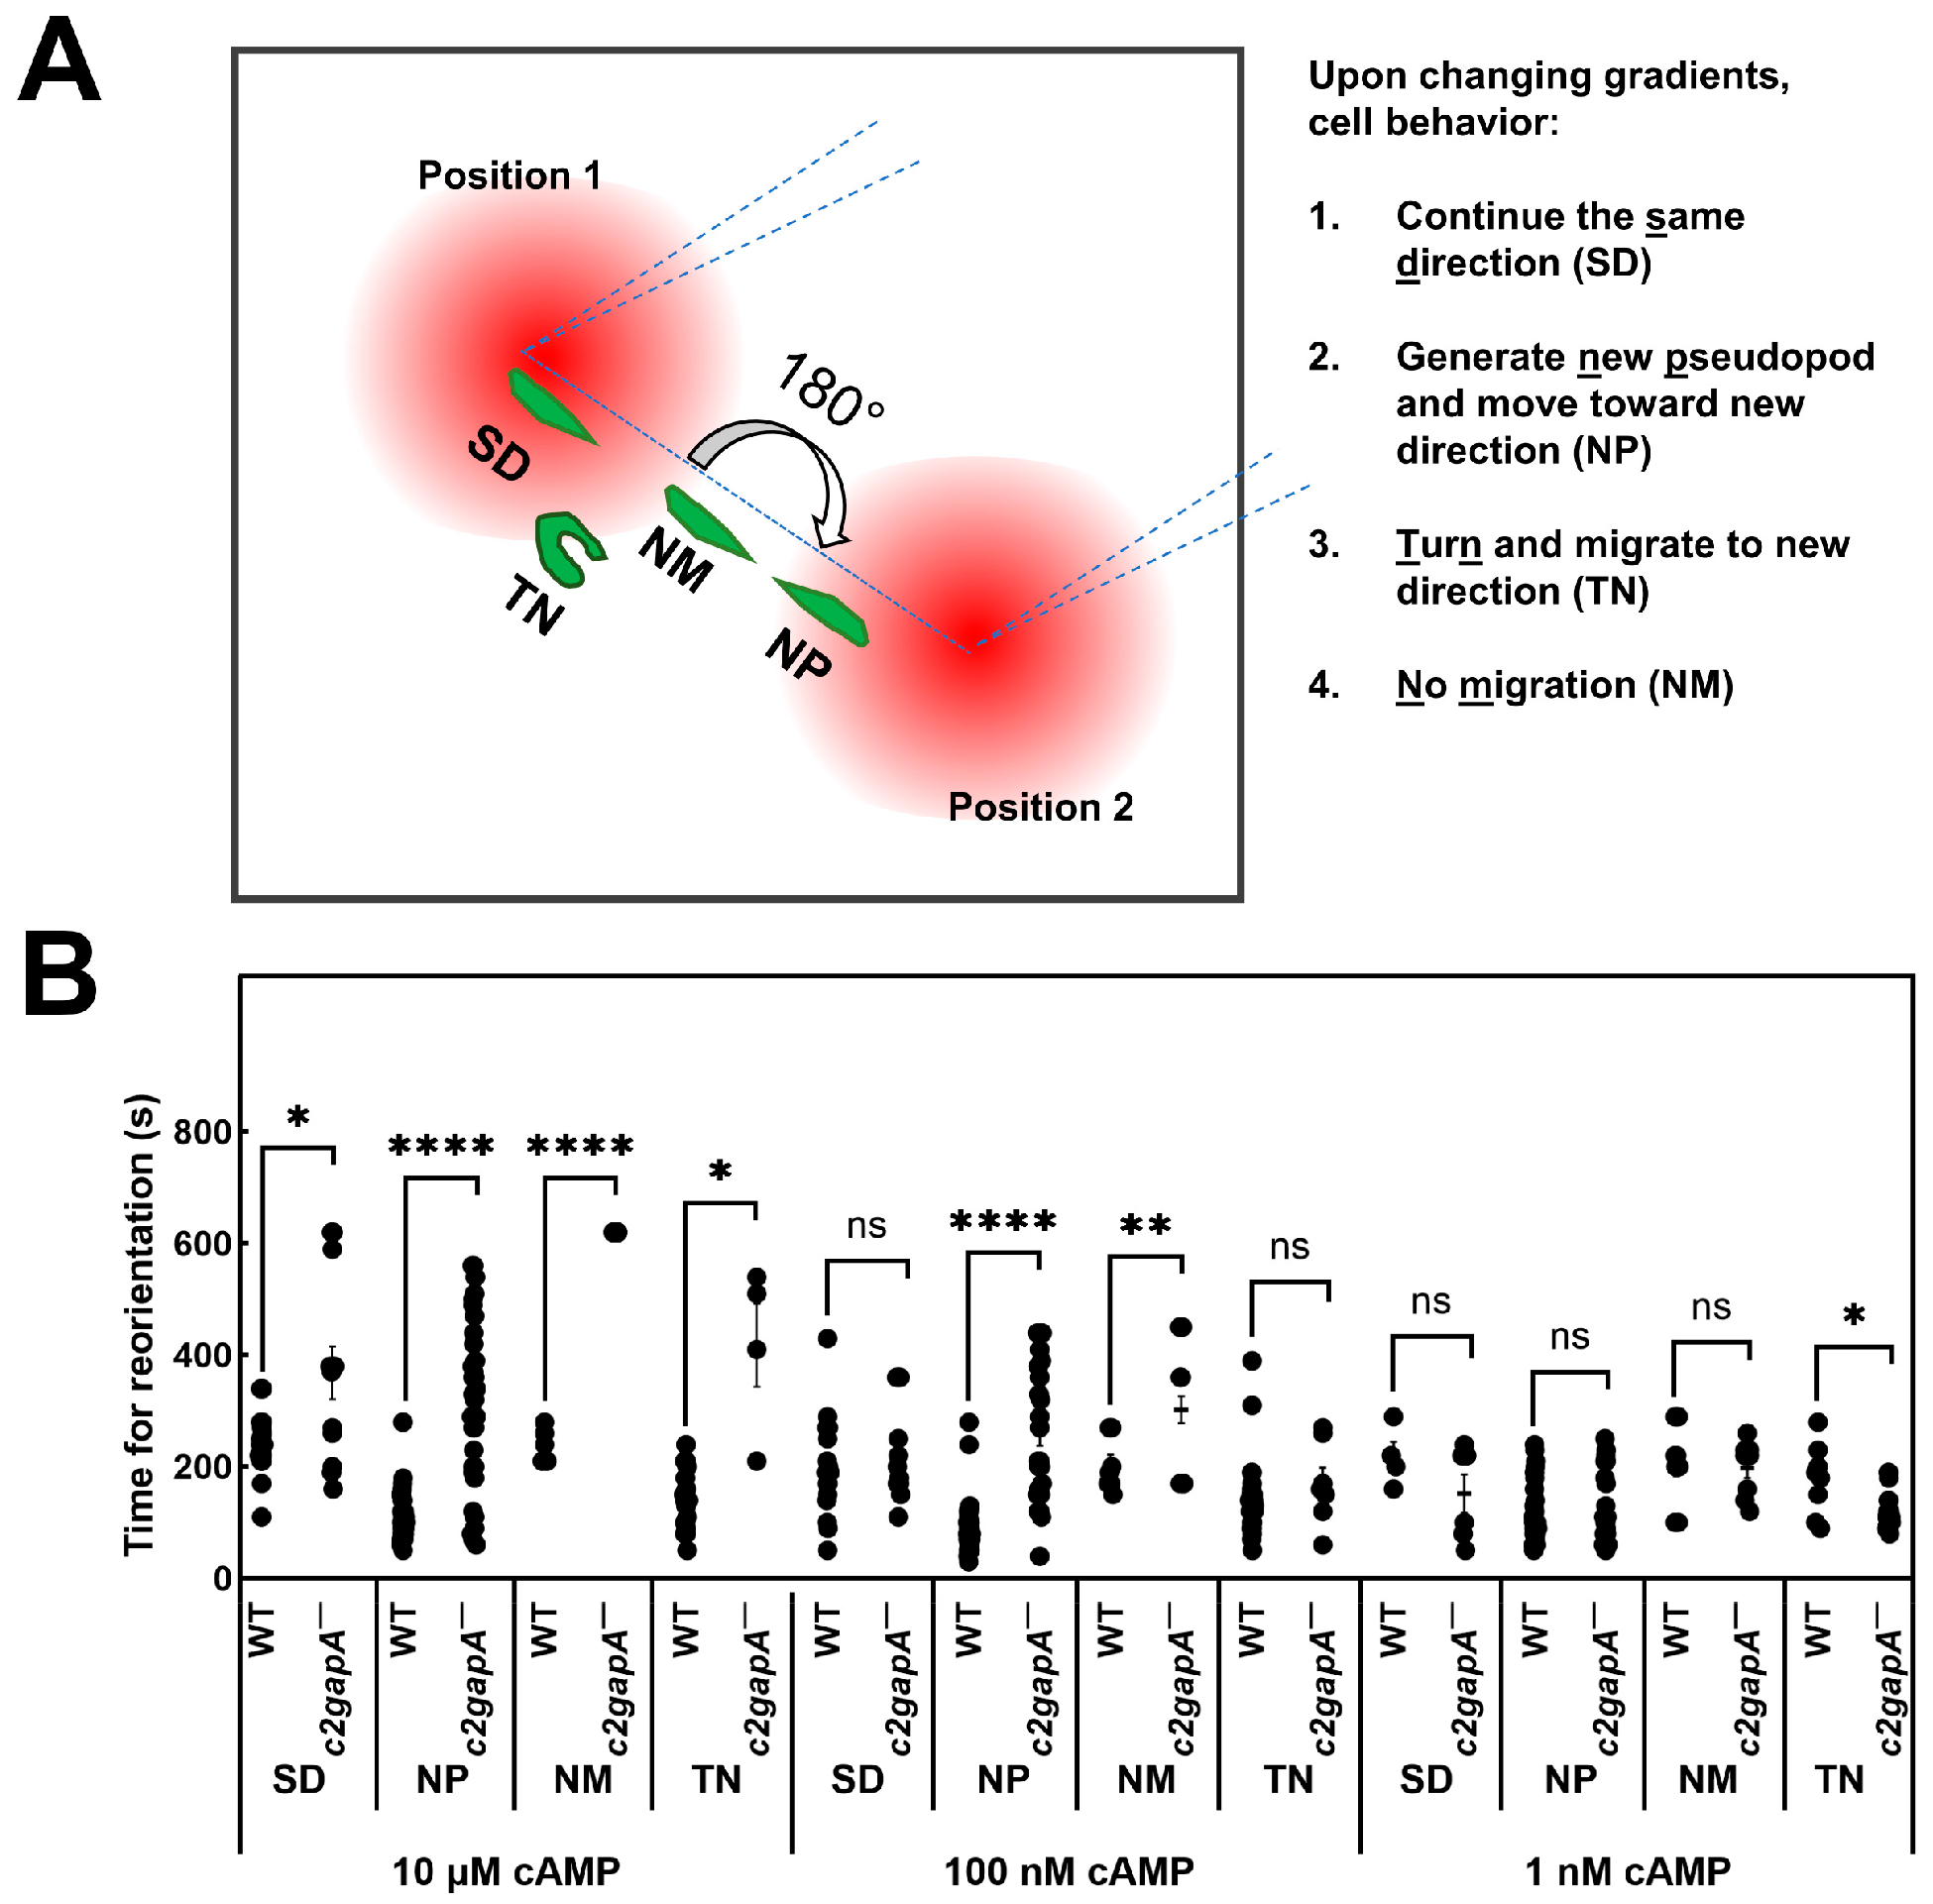
In the natural environment, chemoattractant gradients are often dynamic, and efficient reorientation is a key aspect of gradient sensing and subsequent chemotaxis. To investigate this, we designed an experiment to quantitatively measure the reorientation dynamics of both WT and c2gapA cells in response to a changing gradient. Cells were first allowed to chemotax in a steady gradient for several minutes, after which the gradient was reversed, as illustrated in Figure 8A (see Video S6 for complete sets of cell responses). We observed four distinct cell behaviors: (1) continuous movement in the same direction (SD); (2) formation of a new pseudopod at the original trailing edge and migration toward the new gradient direction (NP); (3) turning of 180° and migrating toward the new gradient direction (TN); and (4) no movement (NM). We then quantitatively measured the time required for each of these behaviors in response to gradient changes at three different cAMP concentrations (10 μM, 100 nM, and 1 nM; Figure 8B). In 10 μM and 100 nM gradients, c2gapA cells required significantly longer times to adjust to the new gradients compared with WT cells. This difference diminished at lower concentrations. At 1 nM, no significant difference was observed between WT and c2gapA cells for SD, NP, or NM behaviors; however, c2gapA cells displayed significantly faster turning and migration toward the new gradient direction. These results are consistent with previous reports showing that c2gapA cells exhibit concentration-dependent chemotaxis: impaired chemotaxis in high, saturating gradients, similar performance at medium concentrations, and enhanced chemotaxis at low or sub-sensitive concentrations [28,31]. In conclusion, our data indicates that C2GAP1 is critical for rapid reorientation, particularly in gradients at medium to high concentrations.

4. Discussion

Eukaryotic cells sense and migrate through chemoattractant gradients with an enormous concentration range, such as 10−5 to 10−9 M cAMP in D. discoideum and 10−5 to 10−9 M SDF1a or fMLP in neutrophils. To migrate effectively across such broad concentration ranges, cells employ adaptation mechanisms, by which they adapt to the current stimulus while maintaining sensitivity to stronger signals, enabling continuous movement up a gradient. Chemotaxis involves three conceptually distinct yet interconnected processes: gradient sensing, cell polarity, and cell migration. Among these, gradient sensing provides the foundation for directional migration. Although many components acting through the F-actin-based cytoskeleton have been shown to play pivotal roles in chemotaxis, the core elements of the gradient-sensing machinery and the molecular mechanisms underlying adaptation are not fully understood. In this study, we identify a Gα2–C2GAP1 interaction and demonstrate its essential role in mediating adaptation during gradient sensing and in promoting efficient orientation in dynamic gradients.
The essence of gradient sensing is the ability to detect an extracellular gradient and establish an intracellular polarized response. Latrunculin B-treated, cytoskeleton-free, immobile Dictyostelium cells retain the capacity to sense gradients and therefore provide a simplified system for specifically investigating gradient sensing [6]. Using these immobile cells, the spatiotemporal dynamics of GPCR cAR1-mediated sequential signaling events—including extracellular gradient strength, heterotrimeric G protein activation, Ras activation, and PIP3 production—have been monitored upon exposure to a steady gradient [27,33,36,38] (Figure S5). Upon gradient exposure, cells experience higher chemoattractant concentrations at the front than at the back, triggering rapid and sustained G protein activation that is stronger at the front [33,36]. This observation indicates that adaptation occurs downstream of G protein activation and that G protein activation reflects the local chemoattractant concentration.
Upon exposure to a steady gradient, cells establish intracellular polarity, manifested by a sharp accumulation of PIP3 at the front of the cell facing the chemoattractant source in a concentration-dependent manner. When exposed to relatively low cAMP gradients (<100 nM), cells exhibit a single-phase PIP3 production and accumulation at the front and lateral regions, with minimal accumulation at the rear. In contrast, exposure to high, saturating cAMP gradients (>1 μM) elicits a biphasic PIP3 response, consisting of an initial uniform PIP3 production around the entire cell periphery, followed by its reduction from the plasma membrane and a second phase of PIP3 accumulation at the front—representing a typical adaptation process followed by a polarized response. Nevertheless, the polarized PIP3 response during gradient sensing is concentration-independent and serves as a hallmark of gradient sensing. PTEN is a lipid phosphatase that converts PIP3 to PIP2 and regulates PIP3 polarization [12,13]. The spatiotemporal dynamics of PTEN membrane localization are opposite to those of PIP3 in a concentration-dependent manner [36]. Upon exposure to low cAMP gradients (<100 nM), cells exhibit a single-phase withdrawal of PTEN from the front and lateral regions, with minimal withdrawal at the rear. In contrast, exposure to high cAMP gradients (>1 μM) elicits a biphasic PTEN response, consisting of an initial uniform withdrawal of PTEN from the entire cell periphery, followed by its return from the cytoplasm to the plasma membrane and then a second withdrawal from the front—representing a typical adaptation process followed by polarized PTEN localization, consistent with PIP3 dynamics upon exposure to a steady gradient. The concentration-dependent dynamics indicate that low-concentration gradients induce a balanced response, manifested as continuous accumulation of PIP3 or persistent withdrawal of PTEN at the cell front, thereby establishing intracellular polarity. In contrast, high-concentration gradients trigger excessively strong activation that must first be attenuated through adaptation, after which a polarized intracellular PIP3 or PTEN response is established via signal amplification. Consistent with this model, c2gapA cells fail to exhibit adaptive PIP3 and PTEN responses when exposed to high-concentration gradients but show a normal single-phase response under low-concentration gradients (Figure 1 and Figure 2). These results indicate that C2GAP1 plays an essential role in terminating the initial response and enabling adaptation in cells exposed to high-concentration gradients. Interestingly, both low- and high-concentration gradients induce an initial plasma membrane (PM) translocation of C2GAP1, which gradually declines but remains persistently associated with the PM in a concentration-dependent manner (Figure 3). This residual PM-localized C2GAP1, together with the fraction that remains stably retained at later stages, collectively mediates the adaptive behavior during gradient sensing. Adaptation behaviors of ddnf1 and c2gapA cells indicate that multiple RasGAP proteins are involved in adaptation during gradient sensing. It is important to investigate the PIP3 and PTEN dynamics in ddnf1 cells.
Ras activation, an upstream activator of PI3K that drives PIP3 production, represents the earliest GPCR-mediated signaling step in gradient sensing that exhibits adaptation [27]. Importantly, accumulation of active Ras at the front of gradient-sensing cells depends on gradient concentration [27,28]. In line with this, we observed concentration-dependent plasma membrane (PM) accumulation of C2GAP1 following the initial PM translocation in cells upon exposure to steady gradients to restrain Ras activity in the front (Figure 3). Consistent with preferential C2GAP1 accumulation at the front relative to the back (Figure 3), we previously reported temporally stronger inhibition in the front of PIP3-polarized cells in gradients [38], indicating the existence of a local inhibition process during gradient sensing. Notably, this enhanced inhibition was observed only in cells experiencing strong, high-concentration gradients, but not low-concentration gradients (Figure 4). In contrast, c2gapA cells failed to exhibit this stronger inhibition in PIP3-polarized cells at any gradient concentration, demonstrating an essential role for C2GAP1 in establishing enhanced inhibition in the front during gradient sensing. In agreement with the above, c2gapA cells display excessive actin polymerization, subsequently broadening the leading edge during chemotaxis when experiencing a high-concentration gradient, demonstrating the necessity of C2GAP1 accumulation in the leading edge to tune down Ras signaling for proper polarization and efficient cell migration during chemotaxis [28]. Interestingly, membrane targeting of C2GAP1 does not closely correlate with the distribution of either active Ras or multiple phospholipids that bind to the C2 domain of C2GAP1 on the plasma membrane [28,31] (Figure 6B), suggesting the involvement of additional binding partners in C2GAP1 PM localization. In this study, we identify Gα2 as a plasma membrane binding partner of C2GAP1 in an F-actin-independent manner to build the local inhibition in gradient sensing cells (Figure 6A). Consistent with our report, it has recently been reported that Ras suppression potentiates rear actomyosin contractility-driven cell polarization and migration [43]. Simulations of binding affinity between C2GAP1 and Gα2 in either the GDP- or GTP-bound state suggest stronger interaction with activated Gα2, providing a mechanism by which Gα2 sustains C2GAP1 on the plasma membrane (Figure 7). Moreover, we detected enhanced G protein activation in c2gapA cells (Figure 6D), demonstrating the inhibitory role of the C2GAP1–Gα2 interaction in G protein activation upon stimulation. This suppressive role of the C2GAP1–Gα2 interaction in regulating G protein activation is essential for rapid reorientation in dynamically changing gradients (Figure 8), exemplifying an additional layer of G protein regulation during gradient sensing. Investigating G protein activation under these experimental conditions remains challenging, but it may ultimately provide a definitive answer.
Active Ras has served as the hallmark of basal sensitivity and activity of cells. In both Dictyostelium and mammalian neutrophils, multiple RasGAP proteins have been reported to play a role in basal activity and cell migration [28,31,34,40,43,44]. Plasma membrane and pseudopod localization of these RasGAPs in resting and migrating cells further verify the deactivating role of Ras to tune down basal Ras activity and cell migration. Both Dictyostelium and human neutrophils deficient of RasGAPs or with hyper Ras activity are more sensitive and display improved chemotaxis in gradients at low or subsensitive concentrations, while they exhibit impaired chemotaxis in gradients at high, saturating concentrations [28,31,40,45]. The above phenomenon indicates an upshifted chemoattractant concentration range for efficient chemotaxis in RasGAP-deficient or Ras-hyperactive cells [46]. In the present study, we found that C2GAP1 directly interacts with both GDP- or GTP-bound Gα2 (Figure 6). c2gapA cells display clear G protein activation to a subsensitive, 0.01 nM cAMP simulation, demonstrating the inhibitory function of C2GAP1 and Gα2, providing an upstream module to regulate cell sensitivity.

Supplementary Materials

The following supporting information can be downloaded at: https://www.mdpi.com/article/10.3390/cells15090819/s1, Figure S1: Dose-dependent PM targeting C2GAP1 in the cells; Figure S2: Dynamics of C2GAP1 in response to application, removal, and reapplication of identical steady gradients; Figure S3: Predicted structures of heterotrimeric G protein Gα2Gβγ; Figure S4: Interfaces of Gα2−C2GAP1 interaction; Figure S5: Distinct dynamics of GPCR cAR1-mediated signaling during gradient sensing in cytoskeleton-free, immobile cells; Video S1: PIP3 dynamics of gradient sensing in WT (top) or c2gapA (bottom) upon exposure to steady cAMP gradient generated from the source of 100 nM (left) or 10 μM (right) cAMP, respectively. Cells expressing PIP3 biosensor PHCrac-GFP (green) were treated with 5 μM latrunculin B 10 min prior to the experiment. To visualize cAMP gradient, cAMP was mixed with fluorescent dye Alexa 594 (red); Video S2: PTEN dynamics of gradient sensing in WT (top) or c2gapA (bottom) upon exposure to steady cAMP gradient generated from the source of 100 nM (left) or 10 μM (right) cAMP, respectively. Cells expressing PTEN-GFP (green) were treated with 5 μM latrunculin B for 10 min prior to the experiment. To visualize cAMP gradient, cAMP was mixed with fluorescent dye Alexa 594 (red); Video S3: C2GAP1-GFP dynamics of gradient sensing in c2gapA upon exposure to steady cAMP gradients generated from the source of either 10 μM (left) or 100 nM (right) cAMP, respectively. Cells expressing C2GAP1-YFP (green) were treated with 5 μM latrunculin B for 10 min prior to the experiment. To visualize cAMP gradient, cAMP was mixed with fluorescent dye Alexa 594 (red); Video S4: PIP3 dynamics of gradient sensing in WT (top) and c2gapA (bottom) cells upon exposure to withdrawal and reapplication of the same cAMP gradient generated from the source of either 10 μM (left) or 100 nM (right) cAMP, respectively. Cells expressing PIP3 biosensor, PHCrac-GFP (green) were treated with 5 μM lat. B 10 min prior to the experiment. To visualize cAMP gradient, cAMP was mixed with fluorescent dye Alexa 594 (red); Video S5: C2GAP1-GFP dynamics of gradient sensing in c2gapA cells upon exposure to withdrawal and reapplication of the same cAMP gradient generated from the source of 10 μM cAMP. Cells expressing C2GAP1-YFP (green) were treated with 5 μM latrunculin B for 10 min prior to the experiment. To visualize cAMP gradient, cAMP was mixed with fluorescent dye Alexa 594 (red); Video S6: Migration behavior of WT (left) and c2gapA (right) cells in the gradients generated from the source of either 10 μM (top), 100 nM (middle), or 1 nM (bottom) cAMP, respectively.

Author Contributions

Conceptualization: X.X.; Investigation: X.X., H.H. and R.D.K.; Data analysis: X.X., R.D.K., H.H. and R.D.S.; Writing—Original draft, X.X.; Review and Editing, X.X., H.H., R.D.K., R.D.S. and T.J.; Funding: T.J. All authors have read and agreed to the published version of the manuscript.

Funding

This research received no external funding solely supported by the Intramural Research Program of the National Institutes of Health (NIH). The contributions of the NIH authors are considered Works of the United States Government. The findings and conclusions presented in this paper are those of the authors and do not necessarily reflect the views of the NIH or the U.S. Department of Health and Human Services.

Institutional Review Board Statement

The manuscript has been approved by the National Institute of Allergy and Infectious diseases with clearance #: DIR-26-1091, date of approval: 17 February 2026.

Informed Consent Statement

Not applicable.

Data Availability Statement

The original contributions presented in this study are included in the article/Supplementary Material. Further inquiries can be directed to the corresponding author.

Acknowledgments

This research was supported by the Intramural Research Program of the National Institutes of Health (NIH). The contributions of the NIH authors are considered Works of the United States Government. The findings and conclusions presented in this paper are those of the authors and do not necessarily reflect the views of the NIH or the U.S. Department of Health and Human Services.

Conflicts of Interest

The authors declare that they have no conflicts of interest.

References

  1. Condeelis, J.; Singer, R.H.; Segall, J.E. The great escape: When cancer cells hijack the genes for chemotaxis and motility. Annu. Rev. Cell Dev. Biol. 2005, 21, 695–718. [Google Scholar] [CrossRef]
  2. Murphy, P.M. The molecular biology of leukocyte chemoattractant receptors. Annu. Rev. Immunol. 1994, 12, 593–633. [Google Scholar] [CrossRef]
  3. Parent, C.A.; Blacklock, B.J.; Froehlich, W.M.; Murphy, D.B.; Devreotes, P.N. G protein signaling events are activated at the leading edge of chemotactic cells. Cell 1998, 95, 81–91. [Google Scholar] [CrossRef]
  4. Jin, T.; Xu, X.; Hereld, D. Chemotaxis, chemokine receptors and human disease. Cytokine 2008, 44, 1–8. [Google Scholar] [CrossRef]
  5. Van Haastert, P.J.; Devreotes, P.N. Chemotaxis: Signalling the way forward. Nat. Rev. Mol. Cell Biol. 2004, 5, 626–634. [Google Scholar] [CrossRef] [PubMed]
  6. Parent, C.A.; Devreotes, P.N. A cell’s sense of direction. Science 1999, 284, 765–770. [Google Scholar] [CrossRef] [PubMed]
  7. Janetopoulos, C.; Jin, T.; Devreotes, P. Receptor-mediated activation of heterotrimeric G-proteins in living cells. Science 2001, 291, 2408–2411. [Google Scholar] [CrossRef]
  8. Jin, T.; Zhang, N.; Long, Y.; Parent, C.A.; Devreotes, P.N. Localization of the G protein betagamma complex in living cells during chemotaxis. Science 2000, 287, 1034–1036. [Google Scholar] [CrossRef] [PubMed]
  9. Xu, X.; Meckel, T.; Brzostowski, J.A.; Yan, J.; Meier-Schellersheim, M.; Jin, T. Coupling mechanism of a GPCR and a heterotrimeric G protein during chemoattractant gradient sensing in Dictyostelium. Sci. Signal. 2010, 3, ra71. [Google Scholar] [CrossRef]
  10. Cai, H.; Das, S.; Kamimura, Y.; Long, Y.; Parent, C.A.; Devreotes, P.N. Ras-mediated activation of the TORC2-PKB pathway is critical for chemotaxis. J. Cell Biol. 2010, 190, 233–245. [Google Scholar] [CrossRef]
  11. Charest, P.G.; Shen, Z.; Lakoduk, A.; Sasaki, A.T.; Briggs, S.P.; Firtel, R.A. A Ras signaling complex controls the RasC-TORC2 pathway and directed cell migration. Dev. Cell 2010, 18, 737–749. [Google Scholar] [CrossRef]
  12. Funamoto, S.; Meili, R.; Lee, S.; Parry, L.; Firtel, R.A. Spatial and temporal regulation of 3-phosphoinositides by PI 3-kinase and PTEN mediates chemotaxis. Cell 2002, 109, 611–623. [Google Scholar] [CrossRef]
  13. Iijima, M.; Devreotes, P. Tumor suppressor PTEN mediates sensing of chemoattractant gradients. Cell 2002, 109, 599–610. [Google Scholar] [CrossRef]
  14. Yan, J.; Mihaylov, V.; Xu, X.; Brzostowski, J.A.; Li, H.; Liu, L.; Veenstra, T.D.; Parent, C.A.; Jin, T. A Gβγ effector, ElmoE, transduces GPCR signaling to the actin network during chemotaxis. Dev. Cell 2012, 22, 92–103. [Google Scholar] [CrossRef] [PubMed]
  15. Hereld, D.; Vaughan, R.; Kim, J.Y.; Borleis, J.; Devreotes, P. Localization of ligand-induced phosphorylation sites to serine clusters in the C-terminal domain of the Dictyostelium cAMP receptor, cAR1. J. Biol. Chem. 1994, 269, 7036–7044. [Google Scholar] [CrossRef]
  16. Xiao, Z.; Yao, Y.; Long, Y.; Devreotes, P. Desensitization of G-protein-coupled Receptors: Agonist-Induced Phosphorylation of the Chemoattractant Receptorcar1 Lowers Its Intrinsic Affinity for cAMP. J. Biol. Chem. 1999, 274, 1440–1448. [Google Scholar] [CrossRef]
  17. Caterina, M.J.; Devreotes, P.N.; Borleis, J.; Hereld, D. Agonist-induced Loss of Ligand Binding Is Correlated with Phosphorylation of cAR1, a G Protein-coupled Chemoattractant Receptor from Dictyostelium. J. Biol. Chem. 1995, 270, 8667–8672. [Google Scholar] [CrossRef]
  18. Kamimura, Y.; Miyanaga, Y.; Ueda, M. Heterotrimeric G-protein shuttling via Gip1 extends the dynamic range of eukaryotic chemotaxis. Proc. Natl. Acad. Sci. USA 2016, 113, 4356–4361. [Google Scholar] [CrossRef]
  19. Kataria, R.; Xu, X.; Fusetti, F.; Keizer-Gunnink, I.; Jin, T.; van Haastert, P.J.; Kortholt, A. Dictyostelium Ric8 is a nonreceptor guanine exchange factor for heterotrimeric G proteins and is important for development and chemotaxis. Proc. Natl. Acad. Sci. USA 2013, 110, 6424–6429. [Google Scholar] [CrossRef] [PubMed]
  20. Janssens, P.M.; Van Haastert, P.J. Molecular basis of transmembrane signal transduction in Dictyostelium discoideum. Microbiol. Rev. 1987, 51, 396–418. [Google Scholar] [CrossRef] [PubMed]
  21. Dinauer, M.C.; Steck, T.L.; Devreotes, P.N. Cyclic 3′,5′-AMP relay in Dictyostelium discoideum IV. Recovery of the cAMP signaling response after adaptation to cAMP. J. Cell Biol. 1980, 86, 545–553. [Google Scholar]
  22. Van Haastert, P.J. Differential effects of temperature on cAMP-induced excitation, adaptation, and deadaptation of adenylate and guanylate cyclase in Dictyostelium discoideum. J. Cell Biol. 1987, 105, 2301–2306. [Google Scholar] [CrossRef]
  23. Van Haastert, P.J. Down-regulation of cell surface cyclic AMP receptors and desensitization of cyclic AMP-stimulated adenylate cyclase by cyclic AMP in Dictyostelium discoideum. Kinetics and concentration dependence. J. Biol. Chem. 1987, 262, 7700–7704. [Google Scholar] [CrossRef]
  24. Klein, P.S.; Sun, T.J.; Saxe, C.L., 3rd; Kimmel, A.R.; Johnson, R.L.; Devreotes, P.N. A chemoattractant receptor controls development in Dictyostelium discoideum. Science 1988, 241, 1467–1472. [Google Scholar] [CrossRef]
  25. Insall, R.H.; Borleis, J.; Devreotes, P.N. The aimless RasGEF is required for processing of chemotactic signals through G-protein-coupled receptors in Dictyostelium. Curr. Biol. 1996, 6, 719–729. [Google Scholar] [CrossRef] [PubMed]
  26. Sasaki, A.T.; Chun, C.; Takeda, K.; Firtel, R.A. Localized Ras signaling at the leading edge regulates PI3K, cell polarity, and directional cell movement. J. Cell Biol. 2004, 167, 505–518. [Google Scholar] [CrossRef] [PubMed]
  27. Kortholt, A.; Keizer-Gunnink, I.; Kataria, R.; Van Haastert, P.J.M. Ras activation and symmetry breaking during Dictyostelium chemotaxis. J. Cell Sci. 2013, 126, 4502–4513. [Google Scholar] [CrossRef] [PubMed]
  28. Xu, X.; Wen, X.; Veltman, D.M.; Keizer-Gunnink, I.; Pots, H.; Kortholt, A.; Jin, T. GPCR-controlled membrane recruitment of negative regulator C2GAP1 locally inhibits Ras signaling for adaptation and long-range chemotaxis. Proc. Natl. Acad. Sci. USA 2017, 114, E10092–E10101. [Google Scholar] [CrossRef]
  29. Xu, X.; Quan, W.; Zhang, F.; Jin, T. A systems approach to investigate GPCR-mediated Ras signaling network in chemoattractant sensing. Mol. Biol. Cell 2022, 33, ar23. [Google Scholar] [CrossRef]
  30. Zhang, S.; Charest, P.G.; Firtel, R.A. Spatiotemporal regulation of Ras activity provides directional sensing. Curr. Biol. 2008, 18, 1587–1593. [Google Scholar] [CrossRef]
  31. Xu, X.; Bhimani, S.; Pots, H.; Wen, X.; Jeon, T.J.; Kortholt, A.; Jin, T. Membrane Targeting of C2GAP1 Enables Dictyostelium discoideum to Sense Chemoattractant Gradient at a Higher Concentration Range. Front. Cell Dev. Biol. 2021, 9, 725073. [Google Scholar] [CrossRef]
  32. Hoeller, O.; Gong, D.; Weiner, O.D. How to understand and outwit adaptation. Dev. Cell 2014, 28, 607–616. [Google Scholar] [CrossRef]
  33. Xu, X.; Meier-Schellersheim, M.; Jiao, X.; Nelson, L.E.; Jin, T. Quantitative imaging of single live cells reveals spatiotemporal dynamics of multistep signaling events of chemoattractant gradient sensing in Dictyostelium. Mol. Biol. Cell 2005, 16, 676–688. [Google Scholar] [CrossRef] [PubMed]
  34. Xu, X.; Pots, H.; Gilsbach, B.K.; Parsons, D.; Veltman, D.M.; Ramachandra, S.G.; Li, H.; Kortholt, A.; Jin, T. C2GAP2 is a common regulator of Ras signaling for chemotaxis, phagocytosis, and macropinocytosis. Front. Immunol. 2022, 13, 1075386. [Google Scholar] [CrossRef]
  35. Xue, L.C.; Rodrigues, J.P.; Kastritis, P.L.; Bonvin, A.M.; Vangone, A. PRODIGY: A web server for predicting the binding affinity of protein–protein complexes. Bioinformatics 2016, 32, 3676–3678. [Google Scholar] [CrossRef] [PubMed]
  36. Meier-Schellersheim, M.; Xu, X.; Angermann, B.; Kunkel, E.J.; Jin, T.; Germain, R.N. Key role of local regulation in chemosensing revealed by a new molecular interaction-based modeling method. PLoS Comput. Biol. 2006, 2, e82. [Google Scholar] [CrossRef]
  37. Xu, X.; Brzostowski, J.A.; Jin, T. Using quantitative fluorescence microscopy and FRET imaging to measure spatiotemporal signaling events in single living cells. Methods Mol. Biol. 2006, 346, 281–296. [Google Scholar]
  38. Xu, X.; Meier-Schellersheim, M.; Yan, J.; Jin, T. Locally controlled inhibitory mechanisms are involved in eukaryotic GPCR-mediated chemosensing. J. Cell Biol. 2007, 178, 141–153. [Google Scholar] [CrossRef]
  39. Xu, X.; Yun, M.; Wen, X.; Brzostowski, J.; Quan, W.; Wang, Q.J.; Jin, T. Quantitative Monitoring Spatiotemporal Activation of Ras and PKD1 Using Confocal Fluorescent Microscopy. Methods Mol. Biol. 2016, 1407, 307–323. [Google Scholar]
  40. Xu, X.; Kim, W.S.; Lee, A.; Jin, T. PLCγ2 controls neutrophil-like cell sensitivity through calcium oscillation and gates chemoattractant concentration range for chemotaxis. Front. Immunol. 2025, 16, 1633390. [Google Scholar] [CrossRef] [PubMed]
  41. Van Eps, N.; Oldham, W.M.; Hamm, H.E.; Hubbell, W.L. Structural and dynamical changes in an α-subunit of a heterotrimeric G protein along the activation pathway. Proc. Natl. Acad. Sci. USA 2006, 103, 16194–16199. [Google Scholar] [CrossRef]
  42. Lambright, D.G.; Sondek, J.; Bohm, A.; Skiba, N.P.; Hamm, H.E.; Sigler, P.B. The 2.0 Å crystal structure of a heterotrimeric G protein. Nature 1996, 379, 311–319. [Google Scholar] [CrossRef] [PubMed]
  43. Lin, Y.; Pal, D.S.; Banerjee, P.; Banerjee, T.; Qin, G.; Deng, Y.; Borleis, J.; Iglesias, P.A.; Devreotes, P.N. Ras suppression potentiates rear actomyosin contractility-driven cell polarization and migration. Nat. Cell Biol. 2024, 26, 1062–1076. [Google Scholar] [CrossRef] [PubMed]
  44. Bloomfield, G.; Traynor, D.; Sander, S.P.; Veltman, D.M.; Pachebat, J.A.; Kay, R.R. Neurofibromin controls macropinocytosis and phagocytosis in Dictyostelium. eLife 2015, 4, e04940. [Google Scholar] [CrossRef][Green Version]
  45. Xu, X.; Wen, X.; Moosa, A.; Bhimani, S.; Jin, T. Ras inhibitor CAPRI enables neutrophil-like cells to chemotax through a higher-concentration range of gradients. Proc. Natl. Acad. Sci. USA 2021, 118, e2002162118. [Google Scholar] [CrossRef] [PubMed]
  46. Xu, X.; Jin, T. Ras inhibitors gate chemoattractant concentration range for chemotaxis through controlling GPCR-mediated adaptation and cell sensitivity. Front. Immunol. 2022, 13, 1020117. [Google Scholar] [CrossRef]
Figure 1. c2gapA cells fail to display a concentration-dependent adaptive PIP3 dynamics of gradient sensing upon exposure to a steady gradient. (A). The montage shows PIP3 dynamics in wild-type (WT) and c2gapA cells upon exposure to steady cAMP gradients generated from the sources of either 10 μM or 100 nM, respectively. Cells expressed PIP3 biosensor, PHCrac-GFP (green), were treated with 5 μM Latrunculin B for 10 min prior to the experiments. To visualize cAMP gradients, cAMP at the indicated concentrations was mixed with Alexa594 (red). See Video S1 for the complete set of cell responses. Scale bar = 5 μm. PHCrac-GFP translocation (PIP3 production) pointed out by arrows. (B). Normalized PIP3 production in the front and back of the cells exposed to steady gradients is shown. The PIP3 intensity in the front and region at time 0 s was normalized to 1. Mean ± SD is shown. N = 5 and 5 in WT and c2gapA cells, respectively, at the indicated concentrations.
Cells 15 00819 g001
Figure 2. c2gapA cells show altered PTEN dynamics upon exposure to a steady gradient. (A) The montage shows PTEN dynamics in WT and c2gapA cells upon exposure to steady cAMP gradients at the indicated concentrations. Cells expressed PTEN-GFP (green) were treated with 5 μM Latrunculin B for 10 min prior to the experiments. To visualize cAMP gradients, cAMP at the indicated concentrations was mixed with Alexa594 (red). Scale bar = 5 μm. PTEN-GFP withdrawal from the plasma membrane pointed out by arrows. See Video S2 for complete sets of cell responses. (B) Normalized intensity of PTEN-GFP in the front and back of the cells upon exposure to steady gradients is shown. The PTEN intensity in the front and region at time 0 was normalized to 1. Mean ± SD is shown. N = 5 and 5 in WT and c2gapA cells, respectively, at both indicated concentrations.
Cells 15 00819 g002
Figure 3. F-actin-independent, cAMP concentration-dependent PM targeting C2GAP1 during gradient sensing. (A) F-actin-independent, cAMP concentration-dependent plasma membrane translocation dynamics of C2GAP1 upon cAMP stimulation. C2GAP1-YFP expressing c2gapA cells were treated with 5 μM Latrunculin B 10 min prior to the experiment and stimulated with cAMP at the indicated concentration at 0 s. Plasma membrane fractions were collected at the indicated time points and subjected to Western blot analysis to detect C2GAP1-YFP using anti-GFP antibodies. (B) Normalized plasma membrane (PM) translocation of C2GAP1 upon cAMP stimulation from (A) and two additional independent experiments (Figure S1). C2GAP1 membrane localization at 0 s was normalized to 1. (C) Montage shows C2GAP1-GFP dynamics in WT cells upon exposure to steady cAMP gradients at the indicated concentrations. Cells expressed C2GAP1-GFP (green) were treated with 5 μM Latrunculin B for 10 min prior to the experiments. To visualize cAMP gradients, cAMP at the indicated concentrations was mixed with Alexa594 (red). See Video S3 for complete sets of cell responses. (D) Normalized PM translocation of C2GAP1-GFP upon exposure to steady gradients is shown. The cytosolic intensity of C2GAP1 at time 0 s was normalized to 1. Mean ± SD is shown. N = 5 and 5 in WT cells exposed to cAMP gradients at either 10 μM or 100 nM, respectively.
Cells 15 00819 g003
Figure 4. PIP3-polarized c2gapA cells fail to display a concentration-dependent, higher inhibition in the front of gradient-sensing WT cells. (A) Scheme shows an inverse response of PIP3-polarized gradient-sensing cells upon removal and reapplication of the same gradient, whereby cells effectively experienced a higher stimulus at the front relative to the rear. (B) The montages show PIP3 dynamics in PIP3-polarized WT and c2gapA cells upon removal of the original gradient and then re-exposure to a second, identical gradient at the indicated concentrations. Cells expressing PIP3 probe, PHCrac-GFP (green), were treated with 5 μM Latrunculin B for 10 min prior to the experiments. To visualize cAMP gradient, cAMP at the indicated concentrations was mixed with Alexa594 (Red). Gradient sensing capability was indicated by the accumulation of PHCrac-GFP in the front of the cells facing the source of a cAMP gradient as arrow shown. See Video S4 for complete sets of cell responses. (C) Normalized intensity of PIP3 and cAMP concentrations the front and back of c2gapA cells upon removal and re-exposure to identical gradients. cAMP concentrations and PIP3 intensity at the time of complete withdrawal from plasma membrane upon the removal of the initial gradient was normalized to 1. Mean ± SD is shown. N = 5 and 9 in the gradients of either 10 μM or 100 nM cAMP, respectively.
Cells 15 00819 g004
Figure 5. C2GAP1 dynamics in response to removal and second application of cAMP gradient. (A) The montages show C2GAP1-YFP (green) dynamics in PIP3-polarized WT and c2gapA cells upon removal of the original gradient and then re-exposure to a second, identical gradient at the indicated concentrations. Cells expressing C2GAP1-YFP (green), were treated with 5 μM Latrunculin B for 10 min prior to the experiments. To visualize cAMP gradient, 10 μM cAMP was mixed with Alexa594 (red). See Video S5 for complete set of cell responses, including exposure to the initial gradient and then removal and reapplication of a second identical gradient. Time 0 s was set at the time last scan before the removal of the existing, original gradient and reapplication of the gradient at time 51s. (B) Normalized intensity of PM-bound C2GAP1 and cAMP concentrations in the front and back of c2gapA cells upon removal and re-exposure to identical gradients. cAMP concentrations and PM-bound C2GAP1 intensity at the time of complete withdrawal from plasma membrane upon the removal of the initial gradient was normalized to 1. Mean ± SD is shown. N = 5.
Cells 15 00819 g005
Figure 6. C2GAP1 interacts with Gα2 and decreases the activation of heterotrimeric G protein upon cAMP stimulation. (A) Interaction of C2GAP1 and Gα2 under various conditions determined by co-immunoprecipitation (co-IP). cAMP-chemotactic competent cells with endogenous level Gα2 and the expression of either YFP (a negative control) or C2GAP1-YFP treated with either 10 μM cAMP, 1 mM GTPγS, and/or 5 μM latrunculin B (Lat. B) were lysed and incubated with anti-GFP conjugated agarose beads and subjected to co-IP experiment and western-blotting detection of the indicated molecules. (B) Dynamic interaction between C2GAP1 and Gα2/Ras upon cAMP stimulation determined by co-immunoprecipitation (co-IP). cAMP-chemotactic competent cells with endogenous level Gα2 and the expression of C2GAP1-YFP were stimulated with cAMP at a final concentration of 10 μM. Aliquots of cells at the indicated time points were subject to co-IP experiment and western-blotting detection of the indicated molecules. C2GAP1-Ras interaction was used to as a positive control. (C) Schematic illustration of heterotrimeric G protein activation upon cAMP stimulation, measured as a loss of FRET between Gα2-CFP and Gβ-YFP. G protein activation leads to dissociation of Gα2 from Gβγ, resulting in reduced FRET efficiency. (D) Time course of FRET efficiency changes in WT and c2gapA cells following uniform cAMP stimulation. FRET efficiency was quantified using sensitized emission-based FRET analysis.
Cells 15 00819 g006
Figure 7. Simulation of the interaction between Gα2 and C2GAP1. (A) Predicted structures of the heterotrimeric Gα2 subunit in complex with GDP (red spheres) or GTP (green spheres). Gα2 is composed of a Ras-like GTPase domain and an α-helical domain, separated by a deep cleft that accommodates GDP or GTP. (B) Alignment of Gα2-GDP (gray) and Gα2-GTP (gold). The enlarged area highlights key residues in the switch region, with residue numbers displayed in matching colors. (C) Domain architecture of C2GAP1, comprising a C2 domain and a GAP domain. (D) Predicted structures of C2GAP1, with the prediction confidence scale shown in the upper panel and domain composition in the lower panel; the C2 domain is shown in red and the GAP domain in gold. (E) Predicted Gα2–C2GAP1 complexes, showing Gα2 (blue) in GDP-bound (red) or GTP-bound (green) states and the C2 (red) and GAP (gold) domains of C2GAP1 (magenta).
Cells 15 00819 g007
Figure 8. c2gapA cell displays significant impaired reorientation in response to a changing gradient. (A) Schematic of the changing-direction experiment used to assess responses of WT and c2gapA cells (see Video S6 for complete cell responses). Four distinct behaviors were observed: (1) continuous migration in the same direction (SD); (2) formation of a new pseudopod at the original trailing edge followed by migration toward the new gradient direction (NP); (3) turning of 180° and migrating toward the new gradient direction (TN); and (4) no movement (NM). (B) Time (s) required for reorientation in WT and c2gapA cells upon the changing direction of the gradient. Sixty cells in each group from multiple-independent experiments were analyzed. Student t test was used to calculate the significance of difference, p > 0.05, ns (not significant); p < 0.05, *; p < 0.01, **; p < 0.0001, ****.
Cells 15 00819 g008
Disclaimer/Publisher’s Note: The statements, opinions and data contained in all publications are solely those of the individual author(s) and contributor(s) and not of MDPI and/or the editor(s). MDPI and/or the editor(s) disclaim responsibility for any injury to people or property resulting from any ideas, methods, instructions or products referred to in the content.