Article

Screening of Key Pathways and Key Genes for the Differential Regulation of Subcutaneous and Intramuscular Fat Deposition by FTO in Chickens

Institute of Poultry Science, Yangzhou 225125, China
*
Author to whom correspondence should be addressed.
These authors contributed equally to this work.
Cells 2026, 15(10), 903; https://doi.org/10.3390/cells15100903
Submission received: 17 April 2026 / Revised: 9 May 2026 / Accepted: 11 May 2026 / Published: 14 May 2026

Abstract

The fat mass and obesity-associated gene (FTO) has been shown to play a critical role in fat deposition in both humans and livestock. However, its involvement in subcutaneous and intramuscular fat deposition in chickens remains underexplored. In this study, we investigated the regulatory effects and pathways of FTO on subcutaneous and intramuscular fat deposition in chickens through functional gene verification and bioinformatics analysis. Our results demonstrated that, compared to the control group, exogenous transfection of an FTO lentiviral overexpression vector significantly inhibited cell proliferation and increased lipid accumulation in both subcutaneous and intramuscular adipocytes (p < 0.05). Furthermore, transfection of FTO siRNA markedly increased cell proliferation and reduced lipid accumulation in both subcutaneous and intramuscular adipocytes. A total of 413 and 164 differentially expressed genes were regulated by FTO in subcutaneous and intramuscular adipocytes, respectively. Pathway analysis revealed that the regulation of the actin cytoskeleton was a key process involved in FTO-mediated fat deposition in both subcutaneous and intramuscular adipocytes. Additionally, NRAS and ITGAV (subcutaneous fat), as well as FGF9, PIK3R2, FGF16, and RHOA (intramuscular fat), were identified as key genes enriched in this pathway. In conclusion, FTO differentially regulates fat deposition in chicken subcutaneous and intramuscular adipocytes by targeting distinct functional genes within the actin cytoskeleton pathway.

1. Introduction

In the poultry industry, fat traits have long been a major research focus due to their strong association with key factors such as feed conversion ratio, meat type, and meat quality, particularly flavor. In chickens, body fat primarily comprises subcutaneous fat, abdominal fat, and intramuscular fat. Intramuscular fat, which is located within muscle fibers and between muscle bundles, plays a vital role in muscle composition. As an energy reserve, it has a significant impact on meat quality characteristics, including tenderness, flavor, and juiciness. Research has demonstrated that adequate subcutaneous fat deposition helps retain moisture in meat, thereby preserving its softness and tenderness during cooking. Furthermore, increased fat content contributes to enhanced juiciness and a richer flavor profile [1]. Therefore, identifying genes that are strongly associated with subcutaneous and intramuscular fat deposition will provide a theoretical foundation for molecular breeding strategies targeting these complex traits, as well as offering valuable insights into the molecular mechanisms governing the deposition of these two types of fat.
The fat mass and obesity-associated gene (FTO) was the first gene identified as being strongly associated with human obesity through genome-wide association studies (GWAS). Recent studies across various species have demonstrated that FTO plays a pivotal role in fat deposition by regulating RNA methylation, adipocyte differentiation, and energy metabolism pathways. Additionally, FTO is critical in fatty acid transport [2]. Studies have shown that human preadipocytes carrying the FTO allele (rs1421085 CC) exhibit significantly reduced UCP1 expression and mitochondrial respiration during differentiation into beige adipocytes [3,4]. In human studies, FTO overexpression promotes adipogenesis and lipid storage, inhibits lipolysis through the SREBP1c pathway, and accelerates excessive lipid accumulation in the liver [5]. In mice, FTO overexpression increases appetite and contributes to obesity [6,7], while FTO knockout suppresses fat deposition in the liver [8]. In pigs, FTO knockdown significantly increases the m6A methylation level of total RNA, reducing lipid accumulation in both porcine adipocytes and 3T3-L1 preadipocytes [9]. In goats, FTO affects mitochondrial content and lipid metabolism by regulating N6-methyladenosine (m6A) modification [10]. In cattle, FTO mutations are significantly associated with lean meat percentage [11]. Collectively, these findings indicate that FTO is strongly associated with obesity in humans and fat deposition in mammals.
In poultry, our previous study demonstrated that FTO promotes chicken myoblast differentiation through focal adhesion-mediated signaling pathways [12]. Myocytes and adipocytes maintain a dynamic balance in tissue development through competition and mutual regulation. Building on this, we hypothesized that FTO may also play a role in regulating intramuscular fat deposition in chickens. In this study, we constructed an FTO lentiviral overexpression vector and integrated functional gene verification with bioinformatics analysis to identify the key genes and signaling pathways through which FTO regulates lipid deposition in both subcutaneous and intramuscular adipocytes. Our findings aim to provide a theoretical foundation for further elucidating the molecular mechanisms underlying fat deposition in different tissues of chickens.

2. Materials and Methods

All animal experimental procedures were performed in accordance with the guidelines for the care and use of experimental animals established by the Ministry of Agriculture and Rural Affairs of the People’s Republic of China. The collection of cell and tissue samples was approved by the Ethics Committee of the Scientific Research Department at the Jiangsu Institute of Poultry Science (Approval No. JQ20230920).

2.1. Isolation and Culture of Primary Chicken Subcutaneous and Intramuscular Adipocytes

Subcutaneous adipose tissue was collected from newly hatched yellow-feathered broilers, carefully dissected to remove fascia, minced, and digested with 0.1% type I collagenase in a 37 °C incubator for 1 h. Digestion was terminated by the addition of 10% complete medium. The resulting cell pellet was then harvested, resuspended, and cultured at 37 °C. Adipocyte differentiation was induced by the addition of 0.1% oleic acid.
Intramuscular adipocytes were isolated from the pectoralis muscle of newly hatched yellow-feathered broilers. The tissues were digested with 0.1% type I collagenase at 37 °C for 2 h, with gentle mixing every 20 min. After centrifugation, the supernatant was collected and cultured at 37 °C. Adipocyte differentiation was induced by the addition of 0.1% oleic acid.

2.2. Construction of FTO Lentiviral Expression Vector

The FTO lentiviral expression vector was constructed by Genepharma Co., Ltd. (Suzhou, China). Based on the CDS sequence of chicken FTO deposited in GenBank (NM_001077232.2), the target gene was synthesized through whole-gene synthesis. The full-length FTO CDS was digested with NotI and NsiI, purified, and ligated into the vector. The recombinant plasmid was then transformed into TOP10 competent cells. Positive clones were confirmed by sequencing, and clones with 100% sequence identity were selected as the correct FTO expression vector.
The recombinant FTO plasmid was ultra-purified and used for lentivirus production. The packaging plasmids (pGag/Pol, pRev, pVSV-G) and the FTO expression plasmid were co-transfected into 293T cells. Lentiviral particles were harvested, concentrated, and the viral titer was determined. The titer of the FTO lentiviral expression vector was 2 × 10⁸ TU/mL.

2.3. Lentiviral Transfection and Cell Treatment

Subcutaneous and intramuscular adipocytes were transfected with either the FTO lentiviral expression vector or a negative control vector at 40–50% confluence in 6-well plates. Polybrene (5 μg·mL−1) was added to enhance transfection efficiency. At 72 h post-transfection, green fluorescence was observed under an inverted fluorescence microscope, and FTO mRNA expression was analyzed by quantitative real-time PCR (qPCR). Each group included three biological replicates.
Cell proliferation was assessed at 72 and 96 h post-transfection using a CCK-8 kit (Dojindo Laboratories, Fukuoka, Japan) and Edu kit (Ruibo Biotech Co., Ltd., Guangzhou, China), with six replicates per group. For lipid deposition analysis, cells were treated with 0.1% oleic acid for 6 days, beginning 1 day after transfection. Lipid droplet accumulation was evaluated by Oil Red O staining, with three replicates per group.

2.4. FTO siRNA Transfection and Cell Treatment

The FTO siRNA sequence was synthesized by GenePharma (Shanghai, China). Based on the mRNA sequence of chicken FTO (NM_001185147.1), three pairs of siRNA primers were designed using Oligo Designer version 3.0 (Table 1) and the FTO-858 primer was validated in vitro.
Cell proliferation was assessed at 24, 48 and 72 h post-transfection using a CCK-8 kit (Dojindo Laboratories, Fukuoka, Japan), with six replicates per group. For lipid deposition analysis, cells were treated with 0.1% oleic acid for 4 days, beginning 1 day after transfection. Lipid droplet accumulation was evaluated by Oil Red O staining, with three replicates per group.

2.5. Total RNA Isolation, Primer Synthesis, Reverse Transcription and qPCR

Total RNA was extracted from cells using the RNAprep Pure Kit (DP419, Tiangen Biotech Co., Ltd., Shanghai, China) according to the manufacturer’s instructions.
Gene-specific primers were designed using Oligo software and synthesized by Sangon Biotech Co., Ltd. (Shanghai, China). cDNA synthesis was performed using a reverse transcription kit (RR036Q, Takara, Dalian, China).
Quantitative real-time PCR was conducted using the QuantiNova SYBR Green PCR Kit (4993626, QIAGEN, Hilden, Germany) following the manufacturer’s protocol. Primer sequences are provided in Table 1.

2.6. Transcriptome Sequencing Analysis

Transcriptome sequencing was performed on cells transfected with the FTO lentiviral expression vector and the negative control vector. All sequencing procedures were carried out by Genedenovo Biotechnology Co., Ltd. (Guangzhou, China) using an Illumina platform. Raw reads were filtered to remove low-quality sequences using fastp (v 0.18.0). Clean reads were then mapped to the reference genome using HISAT2 (v 2.1.0). Gene expression levels were quantified with StringTie (v 1.3.4) and expressed as transcripts per million (TPM). Differentially expressed genes (DEGs) were identified using the edgeR package (v 3.12.1). Genes with an FDR < 0.05 or p < 0.05 and fold change (FC) > 1.5 or FC < 0.67 were considered significantly differentially expressed.
GO and KEGG enrichment analyses were conducted using Kobas 3.0. Terms and pathways with p < 0.05 were considered significantly enriched. Protein–protein interaction (PPI) analysis was performed using the STRING database (http://string-db.org). The PPI network was then constructed and visualized using Cytoscape 3.8.0.

2.7. Statistical Analysis

All data are presented as the mean ± standard deviation (SD). Statistical analyses were conducted using IBM SPSS Statistics version 23.0 (IBM Corp., Armonk, NY, USA), with one-way analysis of variance (ANOVA). Differences were considered statistically significant at p < 0.05 and non-significant at p > 0.05.

3. Results

3.1. The Role of FTO in Proliferation and Lipid Droplet Deposition in Chicken Subcutaneous Adipocytes

3.1.1. Effects of FTO Lentiviral Expression Vector Transfection on Subcutaneous Adipocytes Proliferation and Lipid Droplet Accumulation

Subcutaneous adipocytes were transfected with either the FTO lentiviral expression vector or a negative control vector in 6-well plates at 40–50% confluence. As shown in Figure 1a, green fluorescence indicated successful transfection. qPCR analysis demonstrated that FTO mRNA expression was significantly higher in the FTO-overexpressing group compared to the negative control group at 3 days post-transfection (Figure 1b, p < 0.01), confirming efficient transfection of the FTO lentiviral vector.
To investigate the role of FTO in the proliferation of chicken subcutaneous adipocytes, cells were transfected with either the FTO lentivirus vector or a negative control vector. Cell proliferation was assessed using CCK-8 and EdU staining assays. Compared to the control group, cell proliferation was significantly reduced at 72 and 96 h following FTO overexpression (Figure 1c,d, p < 0.05).
Six days after FTO lentiviral transfection, Oil Red O staining revealed that lipid droplet accumulation was significantly higher in the FTO-overexpressing group compared to the control group (Figure 1e,f, p < 0.05).

3.1.2. Effects of FTO siRNA Transfection on Proliferation and Lipid Droplet Accumulation in Chicken Subcutaneous Adipocytes

To further investigate the role of FTO in the proliferation and lipid droplet accumulation of chicken subcutaneous adipocytes, FTO siRNA was transfected into the cells, and subsequent changes in cell proliferation and lipid deposition were systematically observed.
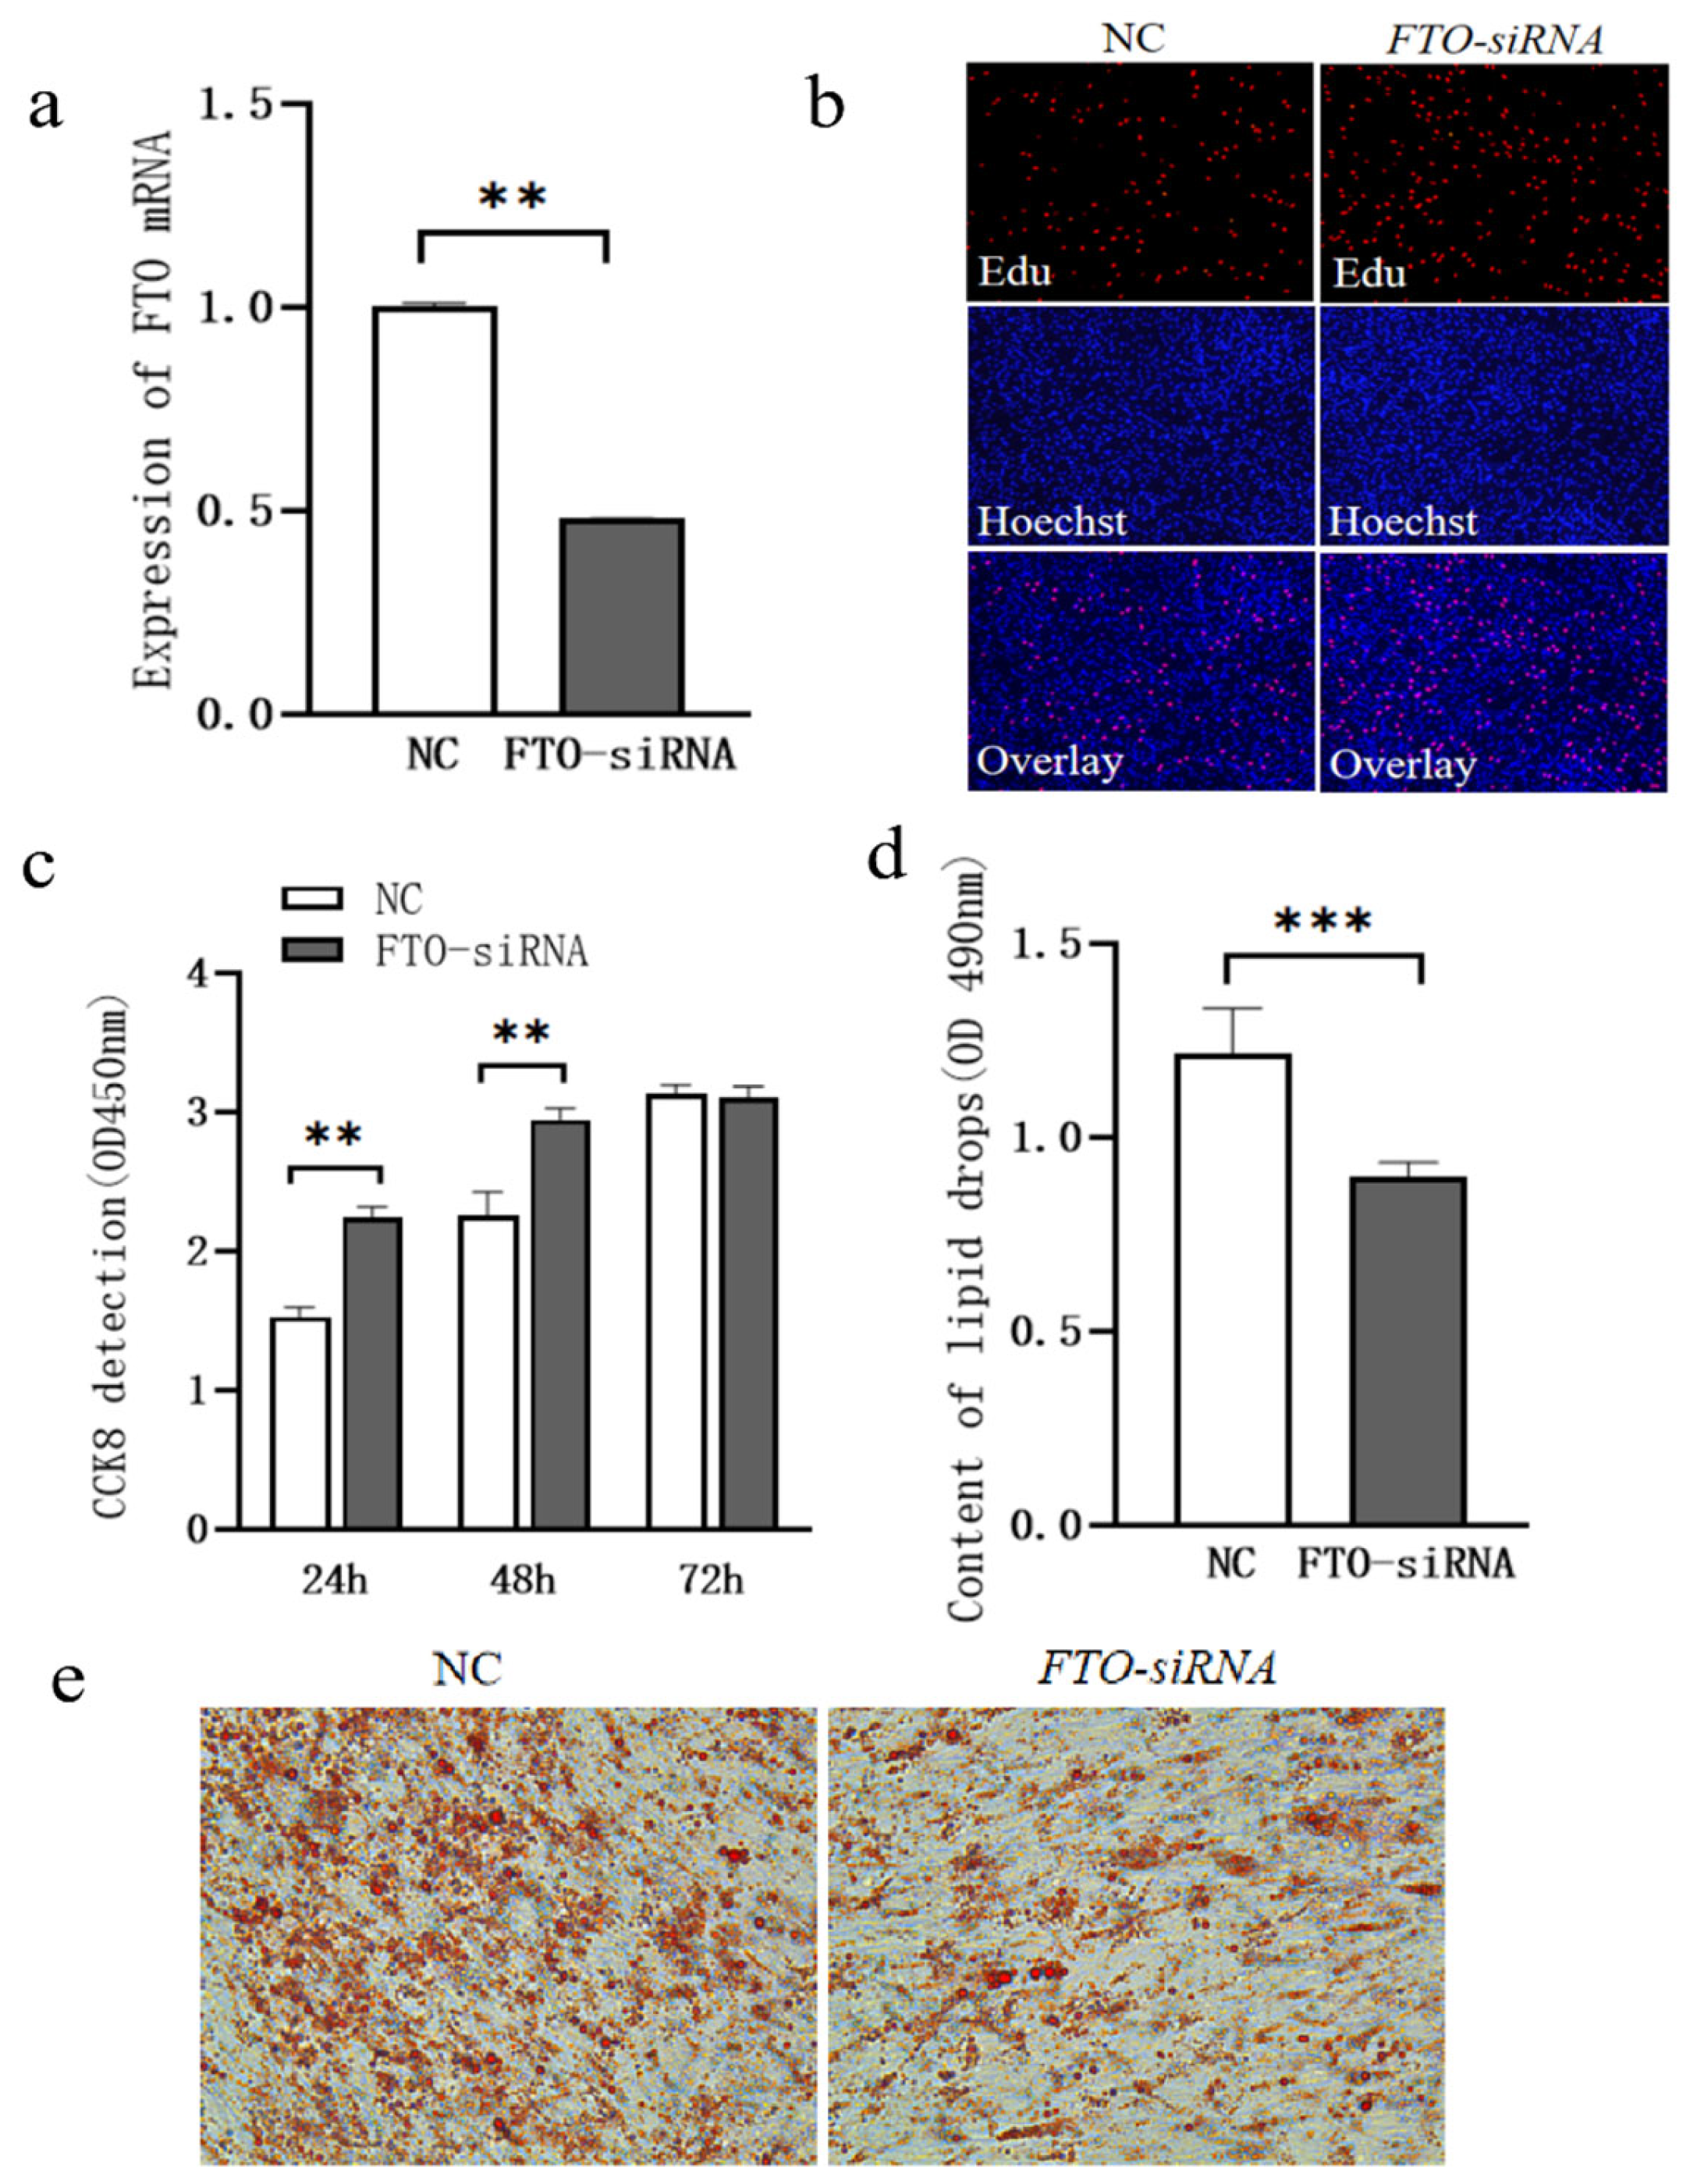
After FTO siRNA transfection into subcutaneous adipocytes, the mRNA expression of FTO was significantly downregulated (Figure 2a, p < 0.05). Cell proliferation was assessed using Cell Counting Kit-8 (CCK-8) and 5-ethynyl-2′-deoxyuridine (EdU) staining assays. Compared to the control group, cell proliferation was significantly enhanced at 24 and 48 h post-transfection of FTO siRNA (Figure 2b,c, p < 0.05). Four days post-transfection of FTO siRNA, Oil Red O revealed that the accumulation of lipid droplets in the FTO siRNA group was significantly lower than in the control group (Figure 2d, p < 0.05).

3.1.3. Screening of Pathways and Genes Underlying FTO-Regulated Lipid Deposition in Chicken Subcutaneous Adipocytes

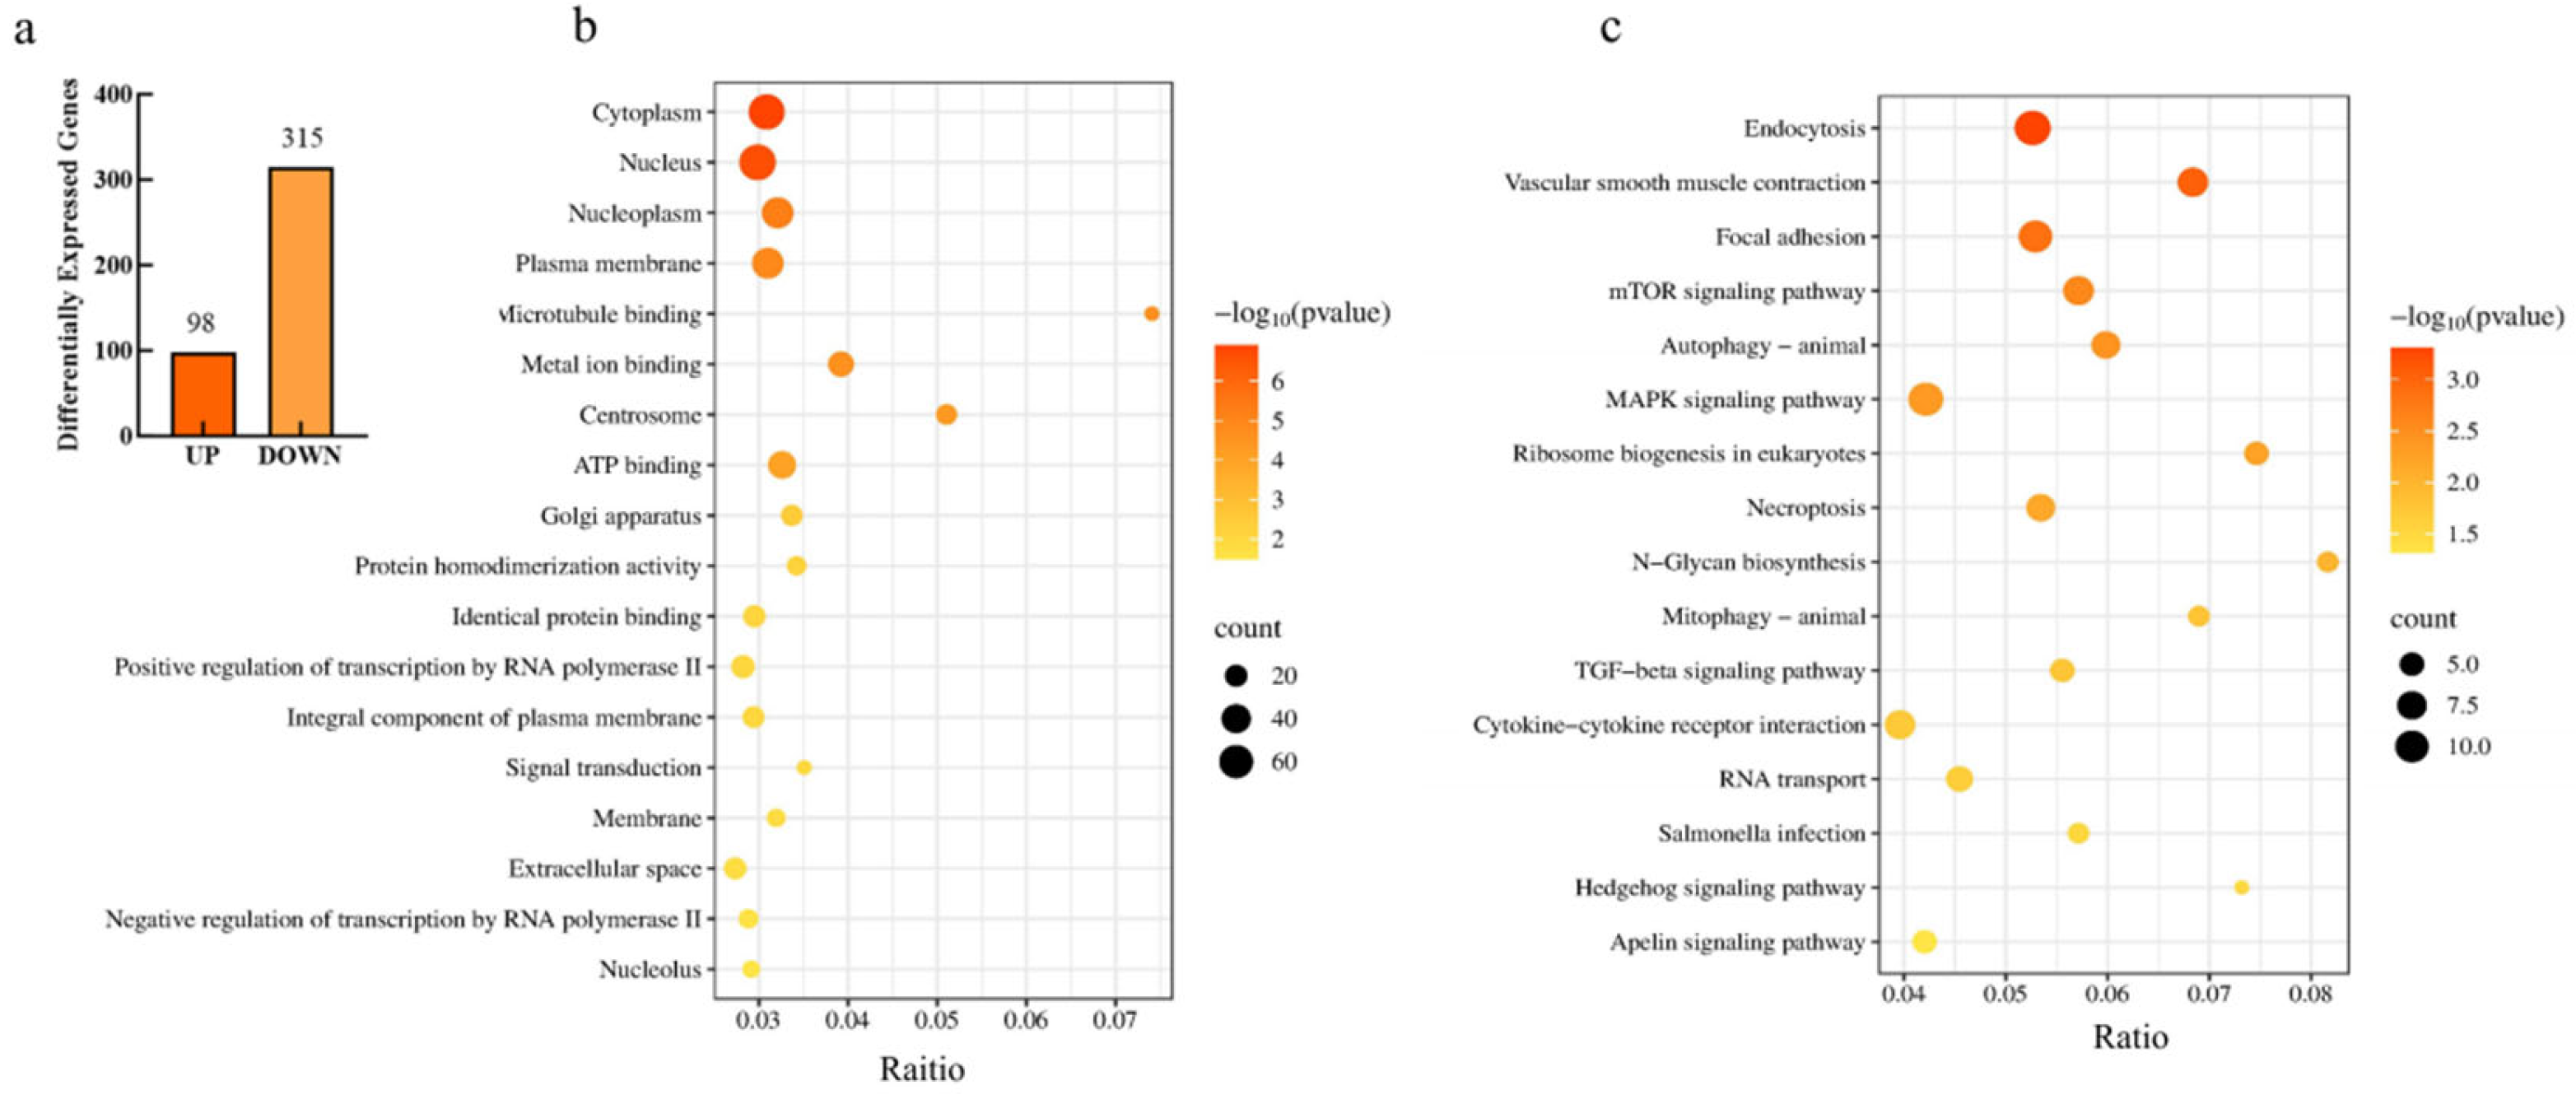
To further investigate the pathways and genes responsive to FTO regulation in subcutaneous adipocytes, transcriptome sequencing was performed on FTO-transfected and negative control cells to identify the key genes and pathways regulated by FTO. A total of 413 differentially expressed genes (DEGs) were identified, including 98 upregulated genes and 315 downregulated genes (Figure 3a, p < 0.05).
To further characterize the functions of the differentially expressed genes (DEGs), Gene Ontology (GO) and Kyoto Encyclopedia of Genes and Genomes (KEGG) enrichment analyses were performed. GO enrichment analysis revealed that 84 GO terms were significantly enriched. The top 20 GO terms primarily included cytosol, cytoplasm, nucleoplasm, integral component of membrane, ATP binding, positive regulation of transcription by RNA polymerase II, and the integral component of plasma membrane (Figure 3b, p < 0.05).
KEGG enrichment analysis revealed that 17 signaling pathways were significantly enriched, including regulation of the actin cytoskeleton, focal adhesion, mTOR signaling pathway, autophagy, Apelin signaling pathway, JNK/p38 MAPK signaling pathway, eukaryotic ribosome biogenesis, cytokine–cytokine receptor interaction, N-glycan biosynthesis, and transforming growth factor-β (TGF-β) signaling pathway (Figure 3c, p < 0.05). Genes enriched in these pathways are listed in Table 2 (p < 0.05).
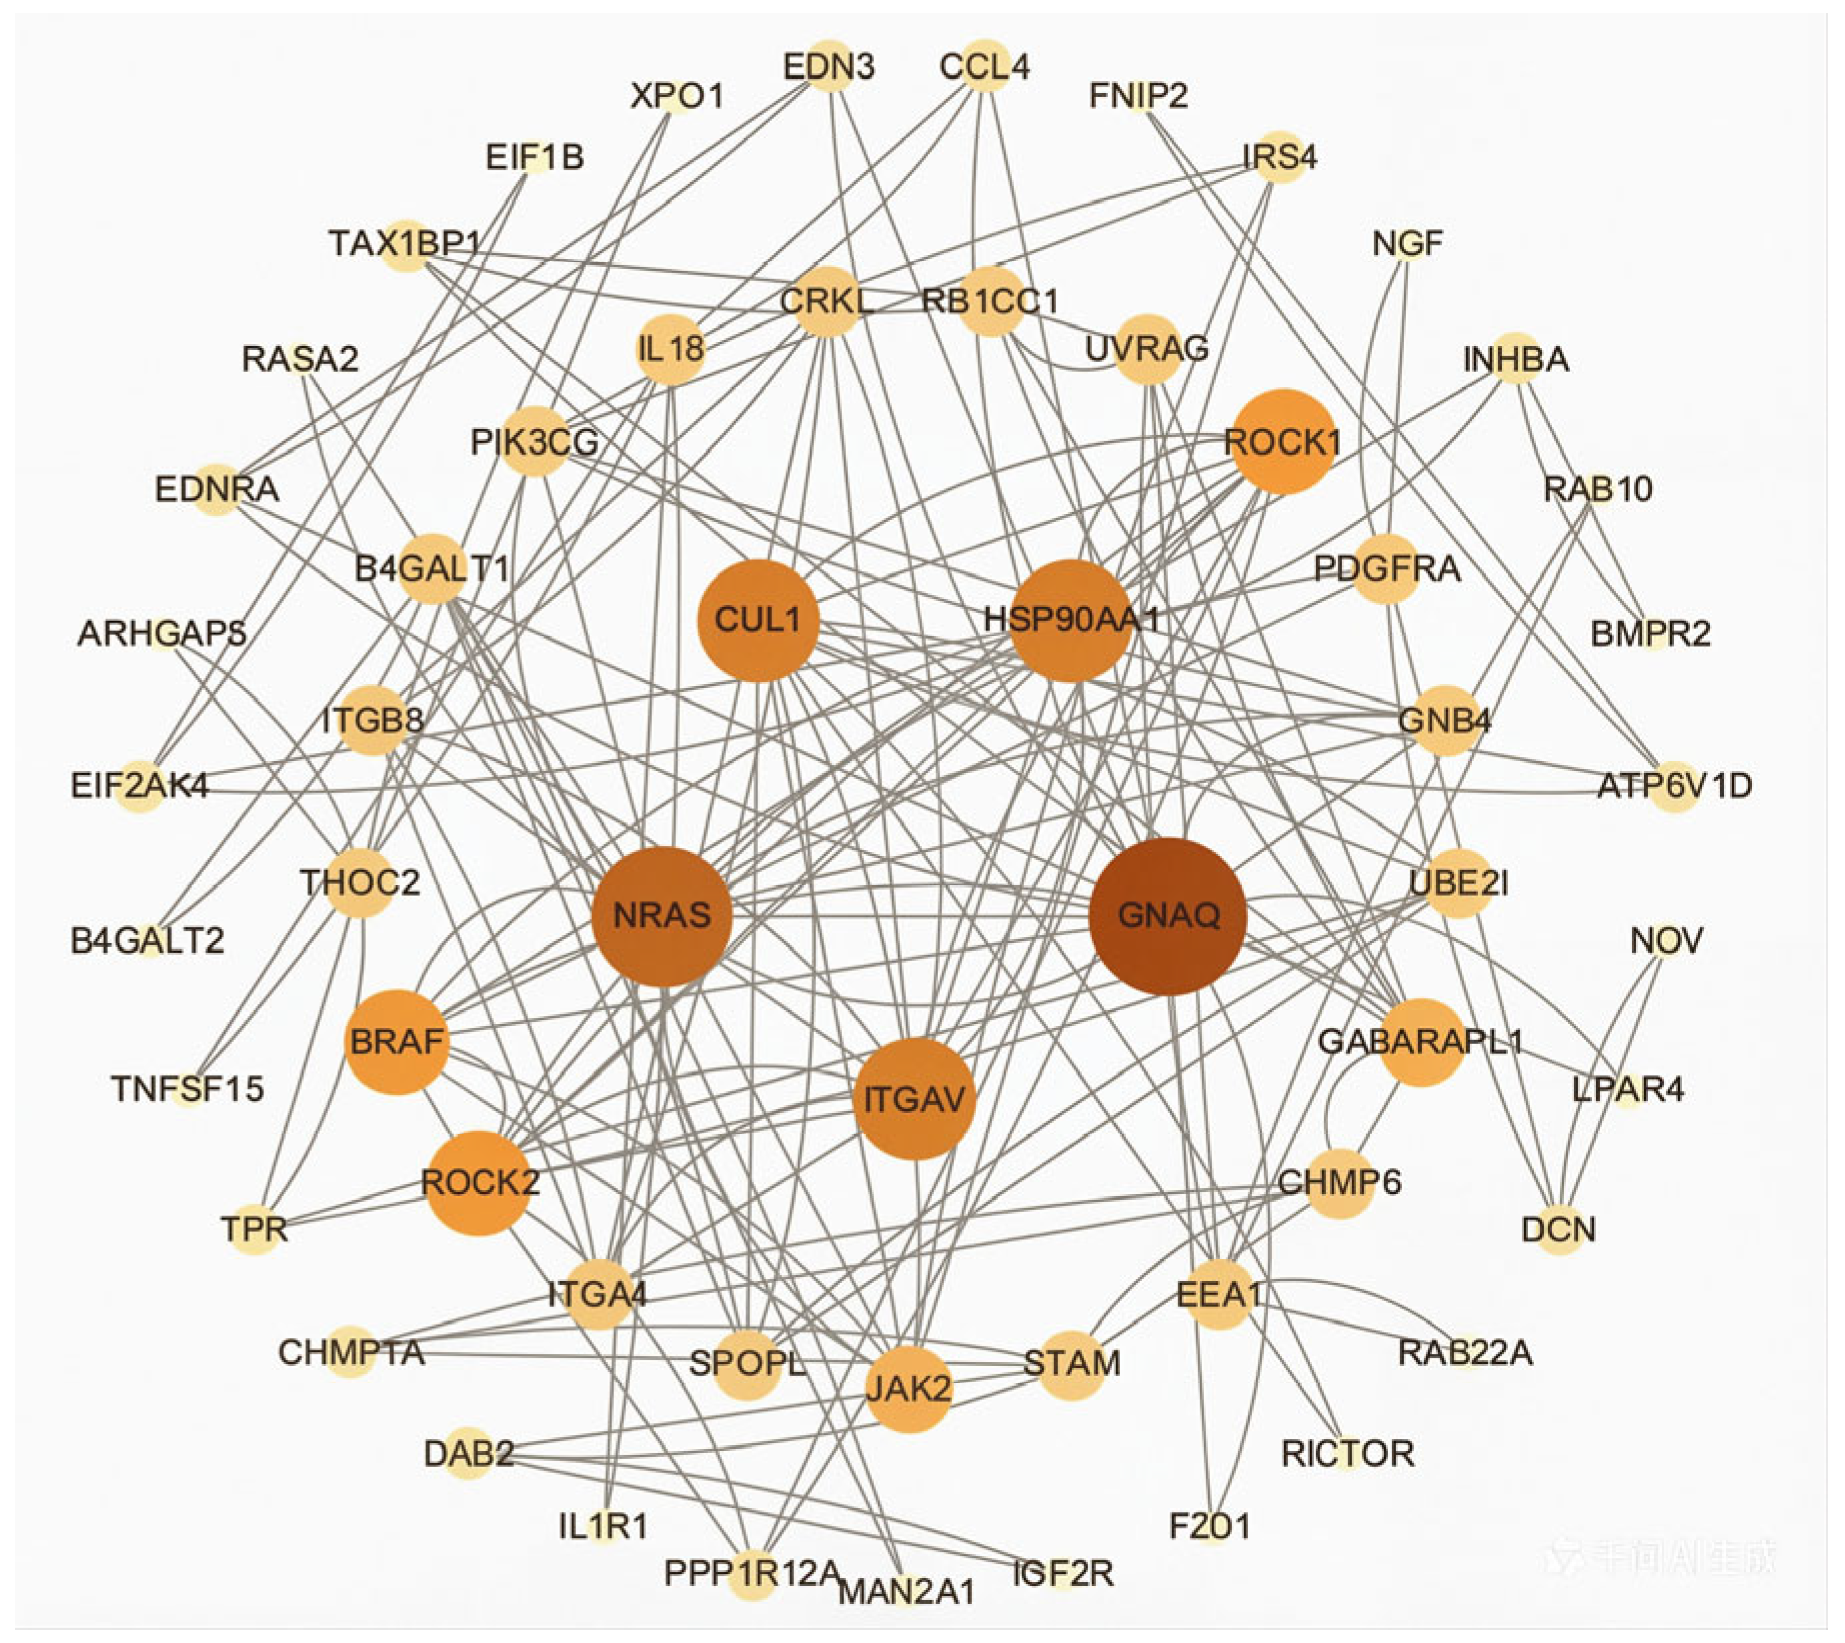
To further identify key genes and pathways responsive to FTO regulation, protein–protein interaction (PPI) analysis was performed on the genes within the significantly enriched pathways. As shown in Figure 4, CUL1, NRAS, ITGAV, GNAQ, and HSP90AA1 were identified as key genes involved in FTO-mediated lipid deposition in chicken subcutaneous adipocytes.

3.2. Regulatory Effect and Pathway of FTO on Proliferation and Lipid Deposition in Chicken Intramuscular Adipocytes

3.2.1. Effects of FTO Lentiviral Expression Vector Transfection on Proliferation and Differentiation of Chicken Intramuscular Adipocytes

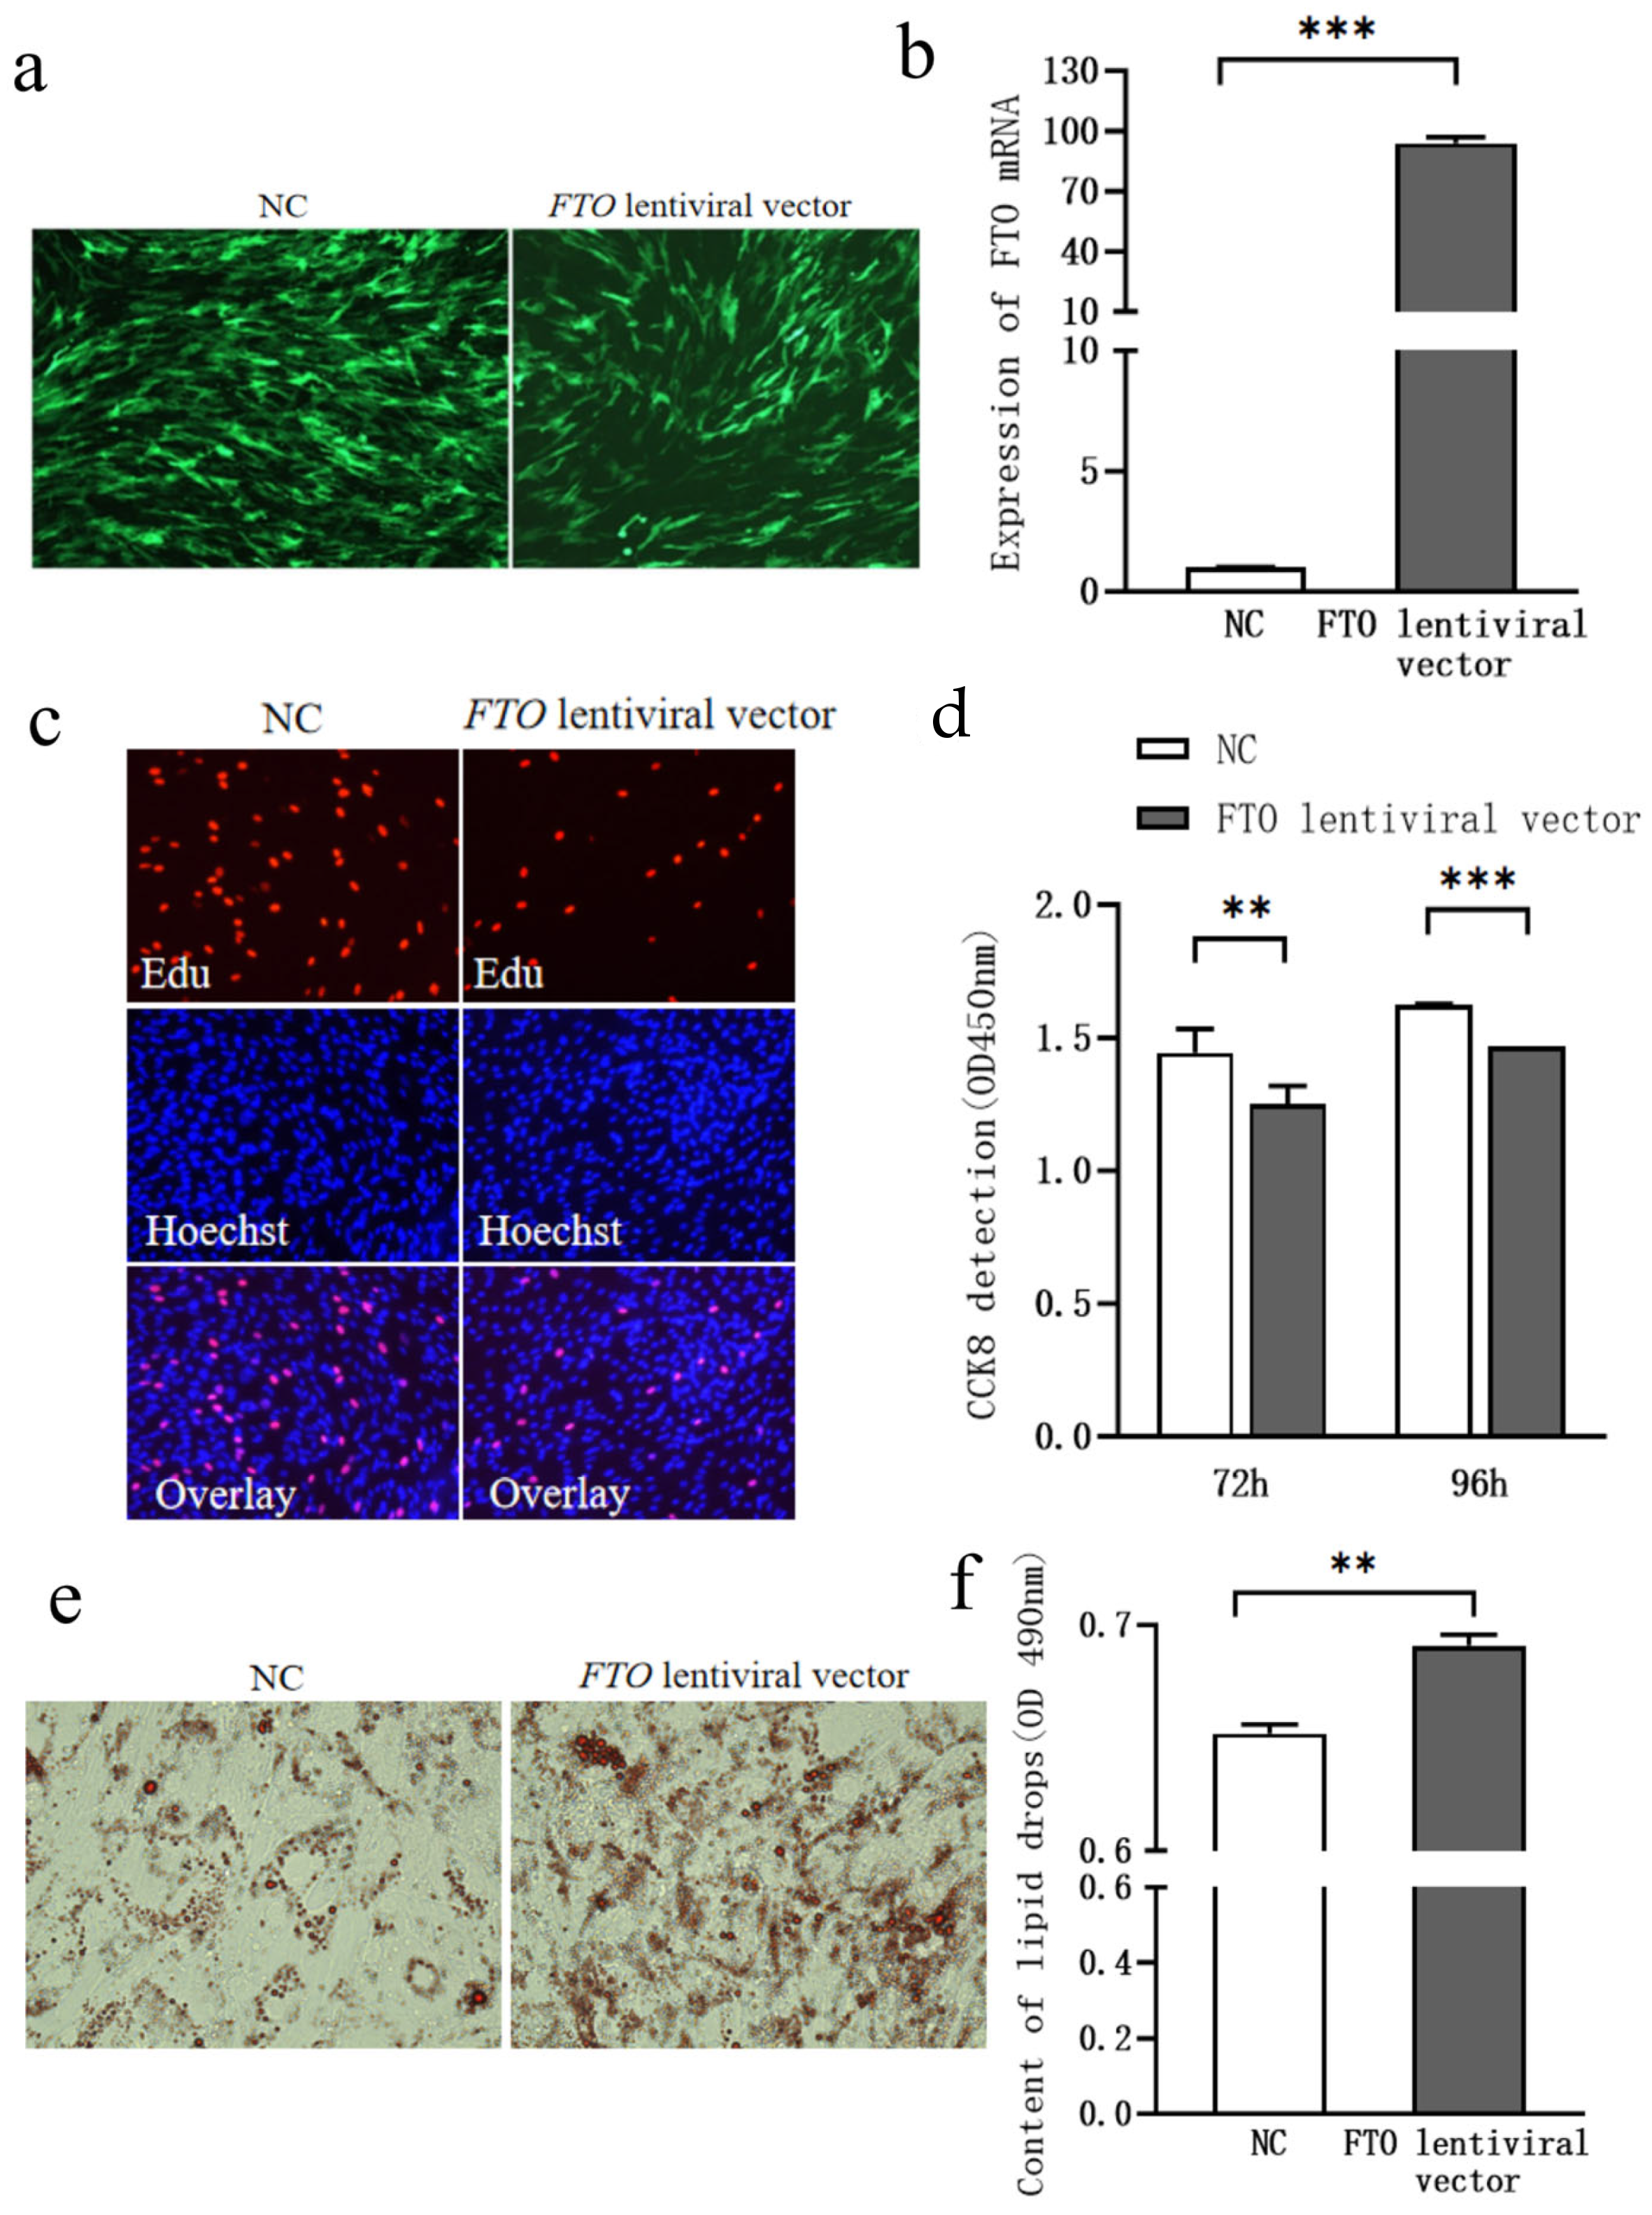
Intramuscular adipocytes were transfected with the FTO lentiviral expression vector at 40–50% confluence. As shown in Figure 5a, green fluorescence indicated successful transfection. qPCR analysis revealed that FTO mRNA expression was significantly higher in the FTO-transfected group compared to the negative control group at 3 days post-transfection (Figure 5b, p < 0.01), confirming the successful transfection of the FTO lentiviral vector.
Intramuscular adipocytes were transfected with either the FTO lentiviral expression vector or the negative control vector. Cell proliferation was assessed using the CCK-8 assay at 72 and 96 h post-transfection. Compared to the control group, cell proliferation was significantly reduced in the FTO-overexpressing group at both 72 and 96 h (Figure 5c,d, p < 0.05).
Six days after FTO lentiviral transfection, Oil Red O staining revealed that lipid droplet accumulation was significantly higher in the FTO-transfected group compared to the control group (Figure 5e,f, p < 0.05).

3.2.2. Effects of FTO siRNA Transfection on Proliferation and Lipid Droplet Accumulation in Chicken Intramuscular Adipocytes

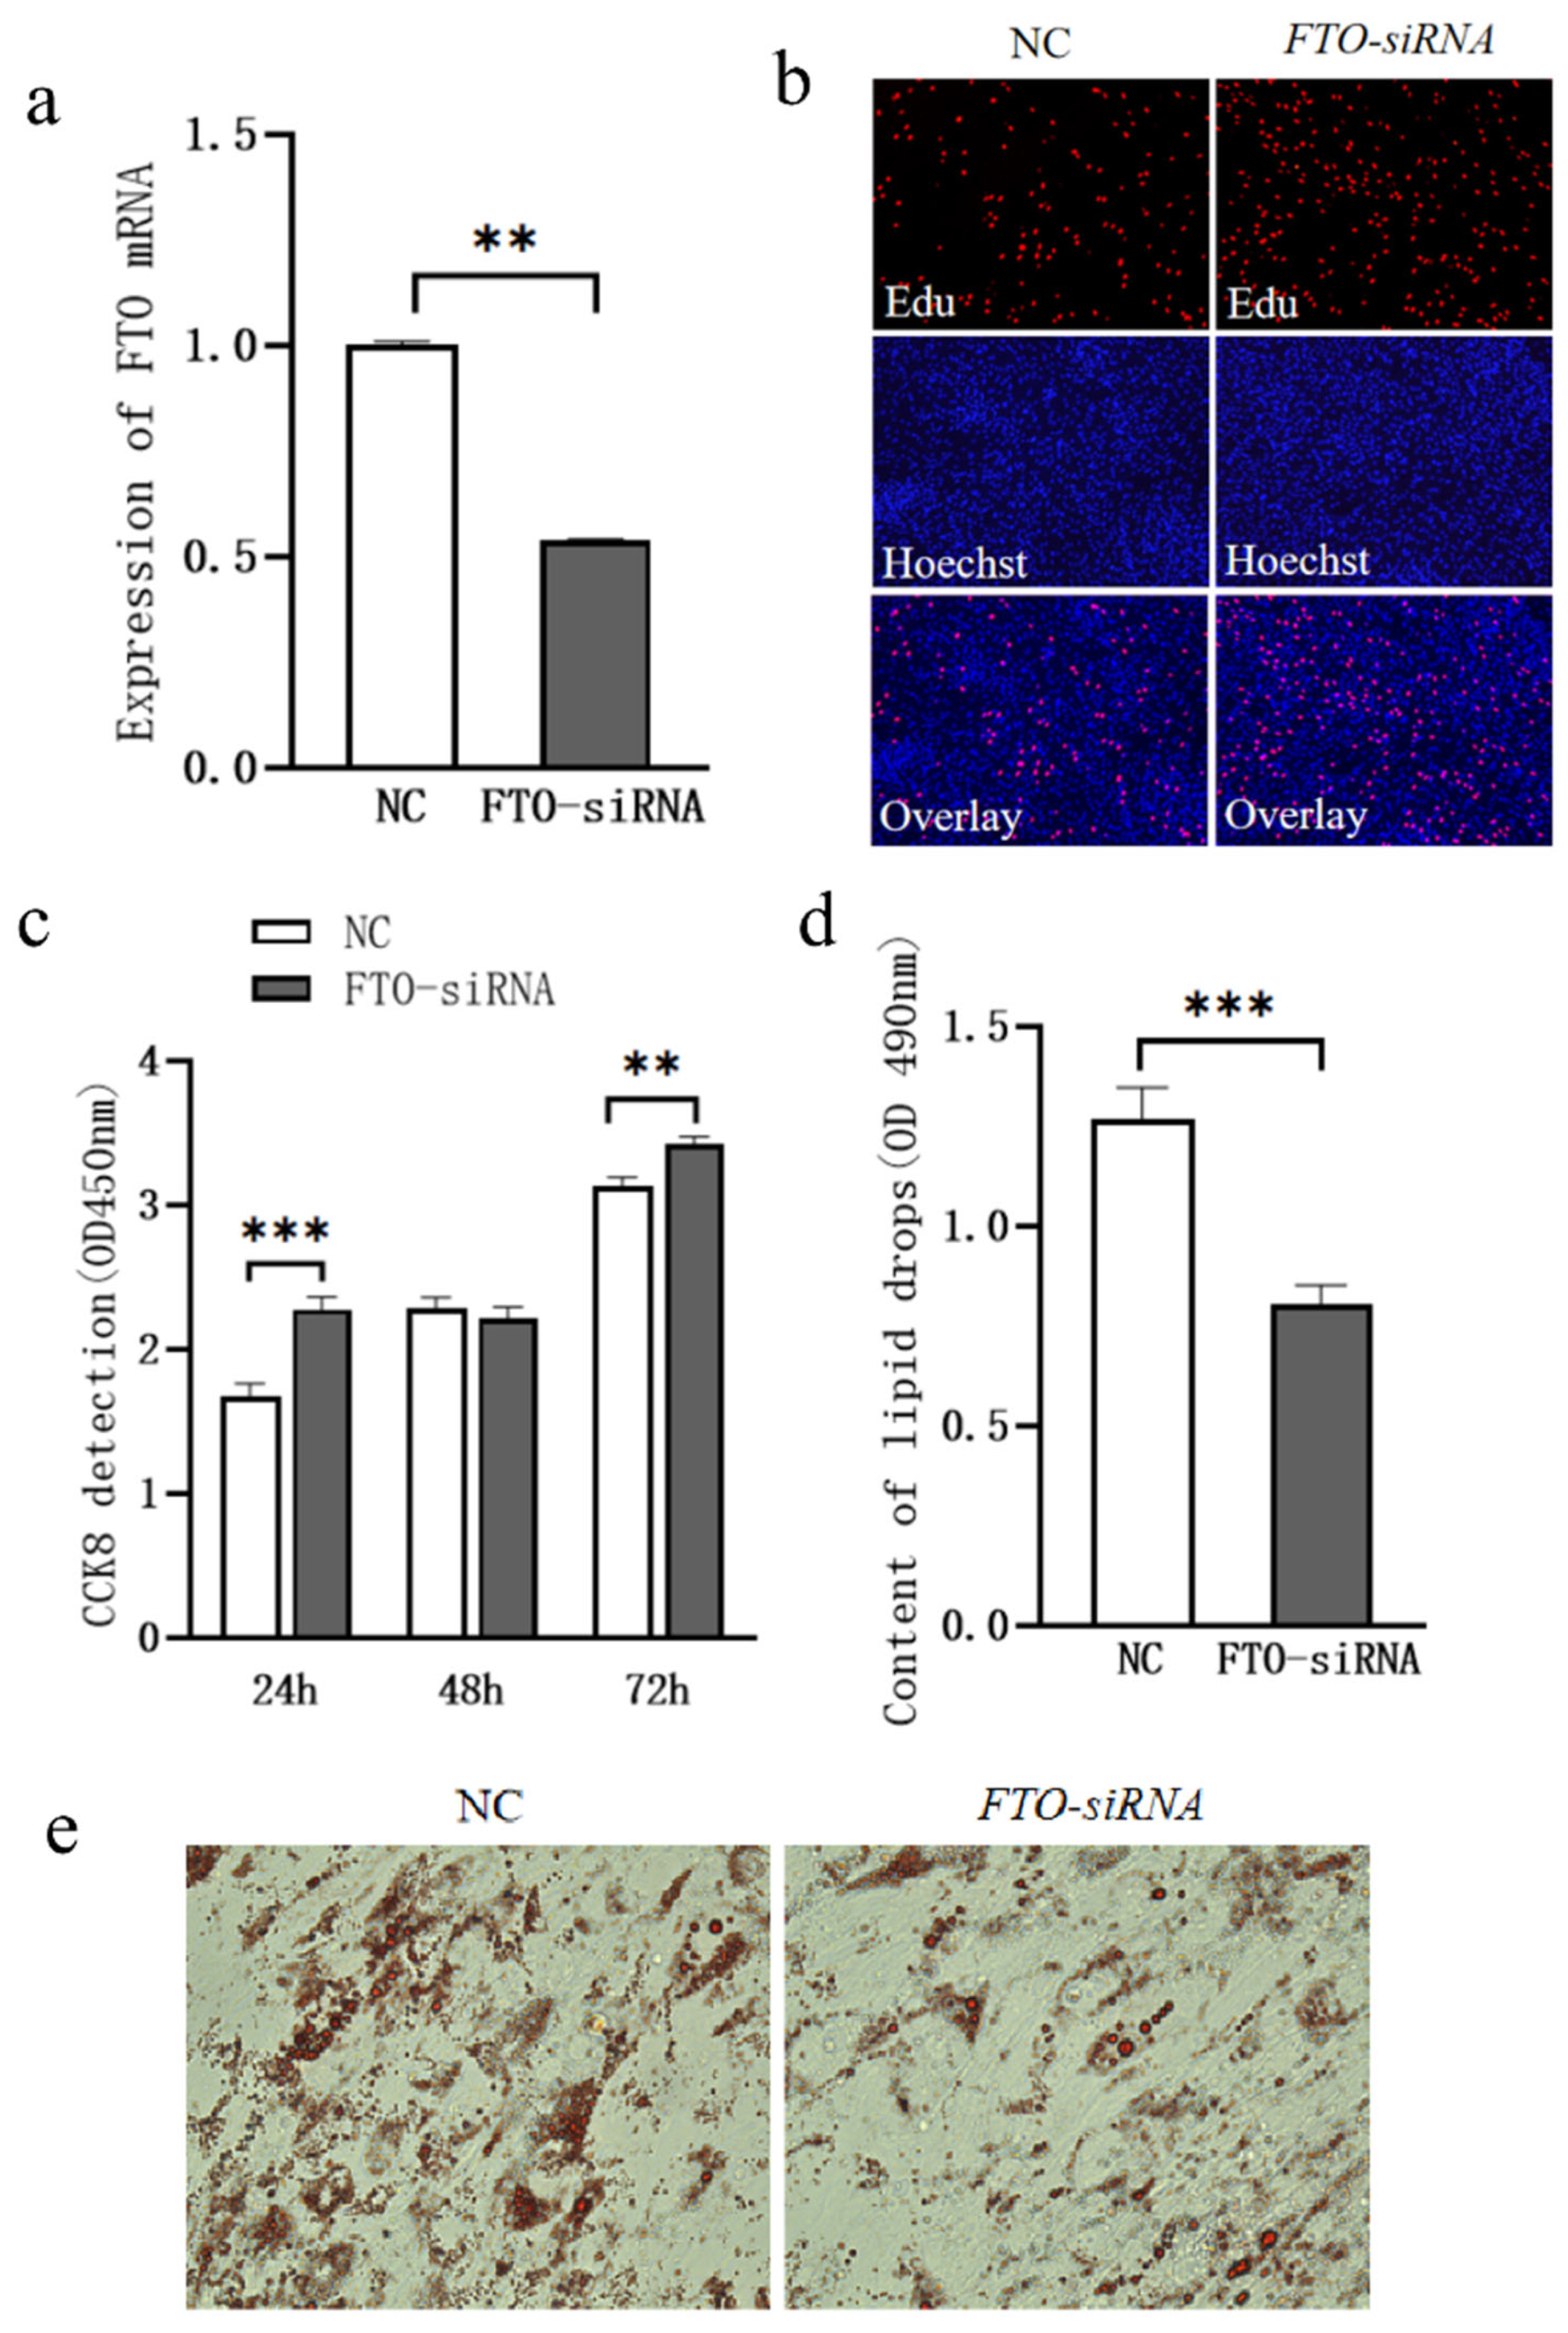
To further investigate the role of FTO in the proliferation and lipid droplet accumulation of chicken intramuscular adipocytes, FTO siRNA was transfected into the cells, and the changes in cell proliferation and lipid deposition were observed. After FTO siRNA transfection into intramuscular adipocytes, the mRNA expression of FTO was significantly decreased (Figure 6a, p < 0.05).
Cell proliferation was assessed using CCK-8 and EdU staining assays. Compared to the control group, cell proliferation was significantly enhanced at 24 and 72 h after FTO siRNA transfection (Figure 6b,c, p < 0.05); Four days after FTO siRNA transfection, Oil Red O staining revealed that lipid droplet accumulation was significantly lower in the FTO-siRNA group compared to the control group (Figure 6d, p < 0.05).

3.2.3. Screening of Pathways and Genes Underlying FTO-Regulated Lipid Deposition in Intramuscular Adipocytes

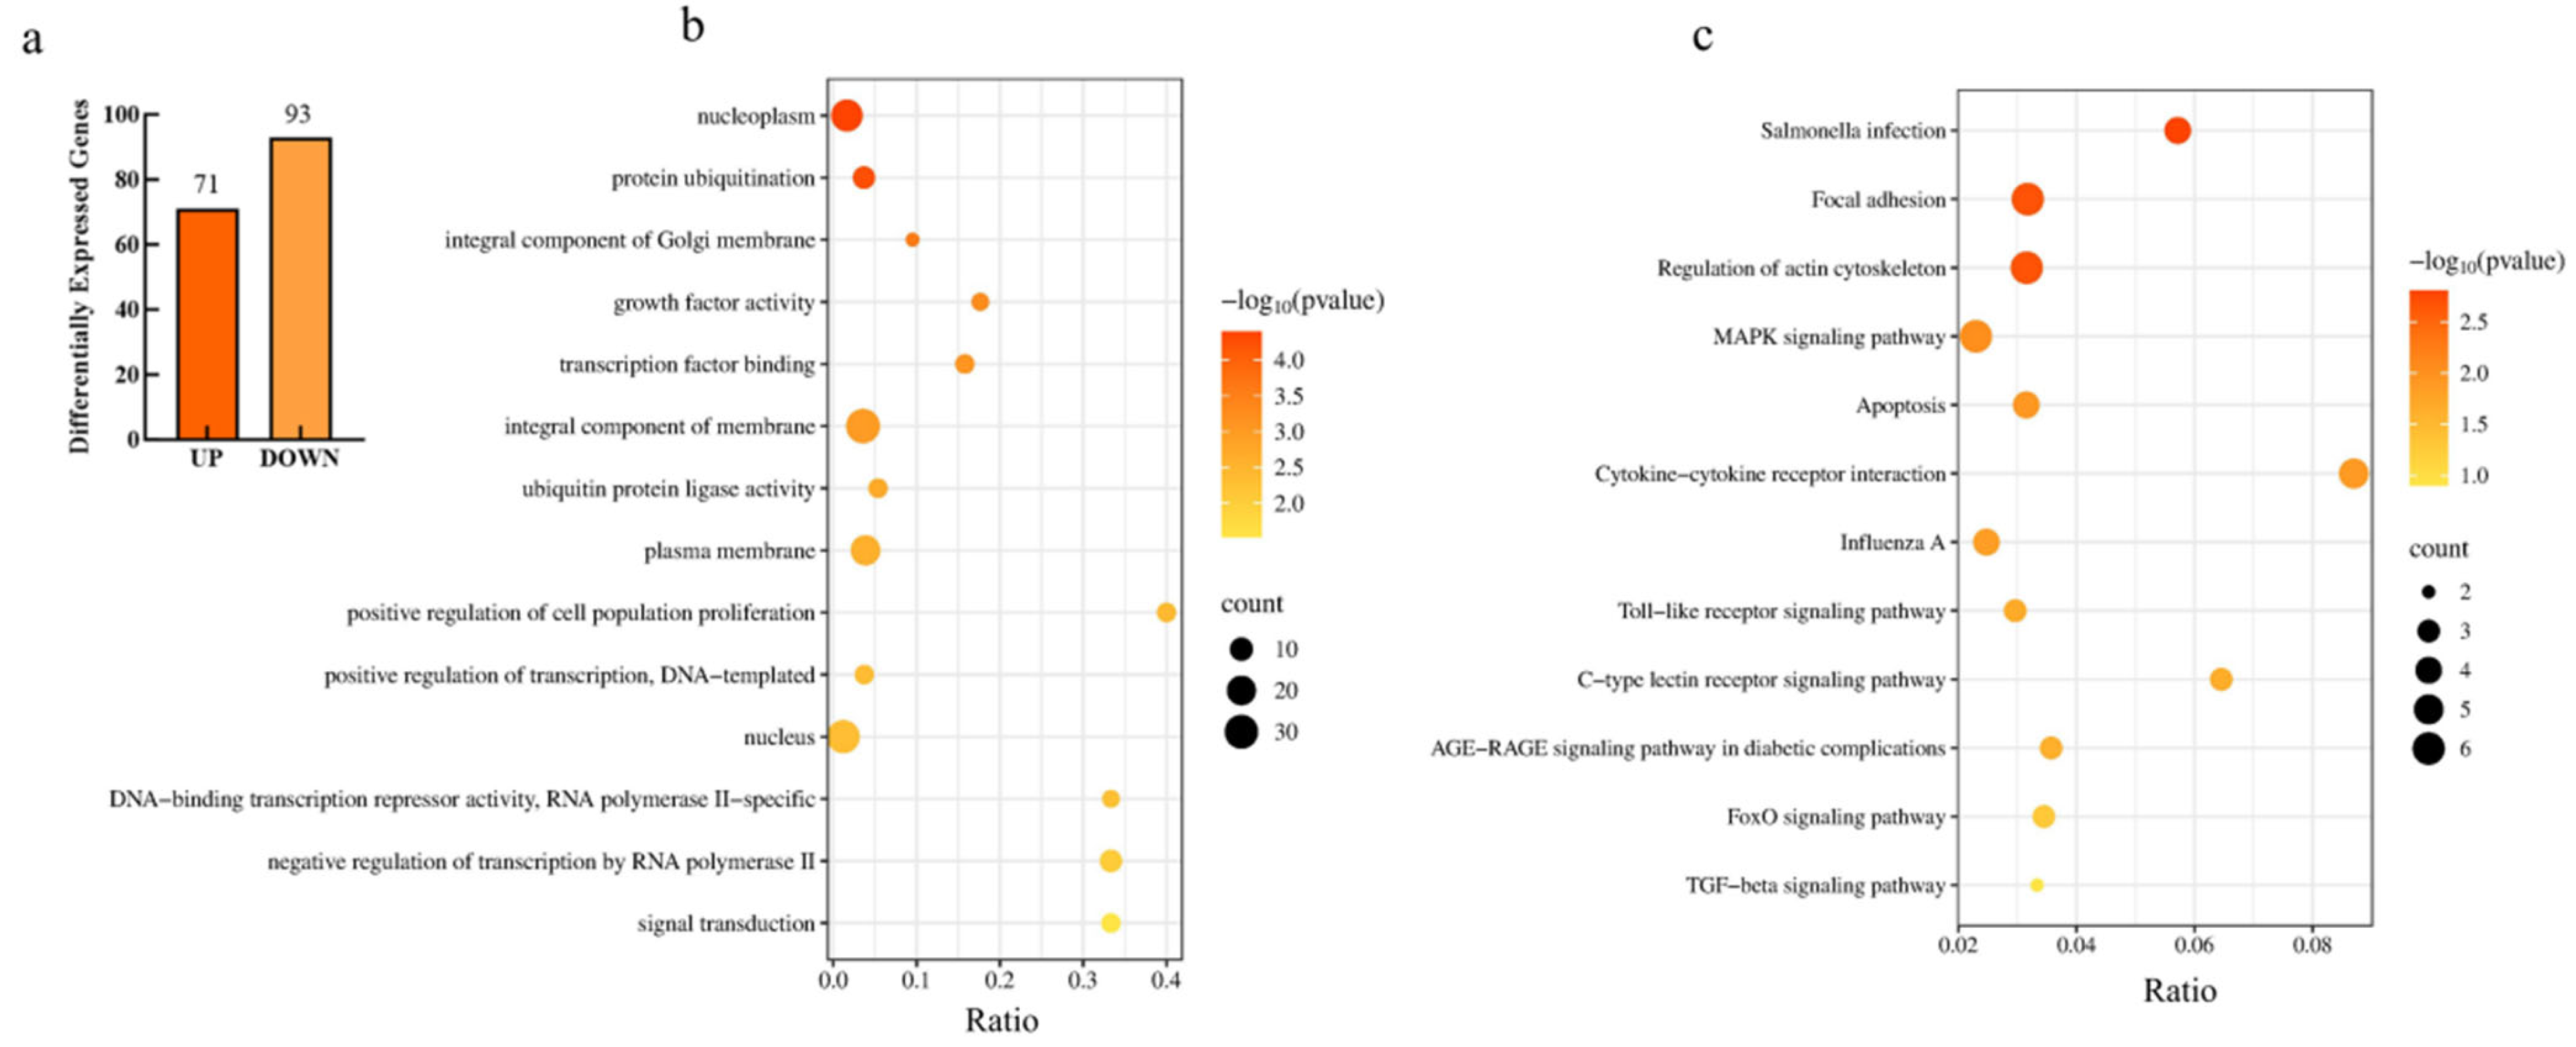
To further investigate the molecular mechanism by which FTO regulates lipid droplet accumulation in intramuscular adipocytes, transcriptome sequencing was performed on FTO-transfected and negative control cells to identify genes and pathways responsive to FTO regulation. A total of 164 differentially expressed genes (DEGs) were identified between the two groups, including 71 upregulated and 93 downregulated genes (Figure 7a, p < 0.05).
To further characterize the functions of the differentially expressed genes (DEGs), Gene Ontology (GO) and Kyoto Encyclopedia of Genes and Genomes (KEGG) enrichment analyses were performed. GO enrichment analysis revealed 54 significantly enriched GO terms, including 15 cellular component (CC) terms, 11 molecular function (MF) terms, and 28 biological process (BP) terms. The top five terms in each category are shown in Figure 7b (p < 0.05).
KEGG analysis revealed that 13 signaling pathways were significantly enriched, including focal adhesion, regulation of the actin cytoskeleton, MAPK signaling pathway, gap junction, cytokine–cytokine receptor interaction, FoxO signaling pathway, apoptosis, C-type lectin receptor signaling pathway, and TGF-β signaling pathway (Figure 7c, p < 0.05). DEGs enriched in these pathways are listed in Table 3 (p < 0.05).
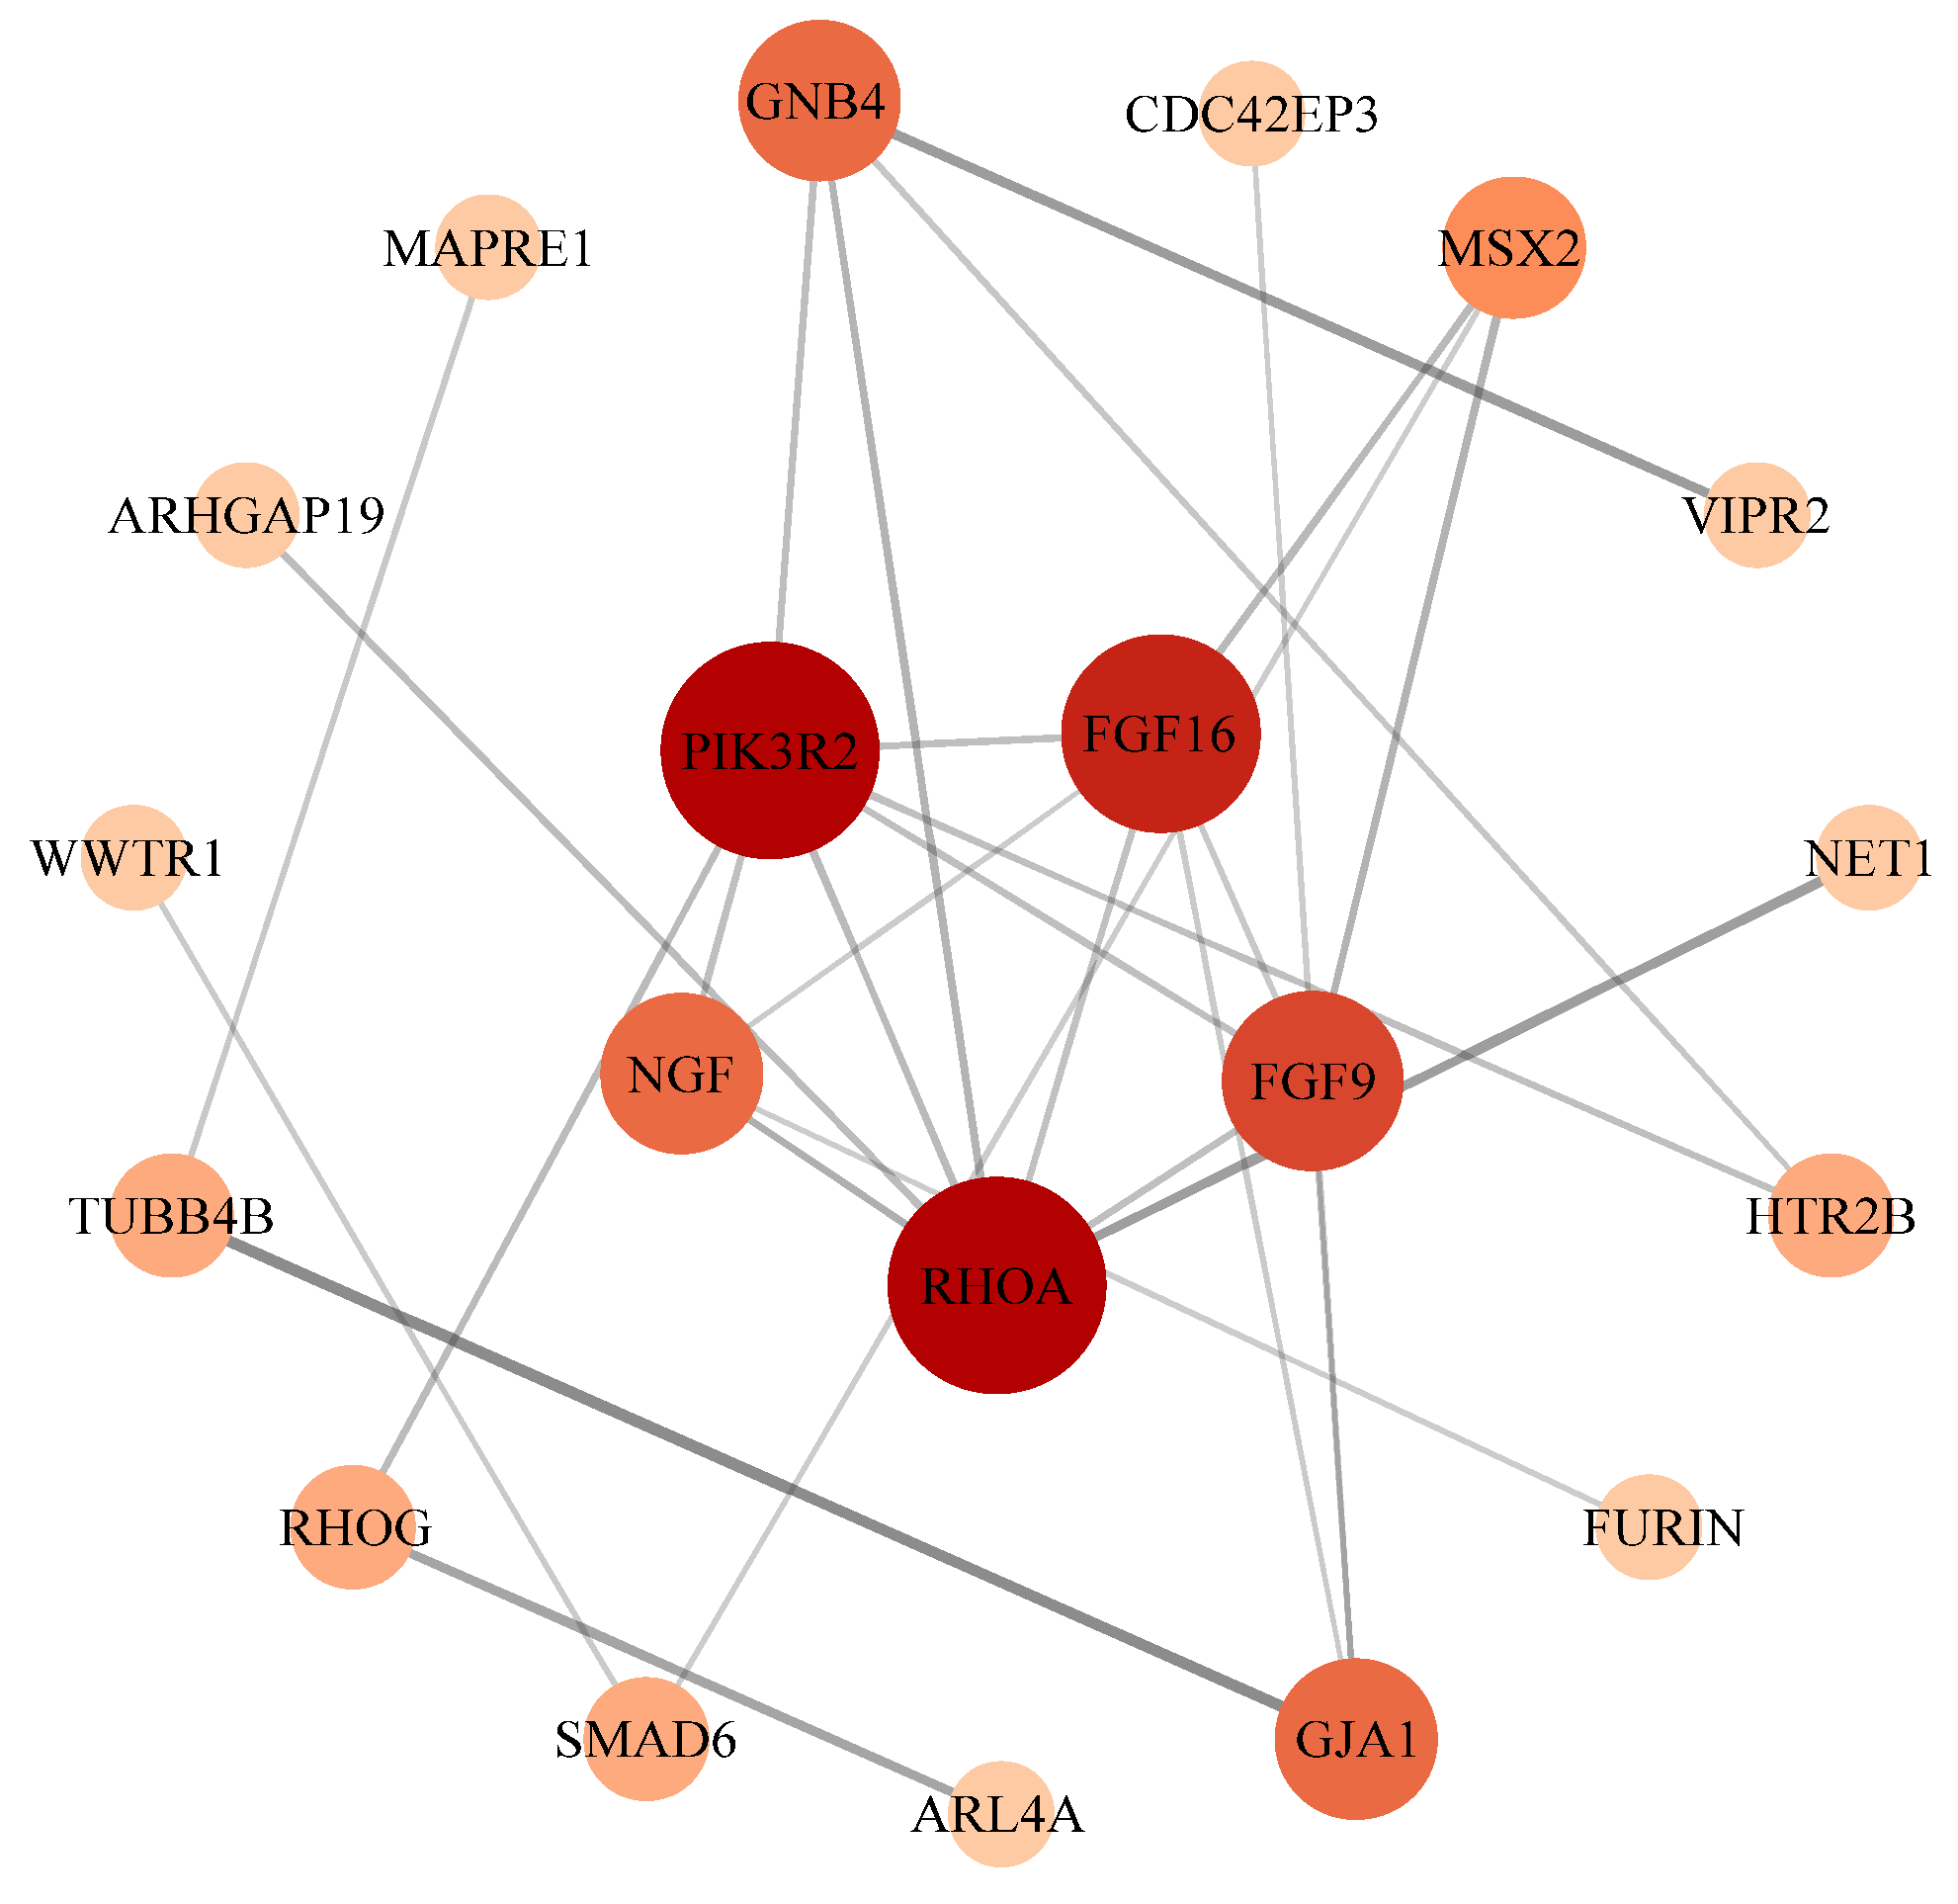
To further identify key genes and pathways regulated by FTO, protein–protein interaction (PPI) analysis was conducted on genes from the significantly enriched pathways. As shown in Figure 8, PIK3R2, FGF16, FGF9, RHOA, and NGF were identified as key genes mediating FTO-regulated lipid accumulation in chicken intramuscular adipocytes.

3.3. Combined Analysis of Significantly Enriched Pathways in Subcutaneous and Intramuscular Adipocytes

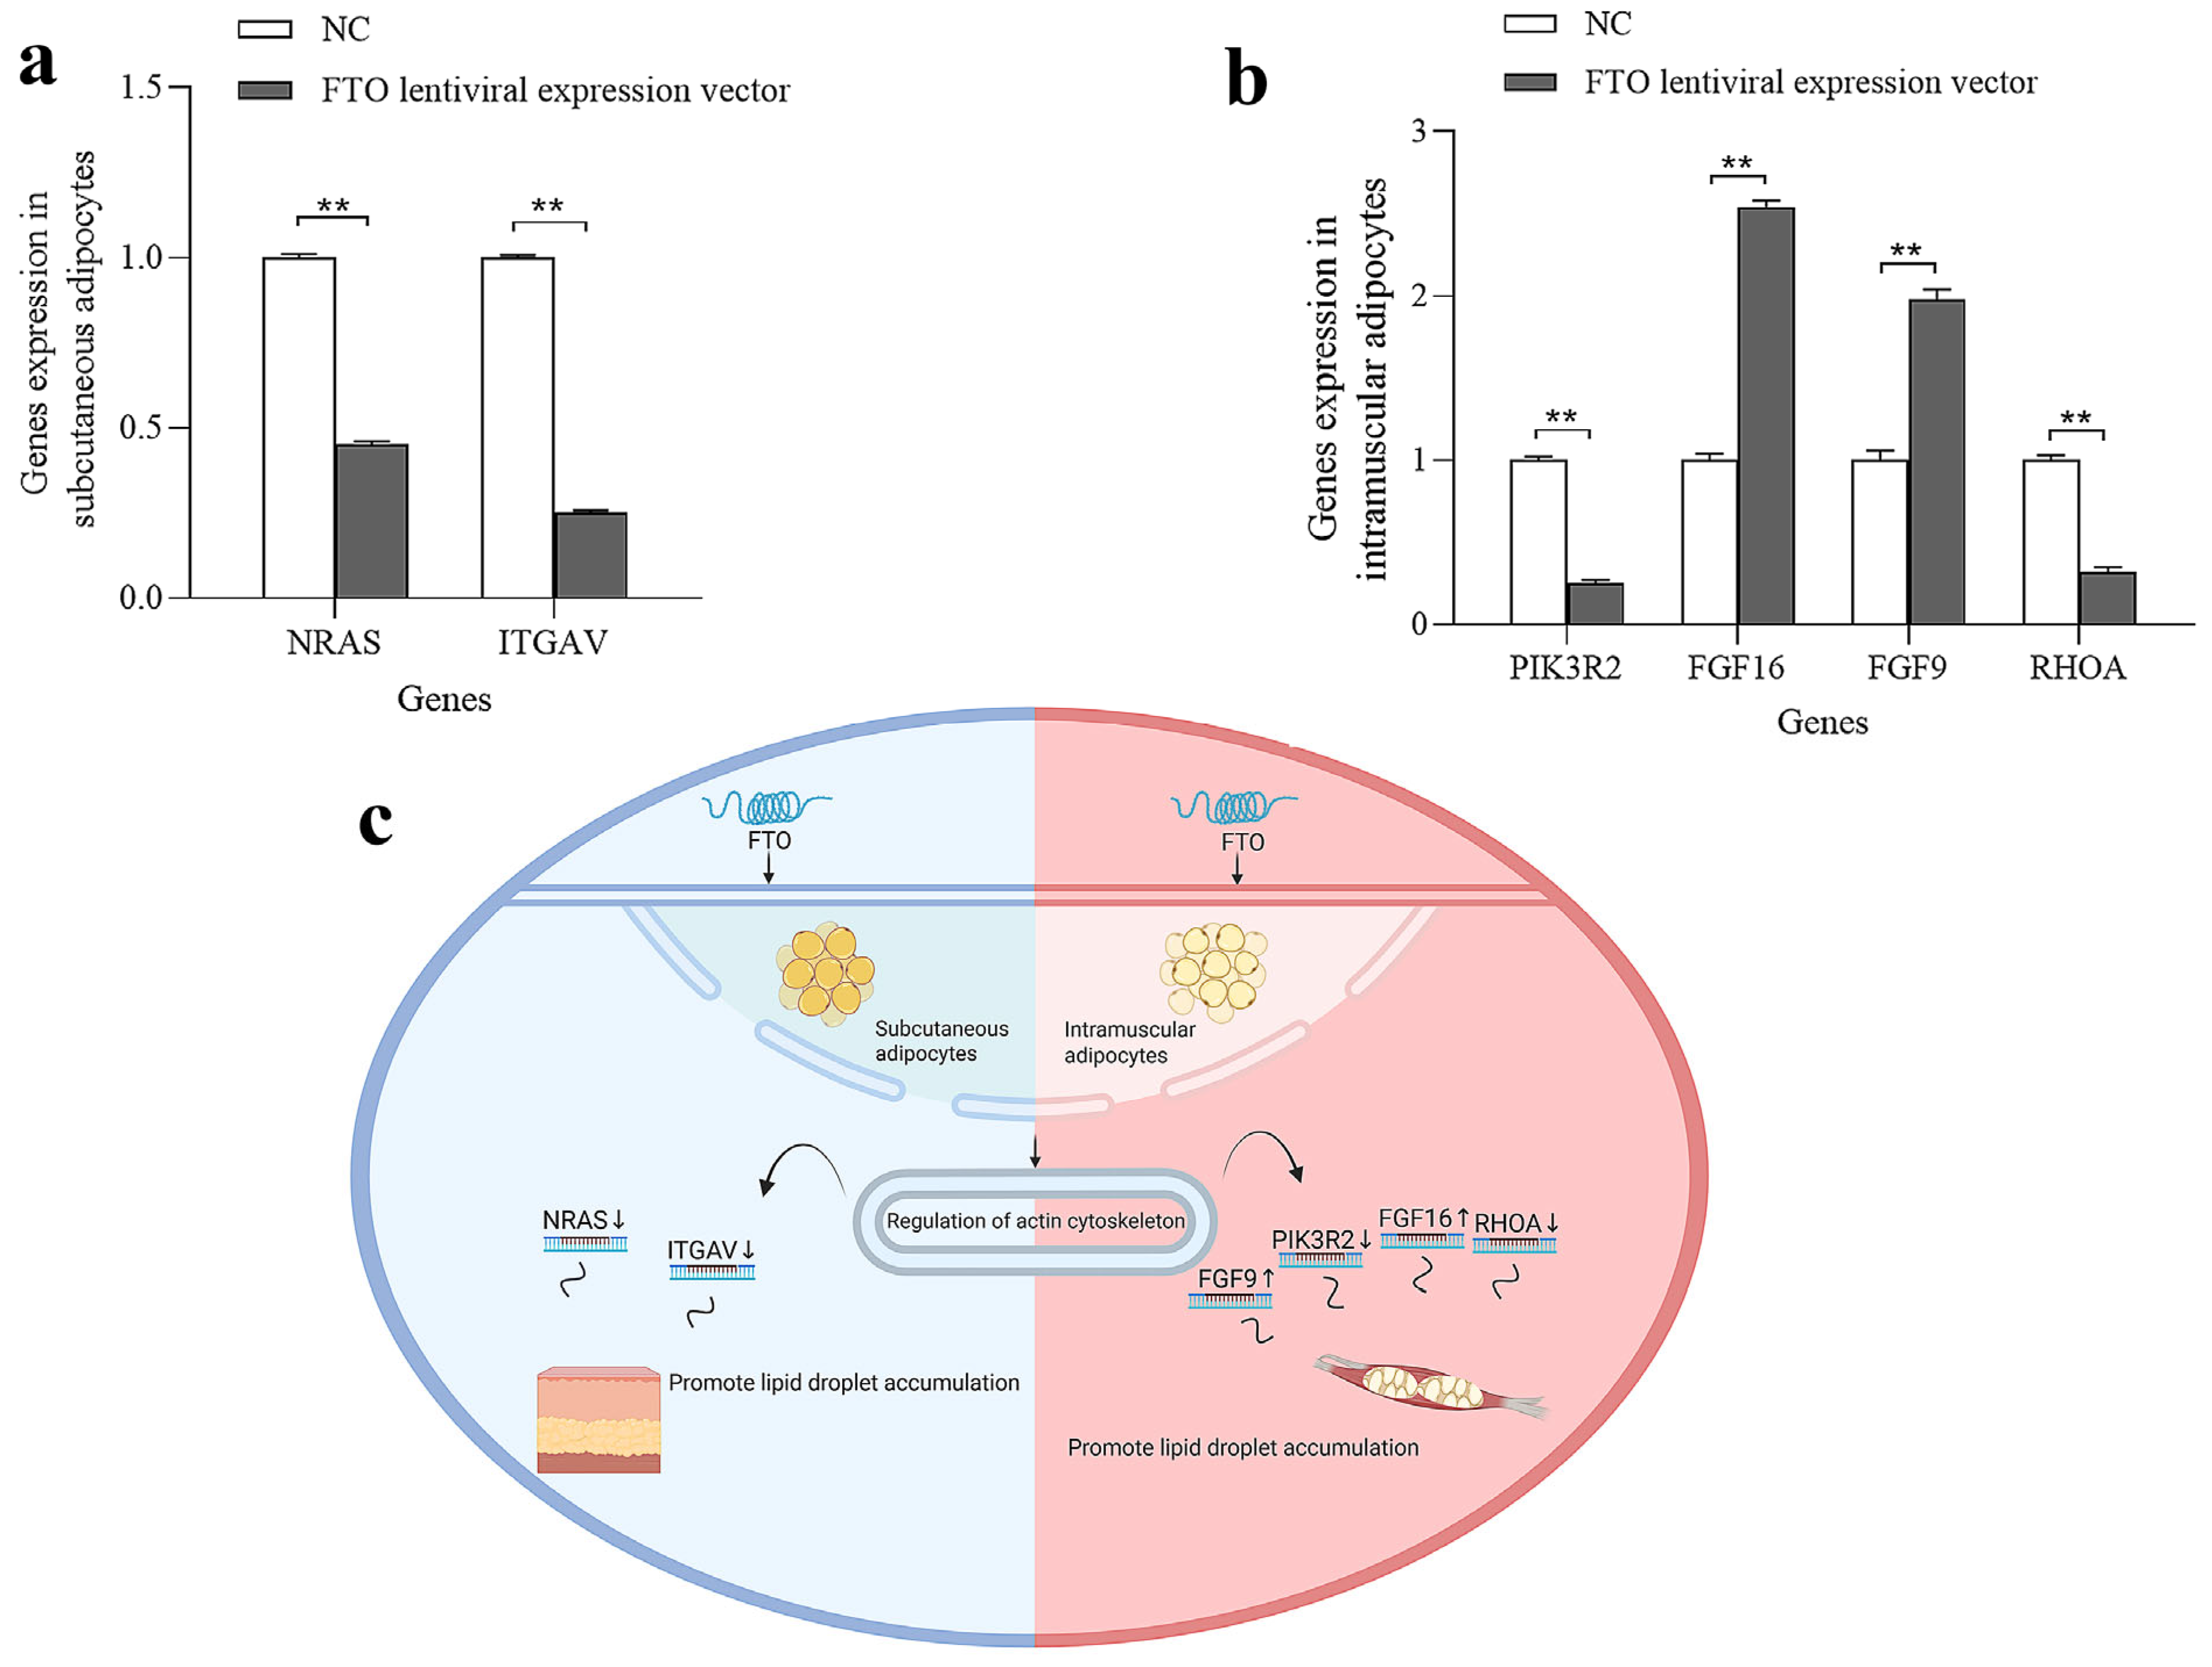
Intersection analysis of significantly enriched pathways responsive to FTO regulation in subcutaneous and intramuscular adipocytes was performed. The results revealed that the regulation of the actin cytoskeleton, MAPK signaling pathway, and cytokine–cytokine receptor interaction were commonly enriched in both cell types. Key genes in subcutaneous adipocytes (NRAS and ITGAV) and key genes in intramuscular adipocytes (PIK3R2, FGF16, FGF9 and RHOA) were significantly enriched in the regulation of the actin cytoskeleton pathway. qPCR verified the consistency of the seven DEGs identified by deep sequencing in terms of the direction of regulation and statistical significance (Figure 9a,b, p < 0.05). Taken together, the regulation of the actin cytoskeleton was identified as the core pathway underlying FTO-regulated lipid deposition in both subcutaneous and intramuscular adipocytes (Figure 9c).

4. Discussion

4.1. Regulatory Role of FTO in Lipid Deposition in Chicken Adipocytes

Based on our previous studies and published literature, we hypothesized that FTO may play an important role in subcutaneous and intramuscular fat deposition in chickens. Accordingly, FTO lentiviral expression vectors were constructed and transfected into primary subcutaneous and intramuscular adipocytes. Changes in adipocyte proliferation and lipid deposition were observed to elucidate the function of FTO in these two cell types. The results showed that overexpression of FTO significantly inhibited proliferation while markedly promoting lipid droplet accumulation in both subcutaneous and intramuscular adipocytes. In contrast, transfection of FTO siRNA significantly increased proliferation while markedly inhibiting lipid droplet accumulation in both cell types. These findings confirmed the role of FTO in regulating fat deposition. This regulatory pattern was consistent with its previously reported positive effect on abdominal fat deposition in chickens [13]. The results of the present study contribute to a deeper understanding of FTO’s function in regulating chicken fat-related traits and provide a foundation for further elucidating the molecular mechanisms underlying subcutaneous and intramuscular fat deposition.

4.2. Pathways and Genes Associated with FTO-Regulated Lipid Deposition in Chicken Subcutaneous Adipocytes

Transcriptome sequencing revealed a total of 413 differentially expressed genes (DEGs) responsive to FTO regulation during lipid deposition in subcutaneous adipocytes, including 98 upregulated and 315 downregulated genes. To further characterize the functions of these DEGs, KEGG enrichment analysis was performed. The results indicated that the DEGs were significantly enriched in 17 signaling pathways, including regulation of the actin cytoskeleton, endocytosis, vascular smooth muscle contraction, focal adhesion, mTOR signaling pathway, autophagy, Apelin signaling pathway, JNK/p38 MAPK signaling pathway, eukaryotic ribosome biogenesis, necroptosis, cytokine–cytokine receptor interaction, N-glycan biosynthesis, mitophagy, TGF-β signaling pathway, and RNA transport, all of which have been confirmed to be involved in lipid metabolism.
Among these pathways, the regulation of the actin cytoskeleton plays a critical role in lipid deposition. Park et al. reported that actin dynamics play a key role in adipogenesis by regulating morphological transformation during the differentiation of mesenchymal stem cells (MSCs) into mature adipocytes [14]. Qiu et al. demonstrated that the transferrin receptor (TFRC) regulates iron homeostasis via endocytosis, and its dysfunction leads to disturbed iron metabolism, inhibiting brown adipocyte differentiation, promoting white adipose expansion, and increasing the risk of obesity [15]. Ma et al. revealed that increased cytosolic Ca2+ signaling in the vascular smooth muscle contraction pathway reduces intestinal lipid levels [16]. Wei et al. found that RhoA/ROCK-mediated cytoskeletal remodeling inhibits adipogenesis and promotes osteogenic differentiation [17]. Xiong et al. reported that activation of focal adhesion enhances intramuscular adipogenesis and differentiation [18]. Li et al. demonstrated that activation of the mTOR signaling pathway increases lipid accumulation in adipose-derived stem cells [19]. Sabaté-Pérez et al. found that autophagy promotes brown adipocyte differentiation and thermogenesis, thereby inhibiting fat deposition [20]. Kim et al. reported that losartan, an angiotensin AT1 receptor antagonist, promotes white adipose browning and reduces lipid deposition by inducing Apelin-mediated AMPK activation [21]. Zhao et al. revealed that pantothenic acid (PA) alleviates lipid metabolism disorders and reduces fat deposition via the JNK/p38 MAPK pathway [22]. In ribosome biogenesis, AMPK activation reduces the expression of lipogenic proteins by inhibiting the mTOR pathway, thereby decreasing triglyceride accumulation [23]. The necroptosis regulator MLKL inhibits PPARγ activity and impedes adipogenesis in its inactive state, whereas activation of MLKL may relieve this inhibition and indirectly promote adipocyte proliferation [24]. Zhang et al. found that the cytokine IL-18 promotes thermogenesis in brown adipose tissue and enhances insulin signaling in white adipose tissue, thus improving metabolic homeostasis [25]. Liu et al. demonstrated that increased activity of core fucosyltransferase (FUT8) in the N-glycosylation pathway exacerbates adipose tissue inflammation and insulin resistance by altering the glycosylation of inflammatory factors, impairing adiponectin function, and aggravating fat deposition [26]. Cremonini et al. reported that activation of the mitophagy pathway (e.g., PINK1/Parkin) promotes white adipose browning and enhances lipolysis [27]. Ma et al. showed that TSH-stimulated hepatocyte exosomes promote triglyceride accumulation in adipocytes via the TGF-β1/ATGL axis [28]. Liu et al. found that m5C modification in RNA transport regulates preadipocyte proliferation and differentiation by controlling the nuclear export of CDKN1A mRNA [29]. Protein–protein interaction (PPI) analysis of DEGs identified CUL1, NRAS, ITGAV, GNAQ, and HSP90AA1 as key genes for FTO-regulated lipid deposition in chicken subcutaneous adipocytes. Among them, NRAS and ITGAV were co-enriched in the regulation of the actin cytoskeleton pathway. Ren et al. found that, as a small GTPase of the RAS family, palmitoylation of NRAS affects its membrane localization and activity, thereby regulating fatty acid uptake and lipid droplet formation [30]. Morandi et al. reported that overexpression of ITGAV in adipose-derived stem cells inhibits TAZ activity in the Hippo signaling pathway, negatively regulates the expression of adipogenic genes such as PPARγ, and thus suppresses adipocyte differentiation [31]. Collectively, FTO may regulate fat deposition by modulating the expression of genes (e.g., NRAS and ITGAV) within the actin cytoskeleton pathway.

4.3. Pathways and Genes Involved in FTO-Regulated Lipid Deposition in Intramuscular Adipocytes

A total of 164 differentially expressed genes (DEGs) responsive to FTO regulation were identified during lipid deposition in intramuscular adipocytes, including 71 upregulated and 93 downregulated genes. These DEGs were significantly enriched in 13 pathways, including focal adhesion, regulation of the actin cytoskeleton, MAPK signaling pathway, gap junction, cytokine–cytokine receptor interaction, FoxO signaling pathway, apoptosis, C-type lectin receptor signaling pathway, and TGF-β signaling pathway. All of these pathways have been reported to be directly or indirectly associated with fat deposition. Studies have shown that insulin stimulation induces actin cytoskeleton remodeling, promoting the translocation of the glucose transporter GLUT4 to the cell membrane, thereby enhancing glucose uptake in adipocytes. Actin depolymerizing agents disrupt this process, leading to insulin resistance. Gelsolin, an actin-severing protein, promotes insulin secretion by regulating actin filament dynamics and coordinating with the MAPK signaling pathway, indirectly affecting lipid metabolism [32]. Adipose tissue-specific knockout of the focal adhesion protein Kindlin-2 in mice results in impaired adipose development, including reduced white and brown adipose mass, accompanied by fatty liver and insulin resistance [33]. cytokine–cytokine receptor interaction is involved in the regulation of lipid metabolism. For example, IL-27 promotes white adipose browning, and its serum levels are decreased in obese individuals [34]. The FoxO signaling pathway is a central regulator of lipid metabolism. Chakrabarti et al. found that FoxO1 directly activates ATGL transcription to promote lipolysis, induces white adipose browning by activating UCP1 and PGC-1α, and enhances fatty acid oxidation [35]. The C-type lectin receptor signaling pathway indirectly affects lipid metabolism. CLR-Dectin-1 is highly expressed in the subcutaneous adipose tissue of obese individuals, positively correlates with BMI, and negatively correlates with adiponectin. In high-fat diet-induced obese mice, Dectin-1 deficiency reduces inflammatory factors in adipose tissue by 40% and improves insulin sensitivity by 25% [36]. The TGF-β signaling pathway regulates lipid metabolism by modulating energy metabolism and fibrosis. The TGF-β/Smad3 axis inhibits PGC-1α expression, reduces mitochondrial biogenesis, decreases energy expenditure, and leads to fat accumulation. In high-fat diet-induced obese mice, Smad3 knockout upregulates adipose browning genes, increases mitochondrial content, improves insulin sensitivity, and reduces body weight gain [37]. Tirosh et al. found that liver-specific knockout of Cx43 in mice reduces endoplasmic reticulum stress and improves insulin sensitivity, glucose tolerance, and lipid metabolism, suggesting that gap junctions indirectly regulate lipid metabolism by affecting hepatic ER stress [38].
To further identify key genes and pathways responsive to FTO regulation, protein–protein interaction (PPI) analysis was performed on differentially expressed genes (DEGs) in significantly enriched pathways. The results showed that PIK3R2, FGF16, FGF9, RHOA, and NGF were identified as key genes for FTO-regulated lipid deposition in chicken intramuscular adipocytes. Among them, PIK3R2, FGF16, FGF9 and RHOA were enriched in the regulation of the actin cytoskeleton pathway. Studies have demonstrated that PIK3R2, FGF16, FGF9, and RHOA are directly or indirectly involved in fat deposition. PIK3R2 promotes the expression of cell cycle-related proteins, such as Cyclin D1, by activating the PI3K-AKT pathway, thereby regulating cell proliferation. During adipocyte differentiation, PIK3R2 enhances the activity of PPARγ and C/EBPα by phosphorylating transcription factors, including FOXO1, thus promoting the differentiation of preadipocytes into mature adipocytes [39]. Mice deficient in PIK3R2 exhibit elevated AMPK phosphorylation in muscle and adipose tissue, promoting fatty acid oxidation and reducing fat accumulation [40]. As a member of the fibroblast growth factor (FGF) family, FGF16 regulates cell proliferation, differentiation, and energy metabolism by activating receptors such as FGFR4. Overexpression of FGF16 significantly promotes lipid droplet accumulation and triglyceride synthesis in goat intramuscular adipocytes, whereas knockdown reduces lipid deposition and downregulates adipogenic genes [41]. In high-fat diet-induced obese mice, local injection of FGF9 increases the proportion of UCP1-positive beige adipocytes in inguinal white adipose tissue from 5% to 18% and reduces lipid deposition by 25% [42]. Inhibition of RHOA alleviates adipose inflammation and obesity in high-fat diet-induced obese mice [43]. The RhoA/ROCK pathway suppresses adipocyte differentiation by regulating PPARγ and actin remodeling [44]. In summary, PIK3R2, FGF16, FGF9, and RHOA play important roles in lipid metabolism in both humans and animals, serving as key genes responsive to FTO-regulated intramuscular fat deposition in chickens.
To further identify key genes and pathways responsive to FTO-regulated lipid deposition, intersection analysis was performed on the significantly enriched pathways in subcutaneous and intramuscular adipocytes. The results revealed that the MAPK signaling pathway, cytokine–cytokine receptor interaction, regulation of the actin cytoskeleton, and Salmonella infection were co-enriched pathways. Among these, regulation of the actin cytoskeleton was identified as the core pathway shared by both subcutaneous and intramuscular adipocytes during lipid deposition. In subcutaneous adipocytes, NRAS and ITGAV were key genes, both of which were enriched in this pathway. In intramuscular adipocytes, genes enriched in this pathway included ITGA1, FGF9, RHOA, PDGFB, PIK3R2, and FGF16, with FGF9, PIK3R2, FGF16, and RHOA acting as key genes. These findings suggest that the FTO regulates lipid deposition in chicken subcutaneous and intramuscular adipocytes by modulating the expression of different genes within the regulation of the actin cytoskeleton pathway.

5. Conclusions

FTO inhibits the proliferation of both subcutaneous and intramuscular adipocytes while promoting fat deposition. FTO differentially regulates lipid deposition in chicken subcutaneous and intramuscular adipocytes by targeting genes involved in the regulation of the actin cytoskeleton pathway. Specifically, NRAS and ITGAV serve as key genes for subcutaneous fat deposition, while FGF9, PIK3R2, FGF16, and RHOA act as key genes for intramuscular fat deposition.

Author Contributions

H.-Y.H. and W.H. conceived and designed the study and performed the experiments. H.-Y.H. and Y.K. drafted the manuscript. Y.-L.S., C.-M.L., Z.-H.Z., L.-L.K., Q.-B.W. and Z.-L.W. collected the samples and analyzed data. All authors have read and agreed to the published version of the manuscript.

Funding

This work was funded by National Key Research and Development Program of China (2021YFD1200803). “JBGS” Project of Seed Industry Revitalisation in Jiangsu Province (JBGS[2021]029).

Institutional Review Board Statement

The animal study protocol was approved by the Ethics Committee of the Scientific Research Department at the Jiangsu Institute of Poultry Science (JQ20230920, 23 September 2023).

Informed Consent Statement

Not applicable.

Data Availability Statement

The original contributions presented in this study are included in the article. Further inquiries can be directed to the corresponding author.

Conflicts of Interest

The authors declare no conflicts of interest.

References

  1. Lu, T.; Gibril, B.A.A.; Xu, J.; Xiong, X. Unraveling the Genetic Foundations of Broiler Meat Quality: Advancements in Research and Their Impact. Genes 2024, 15, 746. [Google Scholar] [CrossRef]
  2. Tang, Z.; Sun, C.; Yan, Y.; Niu, Z.; Li, Y.; Xu, X.; Zhang, J.; Wu, Y.; Li, Y.; Wang, L.; et al. Aberrant Elevation of FTO Levels Promotes Liver Steatosis by Decreasing the m6A Methylation and Increasing the Stability of SREBF1 and ChREBP mRNAs. J. Mol. Cell Biol. 2023, 14, mjac061. [Google Scholar] [CrossRef]
  3. Laber, S.; Cox, R.D. Commentary: FTO Obesity Variant Circuitry and Adipocyte Browning in Humans. Front. Genet. 2015, 6, 318. [Google Scholar] [CrossRef] [PubMed]
  4. Vámos, A.; Arianti, R.; Vinnai, B.Á.; Alrifai, R.; Shaw, A.; Póliska, S.; Guba, A.; Csősz, É.; Csomós, I.; Mocsár, G.; et al. Corrigendum: Human Abdominal Subcutaneous-Derived Active Beige Adipocytes Carrying FTO Rs1421085 Obesity-Risk Alleles Exert Lower Thermogenic Capacity. Front. Cell Dev. Biol. 2023, 11, 1249909. [Google Scholar] [CrossRef]
  5. Yang, Z.; Yu, G.-L.; Zhu, X.; Peng, T.-H.; Lv, Y.-C. Critical Roles of FTO-Mediated mRNA m6A Demethylation in Regulating Adipogenesis and Lipid Metabolism: Implications in Lipid Metabolic Disorders. Genes Dis. 2022, 9, 51–61. [Google Scholar] [CrossRef] [PubMed]
  6. Popović, A.-M.; Huđek Turković, A.; Žuna, K.; Bačun-Družina, V.; Rubelj, I.; Matovinović, M. FTO Gene Polymorphisms at the Crossroads of Metabolic Pathways of Obesity and Epigenetic Influences. Food Technol. Biotechnol. 2023, 61, 14–26. [Google Scholar] [CrossRef]
  7. Ikels, K.; Kuschel, S.; Fischer, J.; Kaisers, W.; Eberhard, D.; Rüther, U. FTO Is a Relevant Factor for the Development of the Metabolic Syndrome in Mice. PLoS ONE 2014, 9, e105349. [Google Scholar] [CrossRef] [PubMed]
  8. Guo, J.; Ren, W.; Li, A.; Ding, Y.; Guo, W.; Su, D.; Hu, C.; Xu, K.; Chen, H.; Xu, X.; et al. Fat Mass and Obesity-Associated Gene Enhances Oxidative Stress and Lipogenesis in Nonalcoholic Fatty Liver Disease. Dig. Dis. Sci. 2013, 58, 1004–1009. [Google Scholar] [CrossRef]
  9. Franczak, A.; Kolačkov, K.; Jawiarczyk-Przybyłowska, A.; Bolanowski, M. Association between FTO Gene Polymorphisms and HDL Cholesterol Concentration May Cause Higher Risk of Cardiovascular Disease in Patients with Acromegaly. Pituitary 2018, 21, 10–15. [Google Scholar] [CrossRef]
  10. Kang, H.; Zhang, Z.; Yu, L.; Li, Y.; Liang, M.; Zhou, L. FTO Reduces Mitochondria and Promotes Hepatic Fat Accumulation through RNA Demethylation. J. Cell. Biochem. 2018, 119, 5676–5685. [Google Scholar] [CrossRef]
  11. Jevsinek Skok, D.; Kunej, T.; Kovac, M.; Malovrh, S.; Potocnik, K.; Petric, N.; Zgur, S.; Dovc, P.; Horvat, S. FTO Gene Variants Are Associated with Growth and Carcass Traits in Cattle. Anim. Genet. 2016, 47, 219–222. [Google Scholar] [CrossRef]
  12. Huang, H.; Liu, L.; Li, C.; Liang, Z.; Huang, Z.; Wang, Q.; Li, S.; Zhao, Z. Fat Mass- and Obesity-Associated (FTO) Gene Promoted Myoblast Differentiation through the Focal Adhesion Pathway in Chicken. 3 Biotech. 2020, 10, 403. [Google Scholar] [CrossRef]
  13. Li, K.; Huang, W.; Wang, Z.; Nie, Q. m6A Demethylase FTO Regulate CTNNB1 to Promote Adipogenesis of Chicken Preadipocyte. J. Anim. Sci. Biotechnol. 2022, 13, 147. [Google Scholar] [CrossRef]
  14. Park, E.; Jeon, H.; Oh, K.-I.; Jeong, J.; Kim, D.-W.; Jin, H.-S.; Jeong, S.-Y. Coactosin-like F-Actin Binding Protein (Cotl1) Plays a Key Role in Adipocyte Differentiation and Obesity. Commun. Biol. 2025, 8, 628. [Google Scholar] [CrossRef]
  15. Qiu, J.; Zhang, Z.; Hu, Y.; Guo, Y.; Liu, C.; Chen, Y.; Wang, D.; Su, J.; Wang, S.; Ni, M.; et al. Transferrin Receptor Levels and Its Rare Variant Are Associated with Human Obesity. J. Diabetes. 2024, 16, e13467. [Google Scholar] [CrossRef] [PubMed]
  16. Ma, P.; Zhang, Y.; Yin, Y.; Wang, S.; Chen, S.; Liang, X.; Li, Z.; Deng, H. Gut Microbiota Metabolite Tyramine Ameliorates High-Fat Diet-Induced Insulin Resistance via Increased Ca2+ Signaling. EMBO J. 2024, 43, 3466–3493. [Google Scholar] [CrossRef] [PubMed]
  17. Wei, L.; Shi, J. Insight into Rho Kinase Isoforms in Obesity and Energy Homeostasis. Front. Endocrinol. 2022, 13, 886534. [Google Scholar] [CrossRef] [PubMed]
  18. Xiong, Y.; Wang, Y.; Xu, Q.; Li, A.; Yue, Y.; Ma, Y.; Lin, Y. LKB1 Regulates Goat Intramuscular Adipogenesis Through Focal Adhesion Pathway. Front. Physiol. 2021, 12, 755598. [Google Scholar] [CrossRef]
  19. Li, Y.; Fu, C.; Liu, L.; Liu, Y.; Li, F. Mechanistic Target of Rapamycin and an Extracellular Signaling-Regulated Kinases 1 and 2 Signaling Participate in the Process of Acetate Regulating Lipid Metabolism and Hormone-Sensitive Lipase Expression. Anim. Biosci. 2022, 35, 1444–1453. [Google Scholar] [CrossRef]
  20. Sabaté-Pérez, A.; Romero, M.; Sànchez-Fernàndez-de-Landa, P.; Carobbio, S.; Mouratidis, M.; Sala, D.; Engel, P.; Martínez-Cristóbal, P.; Villena, J.A.; Virtue, S.; et al. Autophagy-Mediated NCOR1 Degradation Is Required for Brown Fat Maturation and Thermogenesis. Autophagy 2023, 19, 904–925. [Google Scholar] [CrossRef]
  21. Kim, D.Y.; Choi, M.J.; Ko, T.K.; Lee, N.H.; Kim, O.-H.; Cheon, H.G. Angiotensin AT1 Receptor Antagonism by Losartan Stimulates Adipocyte Browning via Induction of Apelin. J. Biol. Chem. 2020, 295, 14878–14892. [Google Scholar] [CrossRef]
  22. Zhao, C.; Wen, Z.; Gao, Y.; Xiao, F.; Yan, J.; Wang, X.; Meng, T. Pantothenic Acid Alleviates Fat Deposition and Inflammation by Suppressing the JNK/P38 MAPK Signaling Pathway. J. Med. Food. 2024, 27, 834–843. [Google Scholar] [CrossRef] [PubMed]
  23. Figarola, J.L.; Rahbar, S. Small-Molecule COH-SR4 Inhibits Adipocyte Differentiation via AMPK Activation. Int. J. Mol. Med. 2013, 31, 1166–1176. [Google Scholar] [CrossRef] [PubMed]
  24. Magusto, J.; Beaupère, C.; Afonso, M.B.; Auclair, M.; Delaunay, J.-L.; Soret, P.-A.; Courtois, G.; Aït-Slimane, T.; Housset, C.; Jéru, I.; et al. The Necroptosis-Inducing Pseudokinase Mixed Lineage Kinase Domain-like Regulates the Adipogenic Differentiation of Pre-Adipocytes. iScience 2022, 25, 105166. [Google Scholar] [CrossRef]
  25. Zhang, X.; Luo, S.; Wang, M.; Cao, Q.; Zhang, Z.; Huang, Q.; Li, J.; Deng, Z.; Liu, T.; Liu, C.-L.; et al. Differential IL18 Signaling via IL18 Receptor and Na-Cl Co-Transporter Discriminating Thermogenesis and Glucose Metabolism Regulation. Nat. Commun. 2022, 13, 7582. [Google Scholar] [CrossRef]
  26. Liu, G.; Chen, L.; Zhao, J.; Jiang, Y.; Guo, Y.; Mao, X.; Ren, X.; Liu, K.; Mei, Q.; Li, Q.; et al. Deciphering the Metabolic Impact and Clinical Relevance of N-Glycosylation in Colorectal Cancer through Comprehensive Glycoproteomic Profiling. Adv. Sci. 2025, 12, e2415645. [Google Scholar] [CrossRef] [PubMed]
  27. Cremonini, E.; Da Silva, L.M.E.; Lanzi, C.R.; Marino, M.; Iglesias, D.E.; Oteiza, P.I. Anthocyanins and Their Metabolites Promote White Adipose Tissue Beiging by Regulating Mitochondria Thermogenesis and Dynamics. Biochem. Pharmacol. 2024, 222, 116069. [Google Scholar] [CrossRef]
  28. Ma, S.; Wang, Y.; Fan, S.; Jiang, W.; Sun, M.; Jing, M.; Bi, W.; Zhou, M.; Wu, D. TSH-Stimulated Hepatocyte Exosomes Modulate Liver-Adipose Triglyceride Accumulation via the TGF-Β1/ATGL Axis in Mice. Lipids Health Dis. 2025, 24, 81. [Google Scholar] [CrossRef]
  29. Liu, Y.; Zhao, Y.; Wu, R.; Chen, Y.; Chen, W.; Liu, Y.; Luo, Y.; Huang, C.; Zeng, B.; Liao, X.; et al. mRNA m5C Controls Adipogenesis by Promoting CDKN1A mRNA Export and Translation. RNA Biol. 2021, 18, 711–721. [Google Scholar] [CrossRef]
  30. Ren, J.-G.; Xing, B.; Lv, K.; O’Keefe, R.A.; Wu, M.; Wang, R.; Bauer, K.M.; Ghazaryan, A.; Burslem, G.M.; Zhang, J.; et al. RAB27B Controls Palmitoylation-Dependent NRAS Trafficking and Signaling in Myeloid Leukemia. J. Clin. Investig. 2023, 133, e165510. [Google Scholar] [CrossRef]
  31. Morandi, E.M.; Verstappen, R.; Zwierzina, M.E.; Geley, S.; Pierer, G.; Ploner, C. ITGAV and ITGA5 Diversely Regulate Proliferation and Adipogenic Differentiation of Human Adipose Derived Stem Cells. Sci. Rep. 2016, 6, 28889. [Google Scholar] [CrossRef]
  32. Tomas, A.; Yermen, B.; Min, L.; Pessin, J.E.; Halban, P.A. Regulation of Pancreatic Beta-Cell Insulin Secretion by Actin Cytoskeleton Remodelling: Role of Gelsolin and Cooperation with the MAPK Signalling Pathway. J. Cell Sci. 2006, 119, 2156–2167. [Google Scholar] [CrossRef] [PubMed]
  33. Gao, H.; Zhou, L.; Zhong, Y.; Ding, Z.; Lin, S.; Hou, X.; Zhou, X.; Shao, J.; Yang, F.; Zou, X.; et al. Kindlin-2 Haploinsufficiency Protects against Fatty Liver by Targeting Foxo1 in Mice. Nat. Commun. 2022, 13, 1025. [Google Scholar] [CrossRef] [PubMed]
  34. Wang, Q.; Li, D.; Cao, G.; Shi, Q.; Zhu, J.; Zhang, M.; Cheng, H.; Wen, Q.; Xu, H.; Zhu, L.; et al. IL-27 Signalling Promotes Adipocyte Thermogenesis and Energy Expenditure. Nature 2021, 600, 314–318. [Google Scholar] [CrossRef]
  35. Chakrabarti, P.; English, T.; Karki, S.; Qiang, L.; Tao, R.; Kim, J.; Luo, Z.; Farmer, S.R.; Kandror, K.V. SIRT1 Controls Lipolysis in Adipocytes via FOXO1-Mediated Expression of ATGL. J. Lipid Res. 2011, 52, 1693–1701. [Google Scholar] [CrossRef]
  36. Al Madhoun, A.; Kochumon, S.; Al-Rashed, F.; Sindhu, S.; Thomas, R.; Miranda, L.; Al-Mulla, F.; Ahmad, R. Dectin-1 as a Potential Inflammatory Biomarker for Metabolic Inflammation in Adipose Tissue of Individuals with Obesity. Cells 2022, 11, 2879. [Google Scholar] [CrossRef] [PubMed]
  37. Yadav, H.; Quijano, C.; Kamaraju, A.K.; Gavrilova, O.; Malek, R.; Chen, W.; Zerfas, P.; Zhigang, D.; Wright, E.C.; Stuelten, C.; et al. Protection from Obesity and Diabetes by Blockade of TGF-β/Smad3 Signaling. Cell Metab. 2011, 14, 67–79. [Google Scholar] [CrossRef]
  38. Tirosh, A.; Tuncman, G.; Calay, E.S.; Rathaus, M.; Ron, I.; Tirosh, A.; Yalcin, A.; Lee, Y.G.; Livne, R.; Ron, S.; et al. Intercellular Transmission of Hepatic ER Stress in Obesity Disrupts Systemic Metabolism. Cell Metab. 2021, 33, 1716. [Google Scholar] [CrossRef]
  39. McCurdy, C.E.; Klemm, D.J. Adipose Tissue Insulin Sensitivity and Macrophage Recruitment: Does PI3K Pick the Pathway? Adipocyte 2013, 2, 135–142. [Google Scholar] [CrossRef]
  40. Wang, J.; Cai, S.; Xiong, Q.; Weng, D.; Wang, Q.; Ma, Z. PIK3R2 Predicts Poor Outcomes for Patients with Melanoma and Contributes to the Malignant Progression via PI3K/AKT/NF-κB Axis. Clin. Transl. Oncol. 2023, 25, 1402–1412. [Google Scholar] [CrossRef]
  41. Huang, K.; Liang, J.J.; Lin, Y.Q.; Zhu, J.J.; Ma, J.Q.; Wang, Y. Molecular Characterization of Fibroblast Growth Factor-16 and Its Role in Promoting the Differentiation of Intramuscular Preadipocytes in Goat. Animal 2020, 14, 2351–2362. [Google Scholar] [CrossRef]
  42. Shamsi, F.; Xue, R.; Huang, T.L.; Lundh, M.; Liu, Y.; Leiria, L.O.; Lynes, M.D.; Kempf, E.; Wang, C.-H.; Sugimoto, S.; et al. FGF6 and FGF9 Regulate UCP1 Expression Independent of Brown Adipogenesis. Nat. Commun. 2020, 11, 1421. [Google Scholar] [CrossRef]
  43. Luo, J.-H.; Wang, F.-X.; Zhao, J.-W.; Yang, C.-L.; Rong, S.-J.; Lu, W.-Y.; Chen, Q.-J.; Zhou, Q.; Xiao, J.; Wang, Y.-N.; et al. PDIA3 Defines a Novel Subset of Adipose Macrophages to Exacerbate the Development of Obesity and Metabolic Disorders. Cell Metab. 2024, 36, 2262–2280.e5. [Google Scholar] [CrossRef]
  44. Ji, Y.; Cao, M.; Liu, J.; Chen, Y.; Li, X.; Zhao, J.; Qu, C. Rock Signaling Control PPARγ Expression and Actin Polymerization during Adipogenesis. Saudi J. Biol. Sci. 2017, 24, 1866–1870. [Google Scholar] [CrossRef]
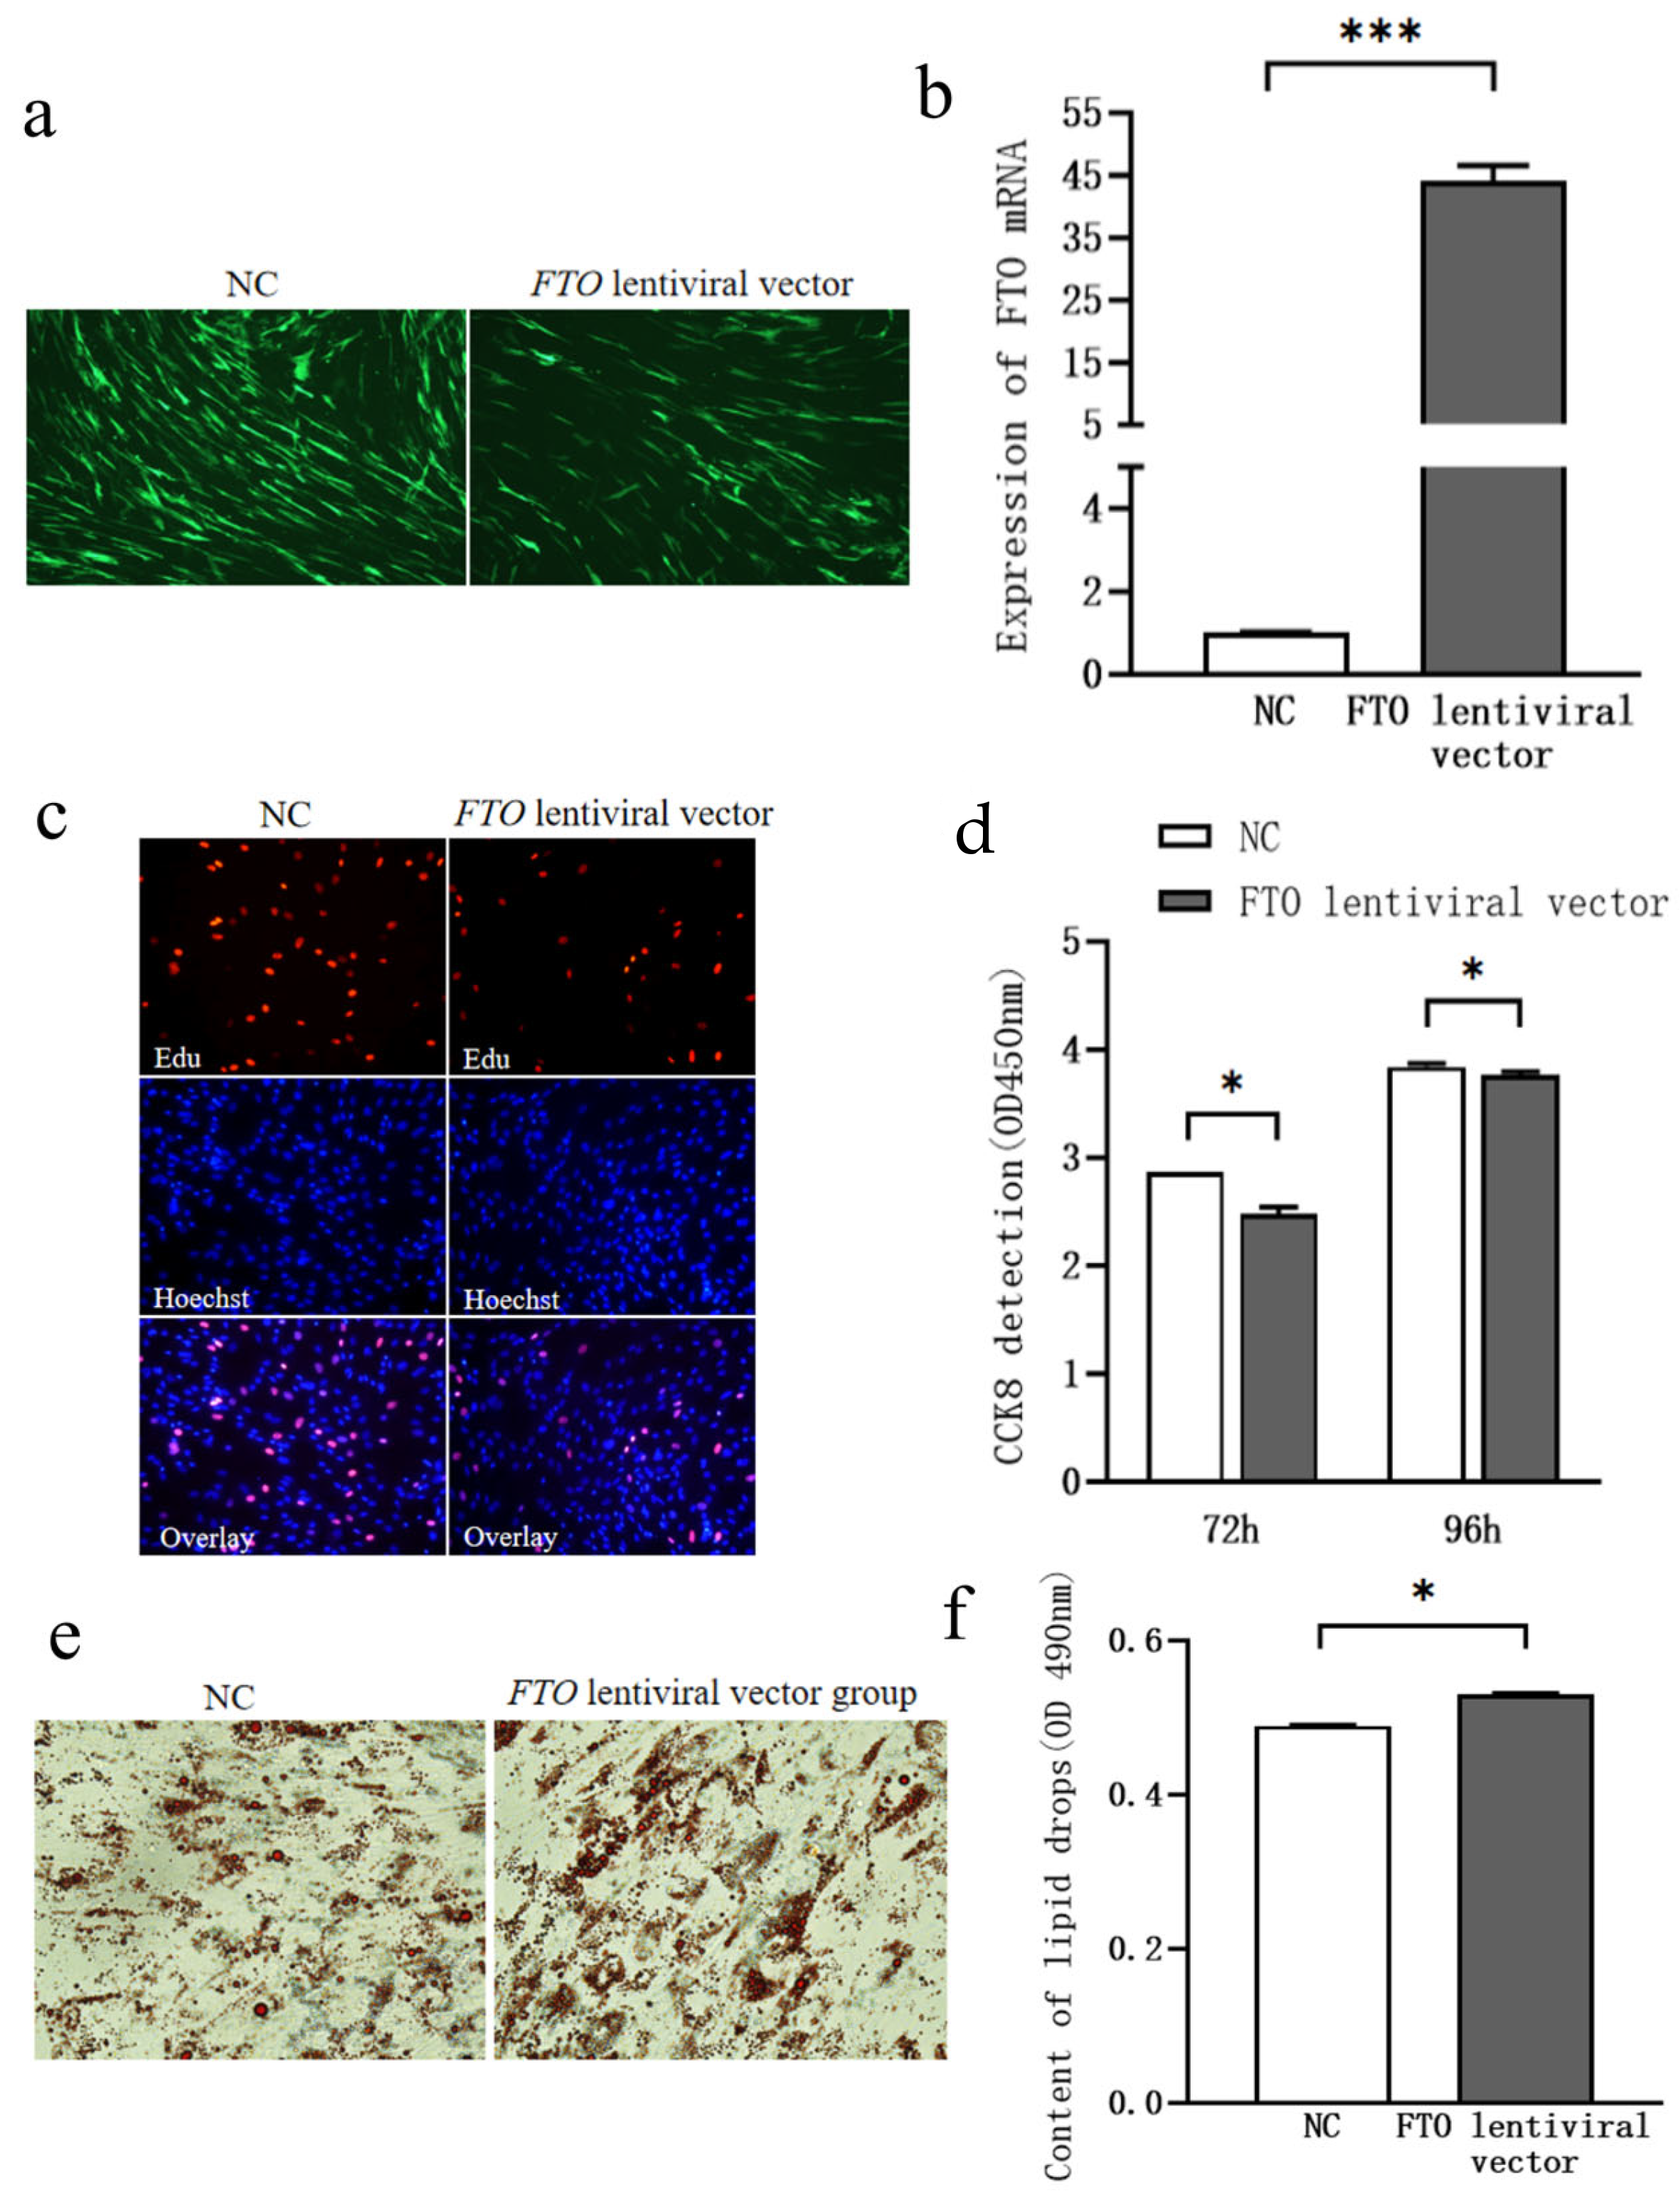
Figure 1. Effect of FTO Overexpression on Lipid Deposition in Chicken Subcutaneous Adipocytes. (a) FTO Lentiviral Expression Vector Transfection (100×); (b) Changes in FTO mRNA Expression Following Exogenous Transfection of the FTO Lentiviral Expression Vector; (c) EdU Staining (200×); (d) Changes in Cell Proliferation Assessed by CCK-8 Assay; (e) Oil Red O Staining (400×); (f) Changes in Lipid Droplet Accumulation. * means p < 0.05, *** means p < 0.001.
Cells 15 00903 g001
Figure 2. Effect of FTO siRNA Transfection on Proliferation and Lipid Droplet Accumulation of Chicken Subcutaneous Adipocytes. (a) Changes in FTO mRNA Expression Following Exogenous Transfection of FTO siRNA; (b) EdU Staining (100×); (c) Changes in Cell Proliferation Assessed by CCK-8 Assay; (d) Changes in Lipid Droplet Accumulation; (e) Oil Red O Staining (400×); ** means p < 0.01, *** means p < 0.001.
Cells 15 00903 g002
Figure 3. Analysis of Transcriptome Sequencing Data in Subcutaneous Adipocytes. (a) Differentially Expressed Genes; (b) GO Enrichment; (c) KEGG Enrichment.
Cells 15 00903 g003
Figure 4. PPI Analysis of Differentially Expressed Genes in Significantly Enriched Pathways of Subcutaneous Adipocytes.
Cells 15 00903 g004
Figure 5. Effect of FTO Overexpression on the Proliferation of Chicken Intramuscular Adipocytes. (a) FTO Lentiviral Expression Vector Transfection (100×); (b) Changes in FTO mRNA Expression Following Exogenous Transfection of the FTO Lentiviral Expression Vector; (c) EdU Staining (200×); (d) Changes in Cell Proliferation Assessed by CCK-8 Assay; (e) Oil Red O Staining (400×); (f) Changes in Lipid Droplet Accumulation. ** means p < 0.01, *** means p < 0.001.
Cells 15 00903 g005
Figure 6. Effect of FTO siRNA Transfection on Proliferation and Lipid Droplet Accumulation in Chicken Intramuscular Adipocytes. (a) Changes in FTO mRNA Expression Following Exogenous Transfection of FTO siRNA; (b) EdU Staining (100×); (c) Changes in Cell Proliferation Assessed by CCK-8 Assay; (d) Changes in Lipid Droplet Accumulation; (e) Oil Red O Staining (400×). ** means p < 0.01, *** means p < 0.001.
Cells 15 00903 g006
Figure 7. Analysis of Transcriptome Sequencing Data in Intramuscular Adipocytes. (a) Differentially Expressed Genes; (b) GO Enrichment; (c) KEGG Enrichment.
Cells 15 00903 g007
Figure 8. PPI Analysis of Differentially Expressed Genes in Significantly Enriched Pathways of Intramuscular Adipocytes.
Cells 15 00903 g008
Figure 9. Key Genes and Pathways Responsive to FTO Regulation. (a) qPCR Validation of FTO-Regulated Key Genes in Subcutaneous Adipocytes; (b) qPCR Validation of FTO-Regulated Key Genes in Intramuscular Adipocytes; (c) Molecular pathways underlying FTO regulation of subcutaneous and intramuscular adipocytes; ** means p < 0.01.
Cells 15 00903 g009
Table 1. Primers of Genes Used in the Real-Time PCR.
GENESSEQUENCE 5′ TO3 ′
β-ACTINF: 5′GTCCACCTTCCAGCAGATGT3′
R: 5′ATAAAGCCATGCCAATCTCG3′
FTOF: 5′CTGGTCCTCCAGAAGTTCG3′
R: 5′CTGCTCTTCTGGCAAGCTCT3′
NRASF: 5′CCAGCTCATCCAGAACCACTT3′
R: 5′TCCTGCAGTGTCCAGAATGTC3′
ITGAVF: 5′GACGCCTCCTCGATGTTTCT3′
R: 5′ATACAATGGGGCACAAGCCA3′
FGF9F: 5′TTTATTGGCCACGTGAGGCT3′
R: 5′GCCACAAAGTAAAGCCCAGC3′
FGF16F: 5′CACTTTTTACCGAGGCCCGT3′
R: 5′TGGGAAAAAGCTTGGGAGCC3′
RHOAF: 5′CCTGTGGAGCAGGAAGCG3′
R: 5′AAGCCAACTCCACCTGCTTT3′
PIK3R2F: 5′TTCGGGGAGGTTCGTTCTTC3′
R: 5′TCCAGCCCGTTCCTTCTTTC3′
FTO-205S: 5′CCAGAUAUUCCAAGCUAAUTT3′
A: 5′AUUAGCUUGGAAUAUCUGGTT3′
FTO-858S: 5′GCUGAAGAAGCUACUGAUUTT3′
A: 5′AAUCAGUAGCUUCUUCAGCTT3′
FTO-1286S: 5′GCUUAAGCCUAUGGCUAAATT3′
A: 5′UUUAGCCAUAGGCUUAAGCTT3′
Table 2. Significantly Enriched Pathways of Differentially Expressed Genes in Subcutaneous Adipocytes.
Pathwayp ValueGenes
Regulation of actin cytoskeleton0.0006LPAR4, ITGAV, NRAS, ITGA4, ITGB8, PDGFRA, BRAF, ROCK1
CRKL, PPP1R12A, ROCK2
Endocytosis0.0008RAB22A, RAB10, PARD6B, DAB2, CHMP1A, CHMP6, STAM, EEA1
PDGFRA, ARAP2, IGF2R, ARHGEF3
Vascular smooth muscle contraction0.0013EDN3, EDNRA, ROCK1, BRAF, MRVI1, PPP1R12A, ROCK2, GNAQ
Focal adhesion0.0021ARHGAP5, ITGAV, ITGA4, ITGB8, PDGFRA, BRAF, ROCK1,
CRKL, PPP1R12A, ROCK2
mTOR signaling pathway0.0036RPS6KA3, RICTOR, CAB39, FZD1, ATP6V1D, BRAF, NRAS, FNIP2
Autophagy—animal0.0050UVRAG, RB1CC1, NRAS, EIF2AK4, RAB33B, GABARAPL1, IRS4
Apelin signaling pathway0.0055NOV, GNB4, NRAS, GNB, GABARAPL1, PIK3CG, GNAQ
MMAPK signaling pathway0.0066RPS6KA3, RASA2, NGF, ATF2, PDGFRA, BRAF, NRAS, CRKL,
IL1R1, STK4, MAP4K3
Ribosome biogenesis in eukaryotes0.0073SBDS, BMS1, HEATR1, XRN1, XPO1
Necroptosis0.0089SMPD1, CHMP1A, CHMP6, HSP90AA1, PARP4, JAK2, FADD
cytokine–cytokine receptor interaction0.0096TNFSF15, IL18, NGF, CXCR7, BMPR2, EDA, INHBA, IL1R1, CCL4
N-Glycan biosynthesis0.0120ALG2, MAN2A1, B4GALT2, B4GALT1
Mitophagy-animal0.0204GABARAPL1, NRAS, TAX1BP1, USP15
TGF-beta signaling pathway0.0221INHBA, CUL1, ROCK1, BMPR2, DCN
RNA transport0.0293THOC2, TACC3, UBE2I, TPR, EIF1B, XPO1
Salmonella infection0.0360CCL4, IL18, ROCK1, ROCK2
Hedgehog signaling pathway0.0375EVC, CUL1, SPOPL
Table 3. Significantly Enriched Pathways of Differentially Expressed Genes in Intramuscular Adipocytes.
Pathwayp ValueGenes
MAPK signaling pathway0.014HGF, FGF9, PDGFB, NGF, AKT3, FGF16
cytokine–cytokine receptor interaction0.018IL18, NGF, BMP15, IFNGR2, IL4R
FoxO signaling pathway0.014CDKN2B, CDKN2A, PIK3R2, AKT3, FOXO4
TGF-beta signaling pathway0.031CDKN2B, CDKN2A, SMAD6, RHOA
Focal adhesion pathway0.003HGF, ITGA1, RHOA, PDGFB, PIK3R2, AKT3
Regulation of actin cytoskeleton0.003ITGA1, FGF9, RHOA, PDGFB, PIK3R2, FGF16
Gap junction0.001TUBA4A, HTR2B, TUBB4B, PDGFB, GJA1
Apoptosis0.016TUBA4A, NGF, PIK3R2, AKT3
Toll-like receptor signaling pathway0.026TLR5, PIK3R2, AKT3
C-type lectin receptor signaling pathway0.029RHOA, PIK3R2, AKT3
Salmonella infection0.002TLR5, IFNGR2, IL18, RHOG
Influenza A0.019IFNGR2, IL18, PIK3R2, AKT3
AGE-RAGE signaling pathway in diabetic complications0.031PIM1, PIK3R2, AKT3
Disclaimer/Publisher’s Note: The statements, opinions and data contained in all publications are solely those of the individual author(s) and contributor(s) and not of MDPI and/or the editor(s). MDPI and/or the editor(s) disclaim responsibility for any injury to people or property resulting from any ideas, methods, instructions or products referred to in the content.