
Accumulation of Small-Size, Highly Dispersive Mesoporous Silica Nanoparticles in a Tumor in Both Chorioallantoic Membrane and Mouse Models

 , , ,
, , ,
Abstract
1. Introduction
2. Materials and Methods
2.1. Chemicals
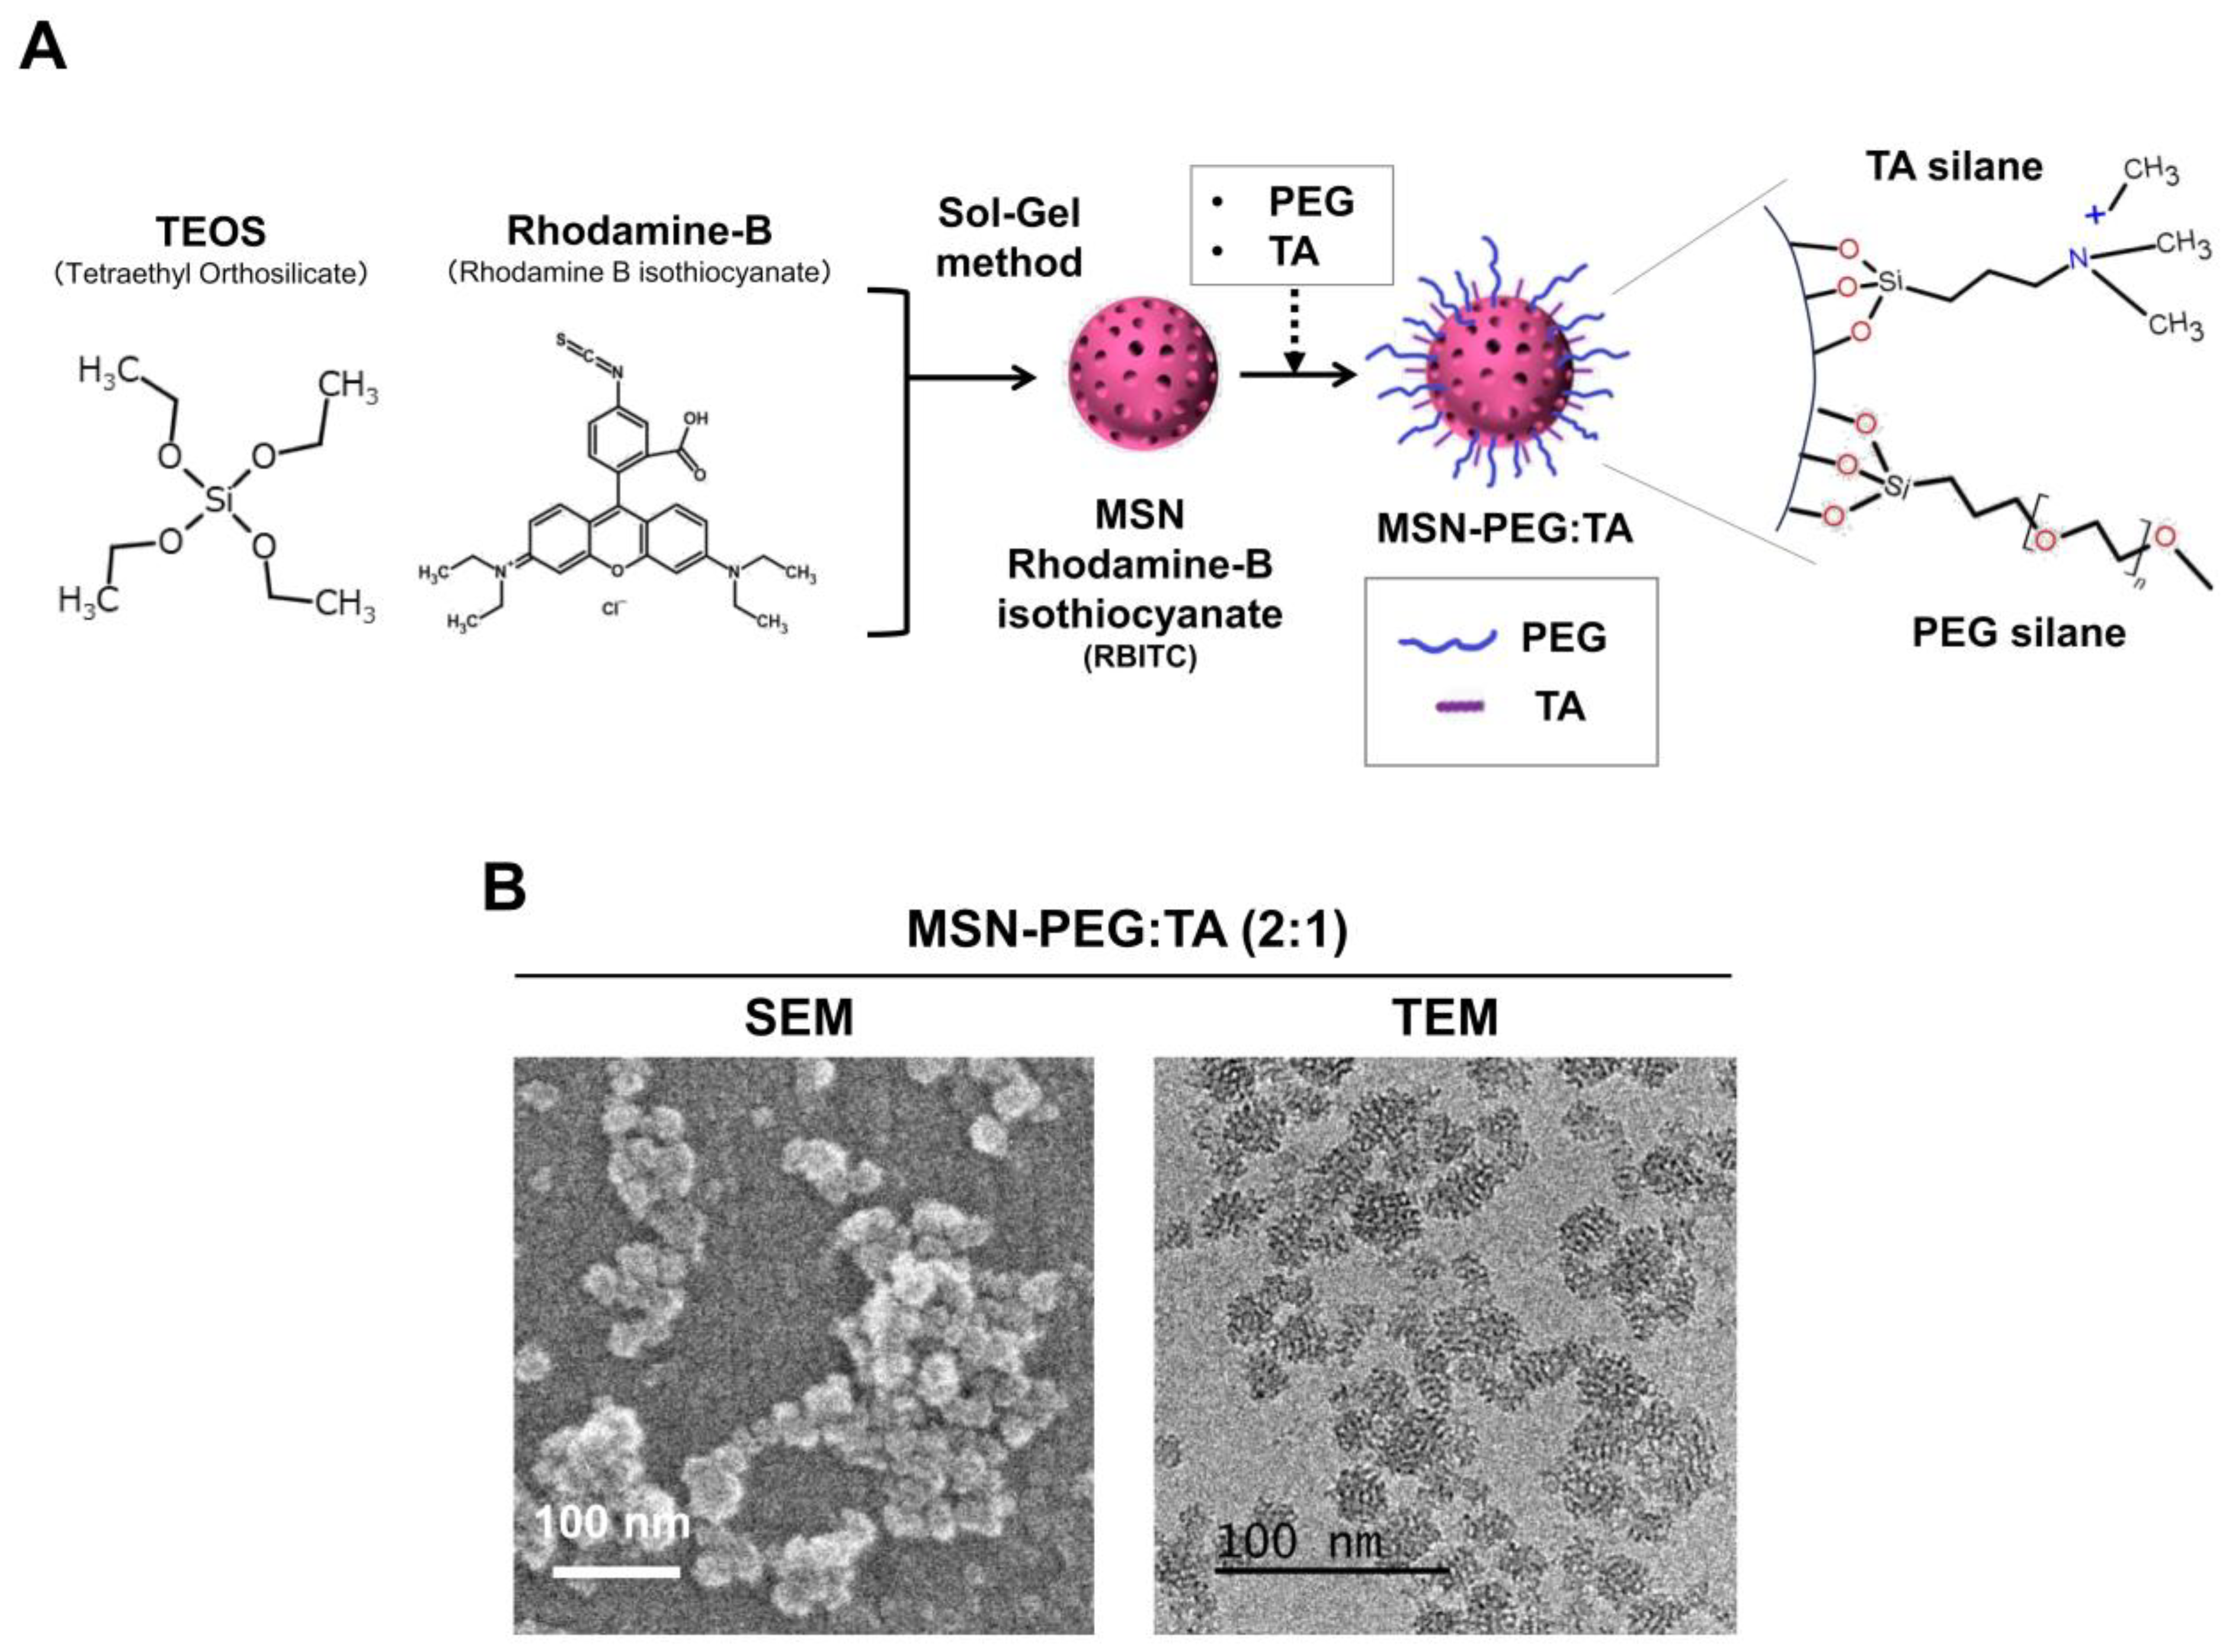
2.2. Preparation and Characterization of MSN-PEG/TA
2.3. Cells and Media
2.4. Mouse Model
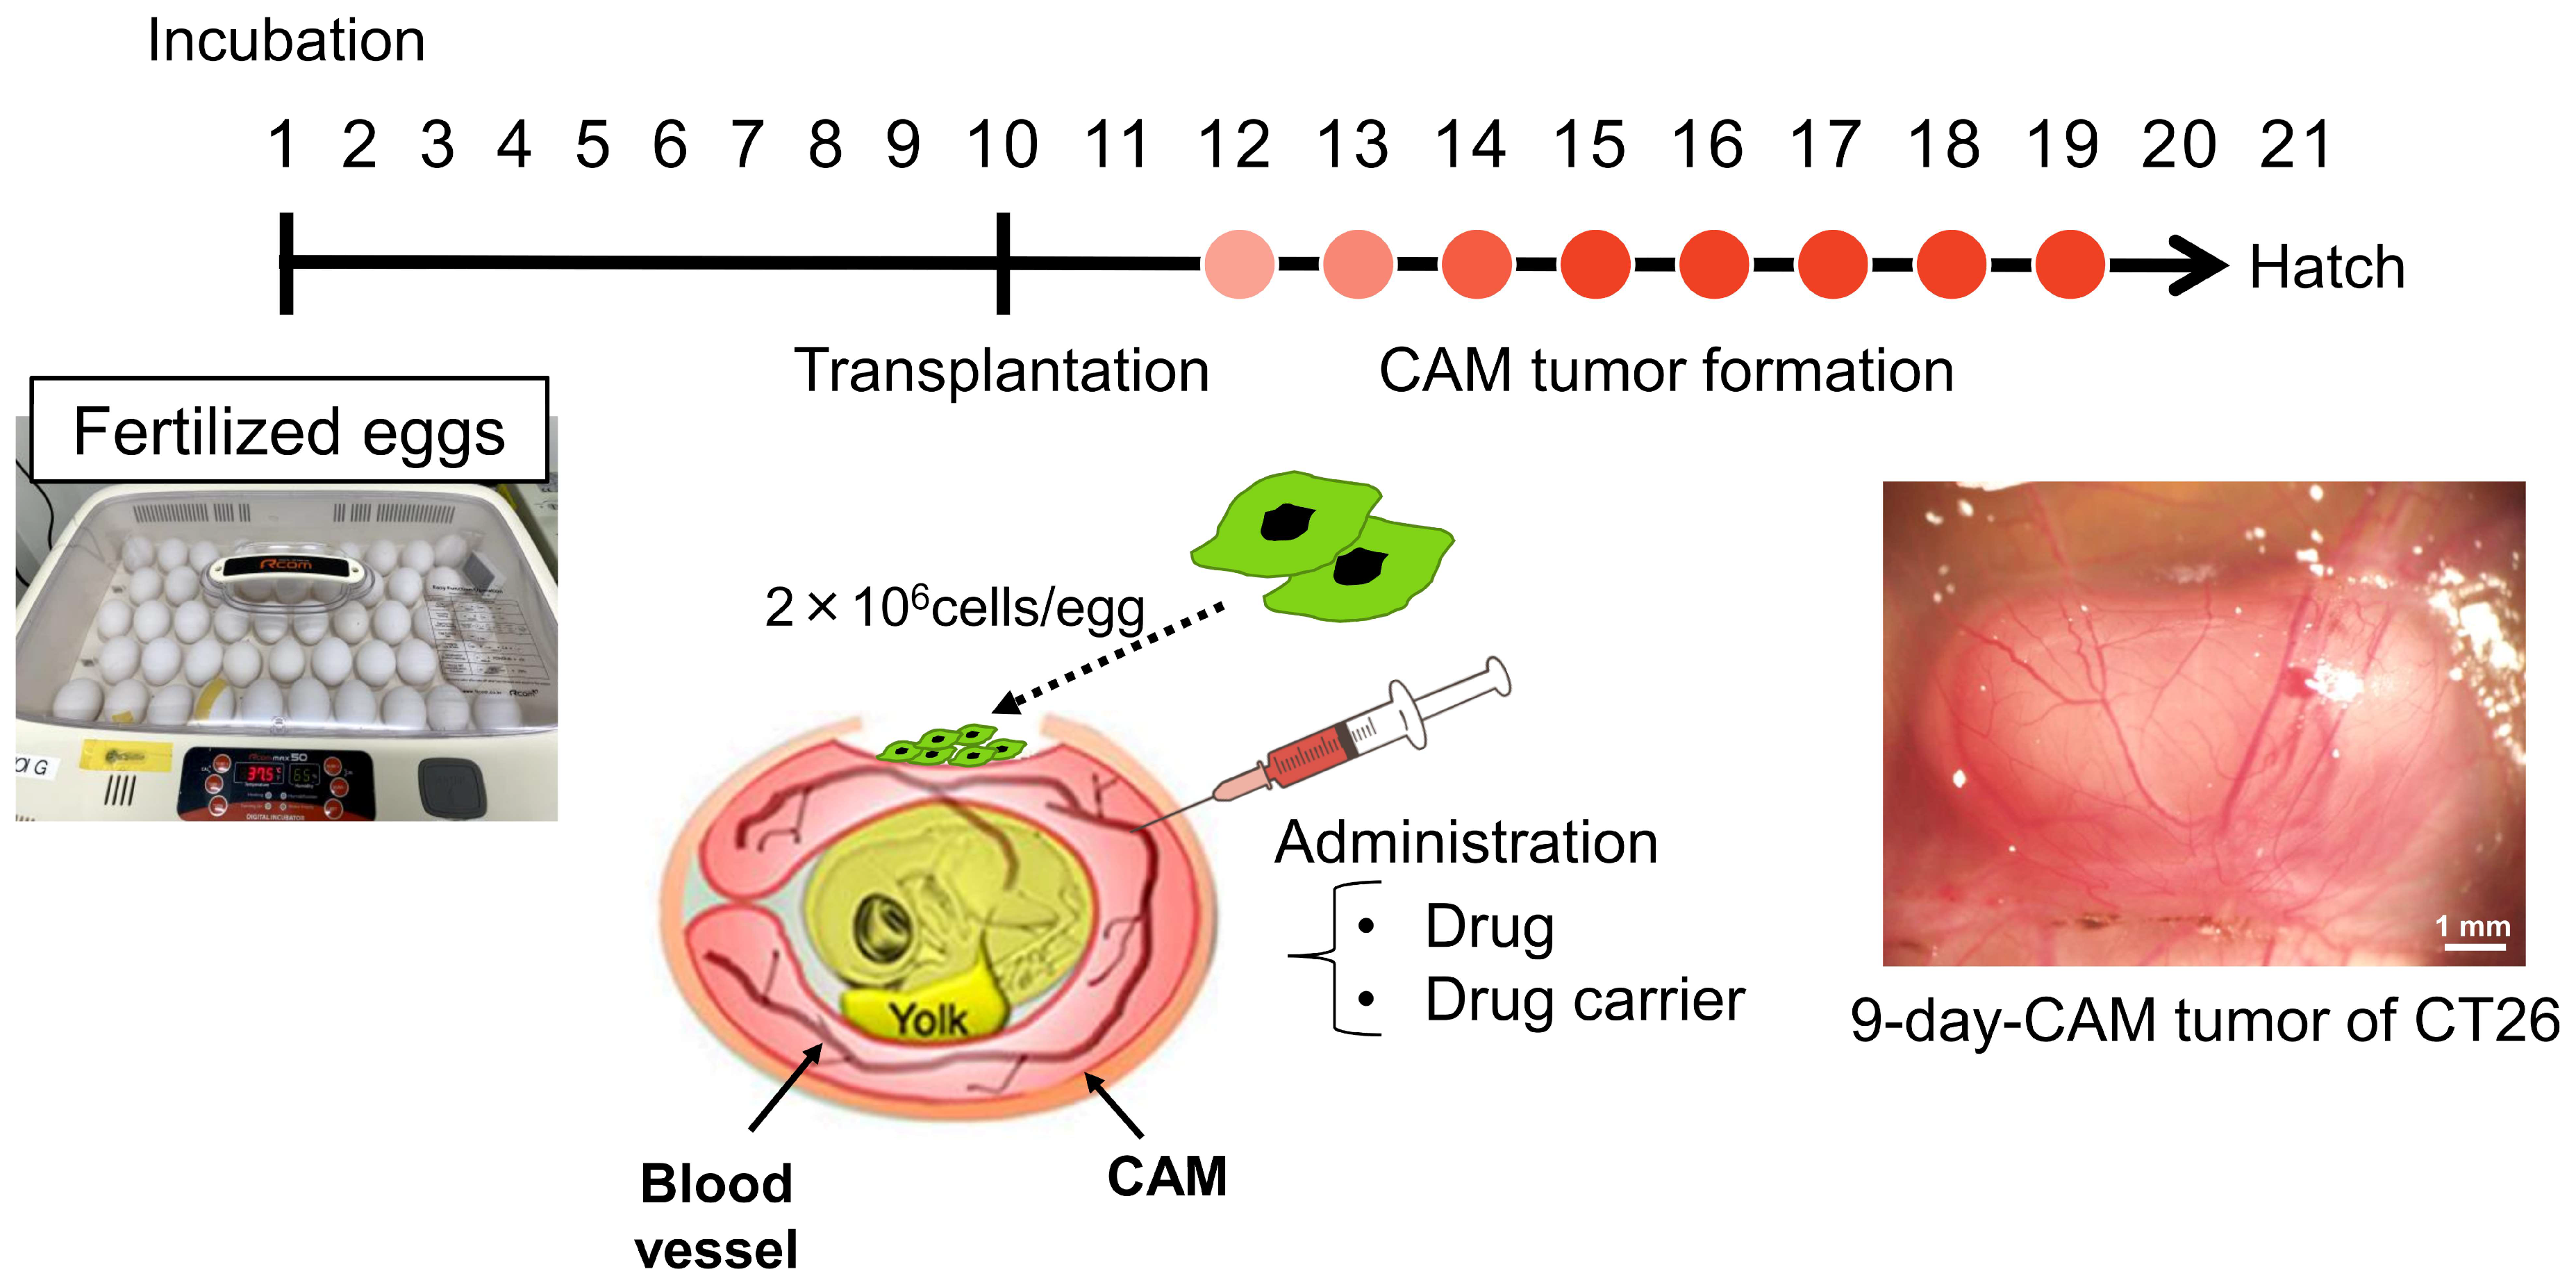
2.5. CAM Model
2.6. Biodistribution Study
2.7. Tissue Ashing and Inductively Coupled Plasma Optical Emission Spectrometry (ICP-OES)
2.8. Histological Analysis of Tumors in the Mouse and CAM Models
3. Results
3.1. CAM Models Established from Various Human Cancer Cell Lines
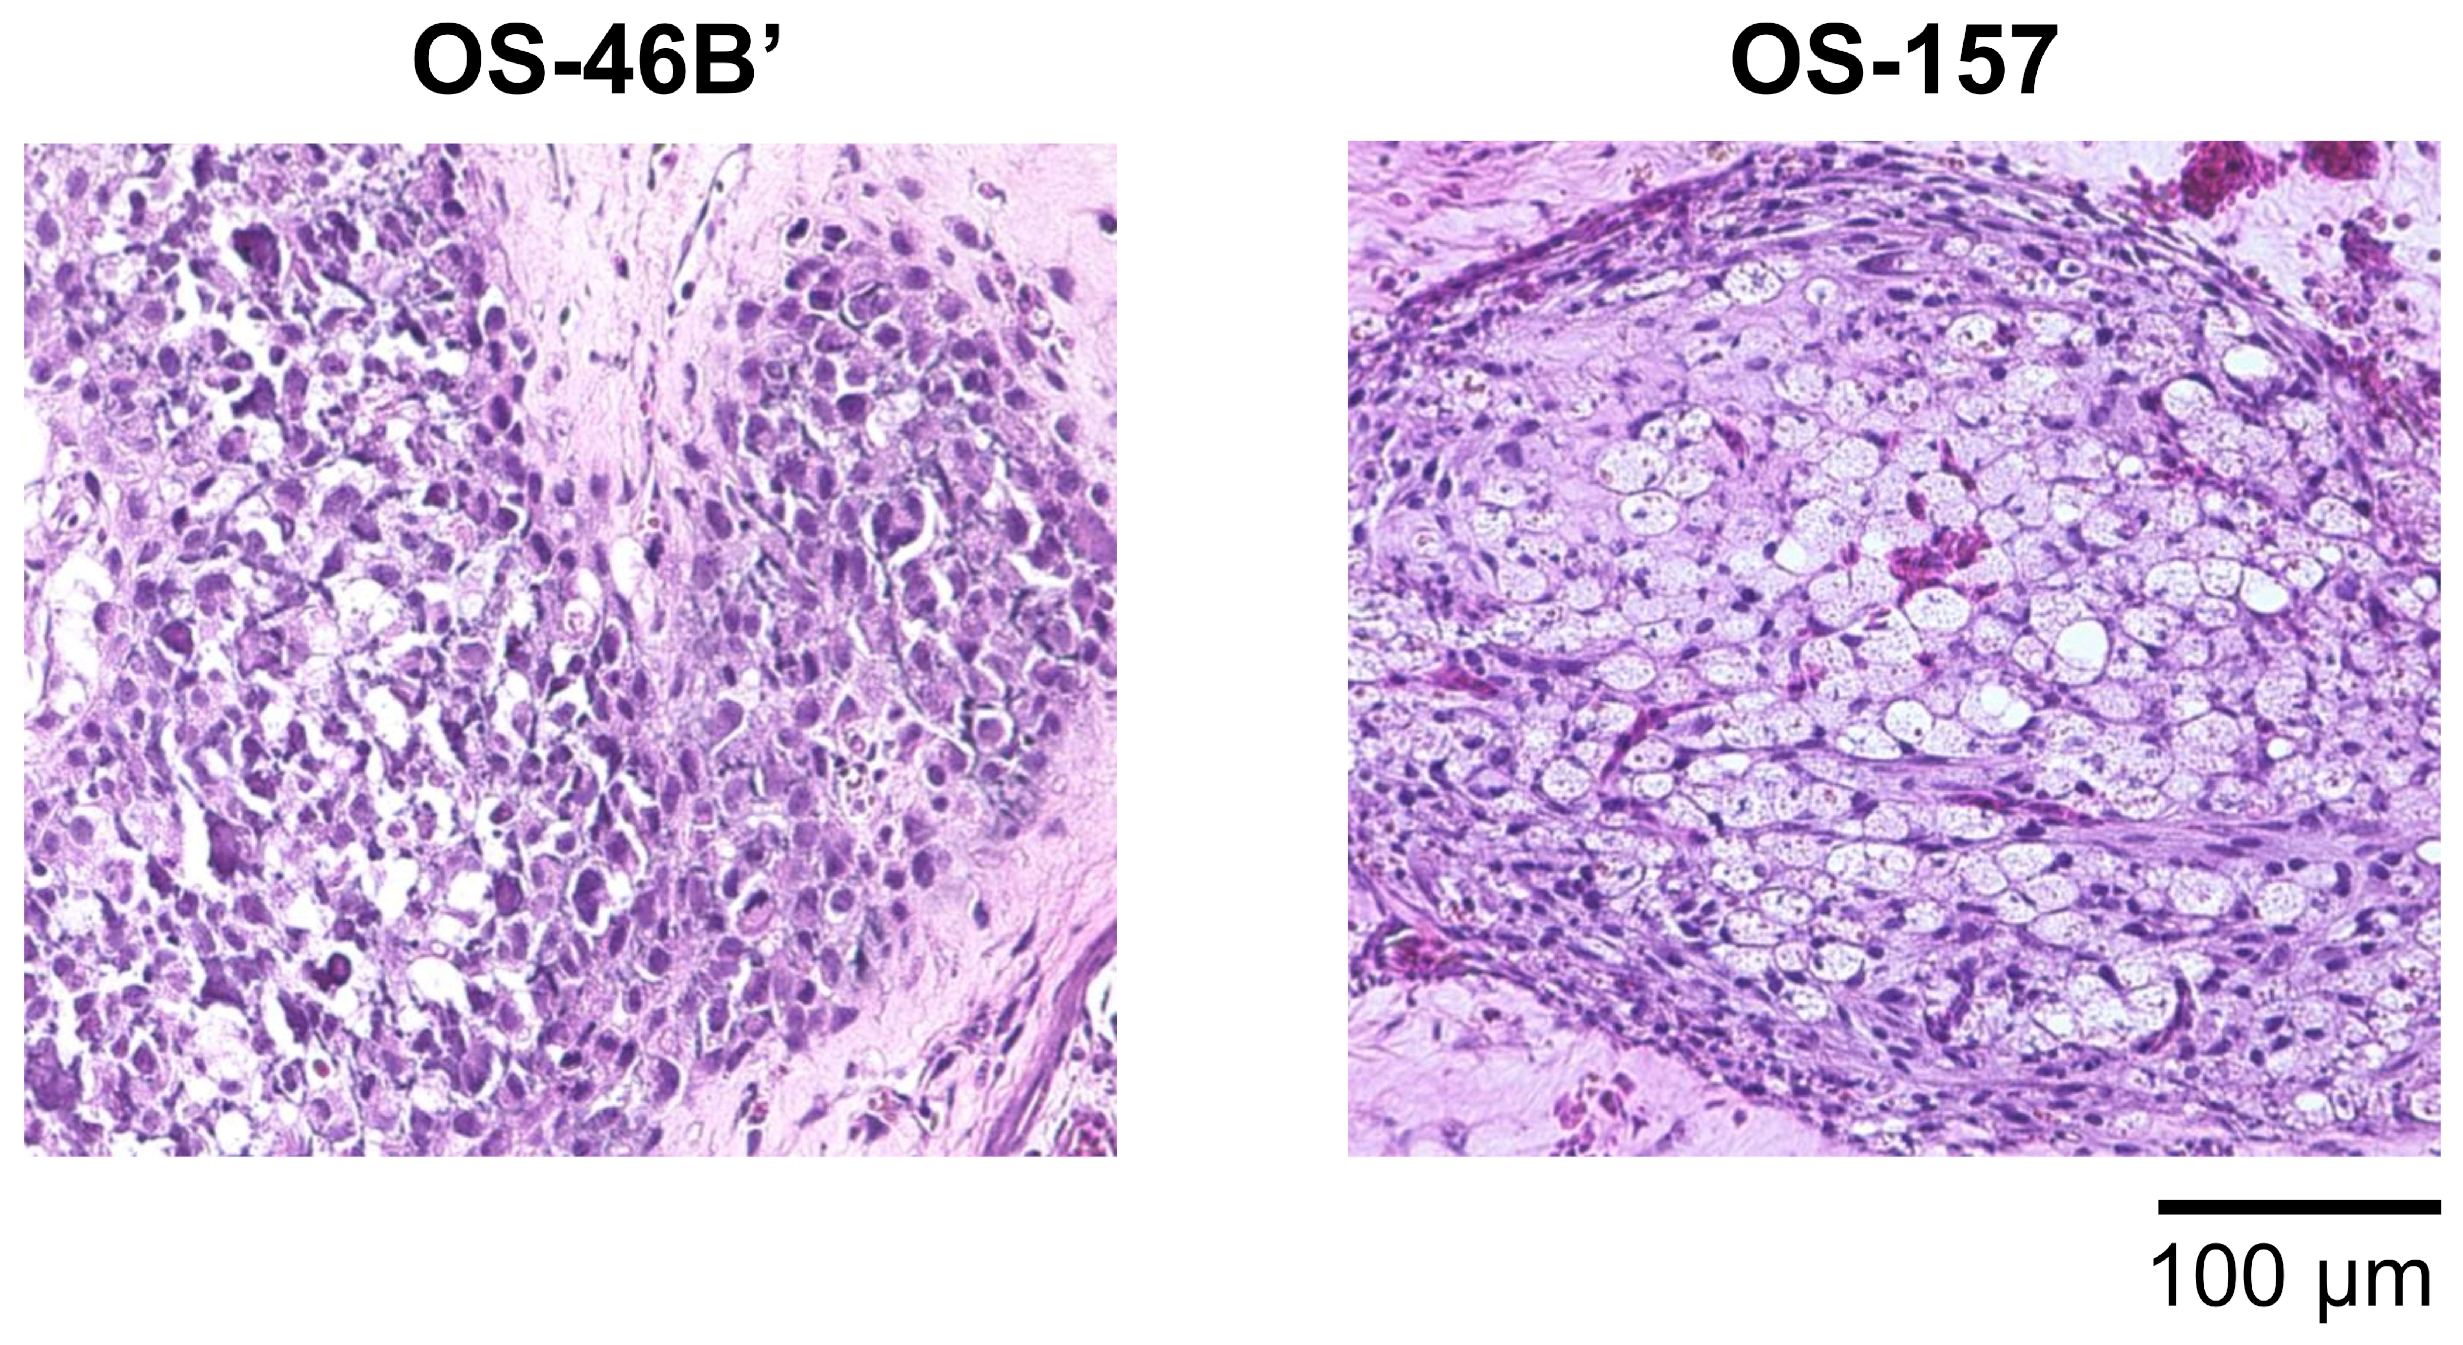
3.2. CAM Models Established from Patient-Derived Osteosarcoma Cell Lines
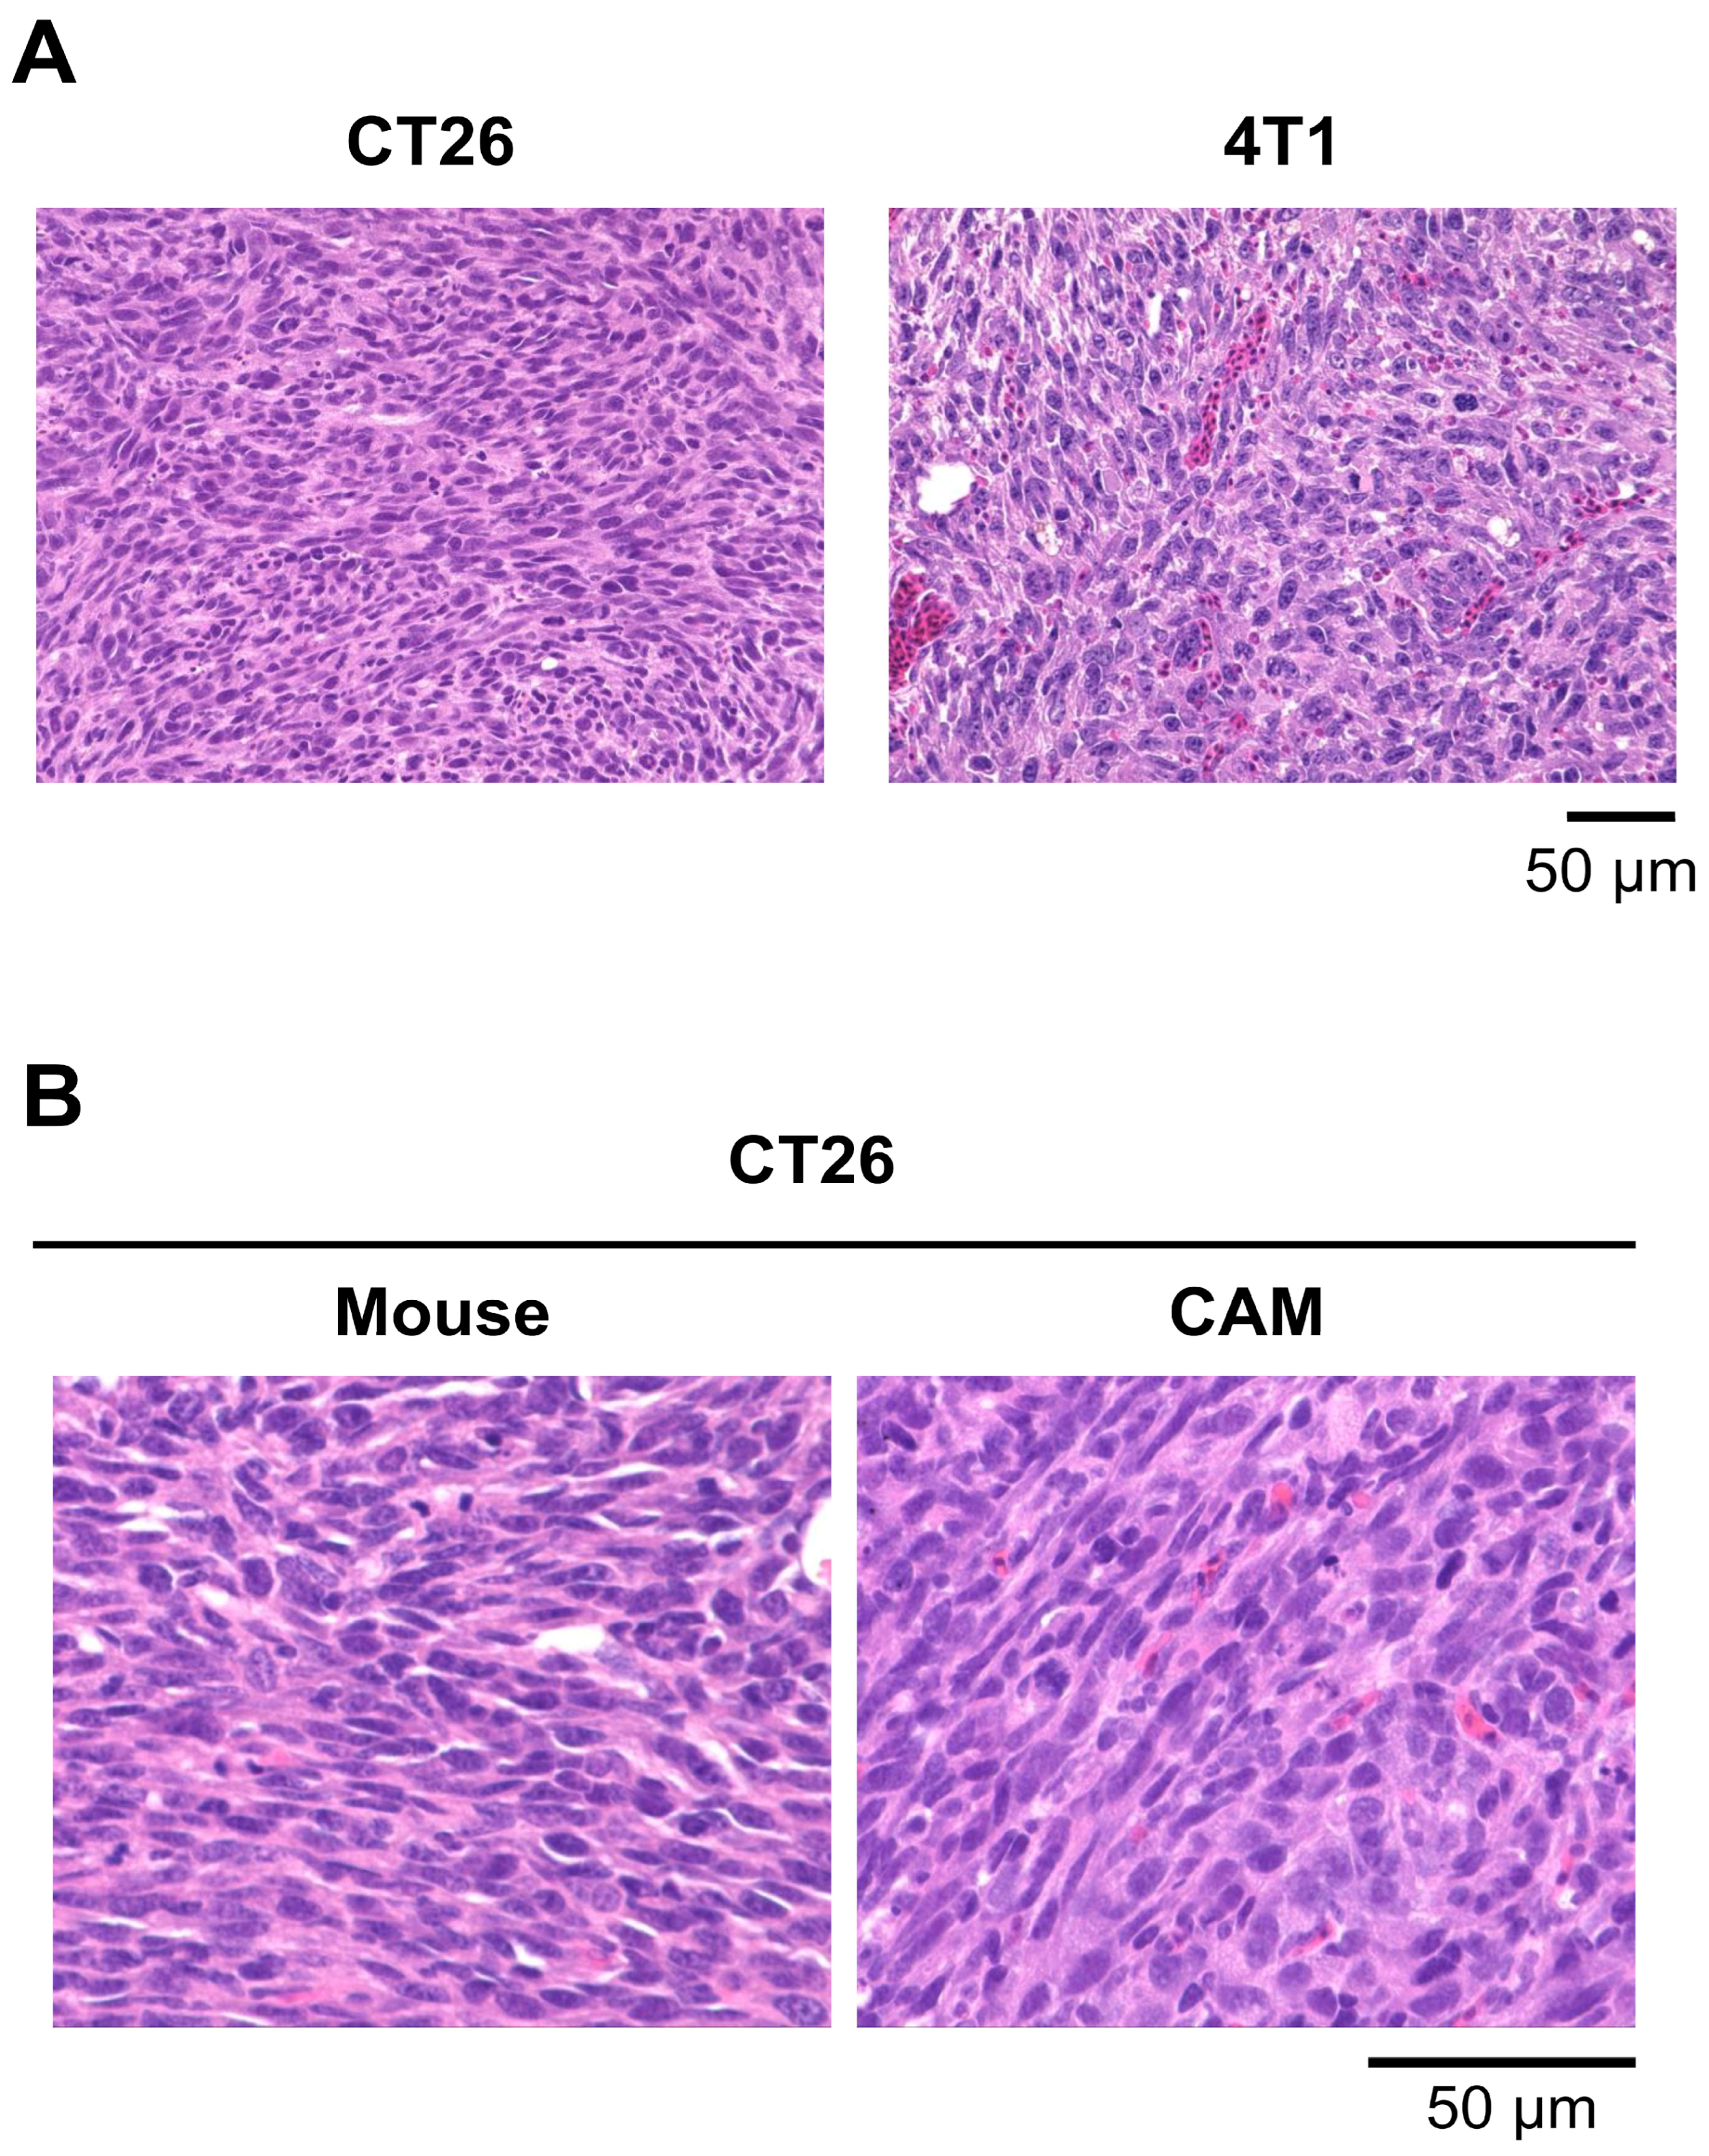
3.3. CAM Models Established from Mouse Cell Lines
3.4. Two Types of Positively Charged, Small-Size, Highly Dispersive MSNs (sdMSNs)
3.5. Characterization of Tumor Accumulation of sdMSNs Using the CAM and Mouse Models
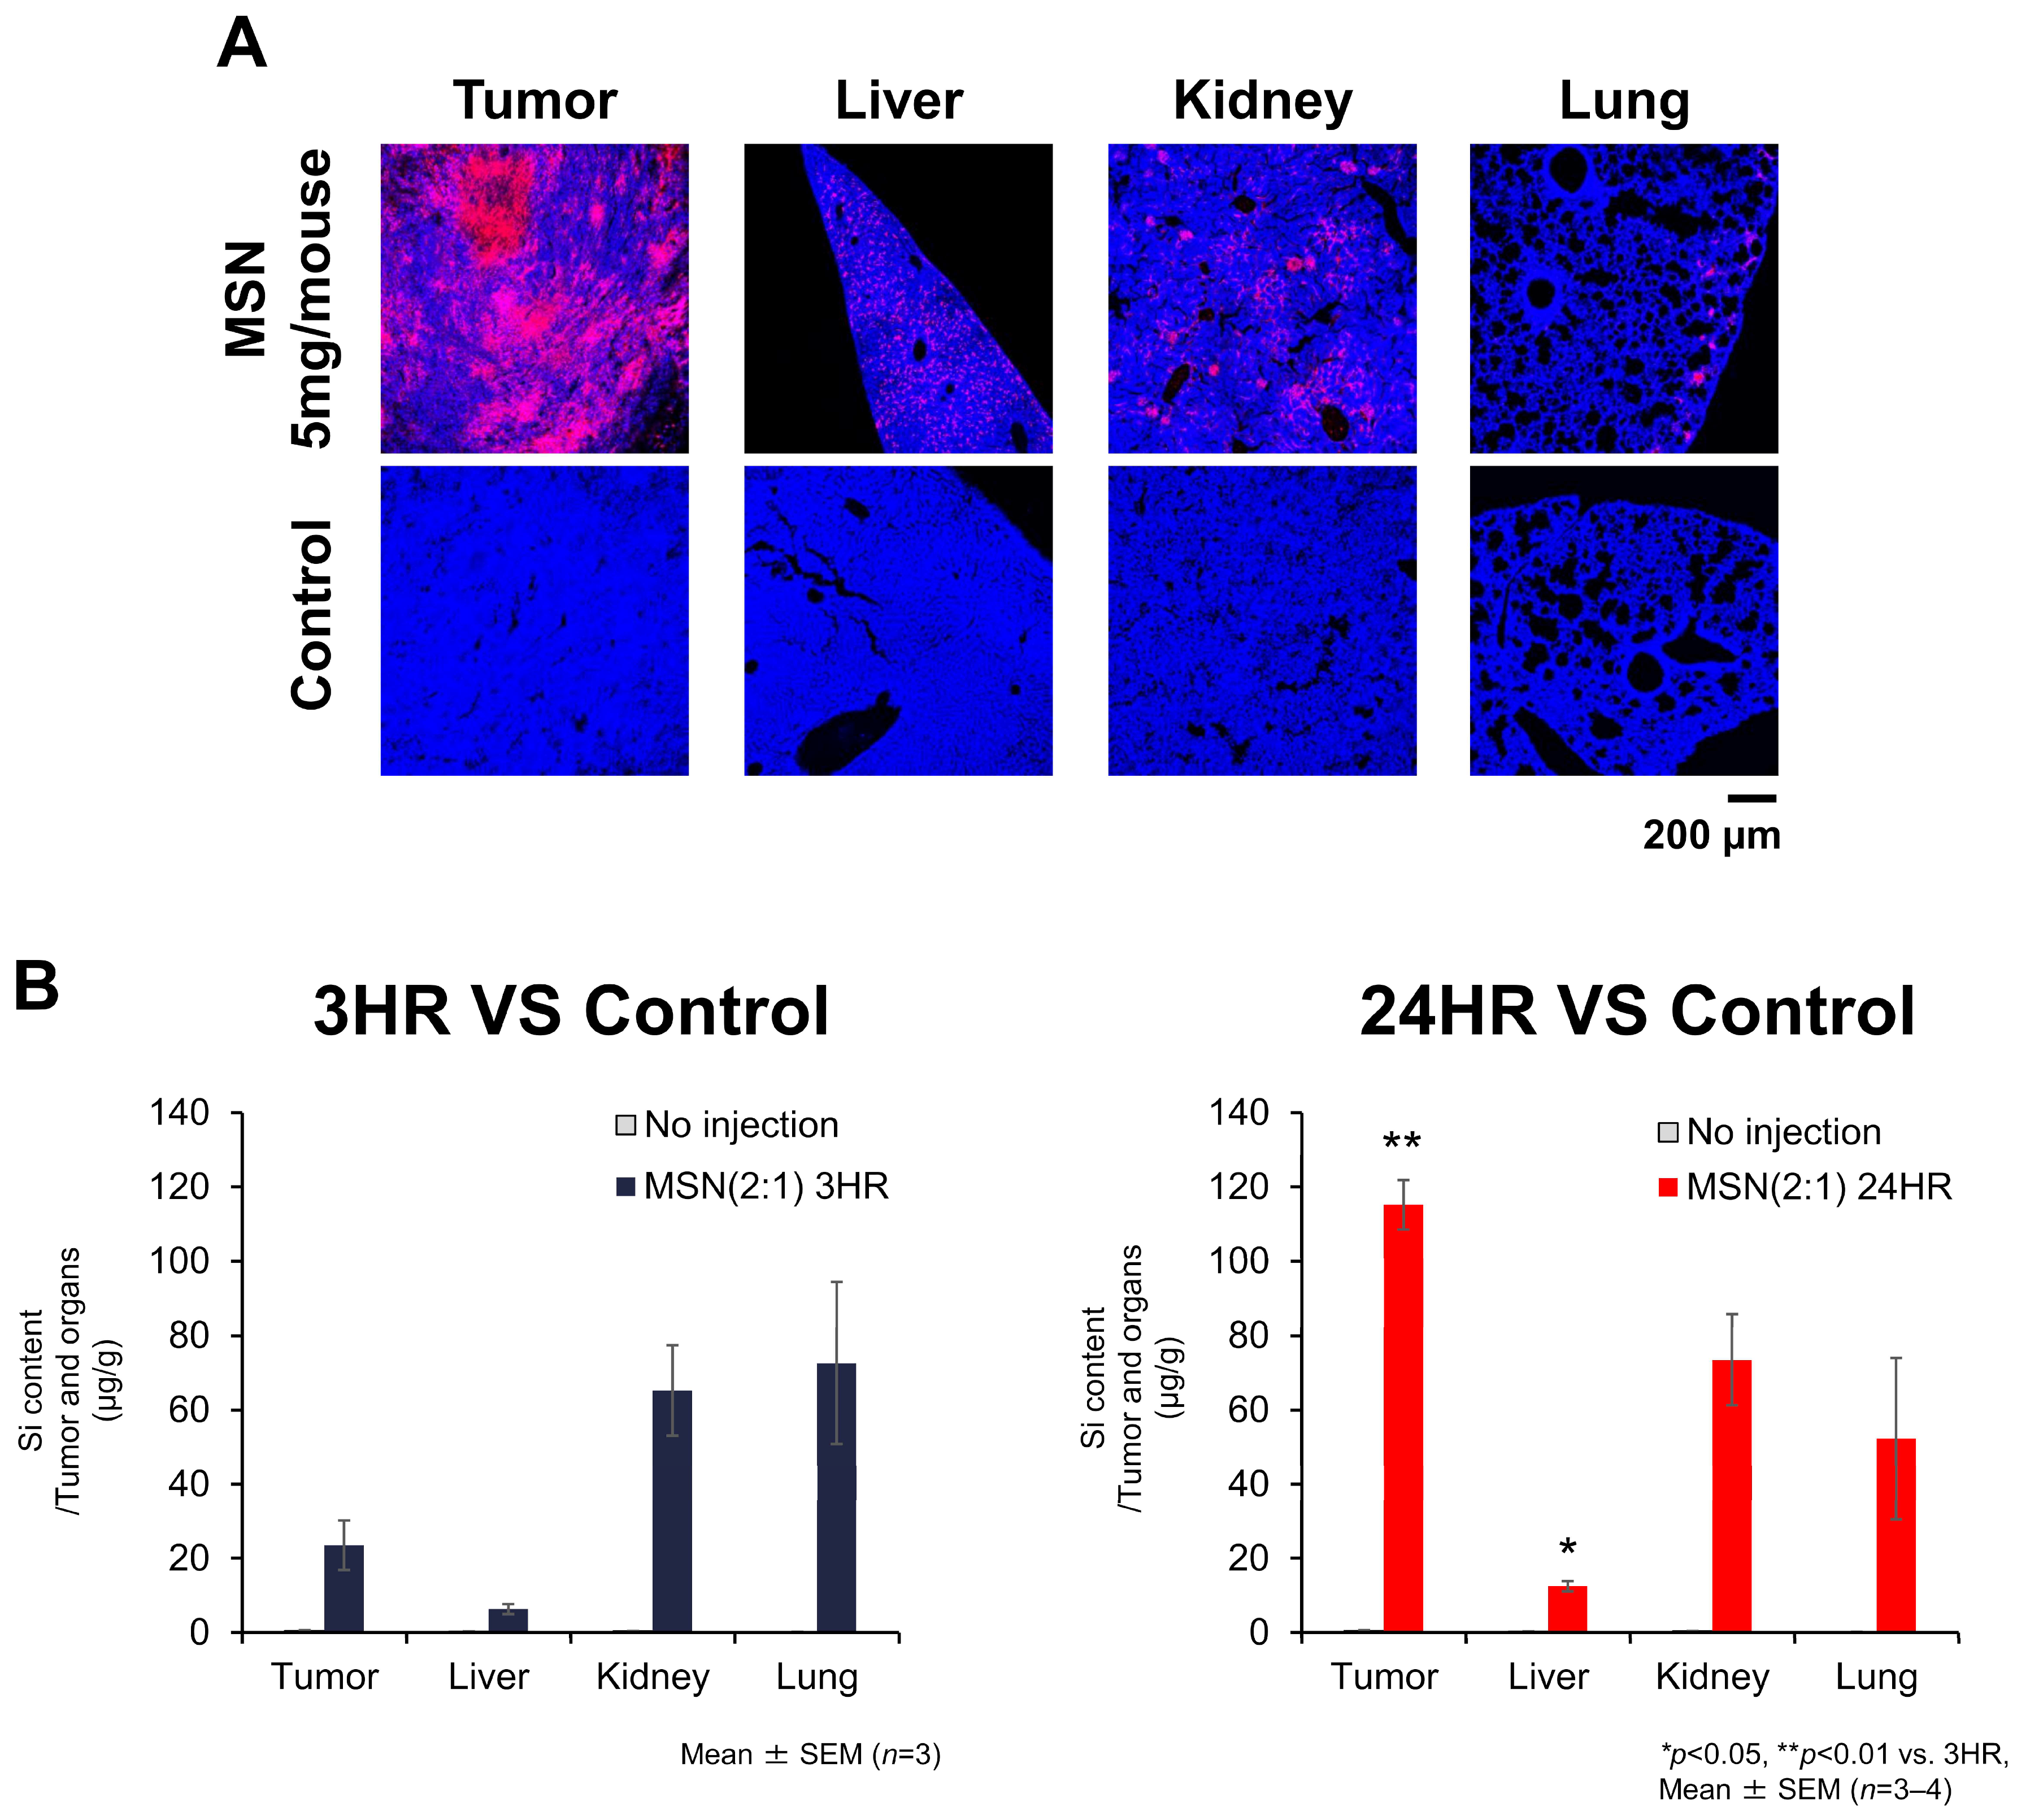
3.5.1. Biodistribution of sdMSNs in CT26-Bearing Mouse Model
3.5.2. Localization of MSN-PEG/TA (2:1) in Mouse Tumors and Organs
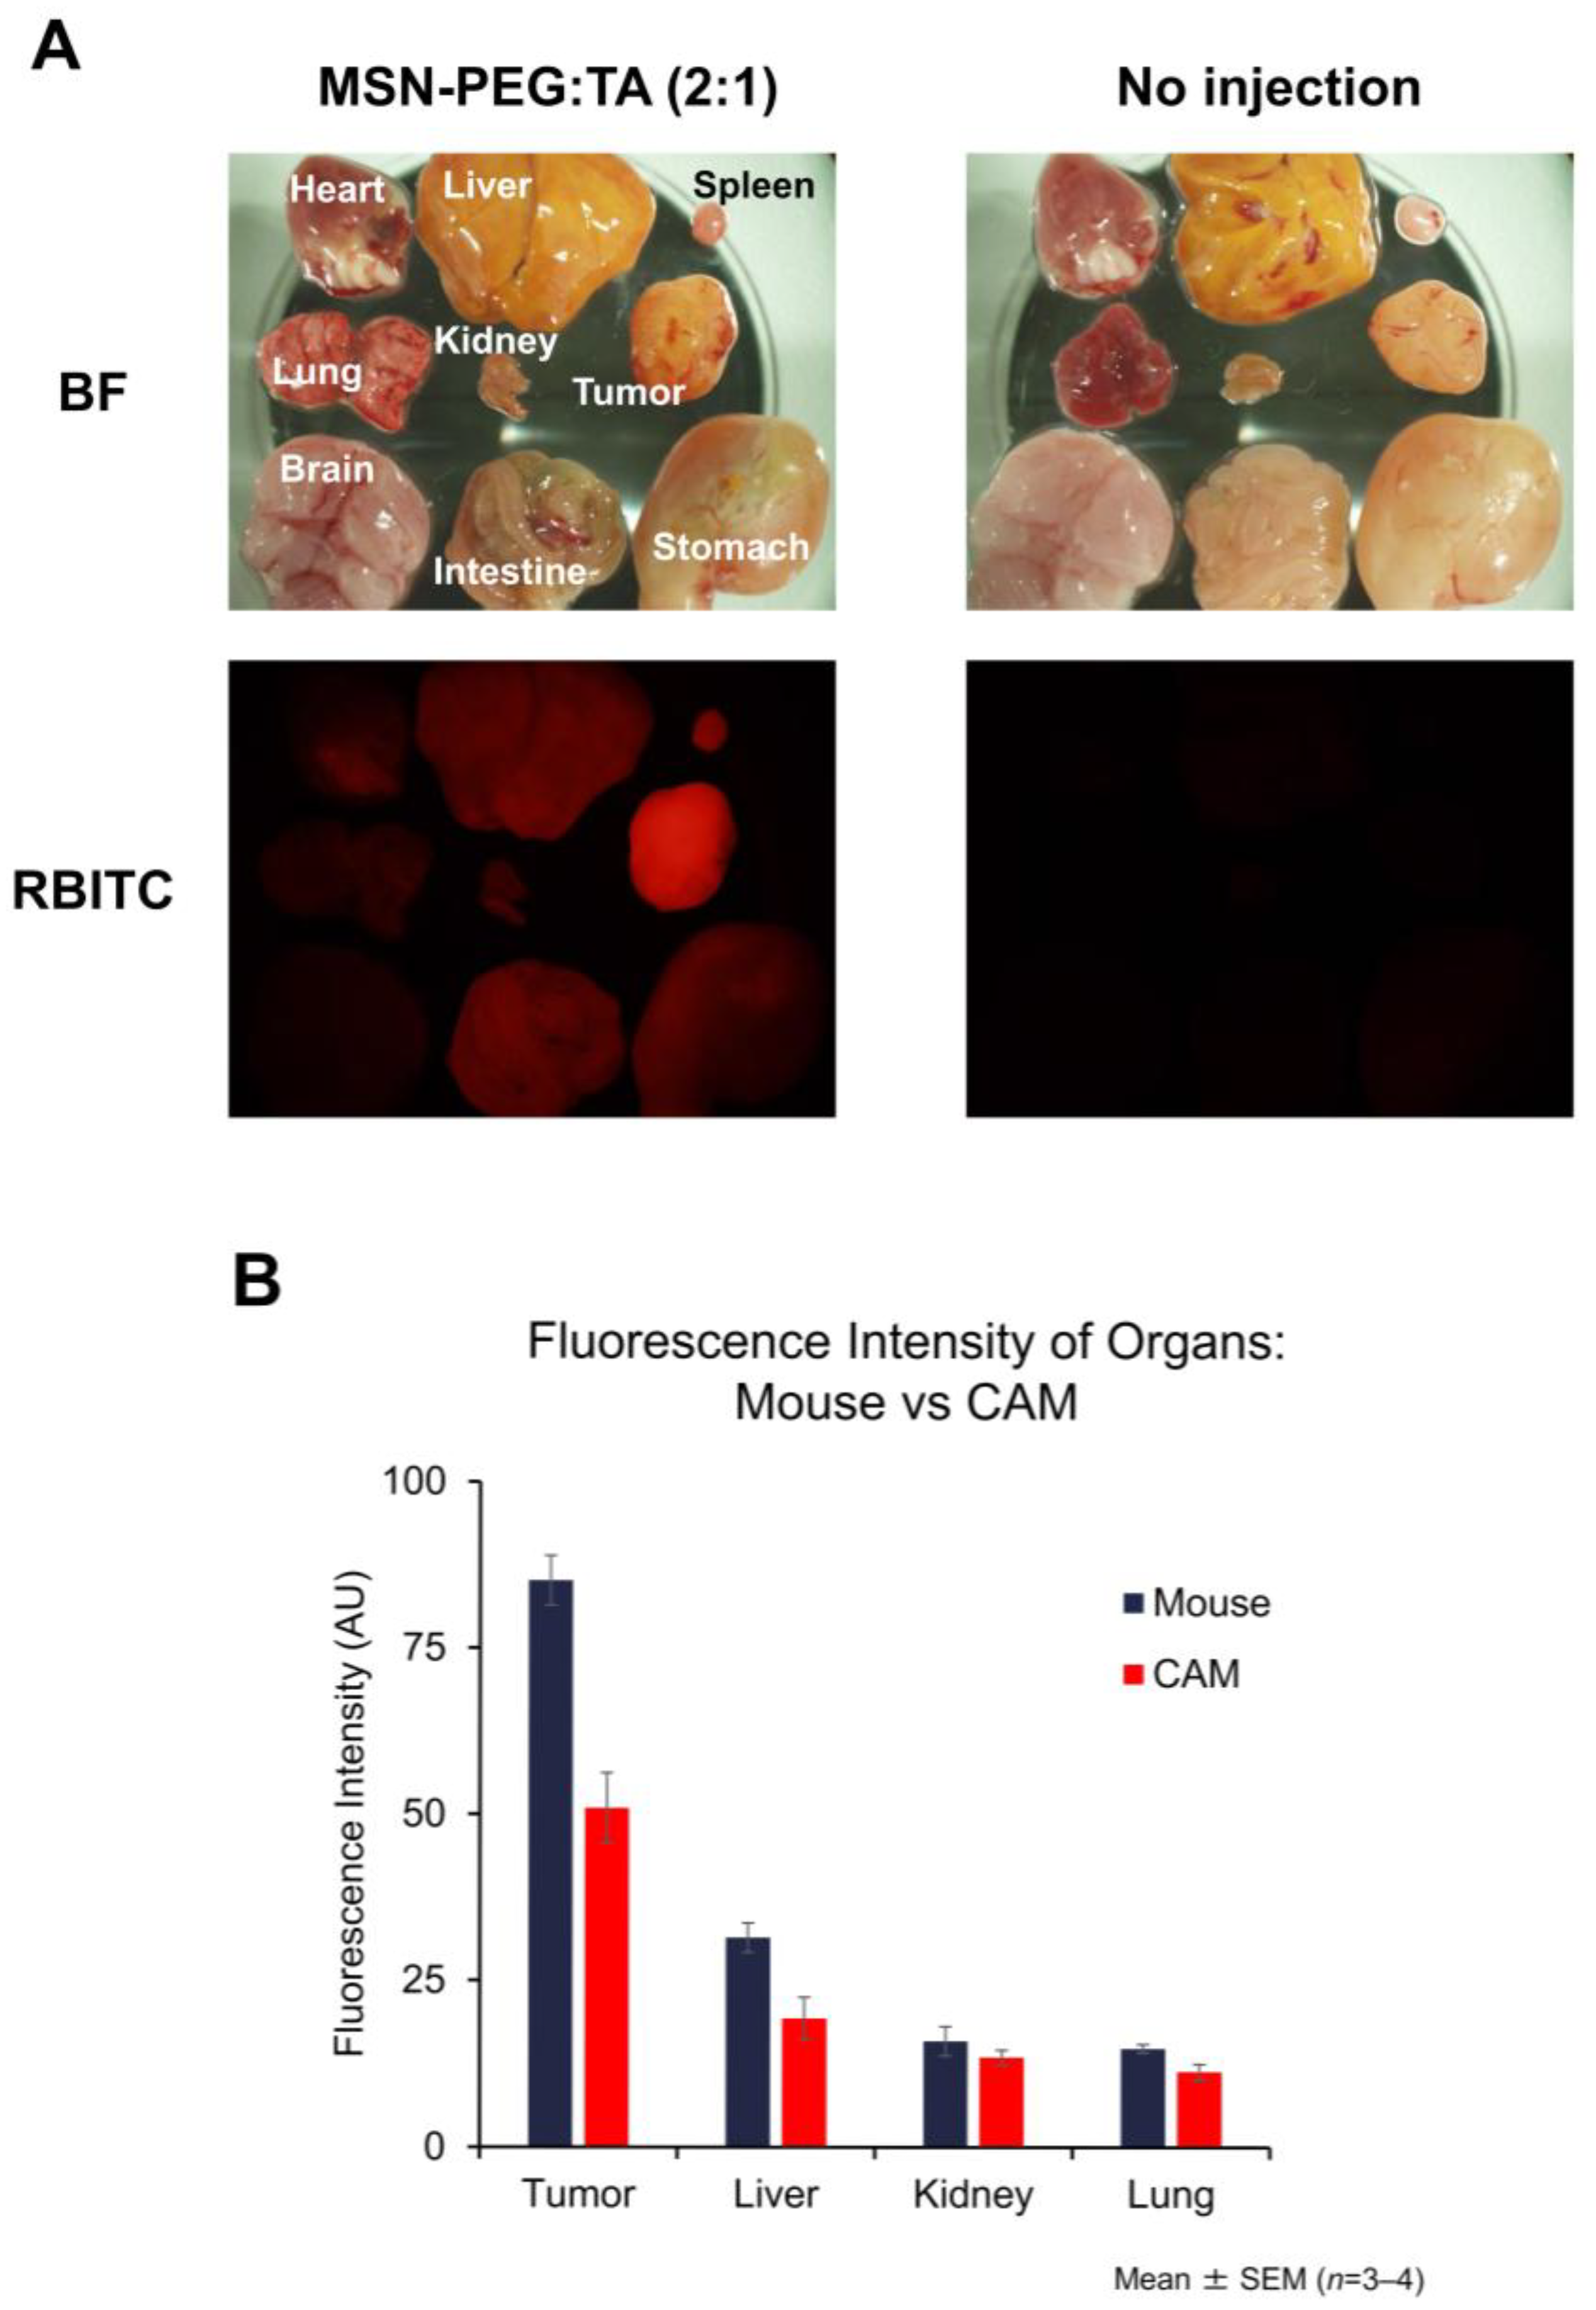
3.5.3. Biodistribution of MSNs in the CAM Model and Its Similarity to the Mouse Model
4. Discussion
5. Conclusions
Supplementary Materials
Author Contributions
Funding
Institutional Review Board Statement
Informed Consent Statement
Data Availability Statement
Acknowledgments
Conflicts of Interest
References
- Cho, S.-Y.; Kang, W.; Han, J.Y.; Min, S.; Kang, J.; Lee, A.; Kwon, J.Y.; Lee, C.; Park, H. An Integrative Approach to Precision Cancer Medicine Using Patient-Derived Xenografts. Mol. Cells 2016, 39, 77–86. [Google Scholar] [CrossRef] [PubMed]
- Jung, J.; Seol, H.S.; Chang, S. The Generation and Application of Patient-Derived Xenograft Model for Cancer Research. Cancer Res. Treat. 2018, 50, 1–10. [Google Scholar] [CrossRef] [PubMed]
- Ribatti, D. The Chick Embryo Chorioallantoic Membrane in the Study of Tumor Angiogenesis. Rom. J. Morphol. Embryol. 2008, 49, 131–135. [Google Scholar]
- Nowak-Sliwinska, P.; Segura, T.; Iruela-Arispe, M.L. The Chicken Chorioallantoic Membrane Model in Biology, Medicine and Bioengineering. Angiogenesis 2014, 17, 779–804. [Google Scholar] [CrossRef]
- Herrmann, A.; Moss, D.; Sée, V. The Chorioallantoic Membrane of the Chick Embryo to Assess Tumor Formation and Metastasis. In Methods in Molecular Biology; Walker, J.M., Ed.; Humana: New York, NY, USA, 2016; Volume 1464, pp. 97–105. [Google Scholar] [CrossRef]
- Mosna, M.J.; Garde, F.J.; Stinson, M.G.; Pastore, C.D.; Carcagno, A.L. The Chorioallantoic Membrane (CAM) Model: From Its Origins in Developmental Biology to Its Role in Cancer Research. Dev. Biol. 2025, 519, 79–95. [Google Scholar] [CrossRef]
- DeBord, L.C.; Pathak, R.R.; Villaneuva, M.; Liu, H.-C.; Harrington, D.A.; Yu, W.; Lewis, M.T.; Sikora, A.G. The Chick Chorioallantoic Membrane (CAM) as a Versatile Patient-Derived Xenograft (PDX) Platform for Precision Medicine and Preclinical Research. Am. J. Cancer Res. 2018, 8, 1642–1660. [Google Scholar]
- Garcia, P.; Wang, Y.; Viallet, J.; Macek Jilkova, Z. The Chicken Embryo Model: A Novel and Relevant Model for Immune-Based Studies. Front. Immunol. 2021, 12, 791081. [Google Scholar] [CrossRef]
- Komatsu, A.; Matsumoto, K.; Saito, T.; Muto, M.; Tamanoi, F. Patient Derived Chicken Egg Tumor Model (PDcE Model): Current Status and Critical Issues. Cells 2019, 8, 440. [Google Scholar] [CrossRef]
- Komatsu, A.; Matsumoto, K.; Yoshimatsu, Y.; Sin, Y.; Kubota, A.; Saito, T.; Mizumoto, A.; Ohashi, S.; Muto, M.; Noguchi, R.; et al. The CAM Model for CIC-DUX4 Sarcoma and Its Potential Use for Precision Medicine. Cells 2021, 10, 2613. [Google Scholar] [CrossRef]
- Kito, F.; Oyama, R.; Sakumoto, M.; Takahashi, M.; Shiozawa, K.; Qiao, Z.; Sakamoto, H.; Hirose, T.; Setsu, N.; Yoshida, A.; et al. Establishment and Characterization of Novel Patient-Derived Osteosarcoma Xenograft and Cell Line. In Vitro Cell. Dev. Biol.-Anim. 2018, 54, 528–536. [Google Scholar] [CrossRef]
- Kito, F.; Oyama, R.; Noguchi, R.; Hattori, E.; Sakumoto, M.; Endo, M.; Kobayashi, E.; Yoshida, A.; Kawai, A.; Kondo, T. Establishment and Characterization of Novel Patient-Derived Extraskeletal Osteosarcoma Cell Line NCC-ESOS1-C1. Hum. Cell 2020, 33, 283–290. [Google Scholar] [CrossRef] [PubMed]
- Mirabello, L.; Troisi, R.J.; Savage, S.A. Osteosarcoma Incidence and Survival Rates from 1973 to 2004: Data from the Surveillance, Epidemiology, and End Results Program. Cancer 2009, 115, 1531–1543. [Google Scholar] [CrossRef] [PubMed]
- Savage, S.A.; Mirabello, L. Using Epidemiology and Genomics to Understand Osteosarcoma Etiology. Sarcoma 2011, 2011, 548151. [Google Scholar] [CrossRef]
- Isakoff, M.S.; Bielack, S.S.; Meltzer, P.; Gorlick, R. Osteosarcoma: Current Treatment and a Collaborative Pathway to Success. J. Clin. Oncol. 2015, 33, 3029–3035. [Google Scholar] [CrossRef]
- Rao, U.; Cheng, A.; Didolkar, M.S. Extraosseous Osteogenic Sarcoma. Clinicopathological Study of Eight Cases and Review of Literature. Cancer 1978, 41, 1488–1496. [Google Scholar] [CrossRef]
- Lin, S.-Y.; Chen, W.-M.; Wu, H.H.; Chen, W.Y.-K.; Chen, T.-H. Extraosseous Osteogenic Sarcoma. J. Chin. Med. Assoc. 2005, 68, 542–545. [Google Scholar] [CrossRef]
- Longhi, A.; Bielack, S.S.; Grimer, R.; Whelan, J.; Windhager, R.; Leithner, A.; Gronchi, A.; Biau, D.; Jutte, P.; Krieg, A.H.; et al. Extraskeletal Osteosarcoma: A European Musculoskeletal Oncology Society Study on 266 Patients. Eur. J. Cancer 2017, 74, 9–16. [Google Scholar] [CrossRef]
- Ahmad, S.A.; Patel, S.R.; Ballo, M.T.; Baker, T.P.; Yasko, A.W.; Wang, X.; Feig, B.W.; Hunt, K.K.; Lin, P.P.; Weber, K.L.; et al. Extraosseous Osteosarcoma: Response to Treatment and Long-Term Outcome. J. Clin. Oncol. 2002, 20, 521–527. [Google Scholar] [CrossRef]
- Gatta, G.; van der Zwan, J.M.; Casali, P.G.; Siesling, S.; Dei Tos, A.P.; Kunkler, I.; Otter, R.; Licitra, L.; Mallone, S.; Tavilla, A.; et al. Rare Cancers Are Not so Rare: The Rare Cancer Burden in Europe. Eur. J. Cancer 2011, 47, 2493–2511. [Google Scholar] [CrossRef]
- Tamaki, T.; Dong, Y.; Ohno, Y.; Sobue, T.; Nishimoto, H.; Shibata, A. The Burden of Rare Cancer in Japan: Application of the RARECARE Definition. Cancer Epidemiol. 2014, 38, 490–495. [Google Scholar] [CrossRef]
- Pan, X.; Yoshida, A.; Kawai, A.; Kondo, T. Current Status of Publicly Available Sarcoma Cell Lines for Use in Proteomic Studies. Expert Rev. Proteom. 2016, 13, 227–240. [Google Scholar] [CrossRef] [PubMed]
- Lin, Y.-S.; Abadeer, N.; Hurley, K.R.; Haynes, C.L. Ultrastable, Redispersible, Small, and Highly Organomodified Mesoporous Silica Nanotherapeutics. J. Am. Chem. Soc. 2011, 133, 20444–20457. [Google Scholar] [CrossRef]
- Chen, Z.-A.; Wu, C.-H.; Wu, S.-H.; Huang, C.-Y.; Mou, C.-Y.; Wei, K.-C.; Yen, Y.; Chien, I.-T.; Runa, S.; Chen, Y.-P.; et al. Receptor Ligand-Free Mesoporous Silica Nanoparticles: A Streamlined Strategy for Targeted Drug Delivery across the Blood–Brain Barrier. ACS Nano 2024, 18, 12716–12736. [Google Scholar] [CrossRef]
- Zhang, Q.; Wang, X.; Li, P.; Nguyen, K.T.; Wang, X.; Luo, Z.; Zhang, H.; Tan, N.S.; Zhao, Y. Biocompatible, Uniform, and Redispersible Mesoporous Silica Nanoparticles for Cancer-Targeted Drug Delivery In Vivo. Adv. Funct. Mater. 2014, 24, 2450–2461. [Google Scholar] [CrossRef]
- Lu, J.; Liong, M.; Li, Z.; Zink, J.I.; Tamanoi, F. Biocompatibility, Biodistribution, and Drug-Delivery Efficiency of Mesoporous Silica Nanoparticles for Cancer Therapy in Animals. Small 2010, 6, 1794–1805. [Google Scholar] [CrossRef]
- Yamada, H.; Urata, C.; Higashitamori, S.; Aoyama, Y.; Yamauchi, Y.; Kuroda, K. Critical Roles of Cationic Surfactants in the Preparation of Colloidal Mesostructured Silica Nanoparticles: Control of Mesostructure, Particle Size, and Dispersion. ACS Appl. Mater. Interfaces 2014, 6, 3491–3500. [Google Scholar] [CrossRef]
- Townson, J.L.; Lin, Y.-S.; Agola, J.O.; Carnes, E.C.; Leong, H.S.; Lewis, J.D.; Haynes, C.L.; Brinker, C.J. Re-Examining the Size/Charge Paradigm: Differing in Vivo Characteristics of Size- and Charge-Matched Mesoporous Silica Nanoparticles. J. Am. Chem. Soc. 2013, 135, 16030–16033. [Google Scholar] [CrossRef]
- Croissant, J.G.; Butler, K.S.; Zink, J.I.; Brinker, C.J. Synthetic Amorphous Silica Nanoparticles: Toxicity, Biomedical and Environmental Implications. Nat. Rev. Mater. 2020, 5, 886–909. [Google Scholar] [CrossRef]
- Matsumura, Y.; Maeda, H. A New Concept for Macromolecular Therapeutics in Cancer Chemotherapy: Mechanism of Tumoritropic Accumulation of Proteins and the Antitumor Agent Smancs. Cancer Res. 1986, 46, 6387–6392. [Google Scholar]


| Origin | Cancer Type | Cell Line | Collection Date (Days Post-Transplantation) | Transplantation Date (ED: Embryonic Days) | Tumor Proliferation (+/−) |
|---|---|---|---|---|---|
| Established human cell line | Glioblastoma | U87 | 3–7, 9, 10 | ED9–10 | ++ |
| Head and neck cancer | FaDu | 7, 9 | ED8 | + | |
| Lung cancer | A549 | 3, 6, 10 | ED10 | + | |
| Ovarian cancer | OVCAR8 | 3–7, 9, 10 | ED8–10 | + | |
| Patient-derived cell line | Osteosarcoma | OS–46B’ | 4, 6, 8 | ED8 | + |
| Extraskeletal osteosarcoma | OS–157 | 7, 10 | ED10 | + | |
| CIC-DUX4 sarcoma | CD–292 | 3, 5, 7, 10 | ED8 | ++ | |
| CD–89A, CD–89C | 7, 10 | ED8 | + | ||
| Mouse cell line | Breast cancer | 4T1 | 9 | ED10 | ++ |
| Colon cancer | CT26 | 3, 7, 8 | ED10 | ++ | |
| Only CAM | − | 3, 6, 9 | ED10 | − | |
Disclaimer/Publisher’s Note: The statements, opinions and data contained in all publications are solely those of the individual author(s) and contributor(s) and not of MDPI and/or the editor(s). MDPI and/or the editor(s) disclaim responsibility for any injury to people or property resulting from any ideas, methods, instructions or products referred to in the content. |
© 2025 by the authors. Licensee MDPI, Basel, Switzerland. This article is an open access article distributed under the terms and conditions of the Creative Commons Attribution (CC BY) license (https://creativecommons.org/licenses/by/4.0/).
Share and Cite
Komatsu, A.; Higashi, Y.; Lin, C.-K.; Chen, Y.-P.; Wu, S.-H.; Suzuki, M.; Matsumoto, K.; Tamanoi, F. Accumulation of Small-Size, Highly Dispersive Mesoporous Silica Nanoparticles in a Tumor in Both Chorioallantoic Membrane and Mouse Models. Cells 2025, 14, 734. https://doi.org/10.3390/cells14100734
Komatsu A, Higashi Y, Lin C-K, Chen Y-P, Wu S-H, Suzuki M, Matsumoto K, Tamanoi F. Accumulation of Small-Size, Highly Dispersive Mesoporous Silica Nanoparticles in a Tumor in Both Chorioallantoic Membrane and Mouse Models. Cells. 2025; 14(10):734. https://doi.org/10.3390/cells14100734
Chicago/Turabian StyleKomatsu, Aoi, Yuya Higashi, Cong-Kai Lin, Yi-Ping Chen, Si-Han Wu, Minoru Suzuki, Kotaro Matsumoto, and Fuyuhiko Tamanoi. 2025. "Accumulation of Small-Size, Highly Dispersive Mesoporous Silica Nanoparticles in a Tumor in Both Chorioallantoic Membrane and Mouse Models" Cells 14, no. 10: 734. https://doi.org/10.3390/cells14100734
APA StyleKomatsu, A., Higashi, Y., Lin, C.-K., Chen, Y.-P., Wu, S.-H., Suzuki, M., Matsumoto, K., & Tamanoi, F. (2025). Accumulation of Small-Size, Highly Dispersive Mesoporous Silica Nanoparticles in a Tumor in Both Chorioallantoic Membrane and Mouse Models. Cells, 14(10), 734. https://doi.org/10.3390/cells14100734