

“Combo” Multi-Target Pharmacological Therapy and New Formulations to Reduce Inflammation and Improve Endogenous Remyelination in Traumatic Spinal Cord Injury
 ,
,  ,
,  ,
,  , ,
, ,  and
and 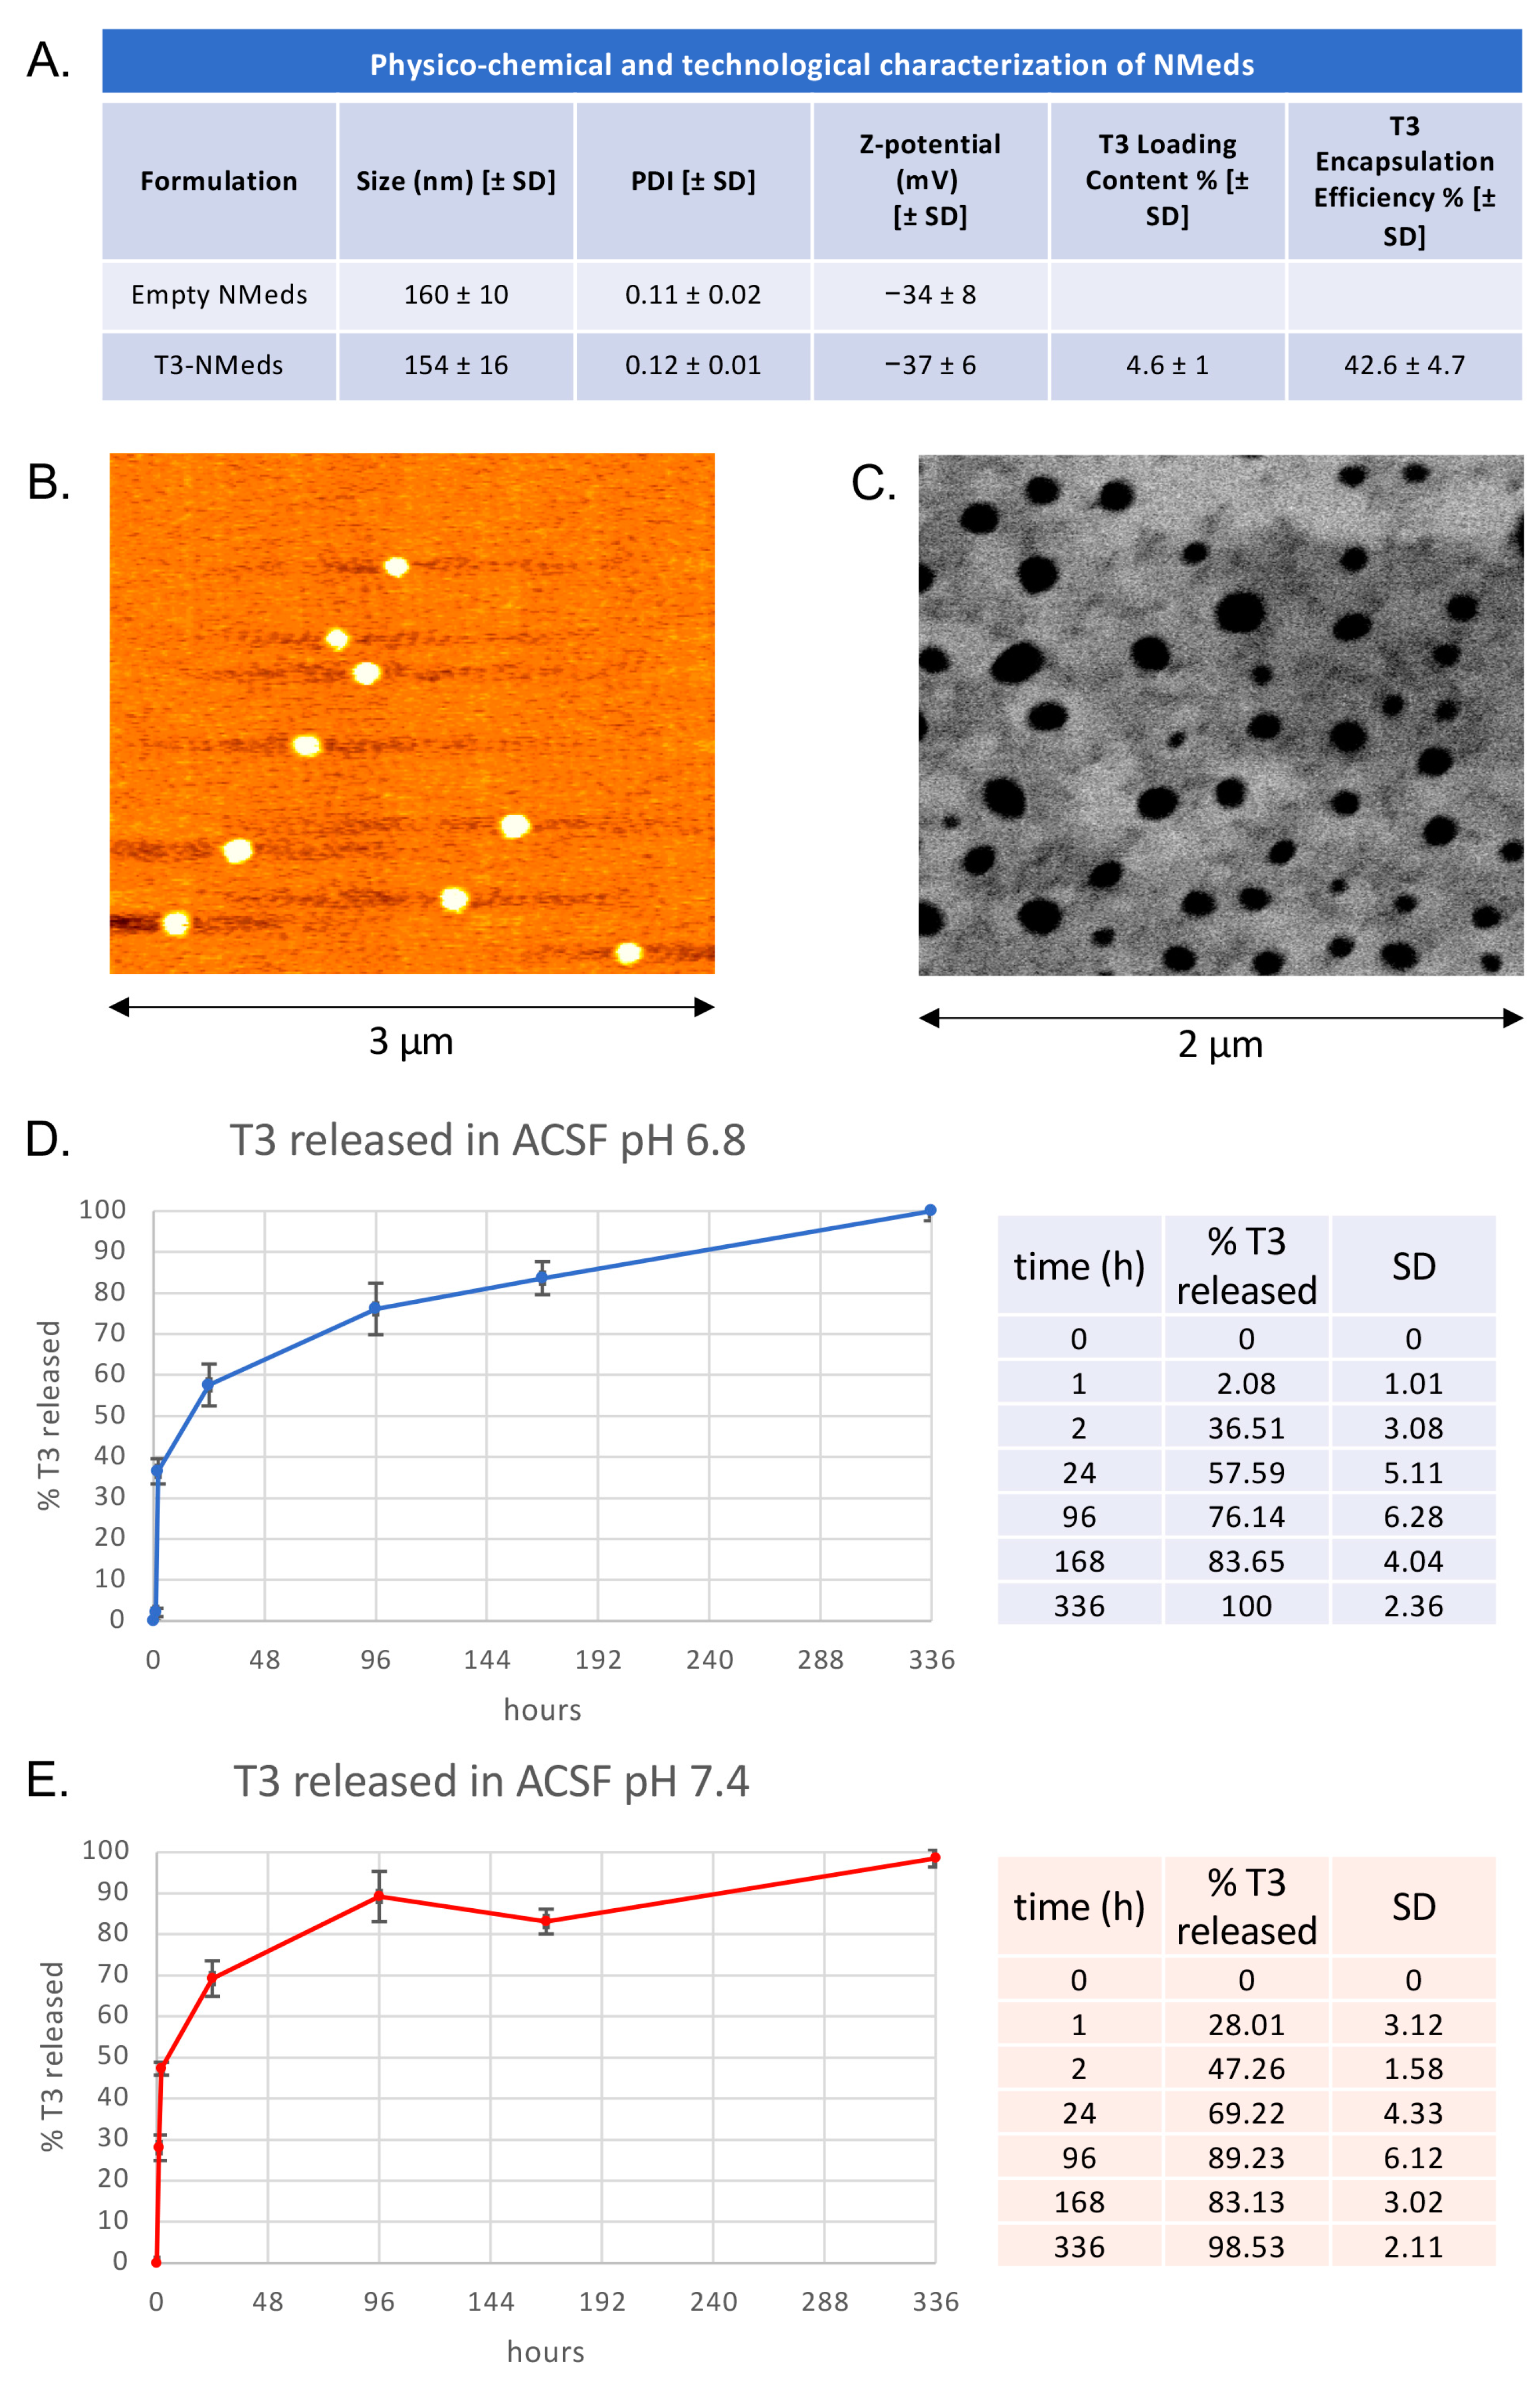
Abstract
1. Introduction
2. Materials and Methods
2.1. Preparation and Characterization of NMeds
2.1.1. Preparation of Empty NMeds (Vehicle Control)
2.1.2. Preparation of T3-NMeds
2.1.3. Preparation of Cy5-Labeled NMeds
2.1.4. Physico-Chemical Characterization of NMeds
2.1.5. Technological Characterization of T3-NMeds
2.1.6. Morphological Characterization of T3-NMeds
2.1.7. T3 Release
2.2. T3-NMeds In Vitro Testing
2.2.1. T3 Concentration in NMed Suspension
2.2.2. In Vitro Cell Experiments
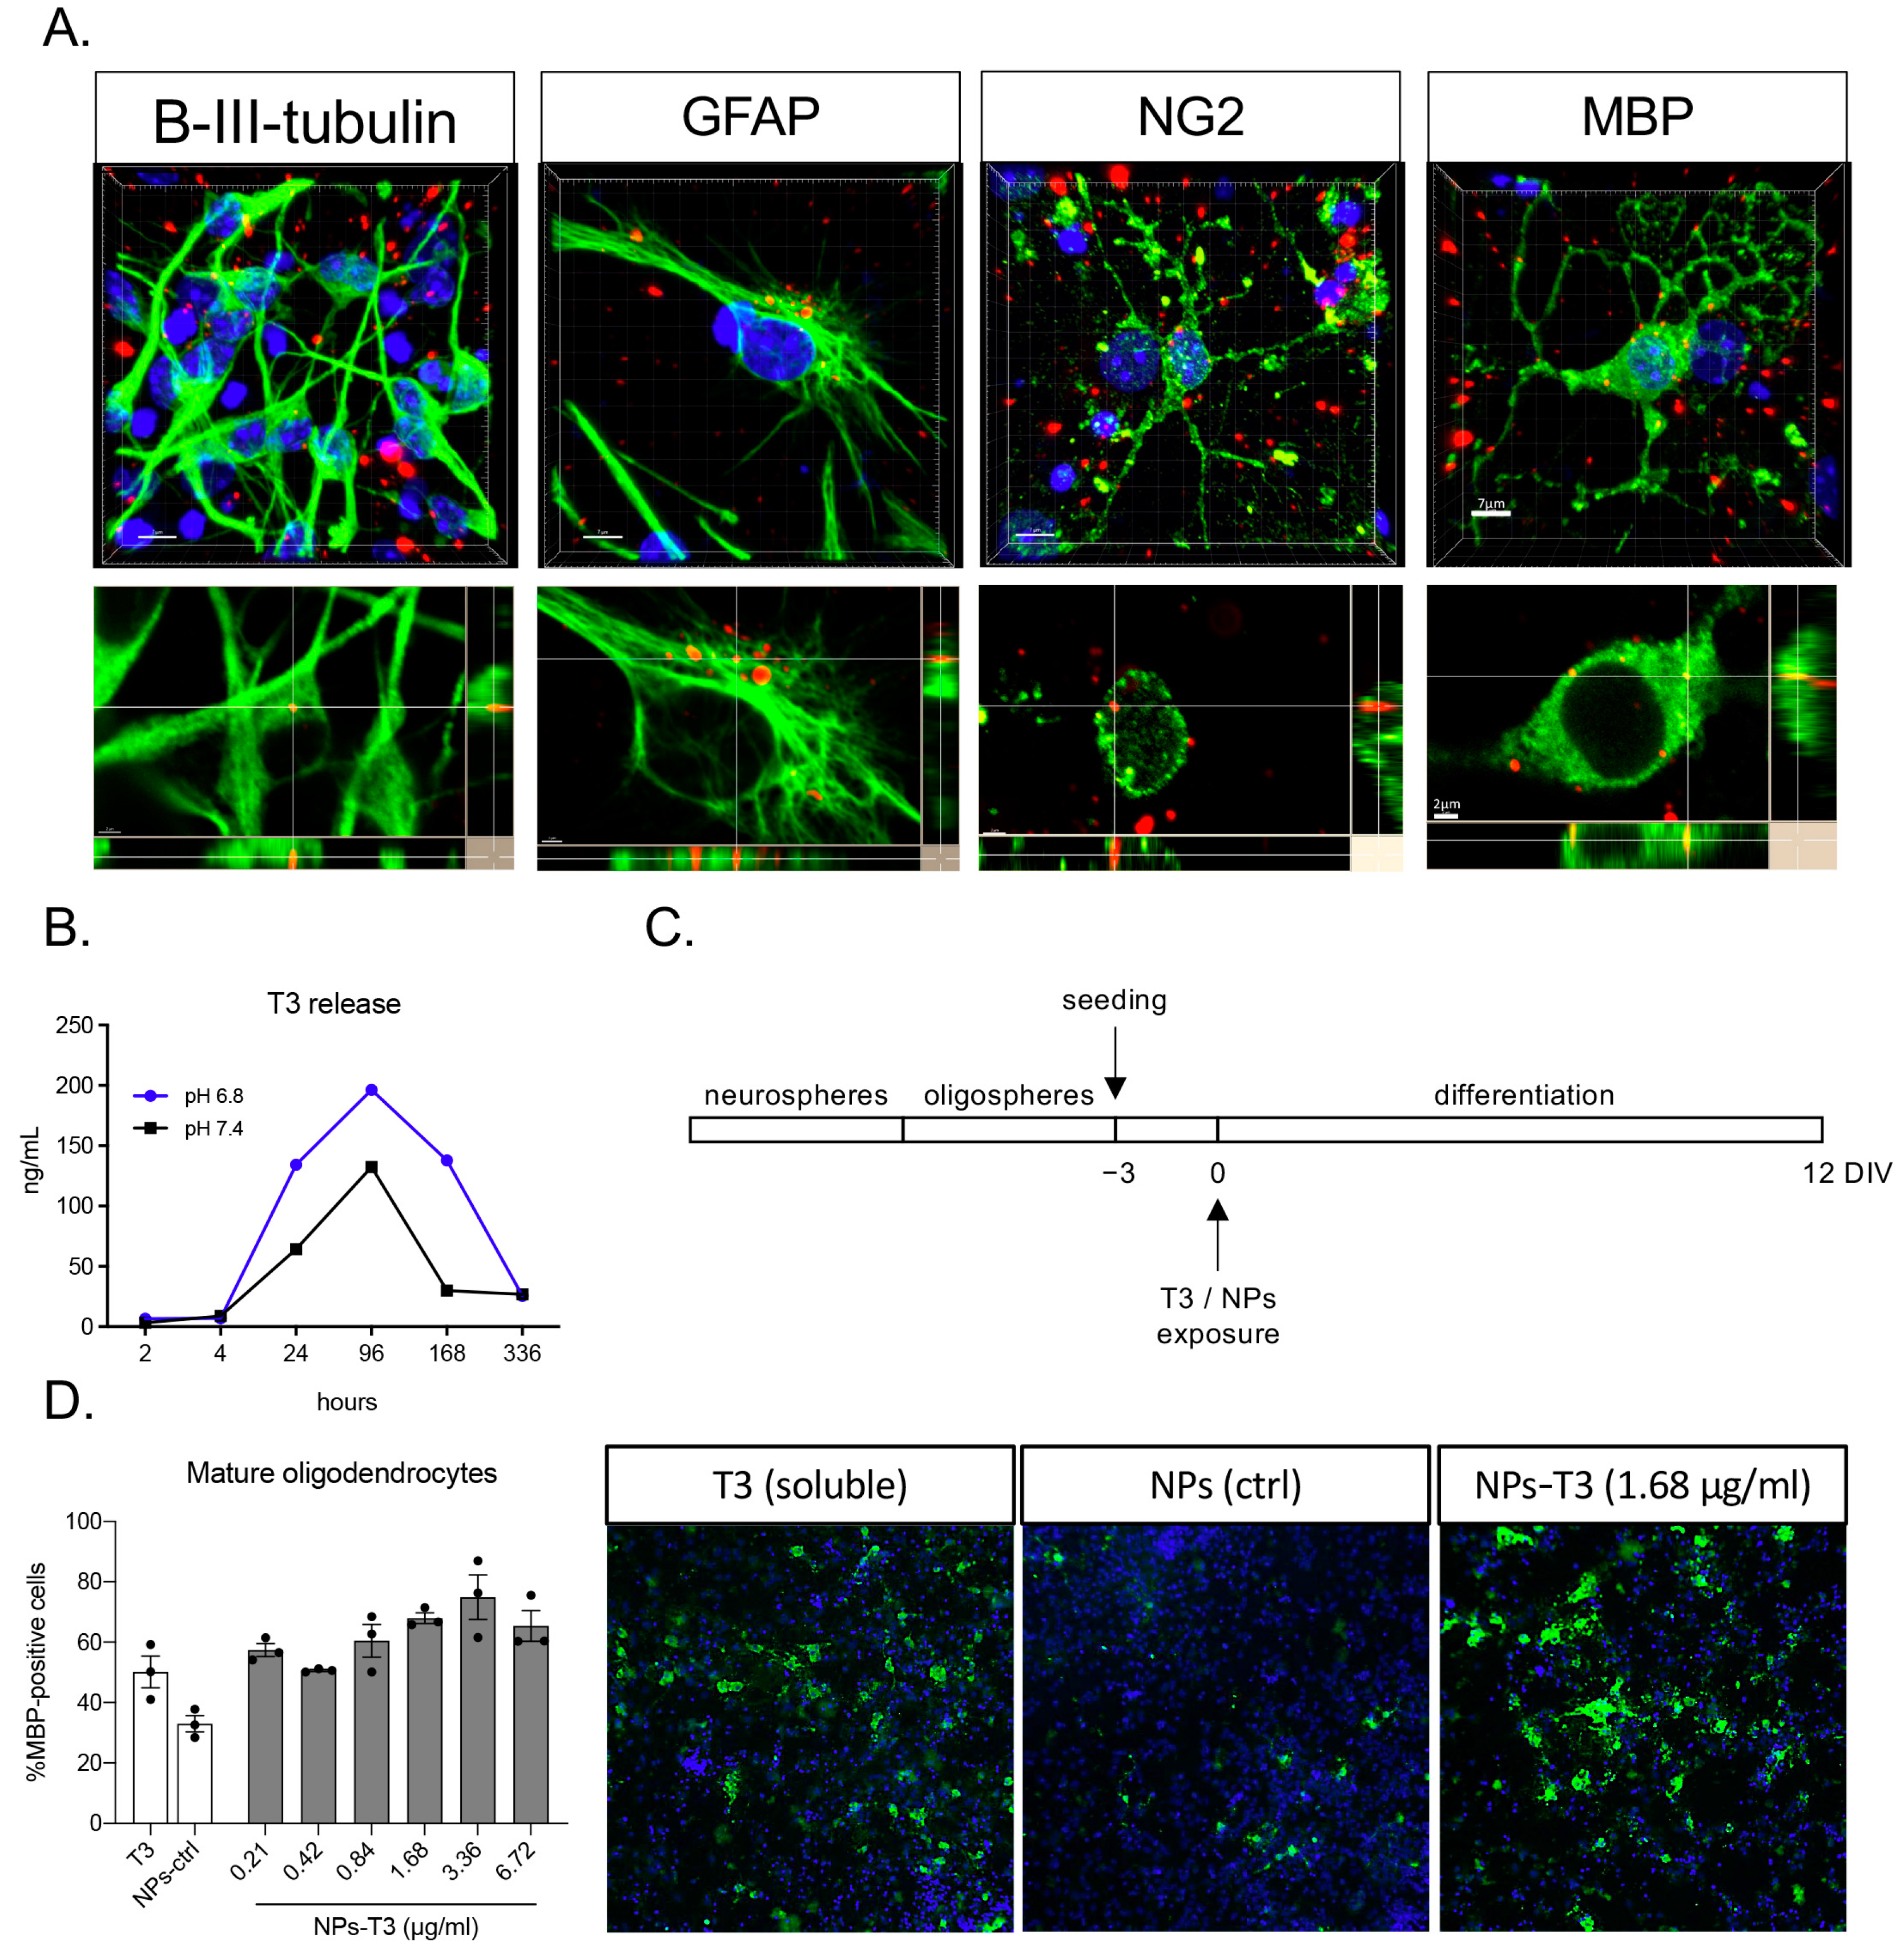
2.2.3. Cell Internalization Test, Immunocytochemistry, and Confocal Imaging
2.2.4. Differentiation Induction Test and High Content Screening Imaging [28]
2.3. In Vivo Study
2.3.1. Animals and Surgery [30]
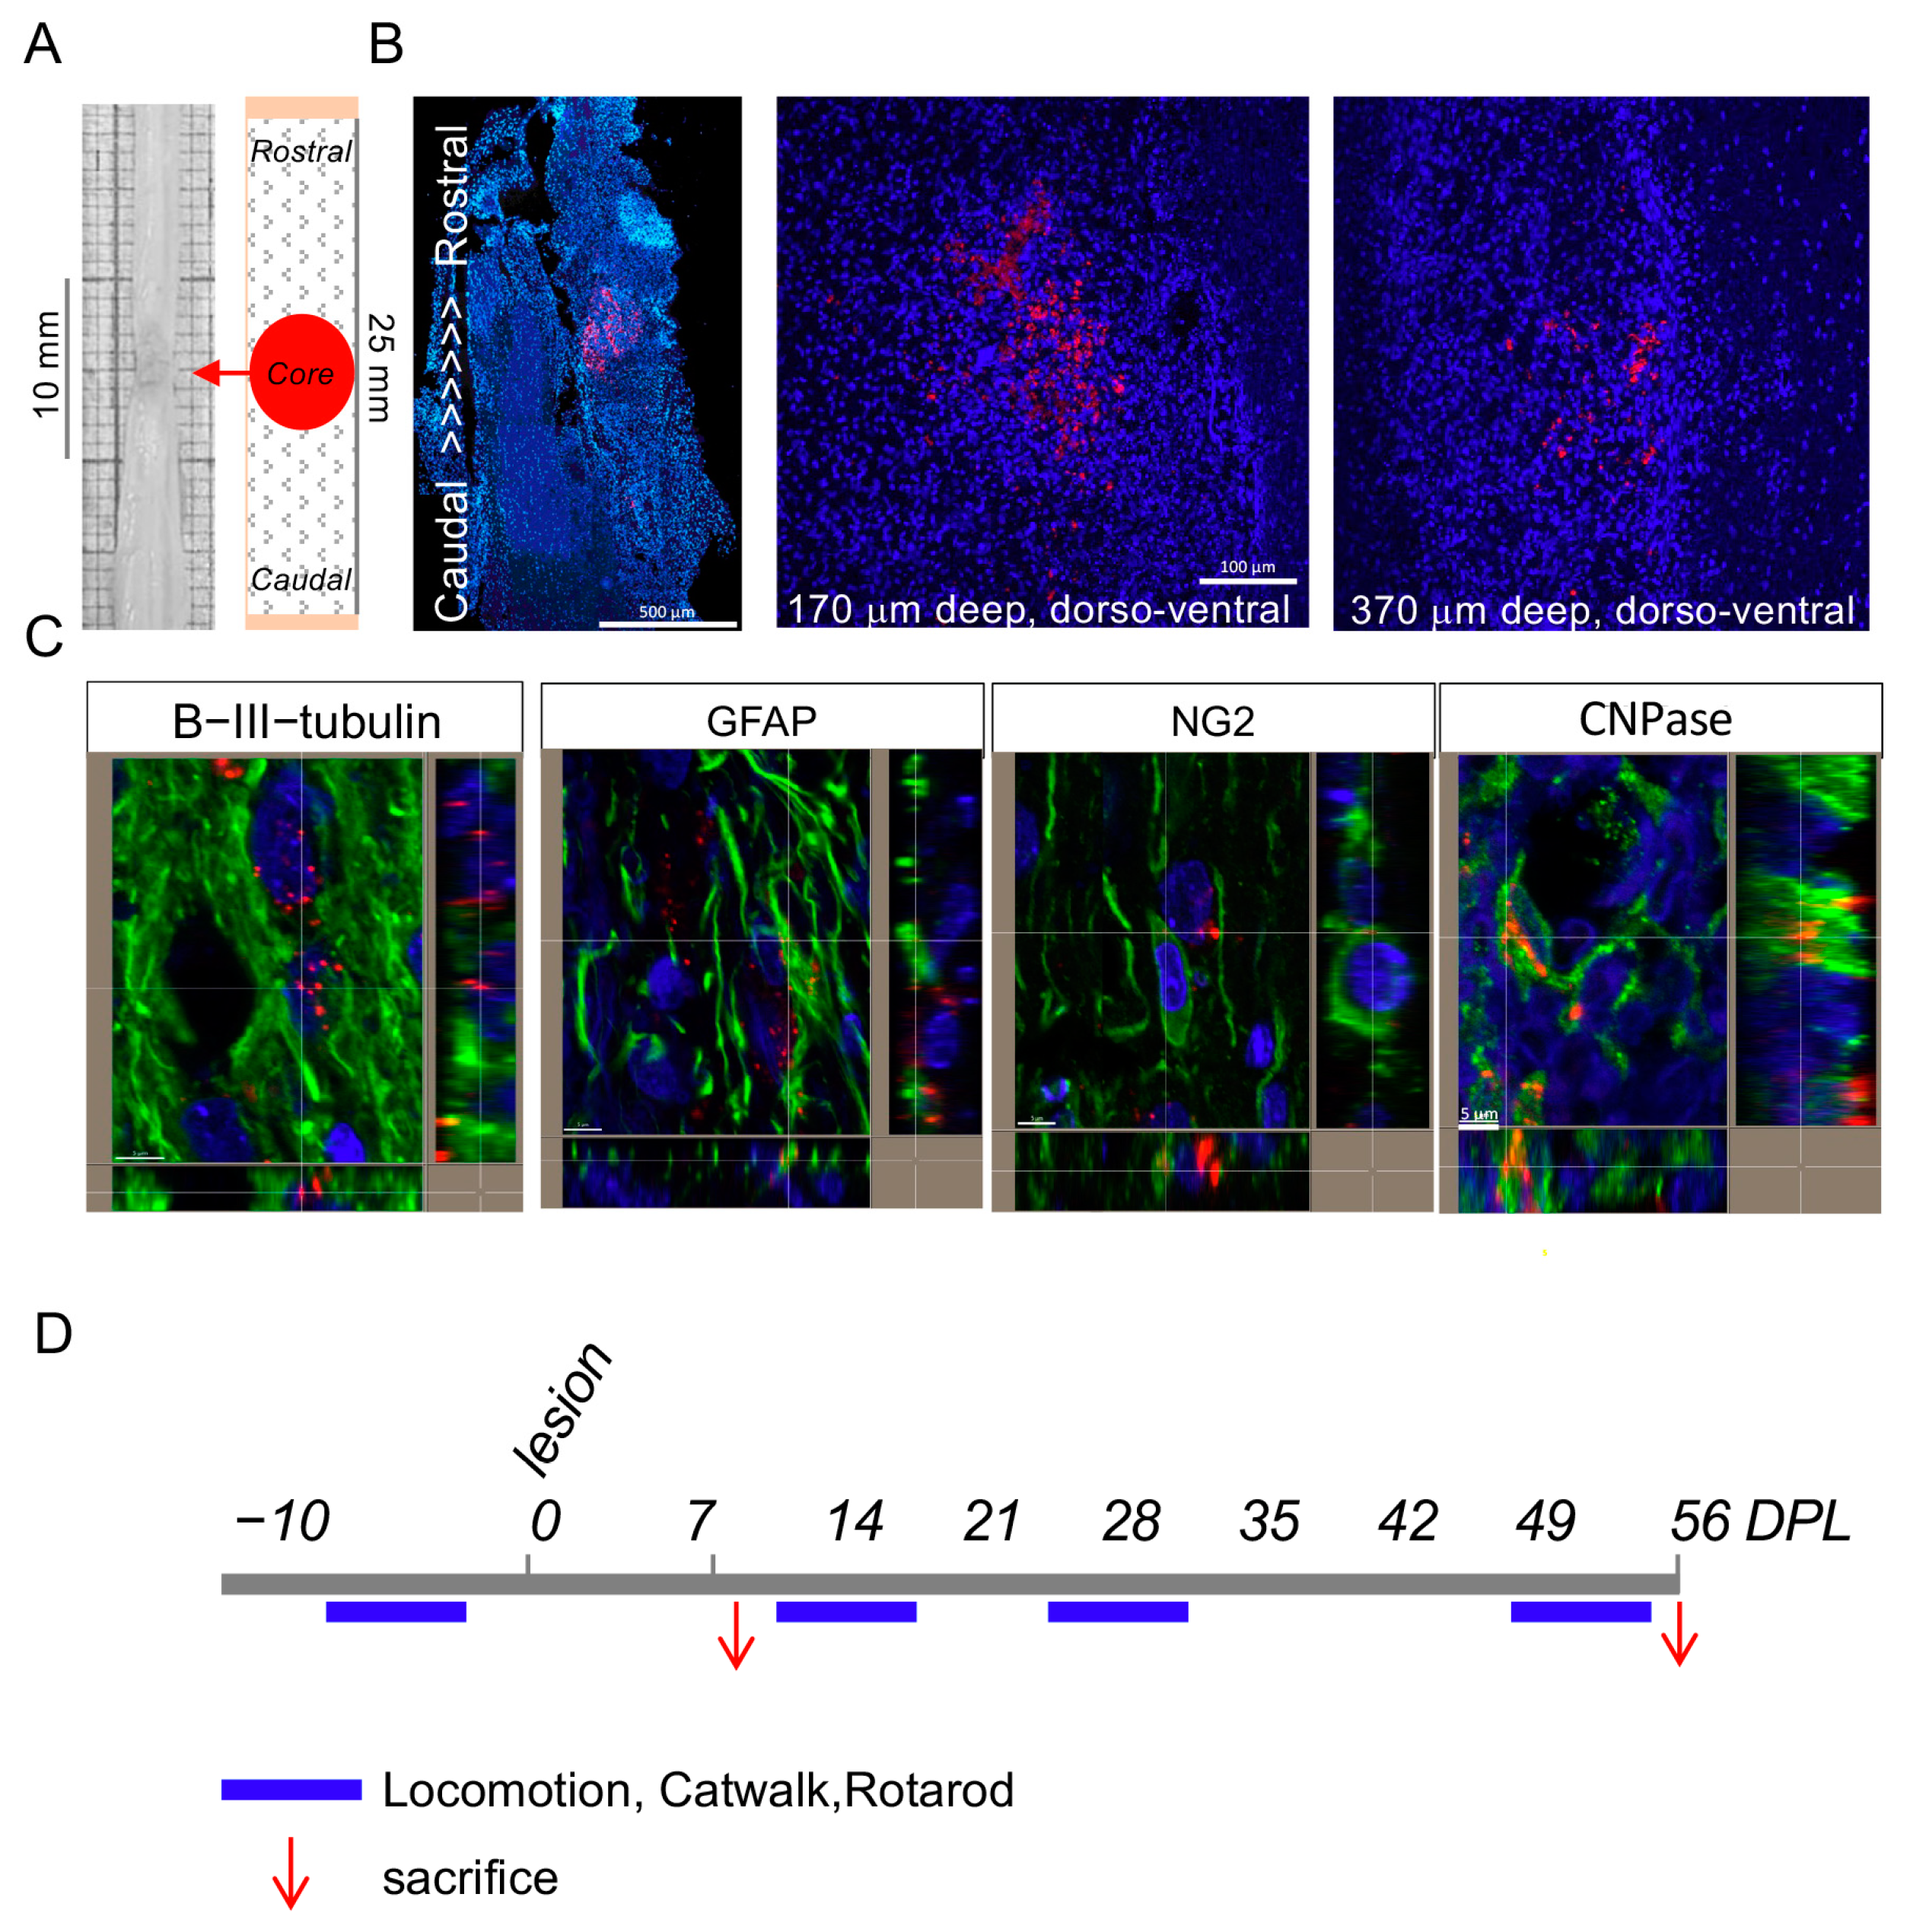
2.3.2. T3-NMed Biodistribution and Treatments
- -
- Subdural administration of 20 μL T3-NMeds 3.5 μg/μL (10 μL rostrally and 10 μL caudally to the lesion);
- -
- Ibuprofen Sodium Salt (Sigma-Aldrich), through a sc implanted osmotic minipump (Alzet Model 2ML2), allowing a constant release of 120 μL/day for 21 days;
- -
- mNGF (purified as described by [32] from adult male mouse submaxillary glands), 50 μg/kg, subdurally 20 μL (10 μL rostrally and 10 μL caudally to the lesion); then 50 μg/kg, intravenous 100 μL on postlesion days 1, 3, 5, 7, 10, 20, and 30.
2.3.3. Spinal Cord Injury Functional Monitoring: BBB Score, Locomotion, and Gait Analysis
2.3.4. Tissue Sacrifice and Sampling
2.4. Tissue Analysis
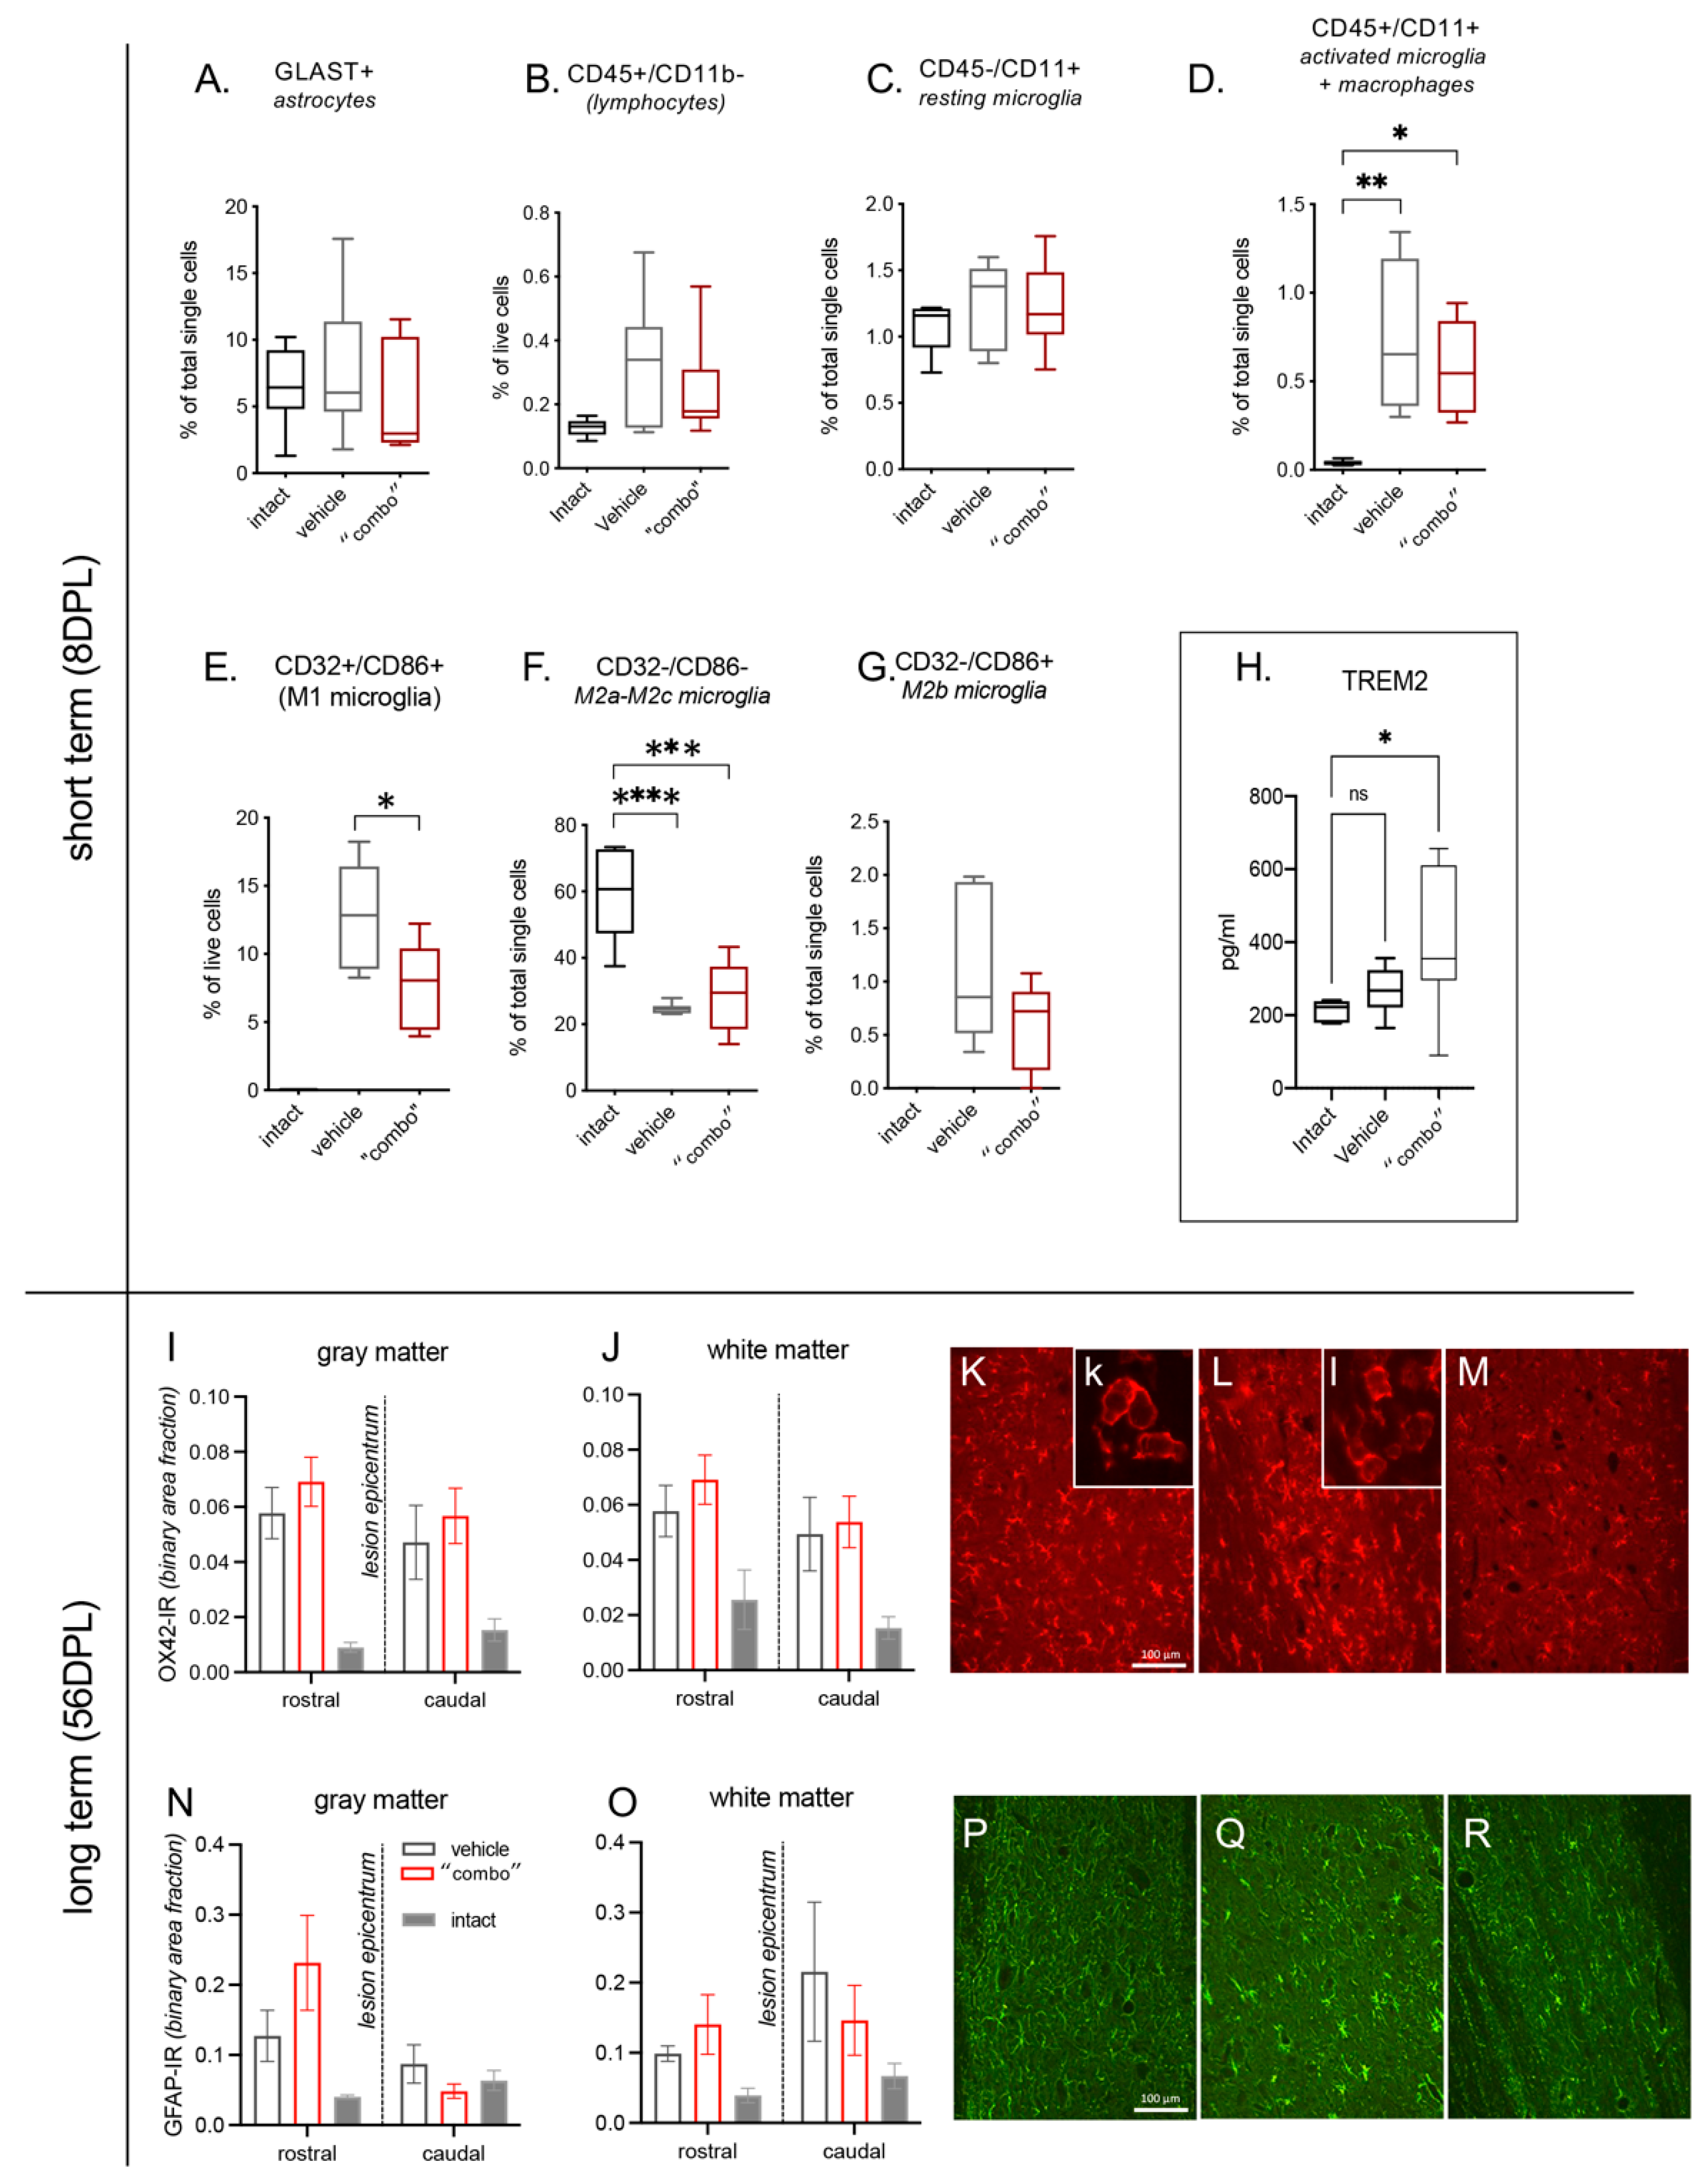
2.4.1. Flow Cytometry
2.4.2. Histology and Immunofluorescence
2.4.3. Myelin Proteins Western Blot
2.4.4. Glutamate Concentration
2.4.5. Biomarkers Assay
2.5. Statistical Analysis
3. Results
3.1. T3-NMed Characterization
3.2. In Vitro T3 Release and Cell Uptake
3.3. Effect of 3× “Combo” Therapy on Neuroinflammation
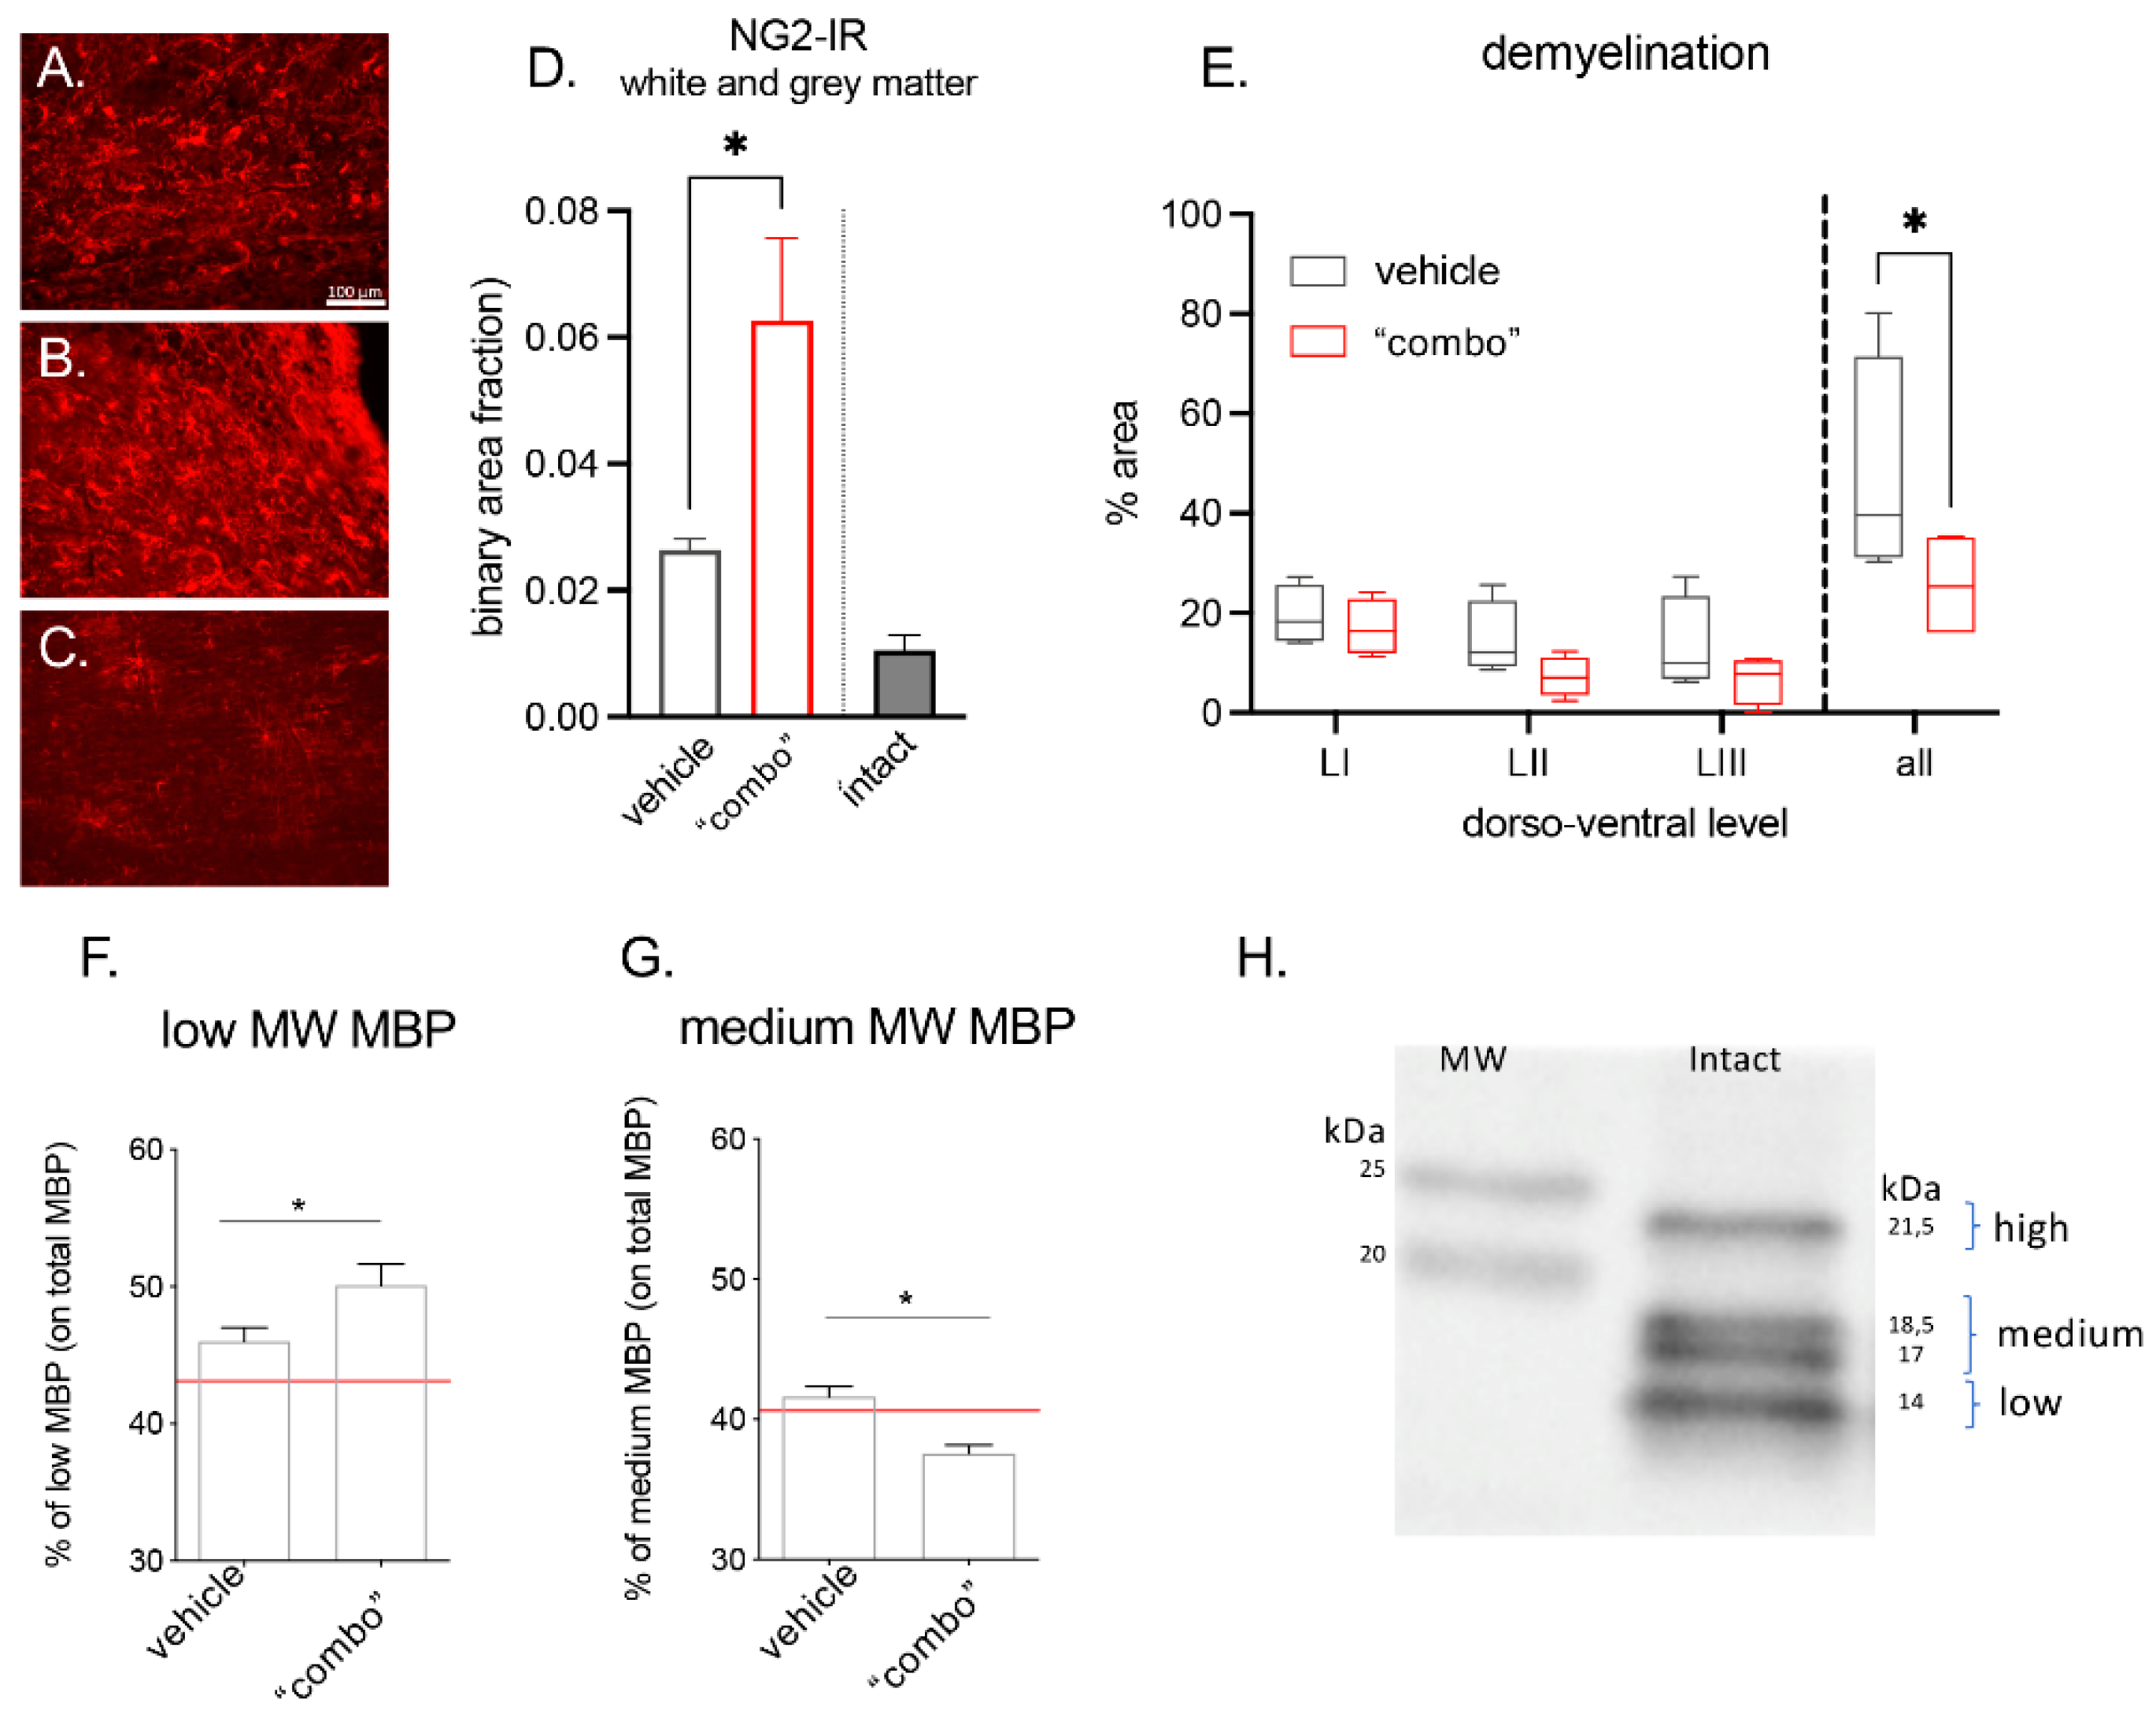
3.4. Effect of the 3× “Combo” Therapy on Demyelination/Remyelination
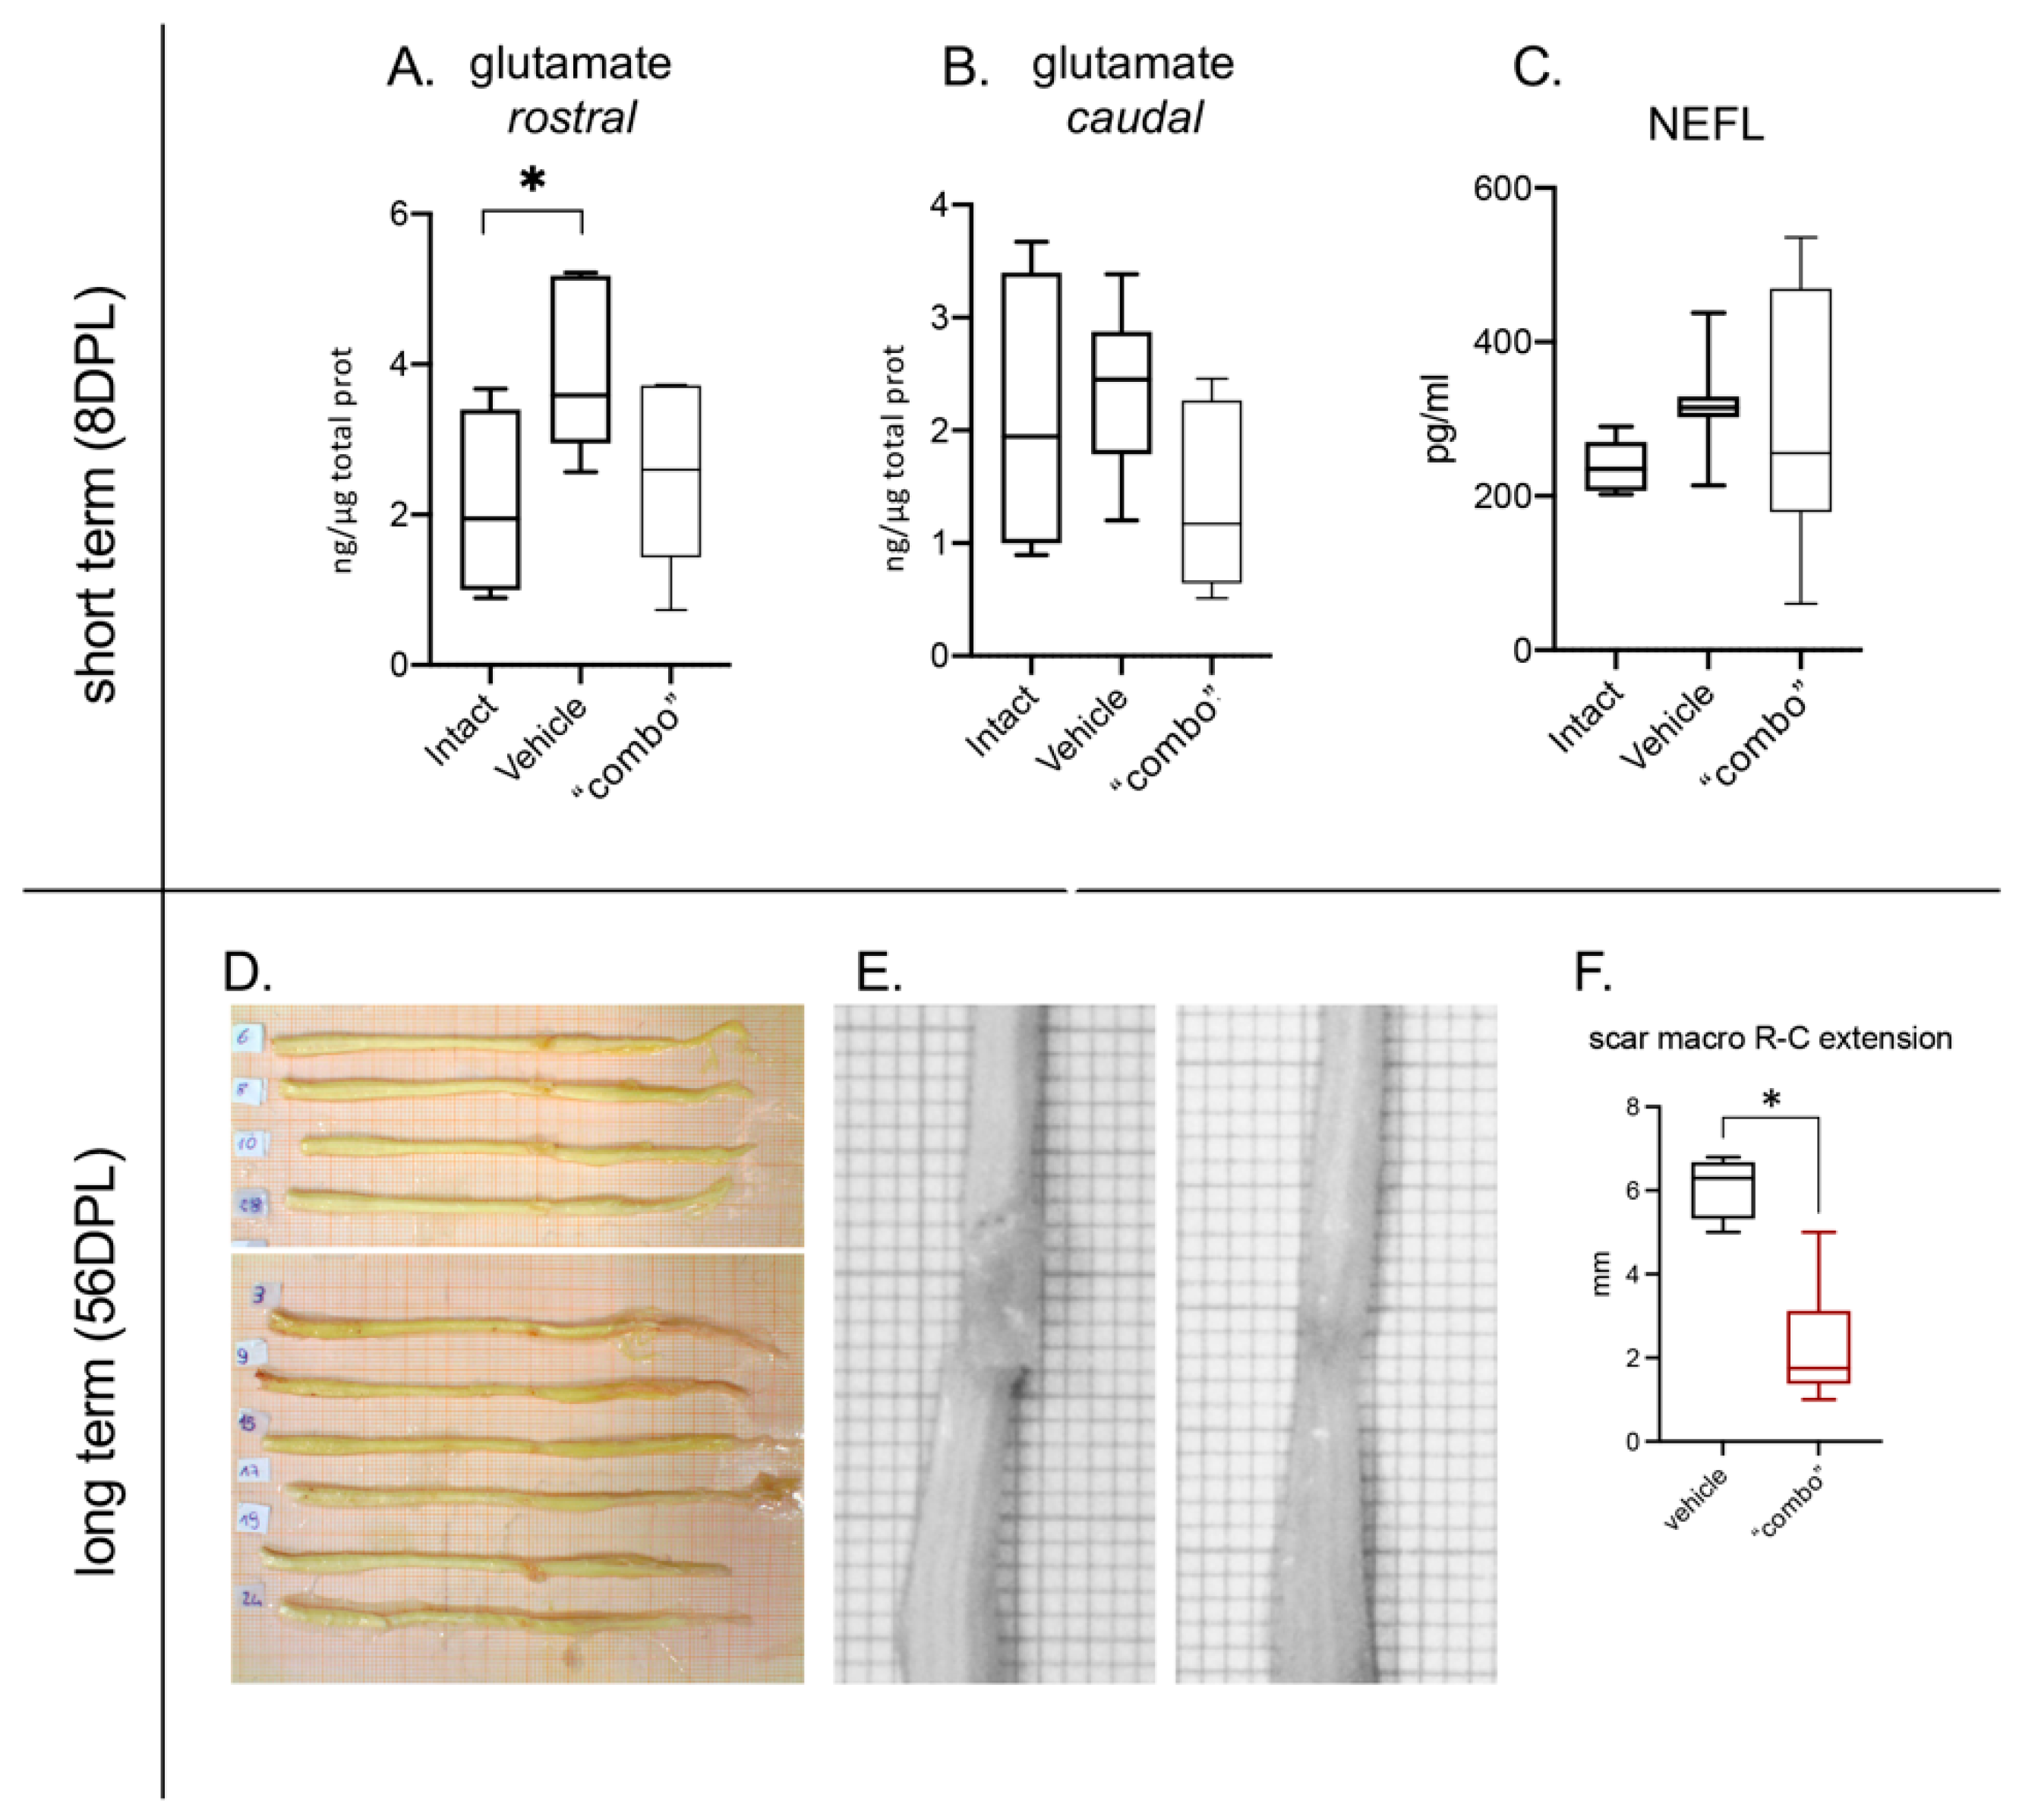
3.5. Effect of the 3× “Combo” Therapy on Neuroprotection
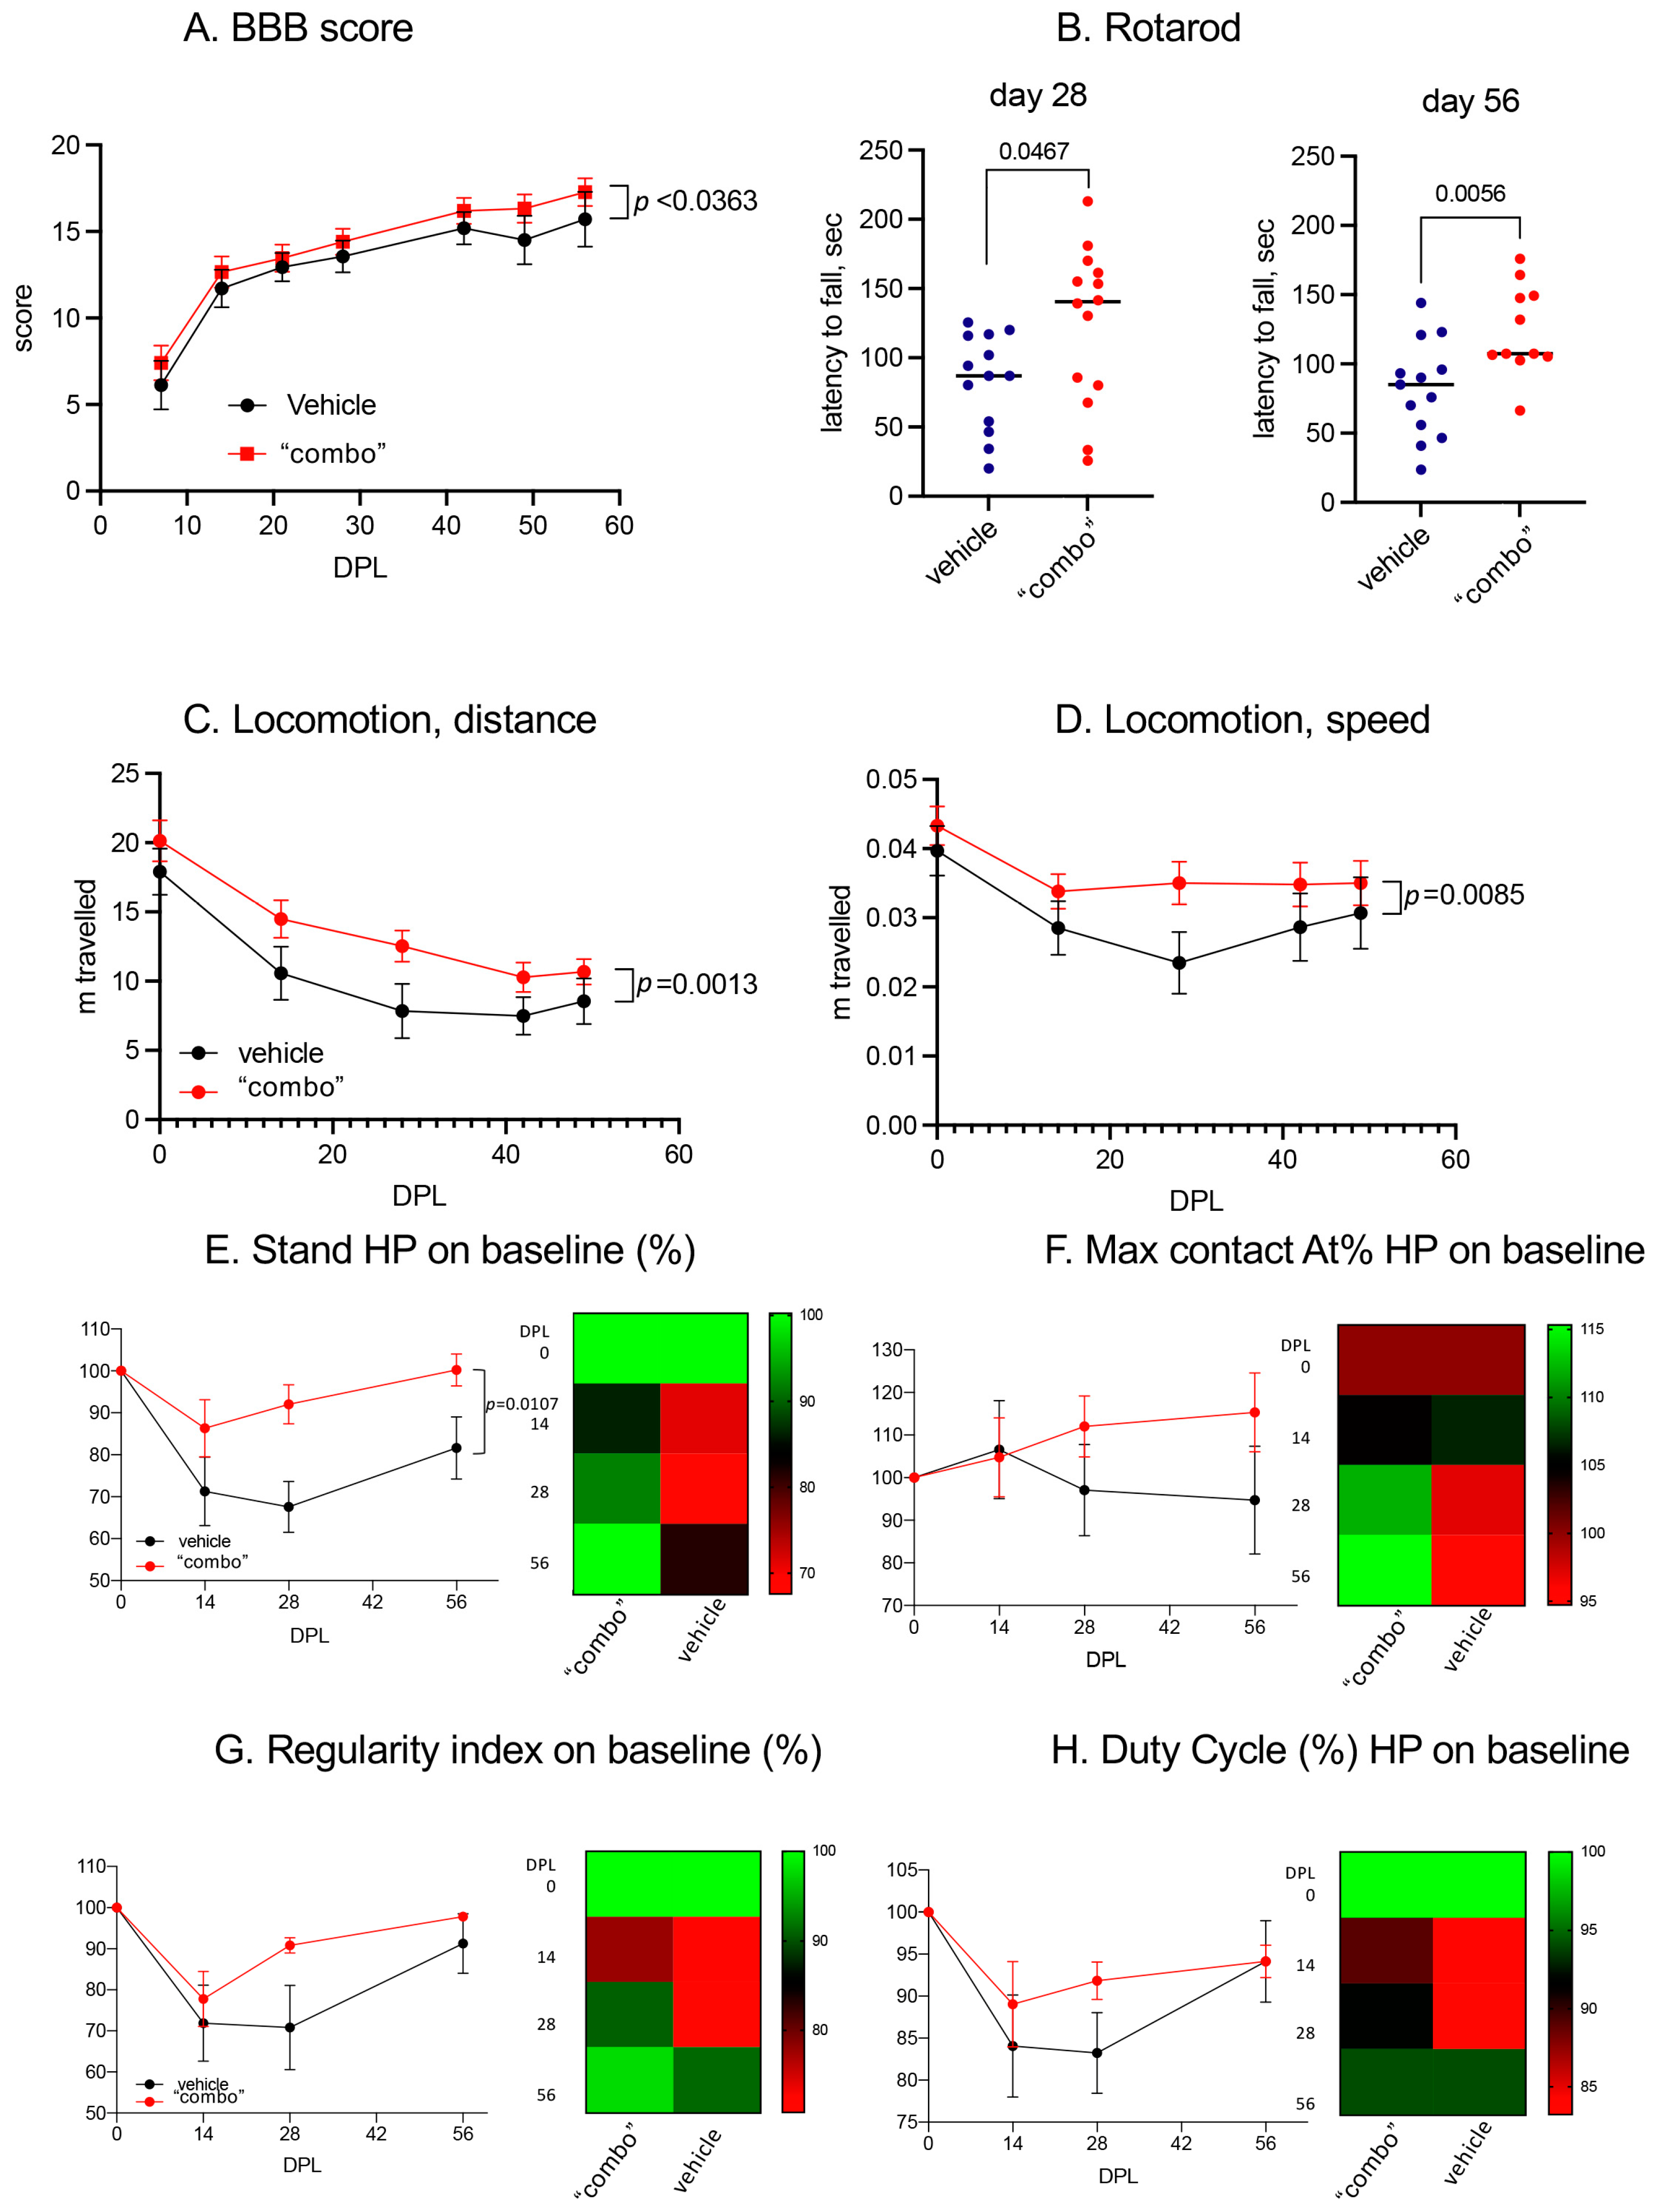
3.6. Effect of the 3× “Combo” Therapy on the Functional Outcome
4. Discussion
5. Conclusions
Author Contributions
Funding
Institutional Review Board Statement
Data Availability Statement
Conflicts of Interest
References
- Merritt, C.H.; Taylor, M.; Yelton, C.J.; Ray, S.K. Economic impact of traumatic spinal cord injuries in the United States. Neuroimmunol. Neuroinflamm. 2019, 6, 9. [Google Scholar] [CrossRef] [PubMed]
- Alizadeh, A.; Dyck, S.M.; Karimi-Abdolrezaee, S. Traumatic spinal cord injury: An overview of pathophysiology, models and acute injury mechanisms. Front. Neurol. 2019, 10, 282. [Google Scholar] [CrossRef]
- David, G.; Mohammadi, S.; Martin, A.R.; Cohen-Adad, J.; Weiskopf, N.; Thompson, A.; Freund, P. Traumatic and nontraumatic spinal cord injury: Pathological insights from neuroimaging. Nat. Rev. Neurol. 2019, 15, 718–731. [Google Scholar] [CrossRef] [PubMed]
- Ng, S.Y.; Lee, A.Y.W. Traumatic Brain Injuries: Pathophysiology and Potential Therapeutic Targets. Front. Cell. Neurosci. 2019, 13, 528. [Google Scholar] [CrossRef] [PubMed]
- Asgardoon, M.H.; Jazayeri, S.B.; Behkar, A.; Ohadi, M.A.D.; Yarmohammadi, H.; Ghodsi, Z.; Pomerani, T.I.; Mojtahedzadeh, M.; Rahimi-Movaghar, V. Pharmacologic therapies of pain in patients with spinal cord injury: A systematic review. Spinal Cord Ser. Cases 2022, 8, 65. [Google Scholar] [CrossRef]
- Stahel, P.F.; Vanderheiden, T.; Finn, M.A. Management strategies for acute spinal cord injury. Curr. Opin. Crit. Care 2012, 18, 651–660. [Google Scholar] [CrossRef] [PubMed]
- Evaniew, N.; Belley-Côté, E.P.; Fallah, N.; Noonan, V.K.; Rivers, C.S.; Dvorak, M.F. Methylprednisolone for the Treatment of Patients with Acute Spinal Cord Injuries: A Systematic Review and Meta-Analysis. J. Neurotrauma 2016, 33, 468–481. [Google Scholar] [CrossRef]
- Chew, L.-J.; DeBoy, C.A. Pharmacological approaches to intervention in hypomyelinating and demyelinating white matter pathology. Neuropharmacology 2015, 110, 605–625. [Google Scholar] [CrossRef]
- Cree, B.A.; Hartung, H.-P.; Barnett, M. New drugs for multiple sclerosis: New treatment algorithms. Curr. Opin. Neurol. 2022, 35, 262–270. [Google Scholar] [CrossRef]
- Chen, Q.; Zheng, W.; Chen, X.; Wan, L.; Qin, W.; Qi, Z.; Chen, N.; Li, K. Brain Gray Matter Atrophy after Spinal Cord Injury: A Voxel-Based Morphometry Study. Front. Hum. Neurosci. 2017, 11, 211. [Google Scholar] [CrossRef]
- Baldassarro, V.A.; Sanna, M.; Bighinati, A.; Sannia, M.; Gusciglio, M.; Giardino, L.; Lorenzini, L.; Calzà, L. A Time-Course Study of the Expression Level of Synaptic Plasticity-Associated Genes in Un-Lesioned Spinal Cord and Brain Areas in a Rat Model of Spinal Cord Injury: A Bioinformatic Approach. Int. J. Mol. Sci. 2021, 22, 8606. [Google Scholar] [CrossRef] [PubMed]
- Oh, J.; Bar-Or, A. Emerging therapies to target CNS pathophysiology in multiple sclerosis. Nat. Rev. Neurol. 2022, 18, 466–475. [Google Scholar] [CrossRef]
- Calza, L.; Fernandez, M.; Giuliani, A.; Aloe, L.; Giardino, L. Thyroid hormone activates oligodendrocyte precursors and increases a myelin-forming protein and NGF content in the spinal cord during experimental allergic encephalomyelitis. Proc. Natl. Acad. Sci. USA 2002, 99, 3258–3263. [Google Scholar] [CrossRef] [PubMed]
- Calzà, L.; Fernandez, M.; Giardino, L. Cellular approaches to central nervous system remyelination stimulation: Thyroid hormone to promote myelin repair via endogenous stem and precursor cells. J. Mol. Endocrinol. 2009, 44, 13–23. [Google Scholar] [CrossRef] [PubMed]
- Calzà, L.; Baldassarro, V.A.; Fernandez, M.; Giuliani, A.; Lorenzini, L.; Giardino, L. Thyroid Hormone and the White Matter of the Central Nervous System: From Development to Repair. Vitamins Hormones 2018, 106, 253–281. [Google Scholar] [CrossRef] [PubMed]
- Wooliscroft, L.; Altowaijri, G.; Hildebrand, A.; Samuels, M.; Oken, B.; Bourdette, D.; Cameron, M. Phase I randomized trial of liothyronine for remyelination in multiple sclerosis: A dose-ranging study with assessment of reliability of visual outcomes. Mult. Scler. Relat. Disord. 2020, 41, 102015. [Google Scholar] [CrossRef] [PubMed]
- Ottonelli, I.; Duskey, J.T.; Rinaldi, A.; Grazioli, M.V.; Parmeggiani, I.; Vandelli, M.A.; Wang, L.Z.; Prud’homme, R.K.; Tosi, G.; Ruozi, B. Microfluidic Technology for the Production of Hybrid Nanomedicines. Pharmaceutics 2021, 13, 1495. [Google Scholar] [CrossRef]
- Rinaldi, A.; Caraffi, R.; Grazioli, M.V.; Oddone, N.; Giardino, L.; Tosi, G.; Vandelli, M.A.; Calzà, L.; Ruozi, B.; Duskey, J.T. Applications of the ROS-Responsive Thioketal Linker for the Production of Smart Nanomedicines. Polymers 2022, 14, 687. [Google Scholar] [CrossRef]
- Birolini, G.; Valenza, M.; Ottonelli, I.; Passoni, A.; Favagrossa, M.; Duskey, J.T.; Bombaci, M.; Vandelli, M.A.; Colombo, L.; Bagnati, R.; et al. Insights into kinetics, release, and behavioral effects of brain-targeted hybrid nanoparticles for cholesterol delivery in Huntington’s disease. J. Control. Release 2021, 330, 587–598. [Google Scholar] [CrossRef]
- Rigon, L.; Salvalaio, M.; Pederzoli, F.; Legnini, E.; Duskey, J.T.; D’avanzo, F.; De Filippis, C.; Ruozi, B.; Marin, O.; Vandelli, M.A.; et al. Targeting Brain Disease in MPSII: Preclinical Evaluation of IDS-Loaded PLGA Nanoparticles. Int. J. Mol. Sci. 2019, 20, 2014. [Google Scholar] [CrossRef]
- Duskey, J.T.; Ottonelli, I.; Rinaldi, A.; Parmeggiani, I.; Zambelli, B.; Wang, L.Z.; Prud’homme, R.K.; Vandelli, M.A.; Tosi, G.; Ruozi, B. Tween® preserves enzyme activity and stability in PLGA nanoparticles. Nanomaterials 2021, 11, 2946. [Google Scholar] [CrossRef] [PubMed]
- Khan, M.M.; Madni, A.; Torchilin, V.; Filipczak, N.; Pan, J.; Tahir, N.; Shah, H. Lipid-chitosan hybrid nanoparticles for controlled delivery of cisplatin. Drug Deliv. 2019, 26, 765–772. [Google Scholar] [CrossRef] [PubMed]
- Ottonelli, I.; Caraffi, R.; Tosi, G.; Vandelli, M.A.; Duskey, J.T.; Ruozi, B. Tunneling Nanotubes: A New Target for Nanomedicine? Int. J. Mol. Sci. 2022, 23, 2237. [Google Scholar] [CrossRef]
- Watzlawick, R.; Sena, E.S.; Dirnagl, U.; Brommer, B.; Kopp, M.; Macleod, M.R.; Howells, D.; Schwab, J. Effect and Reporting Bias of RhoA/ROCK-Blockade Intervention on Locomotor Recovery After Spinal Cord Injury. JAMA Neurol. 2014, 71, 91–99. [Google Scholar] [CrossRef] [PubMed]
- A Kopp, M.; Liebscher, T.; Watzlawick, R.; Martus, P.; Laufer, S.; Blex, C.; Schindler, R.; Jungehulsing, G.J.; Knüppel, S.; Kreutzträger, M.; et al. SCISSOR—Spinal Cord Injury Study on Small molecule-derived Rho inhibition: A clinical study protocol. BMJ Open 2016, 6, e010651. [Google Scholar] [CrossRef] [PubMed]
- Duskey, J.T.; Rinaldi, A.; Ottonelli, I.; Caraffi, R.; De Benedictis, C.A.; Sauer, A.K.; Tosi, G.; Vandelli, M.A.; Ruozi, B.; Grabrucker, A.M. Glioblastoma Multiforme Selective Nanomedicines for Improved Anti-Cancer Treatments. Pharmaceutics 2022, 14, 1450. [Google Scholar] [CrossRef] [PubMed]
- Baldassarro, V.A.; Krezel, W.; Fernández, M.; Schuhbaur, B.; Giardino, L.; Calza, L. The role of nuclear receptors in the differentiation of oligodendrocyte precursor cells derived from fetal and adult neural stem cells. Stem Cell Res. 2019, 37, 101443. [Google Scholar] [CrossRef]
- Baldassarro, V.A. High-Content Screening Differentiation and Maturation Analysis of Fetal and Adult Neural Stem Cell-Derived Oligodendrocyte Precursor Cell Cultures. J. Vis. Exp. 2021, 169, e61988. [Google Scholar] [CrossRef]
- Baldassarro, V.A.; Marchesini, A.; Giardino, L.; Calzà, L. Differential effects of glucose deprivation on the survival of fetal versus adult neural stem cells-derived oligodendrocyte precursor cells. Glia 2019, 68, 898–917. [Google Scholar] [CrossRef]
- Bighinati, A.; Focarete, M.L.; Gualandi, C.; Pannella, M.; Giuliani, A.; Beggiato, S.; Ferraro, L.; Lorenzini, L.; Giardino, L.; Calzà, L. Improved Functional Recovery in Rat Spinal Cord Injury Induced by a Drug Combination Administered with an Implantable Polymeric Delivery System. J. Neurotrauma 2020, 37, 1708–1719. [Google Scholar] [CrossRef]
- Ramsey, J.B.; Ramer, L.M.; Inskip, J.A.; Alan, N.; Ramer, M.S.; Krassioukov, A.V. Care of Rats with Complete High-Thoracic Spinal Cord Injury. J. Neurotrauma 2010, 27, 1709–1722. [Google Scholar] [CrossRef]
- Bocchini, V.; Angeletti, P.U. The Nerve Growth Factor: Purification as a 30,000-Molecular-Weight Protein. Proc. Natl. Acad. Sci. USA 1969, 64, 787–794. [Google Scholar] [CrossRef] [PubMed]
- Basso, D.M.; Beattie, M.S.; Bresnahan, J.C. A Sensitive and Reliable Locomotor Rating Scale for Open Field Testing in Rats. J. Neurotrauma 1995, 12, 1–21. [Google Scholar] [CrossRef] [PubMed]
- Mishra, P.; Pandey, C.M.; Singh, U.; Gupta, A.; Sahu, C.; Keshri, A. Descriptive statistics and normality tests for statistical data. Ann. Card. Anaesth. 2019, 22, 67–72. [Google Scholar] [CrossRef] [PubMed]
- Harauz, G.; Ladizhansky, V.; Boggs, J.M. Structural Polymorphism and Multifunctionality of Myelin Basic Protein. Biochemistry 2009, 48, 8094–8104. [Google Scholar] [CrossRef] [PubMed]
- Hoch-Kraft, P.; White, R.; Tenzer, S.; Krämer-Albers, E.-M.; Trotter, J.; Gonsior, C. Dual role of the RNA helicase DDX5 in post-transcriptional regulation of Myelin Basic Protein in oligodendrocytes. J. Cell Sci. 2018, 131, jcs204750. [Google Scholar] [CrossRef] [PubMed]
- Kruger, G.M.; Diemel, L.T.; Copelman, C.A.; Cuzner, M.L. Myelin basic protein isoforms in myelinating and remyelinating rat brain aggregate cultures. J. Neuro. Res. 1999, 56, 241–247. Available online: https://pubmed.ncbi.nlm.nih.gov/10336253/ (accessed on 1 March 2023). [CrossRef]
- Shahsavani, N.; Kataria, H.; Karimi-Abdolrezaee, S. Mechanisms and repair strategies for white matter degeneration in CNS injury and diseases. Biochim. Biophys. Acta (BBA)—Mol. Basis Dis. 2021, 1867, 166117. [Google Scholar] [CrossRef] [PubMed]
- Lubetzki, C.; Zalc, B.; Williams, A.; Stadelmann, C.; Stankoff, B. Remyelination in multiple sclerosis: From basic science to clinical translation. Lancet Neurol. 2020, 19, 678–688. [Google Scholar] [CrossRef]
- Kremer, D.; Göttle, P.; Hartung, H.-P.; Küry, P. Pushing Forward: Remyelination as the New Frontier in CNS Diseases. Trends Neurosci. 2016, 39, 246–263. [Google Scholar] [CrossRef]
- Baydyuk, M.; Morrison, V.E.; Gross, P.S.; Huang, J.K. Extrinsic Factors Driving Oligodendrocyte Lineage Cell Progression in CNS Development and Injury. Neurochem. Res. 2020, 45, 630–642. [Google Scholar] [CrossRef] [PubMed]
- Duncan, G.J.; Manesh, S.B.; Hilton, B.J.; Assinck, P.; Plemel, J.R.; Tetzlaff, W. The fate and function of oligodendrocyte progenitor cells after traumatic spinal cord injury. Glia 2019, 68, 227–245. [Google Scholar] [CrossRef]
- Barres, B.; Lazar, M.; Raff, M.C. A novel role for thyroid hormone, glucocorticoids and retinoic acid in timing oligodendrocyte development. Development 1994, 120, 1097–1108. [Google Scholar] [CrossRef]
- Breton, J.M.; Long, K.L.P.; Barraza, M.K.; Perloff, O.S.; Kaufer, D. Hormonal Regulation of Oligodendrogenesis II: Implications for Myelin Repair. Biomolecules 2021, 11, 290. [Google Scholar] [CrossRef] [PubMed]
- Vancamp, P.; Butruille, L.; Demeneix, B.A.; Remaud, S. Thyroid Hormone and Neural Stem Cells: Repair Potential Following Brain and Spinal Cord Injury. Front. Neurosci. 2020, 14, 875. [Google Scholar] [CrossRef] [PubMed]
- Chaudhary, P.; Marracci, G.; Calkins, E.; Pocius, E.; Bensen, A.; Scanlan, T.; Emery, B.; Bourdette, D. Thyroid hormone and thyromimetics inhibit myelin and axonal degeneration and oligodendrocyte loss in EAE. J. Neuroimmunol. 2020, 352, 577468. [Google Scholar] [CrossRef]
- Calzà, L.; Baldassarro, V.; Stanzani, A.; Giardino, L.; Lorenzini, L. Neuroprotection and neuroregeneration: Roles for the white matter. Neural Regen. Res. 2022, 17, 2376. [Google Scholar] [CrossRef] [PubMed]
- Lorenzini, L.; Fernandez, M.; Baldassarro, V.A.; Bighinati, A.; Giuliani, A.; Calzà, L.; Giardino, L. White Matter and Neuroprotection in Alzheimer’s Dementia. Molecules 2020, 25, 503. [Google Scholar] [CrossRef]
- Shao, X.-R.; Wei, X.-Q.; Song, X.; Hao, L.-Y.; Cai, X.-X.; Zhang, Z.-R.; Peng, Q.; Lin, Y.-F. Independent effect of polymeric nanoparticle zeta potential/surface charge, on their cytotoxicity and affinity to cells. Cell Prolif. 2015, 48, 465–474. [Google Scholar] [CrossRef]
- Ottonelli, I.; Duskey, J.T.; Genovese, F.; Pederzoli, F.; Caraffi, R.; Valenza, M.; Tosi, G.; Vandelli, M.A.; Ruozi, B. Quantitative comparison of the protein corona of nanoparticles with different matrices. Int. J. Pharm. X 2022, 4, 100136. [Google Scholar] [CrossRef]
- Santonocito, C.; Rizza, R.; Paris, I.; De Marchis, L.; Paolillo, C.; Tiberi, G.; Scambia, G.; Capoluongo, E. Spectrum of Germline BRCA1 and BRCA2 Variants Identified in 2351 Ovarian and Breast Cancer Patients Referring to a Reference Cancer Hospital of Rome. Cancers 2020, 12, 1286. [Google Scholar] [CrossRef] [PubMed]
- Kamaly, N.; Yameen, B.; Wu, J.; Farokhzad, O.C. Degradable Controlled-Release Polymers and Polymeric Nanoparticles: Mechanisms of Controlling Drug Release. Chem. Rev. 2016, 116, 2602–2663. [Google Scholar] [CrossRef] [PubMed]
- Shultz, R.B.; Wang, Z.; Nong, J.; Zhang, Z.; Zhong, Y. Local delivery of thyroid hormone enhances oligodendrogenesis and myelination after spinal cord injury. J. Neural Eng. 2017, 14, 036014. [Google Scholar] [CrossRef] [PubMed]
- Salas-Lucia, F.; Bianco, A.C. T3 levels and thyroid hormone signaling. Front. Endocrinol. 2022, 13, 1044691. [Google Scholar] [CrossRef]
- Fernández, M.; Baldassarro, V.A.; Sivilia, S.; Giardino, L.; Calzà, L. Inflammation severely alters thyroid hormone signaling in the central nervous system during experimental allergic encephalomyelitis in rat: Direct impact on OPCs differentiation failure. Glia 2016, 64, 1573–1589. [Google Scholar] [CrossRef]
- Chew, L.-J.; King, W.C.; Kennedy, A.; Gallo, V. Interferon-γ inhibits cell cycle exit in differentiating oligodendrocyte progenitor cells. Glia 2005, 52, 127–143. [Google Scholar] [CrossRef]
- Tanner, D.C.; Cherry, J.D.; Mayer-Pröschel, M. Oligodendrocyte Progenitors Reversibly Exit the Cell Cycle and Give Rise to Astrocytes in Response to Interferon-γ. J. Neurosci. 2011, 31, 6235–6246. [Google Scholar] [CrossRef]
- Su, Z.; Yuan, Y.; Chen, J.; Zhu, Y.; Qiu, Y.; Zhu, F.; Huang, A.; He, C. Reactive Astrocytes Inhibit the Survival and Differentiation of Oligodendrocyte Precursor Cells by Secreted TNF-α. J. Neurotrauma 2011, 28, 1089–1100. [Google Scholar] [CrossRef]
- Macrez, R.; Stys, P.K.; Vivien, D.; A Lipton, S.; Docagne, F. Mechanisms of glutamate toxicity in multiple sclerosis: Biomarker and therapeutic opportunities. Lancet Neurol. 2016, 15, 1089–1102. [Google Scholar] [CrossRef]
- van der Meulen, M.; Amaya, J.M.; Dekkers, O.M.; Meijer, O.C. Association between use of systemic and inhaled glucocorticoids and changes in brain volume and white matter microstructure: A cross-sectional study using data from the UK Biobank. BMJ Open 2022, 12, e062446. [Google Scholar] [CrossRef]
- Mukhara, D.; Oh, U.; Neigh, G.N. Neuroinflammation. Handb. Clin. Neurol. 2020, 175, 235–259. [Google Scholar] [CrossRef] [PubMed]
- Luo, M.; Li, Y.Q.; Lu, Y.F.; Wu, Y.; Liu, R.; Zheng, Y.R.; Yin, M. Exploring the potential of RhoA inhibitors to improve exercise-recoverable spinal cord injury: A systematic review and meta-analysis. J. Chem. Neuroanat. 2020, 111, 101879. [Google Scholar] [CrossRef] [PubMed]
- Lambrechts, M.J.; Cook, J.L. Nonsteroidal Anti-Inflammatory Drugs and Their Neuroprotective Role After an Acute Spinal Cord Injury: A Systematic Review of Animal Models. Glob. Spine J. 2020, 11, 365–377. [Google Scholar] [CrossRef] [PubMed]
- Minnone, G.; De Benedetti, F.; Bracci-Laudiero, L. NGF and Its Receptors in the Regulation of Inflammatory Response. Int. J. Mol. Sci. 2017, 18, 1028. [Google Scholar] [CrossRef] [PubMed]
- Xia, N.; Gao, Z.; Hu, H.; Li, D.; Zhang, C.; Mei, X.; Wu, C. Nerve growth factor loaded macrophage-derived nanovesicles for inhibiting neuronal apoptosis after spinal cord injury. J. Biomater. Appl. 2021, 36, 276–288. [Google Scholar] [CrossRef] [PubMed]
- Keefe, K.M.; Sheikh, I.S.; Smith, G.M. Targeting Neurotrophins to Specific Populations of Neurons: NGF, BDNF, and NT-3 and Their Relevance for Treatment of Spinal Cord Injury. Int. J. Mol. Sci. 2017, 18, 548. [Google Scholar] [CrossRef]
- Wang, L.; Gu, S.; Gan, J.; Tian, Y.; Zhang, F.; Zhao, H.; Lei, D. Neural Stem Cells Overexpressing Nerve Growth Factor Improve Functional Recovery in Rats Following Spinal Cord Injury via Modulating Microenvironment and Enhancing Endogenous Neurogenesis. Front. Cell. Neurosci. 2021, 15, 773375. [Google Scholar] [CrossRef]
- Ji, H.; Gu, J.; Song, X.; Bao, J.; Peng, X.; Xie, L.; Wu, X. A nerve growth factor persistent delivery scaffold seeded with neurally differentiated bone marrow mesenchymal stem cells promoted the functional recovery of spinal cord injury in rats. Am. J. Transl. Res. 2021, 13, 2127–2142. [Google Scholar]
- Yang, S.; Zhang, N.; Dong, Y.; Zhang, X. Research on Polycaprolactone-Gelatin Composite Scaffolds Carrying Nerve Growth Factor for the Repair of Spinal Cord Injury. Dis. Mrk. 2022, 2022, 3880687. [Google Scholar] [CrossRef]
- Gao, X.; Cheng, W.; Zhang, X.; Zhou, Z.; Ding, Z.; Zhou, X.; Lu, Q.; Kaplan, D.L. Nerve Growth Factor-Laden Anisotropic Silk Nanofiber Hydrogels to Regulate Neuronal/Astroglial Differentiation for Scarless Spinal Cord Repair. ACS Appl. Mater. Interfaces 2022, 14, 3701–3715. [Google Scholar] [CrossRef]
- Hardingham, G.E. Coupling of the NMDA receptor to neuroprotective and neurodestructive events. Biochem. Soc. Trans. 2009, 37, 1147–1160. [Google Scholar] [CrossRef]
- Warnock, A.; Toomey, M.L.; Wright, A.J.; Fisher, M.K.; Won, M.Y.; Anyaegbu, C.; Fitzgerald, M. Damage Mechanisms to Oligodendrocytes and White Matter in Central Nervous System Injury: The Australian Context. J. Neurotrauma 2020, 37, 739–769. [Google Scholar] [CrossRef]
- Devanney, N.A.; Stewart, A.N.; Gensel, J.C. Microglia and macrophage metabolism in CNS injury and disease: The role of immunometabolism in neurodegeneration and neurotrauma. Exp. Neurol. 2020, 329, 113310. [Google Scholar] [CrossRef] [PubMed]
- Fu, S.-P.; Chen, S.-Y.; Pang, Q.-M.; Zhang, M.; Wu, X.-C.; Wan, X.; Wan, W.-H.; Ao, J.; Zhang, T. Advances in the research of the role of macrophage/microglia polarization-mediated inflammatory response in spinal cord injury. Front. Immunol. 2022, 13, 1014013. [Google Scholar] [CrossRef]
- Mazaheri, F.; Snaidero, N.; Kleinberger, G.; Madore, C.; Daria, A.; Werner, G.; Krasemann, S.; Capell, A.; Trümbach, D.; Wurst, W.; et al. TREM 2 deficiency impairs chemotaxis and microglial responses to neuronal injury. EMBO Rep. 2017, 18, 1186–1198. [Google Scholar] [CrossRef] [PubMed]
- Liu, S.; Li, X.-M.; Yuan, J.-B.; Li, L.-L.; Wang, C.; Lin, X.-M.; Miao, X.; Shi, Z.-C. MiR-665 inhibits inflammatory response in microglia following spinal cord injury by targeting TREM2. Eur. Rev. Med. Pharmacol. Sci. 2021, 25, 65–70. [Google Scholar] [PubMed]
- Wang, Y.; Kyauk, R.V.; Shen, Y.A.; Xie, L.; Reichelt, M.; Lin, H.; Jiang, Z.; Ngu, H.; Shen, K.; Greene, J.J.; et al. TREM2-dependent microglial function is essential for remyelination and subsequent neuroprotection. Glia 2023, 71, 1247–1258. [Google Scholar] [CrossRef]
- Cignarella, F.; Filipello, F.; Bollman, B.; Cantoni, C.; Locca, A.; Mikesell, R.; Manis, M.; Ibrahim, A.; Deng, L.; Benitez, B.A.; et al. TREM2 activation on microglia promotes myelin debris clearance and remyelination in a model of multiple sclerosis. Acta Neuropathol. 2020, 140, 513–534. [Google Scholar] [CrossRef] [PubMed]
- Dingman, A.L.; Rodgers, K.M.; Dietz, R.M.; Hickey, S.P.; Frazier, A.P.; Clevenger, A.C.; Yonchek, J.C.; Traystman, R.J.; Macklin, W.B.; Herson, P.S. Oligodendrocyte Progenitor Cell Proliferation and Fate after White Matter Stroke in Juvenile and Adult Mice. Dev. Neurosci. 2018, 40, 601–616. [Google Scholar] [CrossRef]


Disclaimer/Publisher’s Note: The statements, opinions and data contained in all publications are solely those of the individual author(s) and contributor(s) and not of MDPI and/or the editor(s). MDPI and/or the editor(s) disclaim responsibility for any injury to people or property resulting from any ideas, methods, instructions or products referred to in the content. |
© 2023 by the authors. Licensee MDPI, Basel, Switzerland. This article is an open access article distributed under the terms and conditions of the Creative Commons Attribution (CC BY) license (https://creativecommons.org/licenses/by/4.0/).
Share and Cite
Moretti, M.; Caraffi, R.; Lorenzini, L.; Ottonelli, I.; Sannia, M.; Alastra, G.; Baldassarro, V.A.; Giuliani, A.; Duskey, J.T.; Cescatti, M.; et al. “Combo” Multi-Target Pharmacological Therapy and New Formulations to Reduce Inflammation and Improve Endogenous Remyelination in Traumatic Spinal Cord Injury. Cells 2023, 12, 1331. https://doi.org/10.3390/cells12091331
Moretti M, Caraffi R, Lorenzini L, Ottonelli I, Sannia M, Alastra G, Baldassarro VA, Giuliani A, Duskey JT, Cescatti M, et al. “Combo” Multi-Target Pharmacological Therapy and New Formulations to Reduce Inflammation and Improve Endogenous Remyelination in Traumatic Spinal Cord Injury. Cells. 2023; 12(9):1331. https://doi.org/10.3390/cells12091331
Chicago/Turabian StyleMoretti, Marzia, Riccardo Caraffi, Luca Lorenzini, Ilaria Ottonelli, Michele Sannia, Giuseppe Alastra, Vito Antonio Baldassarro, Alessandro Giuliani, Jason Thomas Duskey, Maura Cescatti, and et al. 2023. "“Combo” Multi-Target Pharmacological Therapy and New Formulations to Reduce Inflammation and Improve Endogenous Remyelination in Traumatic Spinal Cord Injury" Cells 12, no. 9: 1331. https://doi.org/10.3390/cells12091331
APA StyleMoretti, M., Caraffi, R., Lorenzini, L., Ottonelli, I., Sannia, M., Alastra, G., Baldassarro, V. A., Giuliani, A., Duskey, J. T., Cescatti, M., Ruozi, B., Aloe, L., Vandelli, M. A., Giardino, L., Tosi, G., & Calzà, L. (2023). “Combo” Multi-Target Pharmacological Therapy and New Formulations to Reduce Inflammation and Improve Endogenous Remyelination in Traumatic Spinal Cord Injury. Cells, 12(9), 1331. https://doi.org/10.3390/cells12091331