

Hodgkin Lymphoma Cell Lines and Tissues Express mGluR5: A Potential Link to Ophelia Syndrome and Paraneoplastic Neurological Disease
 , , and
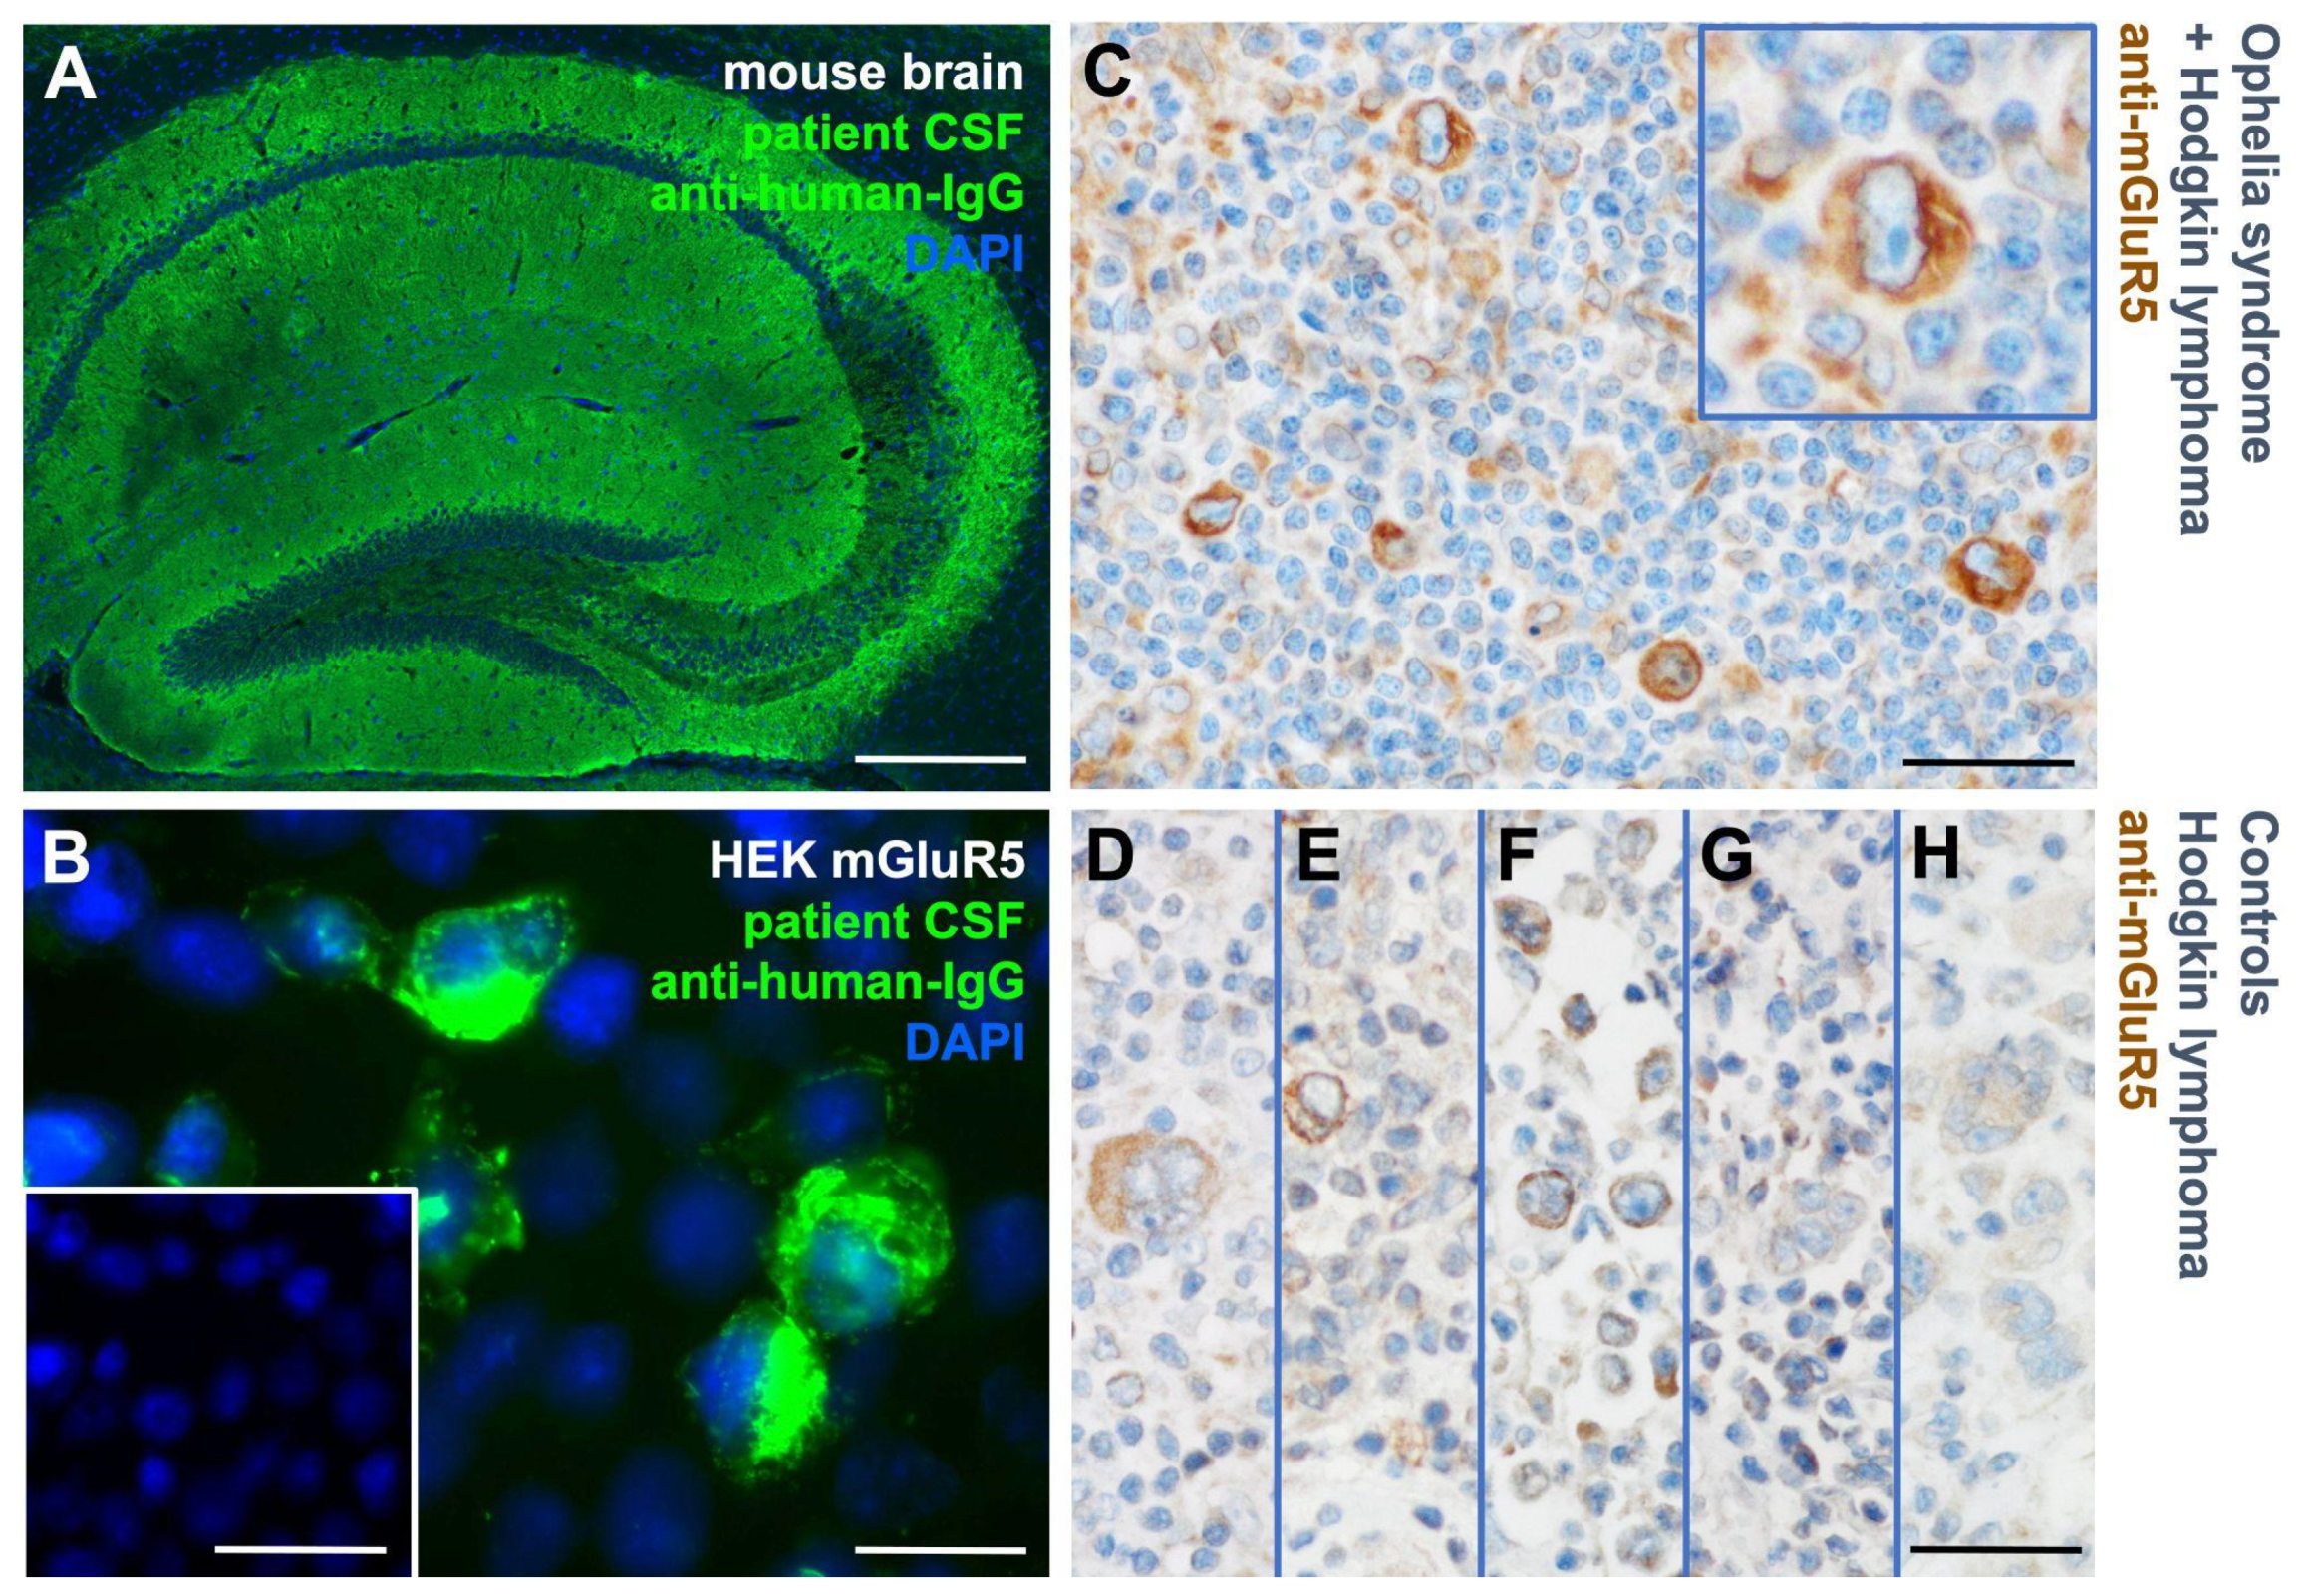
Abstract
1. Introduction
2. Materials and Methods
2.1. Patient
2.2. Immunological Studies on Tumor Tissue from Patients and Controls
2.3. Cell Lines and Culture Conditions
2.4. Immunocytochemistry—Surface Antigen Labeling and Quantification
2.5. Western Blot
2.6. Quantitative Reverse-Transcription Quantitative Polymerase-Chain-Reaction
2.7. Fluorescence-Activated Cell Sorting (FACS)
2.8. Gene Expression Profiling
2.9. Statistics
3. Results
3.1. mGluR5 Is Expressed on Hodgkin Lymphoma Tissue at Varying Levels
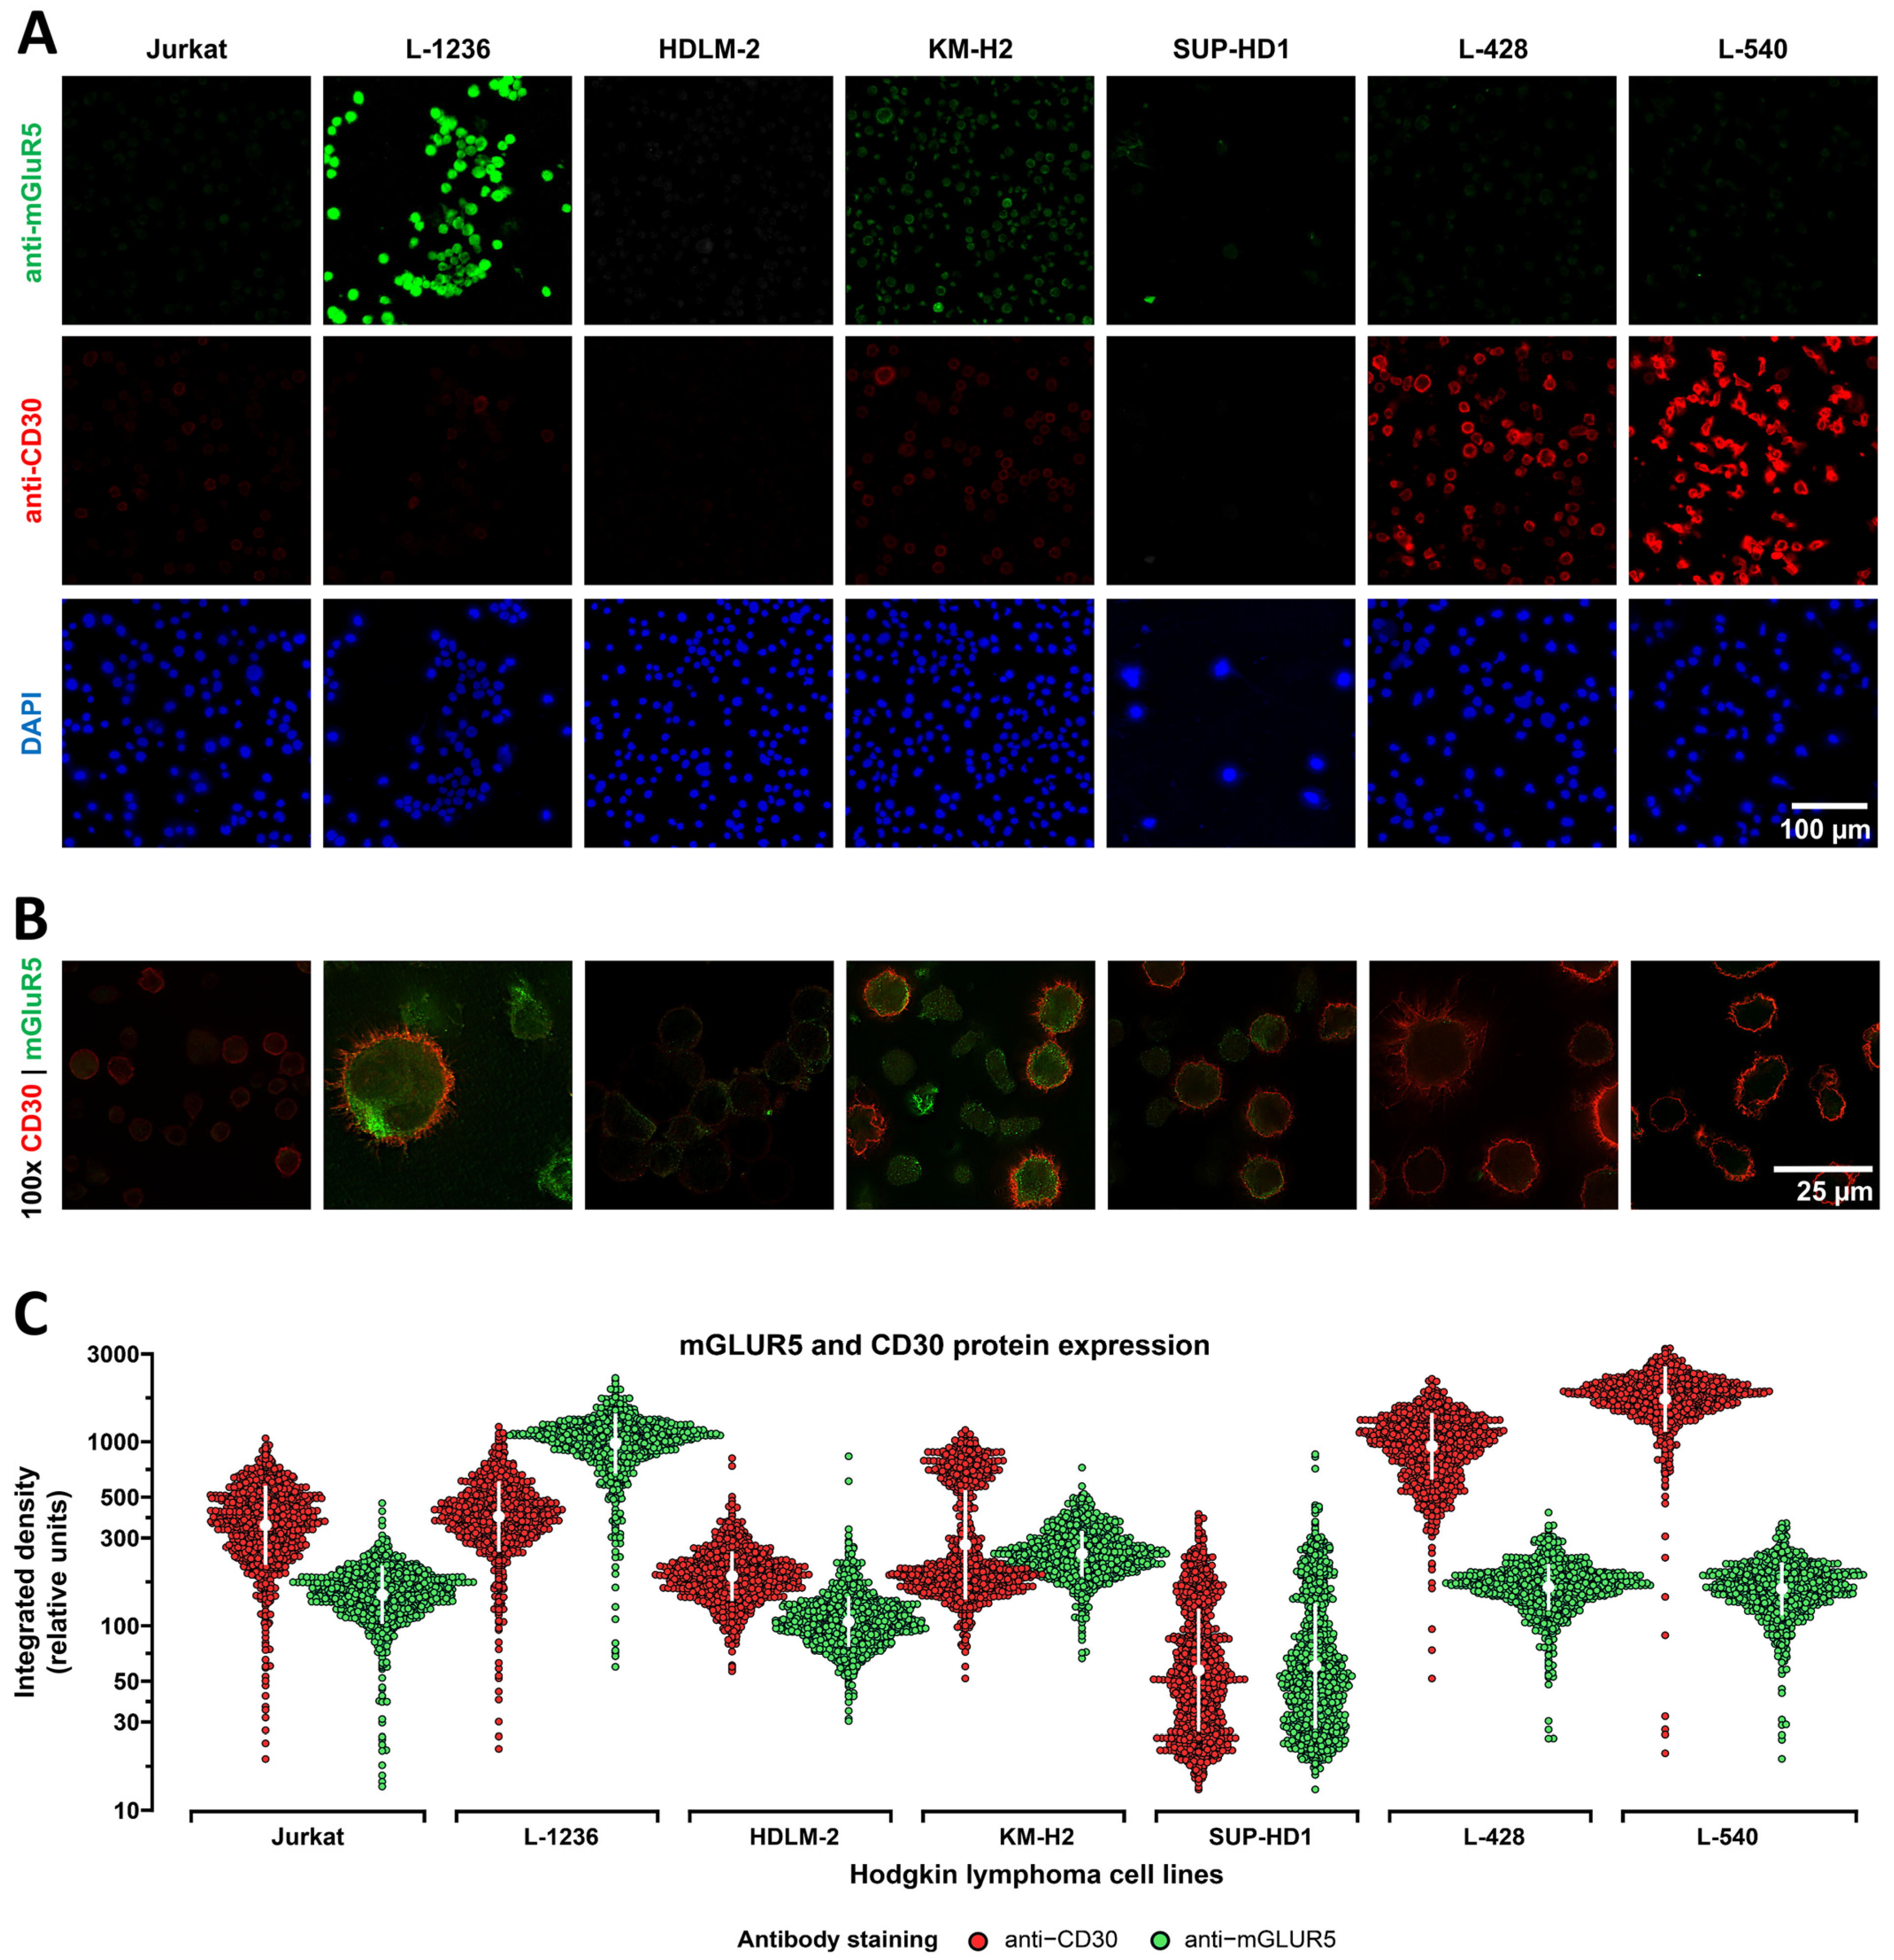
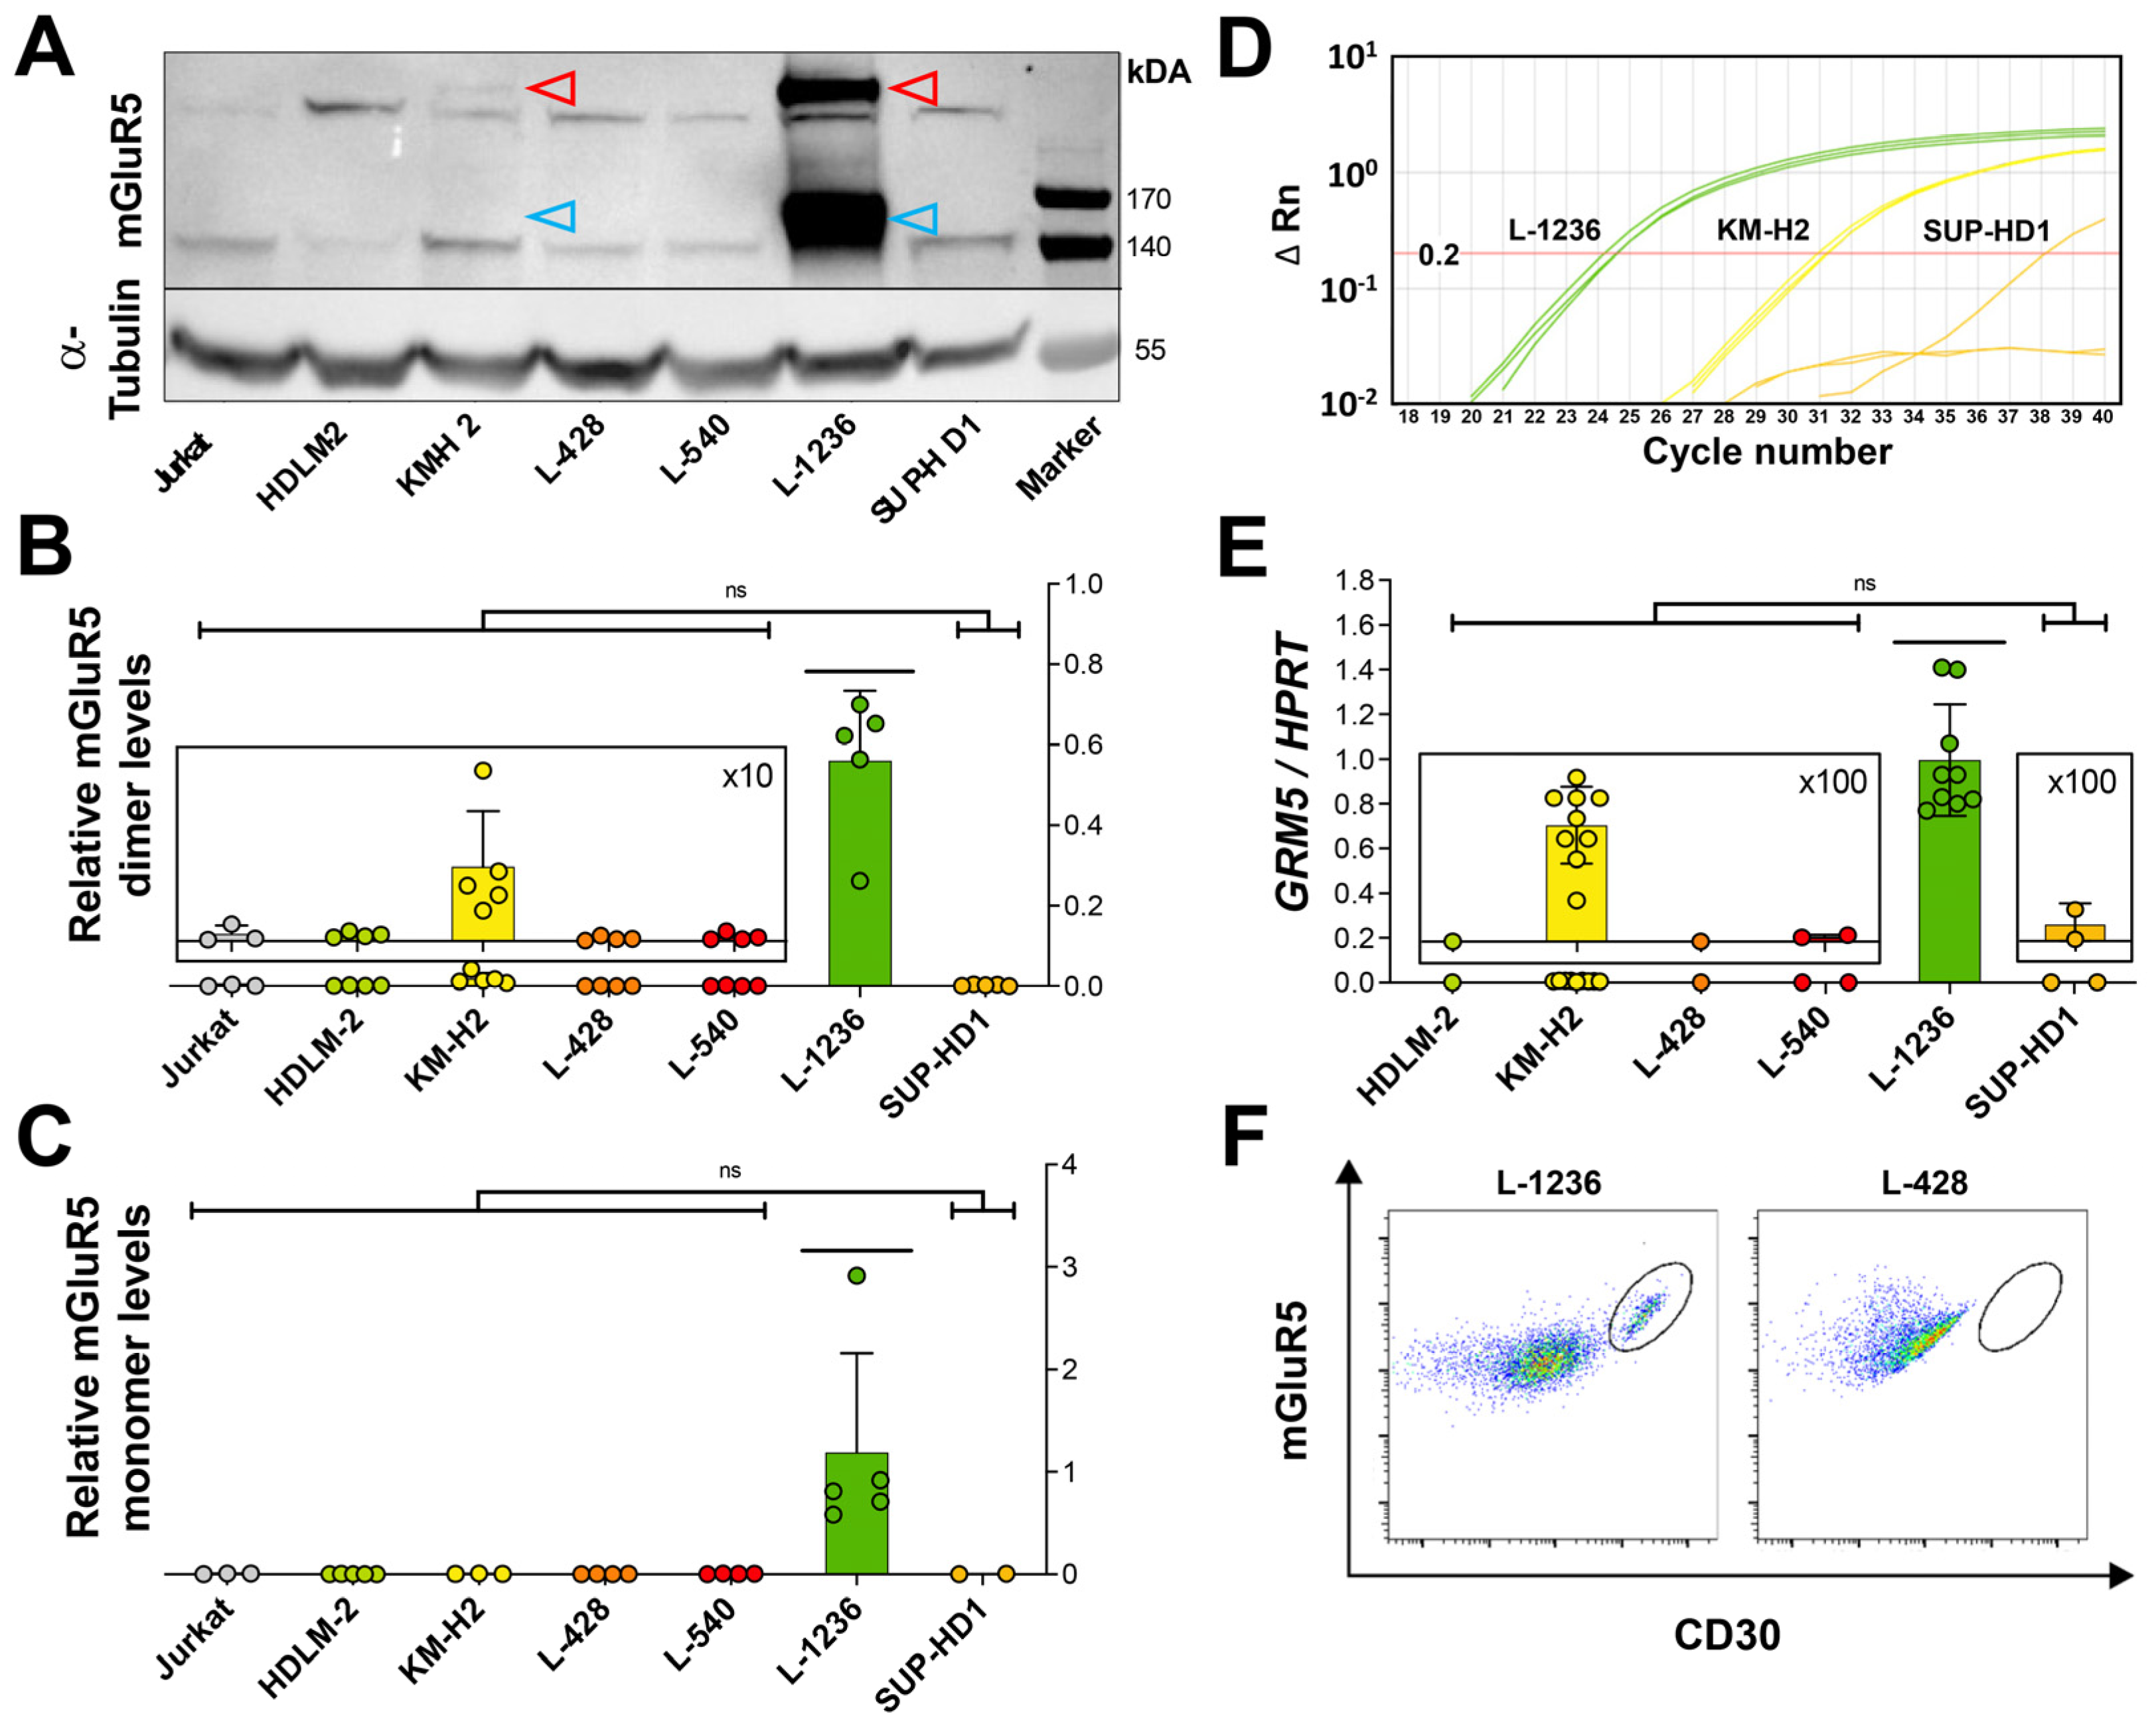
3.2. Heterogeneous mGluR5 Expression Patterns
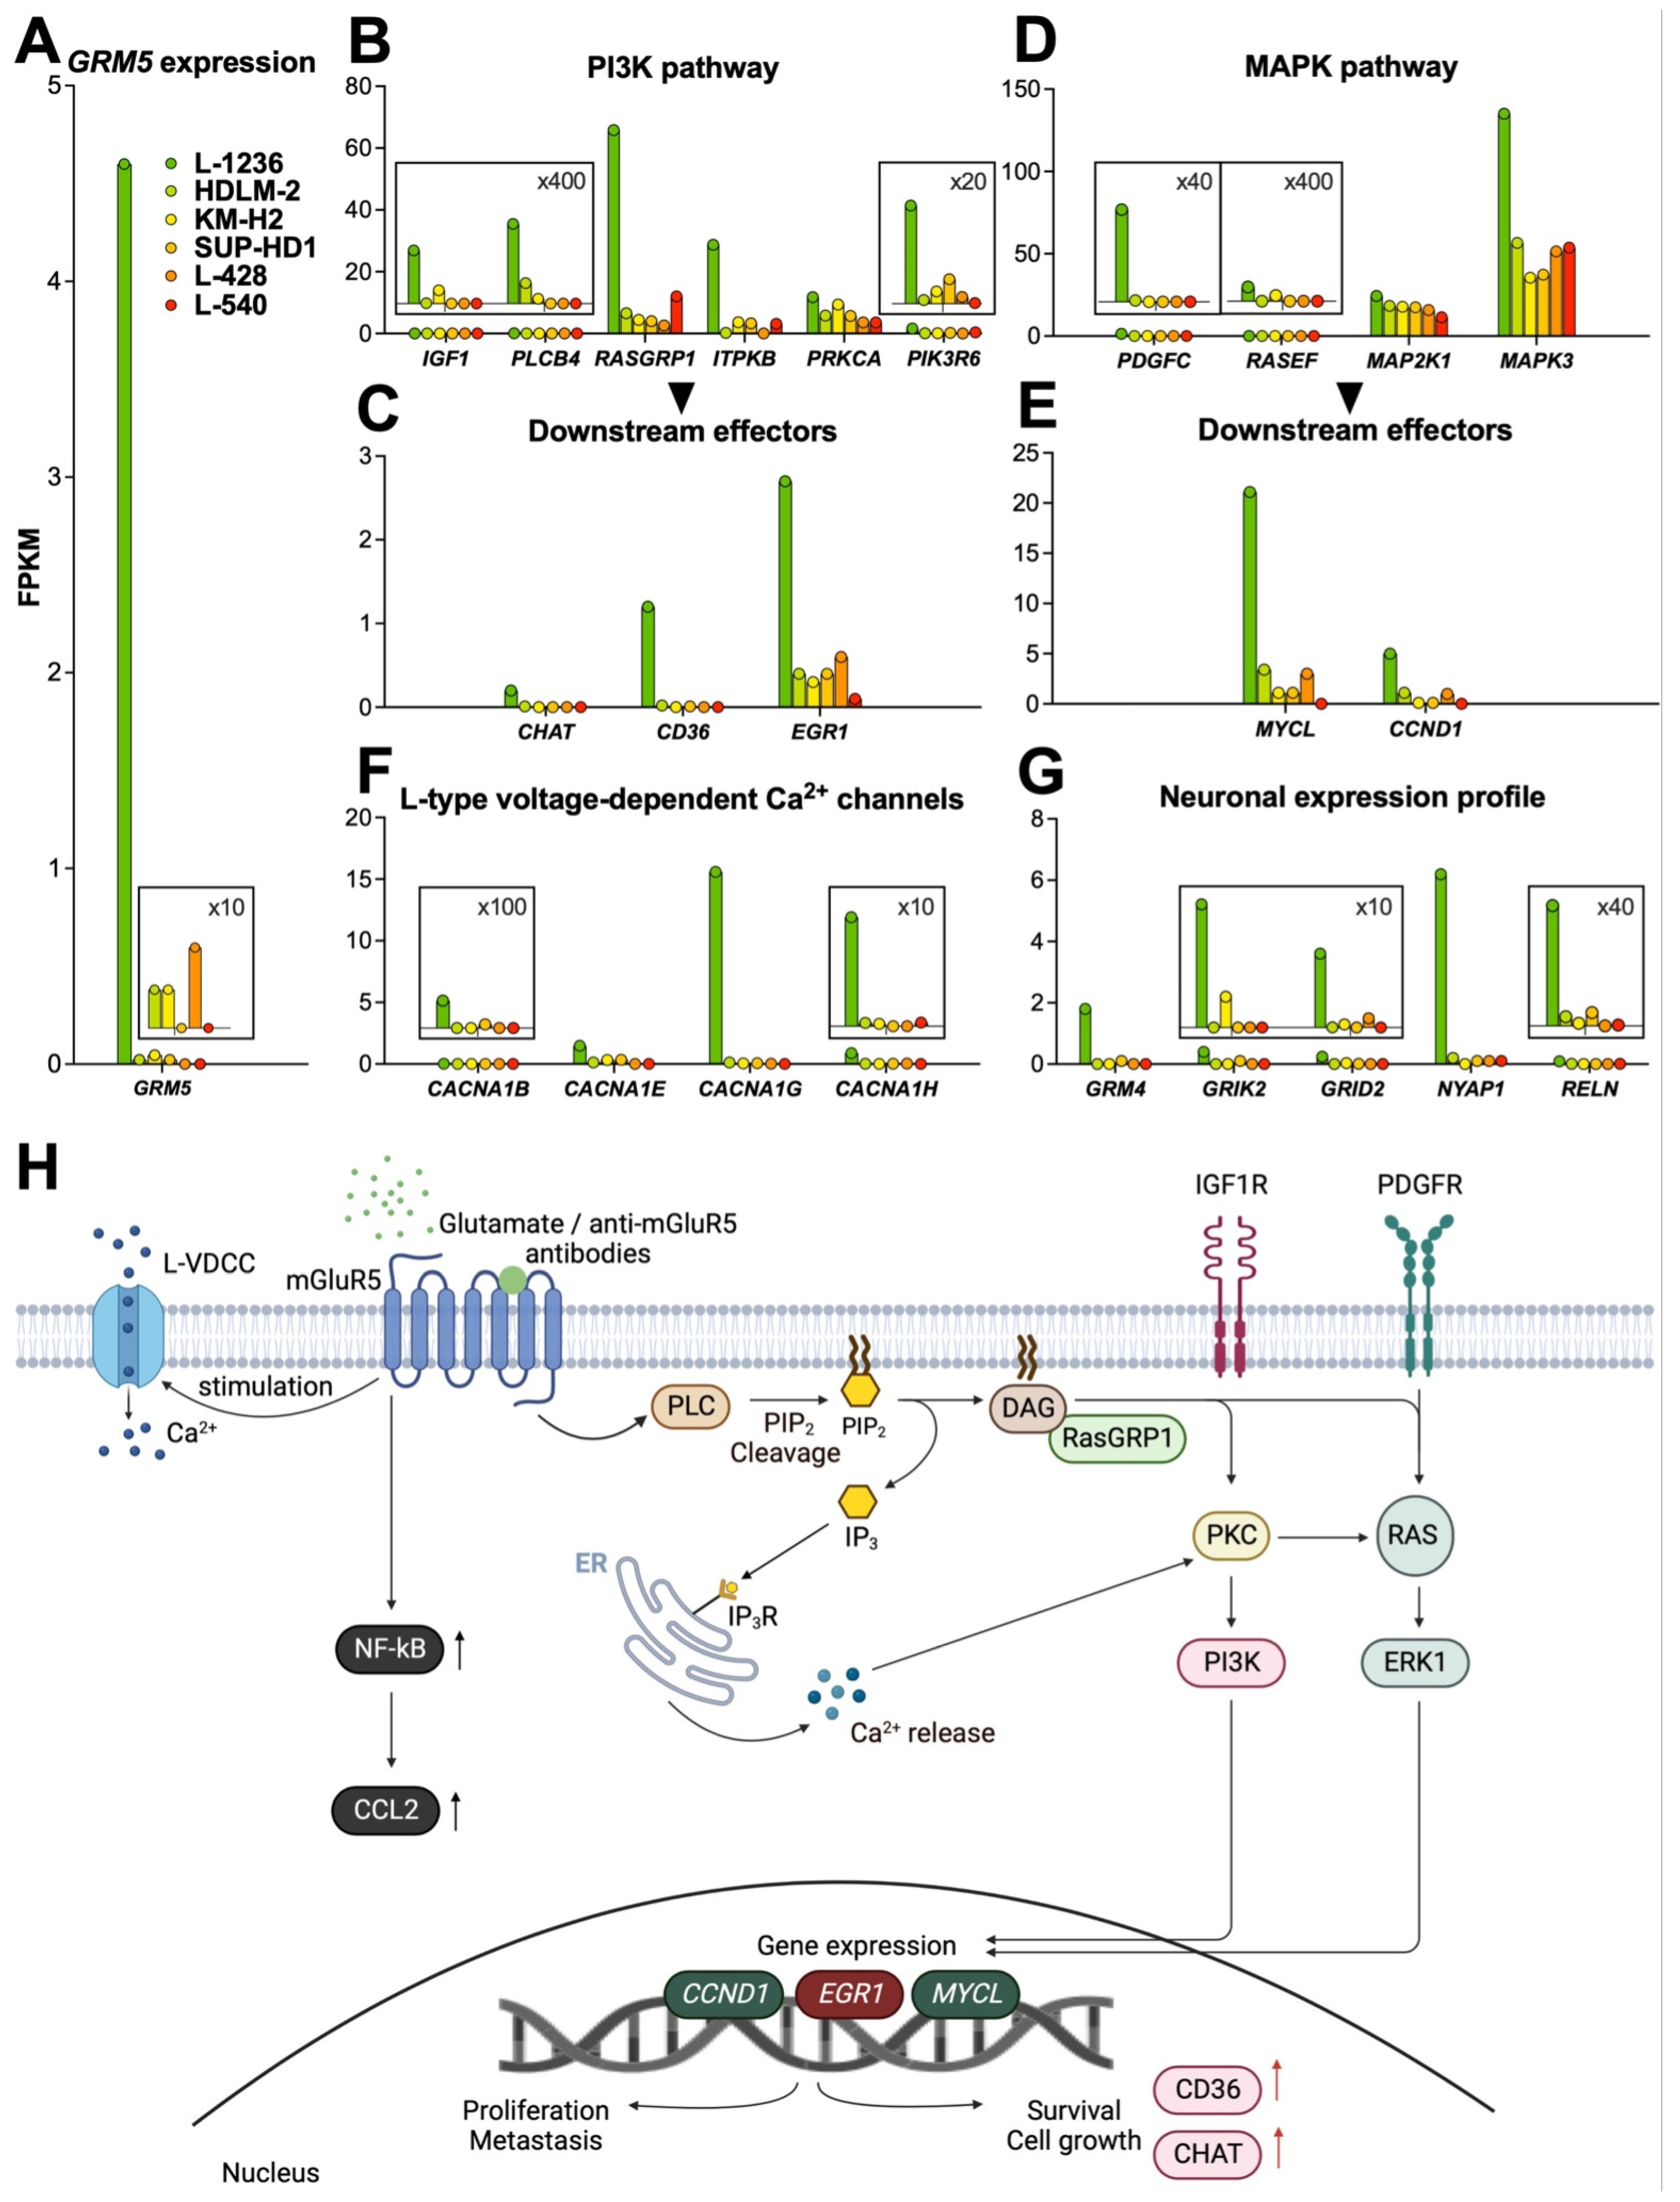
3.3. mGluR5 Expression Is Correlated with Sustained Activation of Glutamatergic Signaling Pathways
3.3.1. PI3K Pathway
3.3.2. MAPK Pathway
3.3.3. Calcium Signaling
3.3.4. NF-kB Pathway
4. Neuronal Expression Profile
5. Discussion
6. Conclusions
Supplementary Materials
Author Contributions
Funding
Institutional Review Board Statement
Informed Consent Statement
Data Availability Statement
Acknowledgments
Conflicts of Interest
References
- Weniger, M.A.; Küppers, R. Molecular Biology of Hodgkin Lymphoma. Leukemia 2021, 35, 968–981. [Google Scholar] [CrossRef]
- Tiacci, E.; Döring, C.; Brune, V.; van Noesel, C.J.M.; Klapper, W.; Mechtersheimer, G.; Falini, B.; Küppers, R.; Hansmann, M.-L. Analyzing Primary Hodgkin and Reed-Sternberg Cells to Capture the Molecular and Cellular Pathogenesis of Classical Hodgkin Lymphoma. Blood 2012, 120, 4609–4620. [Google Scholar] [CrossRef]
- Connors, J.M.; Cozen, W.; Steidl, C.; Carbone, A.; Hoppe, R.T.; Flechtner, H.-H.; Bartlett, N.L. Hodgkin Lymphoma. Nat. Rev. Dis. Prim. 2020, 6, 61. [Google Scholar] [CrossRef]
- Grimm, S.; Chamberlain, M. Hodgkin’s Lymphoma: A Review of Neurologic Complications. Adv. Hematol. 2010, 2011, e624578. [Google Scholar] [CrossRef]
- Gopas, J.; Stern, E.; Zurgil, U.; Ozer, J.; Ben-Ari, A.; Shubinsky, G.; Braiman, A.; Sinay, R.; Ezratty, J.; Dronov, V.; et al. Reed-Sternberg Cells in Hodgkin’s Lymphoma Present Features of Cellular Senescence. Cell Death Dis. 2016, 7, e2457. [Google Scholar] [CrossRef] [PubMed]
- Miller, E.B. Autoimmunity and Lymphoma: A Brief Review. J. Rheum. Dis. Treat. 2018, 4, 062. [Google Scholar] [CrossRef]
- Thomas, E.; Brewster, D.H.; Black, R.J.; Macfarlane, G.J. Risk of Malignancy among Patients with Rheumatic Conditions. Int. J. Cancer 2000, 88, 497–502. [Google Scholar] [CrossRef] [PubMed]
- Graus, F.; Ariño, H.; Dalmau, J. Paraneoplastic Neurological Syndromes in Hodgkin and Non-Hodgkin Lymphomas. Blood 2014, 123, 3230–3238. [Google Scholar] [CrossRef] [PubMed]
- Maslovsky, I.; Volchek, L.; Blumental, R.; Ducach, A.; Lugassy, G. Persistent Paraneoplastic Neurologic Syndrome after Successful Therapy of Hodgkin’s Disease. Eur. J. Haematol. 2001, 66, 63–65. [Google Scholar] [CrossRef] [PubMed]
- Juneja, M.; Kaur, S.; Mishra, D.; Jain, S. Ophelia Syndrome: Hodgkin Lymphoma with Limbic Encephalitis. INDIAN Pediatr. 2015, 52, 2. [Google Scholar]
- Rosenfeld, M.R.; Dalmau, J. Paraneoplastic Neurologic Syndromes. Neurol. Clin. 2018, 36, 675–685. [Google Scholar] [CrossRef] [PubMed]
- Briani, C.; Vitaliani, R.; Grisold, W.; Honnorat, J.; Graus, F.; Antoine, J.C.; Bertolini, G.; Giometto, B.; Euronetwork, F. The P. Spectrum of Paraneoplastic Disease Associated with Lymphoma. Neurology 2011, 76, 705–710. [Google Scholar] [CrossRef] [PubMed]
- Dropcho, E.J. Neurologic Paraneoplastic Syndromes. Curr. Oncol. Rep. 2004, 6, 26–31. [Google Scholar] [CrossRef] [PubMed]
- Dalmau, J.; Geis, C.; Graus, F. Autoantibodies to Synaptic Receptors and Neuronal Cell Surface Proteins in Autoimmune Diseases of the Central Nervous System. Physiol. Rev. 2017, 97, 839–887. [Google Scholar] [CrossRef] [PubMed]
- Goldin, L.R.; Landgren, O. Autoimmunity and Lymphomagenesis. Int. J. Cancer 2009, 124, 1497–1502. [Google Scholar] [CrossRef]
- Váróczy, L.; Gergely, L.; Zeher, M.; Szegedi, G.; Illés, Á. Malignant Lymphoma-Associated Autoimmune Diseases—A Descriptive Epidemiological Study. Rheumatol. Int. 2002, 22, 233–237. [Google Scholar] [CrossRef] [PubMed]
- Ammannagari, N.; Chikoti, S.; Bravin, E. Hodgkin’s Lymphoma Presenting as a Complex Paraneoplastic Neurological Syndrome: A Case Report. J. Med. Case Rep. 2013, 7, 96. [Google Scholar] [CrossRef] [PubMed]
- Spatola, M.; Sabater, L.; Planagumà, J.; Martínez-Hernandez, E.; Armangué, T.; Prüss, H.; Iizuka, T.; Oblitas, R.L.C.; Antoine, J.-C.; Li, R.; et al. Encephalitis with MGluR5 Antibodies: Symptoms and Antibody Effects. Neurology 2018, 90, e1964–e1972. [Google Scholar] [CrossRef]
- Lancaster, E.; Martinez-Hernandez, E.; Titulaer, M.J.; Boulos, M.; Weaver, S.; Antoine, J.-C.; Liebers, E.; Kornblum, C.; Bien, C.G.; Honnorat, J.; et al. Antibodies to Metabotropic Glutamate Receptor 5 in the Ophelia Syndrome. Neurology 2011, 77, 1698–1701. [Google Scholar] [CrossRef] [PubMed]
- Carr, I. The Ophelia syndrome: Memory loss in Hodgkin’s disease. Lancet 1982, 319, 844–845. [Google Scholar] [CrossRef] [PubMed]
- Betcherman, L.; University of Toronto, Ontario, Canada; Punnett, A.; University of Toronto, Ontario, Canada; Division of Hematology/Oncology, Hospital for Sick Children, Toronto, Ontario, Canada. Paraneoplastic Syndromes in Children with Hodgkin Lymphoma. Oncol. Hematol. Rev. US 2017, 13, 41. [Google Scholar] [CrossRef]
- Guevara, C.; Farias, G.; Silva-Rosas, C.; Alarcon, P.; Abudinen, G.; Espinoza, J.; Caro, A.; Angus-Leppan, H.; de Grazia, J. Encephalitis Associated to Metabotropic Glutamate Receptor 5 (MGluR5) Antibodies in Cerebrospinal Fluid. Front. Immunol. 2018, 9, 2568. [Google Scholar] [CrossRef] [PubMed]
- Lo, A.C.; Dieckmann, K.; Pelz, T.; Gallop-Evans, E.; Engenhart-Cabillic, R.; Vordermark, D.; Kelly, K.M.; Schwartz, C.L.; Constine, L.S.; Roberts, K.; et al. Pediatric Classical Hodgkin Lymphoma. Pediatr. Blood Cancer 2021, 68, e28562. [Google Scholar] [CrossRef]
- Drexler, H.G.; Gignac, S.M.; Hoffbrand, A.V.; Leber, B.F.; Norton, J.; Lok, M.S.; Minowada, J. Characterization of Hodgkin’s Disease Derived Cell Line HDLM-2. In New Aspects in the Diagnosis and Treatment of Hodgkin’s Disease; Diehl, V., Pfreundschuh, M., Loeffler, M., Eds.; Springer: Berlin/Heidelberg, Germany, 1989; pp. 75–82. [Google Scholar]
- Naumovski, L.; Utz, P.; Bergstrom, S.; Morgan, R.; Molina, A.; Toole, J.; Glader, B.; McFall, P.; Weiss, L.; Warnke, R. SUP-HD1: A New Hodgkin’s Disease-Derived Cell Line with Lymphoid Features Produces Interferon-Gamma [See Comments]. Blood 1989, 74, 2733–2742. [Google Scholar] [CrossRef]
- Drexler, H.G.; Gaedicke, G.; Lok, M.S.; Diehl, V.; Minowada, J. Hodgkin’s Disease Derived Cell Lines HDLM-2 and L-428: Comparison of Morphology, Immunological and Isoenzyme Profiles. Leuk. Res. 1986, 10, 487–500. [Google Scholar] [CrossRef] [PubMed]
- Schaadt, M.; Fonatsch, C.; Kirchner, H.; Diehl, V. Establishment of a Malignant, Epstein-Barr-Virus (EBV)-Negative Cell-Line from the Pleura Effusion of a Patient with Hodgkin’s Disease. Blut 1979, 38, 185–190. [Google Scholar] [CrossRef]
- Wolf, J.; Kapp, U.; Bohlen, H.; Kornacker, M.; Schoch, C.; Stahl, B.; Mucke, S.; von Kalle, C.; Fonatsch, C.; Schaefer, H.; et al. Peripheral Blood Mononuclear Cells of a Patient with Advanced Hodgkin’s Lymphoma Give Rise to Permanently Growing Hodgkin-Reed Sternberg Cells. Blood 1996, 87, 3418–3428. [Google Scholar] [CrossRef]
- Diehl, V.; Kirchner, H.H.; Schaadt, M.; Fonatsch, C.; Stein, H.; Gerdes, J.; Bote, C. Hodgkin’s Disease: Establishment and Characterization of Four in Vitro Cell Lines. J. Cancer Res. Clin. Oncol. 1981, 101, 111–124. [Google Scholar] [CrossRef] [PubMed]
- Nikolaus, M.; Meisel, C.; Kreye, J.; Prüss, H.; Reindl, M.; Kaindl, A.M.; Schuelke, M.; Knierim, E. Presence of Anti-Neuronal Antibodies in Children with Neurological Disorders beyond Encephalitis. Eur. J. Paediatr. Neurol. 2020, 28, 159–166. [Google Scholar] [CrossRef] [PubMed]
- Kreye, J.; Wenke, N.K.; Chayka, M.; Leubner, J.; Murugan, R.; Maier, N.; Jurek, B.; Ly, L.-T.; Brandl, D.; Rost, B.R.; et al. Human Cerebrospinal Fluid Monoclonal N-Methyl-D-Aspartate Receptor Autoantibodies Are Sufficient for Encephalitis Pathogenesis. Brain 2016, 139, 2641–2652. [Google Scholar] [CrossRef] [PubMed]
- Pfaffl, M.W. A New Mathematical Model for Relative Quantification in Real-Time RT–PCR. Nucleic Acids Res. 2001, 29, e45. [Google Scholar] [CrossRef]
- Dobin, A.; Davis, C.A.; Schlesinger, F.; Drenkow, J.; Zaleski, C.; Jha, S.; Batut, P.; Chaisson, M.; Gingeras, T.R. STAR: Ultrafast Universal RNA-Seq Aligner. Bioinformatics 2013, 29, 15–21. [Google Scholar] [CrossRef]
- Pertea, M.; Pertea, G.M.; Antonescu, C.M.; Chang, T.-C.; Mendell, J.T.; Salzberg, S.L. StringTie Enables Improved Reconstruction of a Transcriptome from RNA-Seq Reads. Nat. Biotechnol. 2015, 33, 290–295. [Google Scholar] [CrossRef] [PubMed]
- Pertea, M.; Kim, D.; Pertea, G.M.; Leek, J.T.; Salzberg, S.L. Transcript-Level Expression Analysis of RNA-Seq Experiments with HISAT, StringTie and Ballgown. Nat. Protoc. 2016, 11, 1650–1667. [Google Scholar] [CrossRef]
- Reiner, A.; Yekutieli, D.; Benjamini, Y. Identifying Differentially Expressed Genes Using False Discovery Rate Controlling Procedures. Bioinformatics 2003, 19, 368–375. [Google Scholar] [CrossRef] [PubMed]
- Huang, D.W.; Sherman, B.T.; Tan, Q.; Kir, J.; Liu, D.; Bryant, D.; Guo, Y.; Stephens, R.; Baseler, M.W.; Lane, H.C.; et al. DAVID Bioinformatics Resources: Expanded Annotation Database and Novel Algorithms to Better Extract Biology from Large Gene Lists. Nucleic Acids Res. 2007, 35, W169–W175. [Google Scholar] [CrossRef]
- Agostinelli, C.; Pileri, S. Pathobiology of Hodgkin lympoma. Mediterr. J. Hematol. Infect. Dis. 2014, 6, e2014040. [Google Scholar] [CrossRef] [PubMed]
- Seitz, V.; Thomas, P.E.; Zimmermann, K.; Paul, U.; Ehlers, A.; Joosten, M.; Dimitrova, L.; Lenze, D.; Sommerfeld, A.; Oker, E.; et al. Classical Hodgkin’s Lymphoma Shows Epigenetic Features of Abortive Plasma Cell Differentiation. Haematologica 2011, 96, 863–870. [Google Scholar] [CrossRef]
- Kirschstein, T.; Bauer, M.; Müller, L.; Rüschenschmidt, C.; Reitze, M.; Becker, A.J.; Schoch, S.; Beck, H. Loss of Metabotropic Glutamate Receptor-Dependent Long-Term Depression via Downregulation of MGluR5 after Status Epilepticus. J. Neurosci. 2007, 27, 7696–7704. [Google Scholar] [CrossRef] [PubMed]
- Romano, C.; Yang, W.-L.; O’Malley, K.L. Metabotropic Glutamate Receptor 5 Is a Disulfide-Linked Dimer*. J. Biol. Chem. 1996, 271, 28612–28616. [Google Scholar] [CrossRef]
- Steidl, C.; Lee, T.; Shah, S.P.; Farinha, P.; Han, G.; Nayar, T.; Delaney, A.; Jones, S.J.; Iqbal, J.; Weisenburger, D.D.; et al. Tumor-Associated Macrophages and Survival in Classic Hodgkin’s Lymphoma. N. Engl. J. Med. 2010, 362, 875–885. [Google Scholar] [CrossRef] [PubMed]
- Eddy, K.; Chen, S. Glutamatergic Signaling a Therapeutic Vulnerability in Melanoma. Cancers 2021, 13, 3874. [Google Scholar] [CrossRef]
- Prickett, T.D.; Samuels, Y. Molecular Pathways: Dysregulated Glutamatergic Signaling Pathways in Cancer. Clin. Cancer Res. Off. J. Am. Assoc. Cancer Res. 2012, 18, 4240–4246. [Google Scholar] [CrossRef] [PubMed]
- Ebinu, J.O.; Bottorff, D.A.; Chan, E.Y.; Stang, S.L.; Dunn, R.J.; Stone, J.C. RasGRP, a Ras Guanyl Nucleotide- Releasing Protein with Calcium- and Diacylglycerol-Binding Motifs. Science 1998, 280, 1082–1086. [Google Scholar] [CrossRef]
- Dhillon, A.S.; Hagan, S.; Rath, O.; Kolch, W. MAP Kinase Signalling Pathways in Cancer. Oncogene 2007, 26, 3279–3290. [Google Scholar] [CrossRef] [PubMed]
- Kato, H.K.; Kassai, H.; Watabe, A.M.; Aiba, A.; Manabe, T. Functional Coupling of the Metabotropic Glutamate Receptor, InsP3 Receptor and L-Type Ca2+ Channel in Mouse CA1 Pyramidal Cells. J. Physiol. 2012, 590, 3019–3034. [Google Scholar] [CrossRef]
- Wang, S.; Li, X.; Zhang, Q.; Chai, X.; Wang, Y.; Förster, E.; Zhu, X.; Zhao, S. Nyap1 Regulates Multipolar–Bipolar Transition and Morphology of Migrating Neurons by Fyn Phosphorylation during Corticogenesis. Cereb. Cortex 2020, 30, 929–941. [Google Scholar] [CrossRef]
- Qiu, S.; Zhao, L.F.; Korwek, K.M.; Weeber, E.J. Differential Reelin-Induced Enhancement of NMDA and AMPA Receptor Activity in the Adult Hippocampus. J. Neurosci. 2006, 26, 12943–12955. [Google Scholar] [CrossRef]
- Hou, L.; Klann, E. Activation of the Phosphoinositide 3-Kinase-Akt-Mammalian Target of Rapamycin Signaling Pathway Is Required for Metabotropic Glutamate Receptor-Dependent Long-Term Depression. J. Neurosci. 2004, 24, 6352–6361. [Google Scholar] [CrossRef]
- Reiner, A.; Levitz, J. Glutamatergic Signaling in the Central Nervous System: Ionotropic and Metabotropic Receptors in Concert. Neuron 2018, 98, 1080–1098. [Google Scholar] [CrossRef]
- Yu, L.J.; Wall, B.A.; Wangari-Talbot, J.; Chen, S. Metabotropic Glutamate Receptors in Cancer. Neuropharmacology 2017, 115, 193–202. [Google Scholar] [CrossRef] [PubMed]
- Liu, F.; Yang, X.; Geng, M.; Huang, M. Targeting ERK, an Achilles’ Heel of the MAPK Pathway, in Cancer Therapy. Acta Pharm. Sin. B 2018, 8, 552–562. [Google Scholar] [CrossRef]
- Sun, R.-F.; Yu, Q.-Q.; Young, K.H. Critically Dysregulated Signaling Pathways and Clinical Utility of the Pathway Biomarkers in Lymphoid Malignancies. Chronic Dis. Transl. Med. 2018, 4, 29–44. [Google Scholar] [CrossRef] [PubMed]
- Teh, J.L.F.; Chen, S. Glutamatergic Signaling in Cellular Transformation. Pigment. Cell Melanoma Res. 2012, 25, 331–342. [Google Scholar] [CrossRef] [PubMed]
- Nakatsumi, H.; Matsumoto, M.; Nakayama, K.I. Noncanonical Pathway for Regulation of CCL2 Expression by an MTORC1-FOXK1 Axis Promotes Recruitment of Tumor-Associated Macrophages. Cell Rep. 2017, 21, 2471–2486. [Google Scholar] [CrossRef]
- Wang, J.; Li, Y. CD36 Tango in Cancer: Signaling Pathways and Functions. Theranostics 2019, 9, 4893–4908. [Google Scholar] [CrossRef]
- Wang, B.; Guo, H.; Yu, H.; Chen, Y.; Xu, H.; Zhao, G. The Role of the Transcription Factor EGR1 in Cancer. Front. Oncol. 2021, 11, 642547. [Google Scholar] [CrossRef] [PubMed]
- González-Ruiz, L.; González-Moles, M.Á.; González-Ruiz, I.; Ruiz-Ávila, I.; Ayén, Á.; Ramos-García, P. An Update on the Implications of Cyclin D1 in Melanomas. Pigment Cell Melanoma Res. 2020, 33, 788–805. [Google Scholar] [CrossRef]
- Cai, Q.; Medeiros, L.J.; Xu, X.; Young, K.H. MYC-Driven Aggressive B-Cell Lymphomas: Biology, Entity, Differential Diagnosis and Clinical Management. Oncotarget 2015, 6, 38591–38616. [Google Scholar] [CrossRef]
- Klapproth, K.; Wirth, T. Advances in the Understanding of MYC-Induced Lymphomagenesis. Br. J. Haematol. 2010, 149, 484–497. [Google Scholar] [CrossRef]
- Cheng, K.; Samimi, R.; Xie, G.; Shant, J.; Drachenberg, C.; Wade, M.; Davis, R.J.; Nomikos, G.; Raufman, J.-P. Acetylcholine Release by Human Colon Cancer Cells Mediates Autocrine Stimulation of Cell Proliferation. Am. J. Physiol.-Gastrointest. Liver Physiol. 2008, 295, G591–G597. [Google Scholar] [CrossRef] [PubMed]
- Song, P.; Sekhon, H.S.; Jia, Y.; Keller, J.A.; Blusztajn, J.K.; Mark, G.P.; Spindel, E.R. Acetylcholine Is Synthesized by and Acts as an Autocrine Growth Factor for Small Cell Lung Carcinoma. Cancer Res. 2003, 63, 214–221. [Google Scholar] [PubMed]
- Hao, Q.; Vadgama, J.V.; Wang, P. CCL2/CCR2 Signaling in Cancer Pathogenesis. Cell Commun. Signal. 2020, 18, 82. [Google Scholar] [CrossRef]
- Nagarsheth, N.; Wicha, M.S.; Zou, W. Chemokines in the Cancer Microenvironment and Their Relevance in Cancer Immunotherapy. Nat. Rev. Immunol. 2017, 17, 559–572. [Google Scholar] [CrossRef] [PubMed]
- Nicoletti, F.; Arcella, A.; Iacovelli, L.; Battaglia, G.; Giangaspero, F.; Melchiorri, D. Metabotropic Glutamate Receptors: New Targets for the Control of Tumor Growth? Trends Pharmacol. Sci. 2007, 28, 206–213. [Google Scholar] [CrossRef]
- Brocke, K.S.; Staufner, C.; Luksch, H.; Geiger, K.D.; Stepulak, A.; Marzahn, J.; Schackert, G.; Temme, A.; Ikonomidou, C. Glutamate Receptors in Pediatric Tumors of the Central Nervous System. Cancer Biol. Ther. 2010, 9, 455–468. [Google Scholar] [CrossRef] [PubMed]
- Teh, J.; Chen, S. Metabotropic Glutamate Receptors and Cancerous Growth. Wiley Interdiscip. Rev. Membr. Transp. Signal. 2012, 1, 211–220. [Google Scholar] [CrossRef]
- Rzeski, W.; Turski, L.; Ikonomidou, C. Glutamate Antagonists Limit Tumor Growth. Proc. Natl. Acad. Sci. USA 2001, 98, 6372–6377. [Google Scholar] [CrossRef]
- Marín, Y.E.; Namkoong, J.; Shin, S.-S.; Raines, J.; Degenhardt, K.; White, E.; Chen, S. Grm5 Expression Is Not Required for the Oncogenic Role of Grm1 in Melanocytes. Neuropharmacology 2005, 49, 70–79. [Google Scholar] [CrossRef]
- Choi, K.Y.; Chang, K.; Pickel, J.M.; Badger, J.D.; Roche, K.W. Expression of the Metabotropic Glutamate Receptor 5 (MGluR5) Induces Melanoma in Transgenic Mice. Proc. Natl. Acad. Sci. USA 2011, 108, 15219–15224. [Google Scholar] [CrossRef]
- Park, S.-Y.; Lee, S.-A.; Han, I.-H.; Yoo, B.-C.; Lee, S.-H.; Park, J.-Y.; Cha, I.-H.; Kim, J.; Choi, S.-W. Clinical Significance of Metabotropic Glutamate Receptor 5 Expression in Oral Squamous Cell Carcinoma. Oncol. Rep. 2007, 17, 81–87. [Google Scholar] [CrossRef]
- Ferraguti, F.; Corti, C.; Valerio, E.; Mion, S.; Xuereb, J. Activated Astrocytes in Areas of Kainate-Induced Neuronal Injury Upregulate the Expression of the Metabotropic Glutamate Receptors 2/3 and 5. Exp. Brain Res. 2001, 137, 1–11. [Google Scholar] [CrossRef]
- Pacheco, R.; Gallart, T.; Lluis, C.; Franco, R. Role of Glutamate on T-Cell Mediated Immunity. J. Neuroimmunol. 2007, 185, 9–19. [Google Scholar] [CrossRef]
- Cao, Y. Tumorigenesis as a Process of Gradual Loss of Original Cell Identity and Gain of Properties of Neural Precursor/Progenitor Cells. Cell Biosci. 2017, 7, 61. [Google Scholar] [CrossRef]
- Jung, E.; Alfonso, J.; Monyer, H.; Wick, W.; Winkler, F. Neuronal Signatures in Cancer. Int. J. Cancer 2020, 147, 3281–3291. [Google Scholar] [CrossRef] [PubMed]
- Drexler, H.G.; Pommerenke, C.; Eberth, S.; Nagel, S. Hodgkin Lymphoma Cell Lines: To Separate the Wheat from the Chaff. Biol. Chem. 2018, 399, 511–523. [Google Scholar] [CrossRef] [PubMed]
- Ruiz-García, R.; Martínez-Hernández, E.; Joubert, B.; Petit-Pedrol, M.; Pajarón-Boix, E.; Fernández, V.; Salais, L.; del Pozo, M.; Armangué, T.; Sabater, L.; et al. Paraneoplastic Cerebellar Ataxia and Antibodies to Metabotropic Glutamate Receptor 2. Neurol.-Neuroimmunol. Neuroinflamm. 2020, 7, e658. [Google Scholar] [CrossRef] [PubMed]
- Deodhare, S.; O’Connor, P.; Ghazarian, D.; Bilbao, J.M. Paraneoplastic Limbic Encephalitis in Hodgkin’s Disease. Can. J. Neurol. Sci. 1996, 23, 138–140. [Google Scholar] [CrossRef]
- Rosenbaum, T.; Gärtner, J.; Körholz, D.; Janßen, G.; Schneider, D.; Engelbrecht, V.; Göbel, U.; Lenard, H.-G. Paraneoplastic Limbic Encephalitis in Two Teenage Girls. Neuropediatrics 1998, 29, 159–162. [Google Scholar] [CrossRef]
- Ypma, P.F.; Wijermans, P.W.; Koppen, H.; Sillevis Smitt, P.a.E. Paraneoplastic Cerebellar Degeneration Preceding the Diagnosis of Hodgkin’s Lymphoma. Neth. J. Med. 2006, 64, 243–247. [Google Scholar]
- Barrett, T.; Wilhite, S.E.; Ledoux, P.; Evangelista, C.; Kim, I.F.; Tomashevsky, M.; Marshall, K.A.; Phillippy, K.H.; Sherman, P.M.; Holko, M.; et al. NCBI GEO: Archive for Functional Genomics Data Sets—Update. Nucleic Acids Res. 2013, 41, D991–D995. [Google Scholar] [CrossRef] [PubMed]


Disclaimer/Publisher’s Note: The statements, opinions and data contained in all publications are solely those of the individual author(s) and contributor(s) and not of MDPI and/or the editor(s). MDPI and/or the editor(s) disclaim responsibility for any injury to people or property resulting from any ideas, methods, instructions or products referred to in the content. |
© 2023 by the authors. Licensee MDPI, Basel, Switzerland. This article is an open access article distributed under the terms and conditions of the Creative Commons Attribution (CC BY) license (https://creativecommons.org/licenses/by/4.0/).
Share and Cite
Schnell, S.; Knierim, E.; Bittigau, P.; Kreye, J.; Hauptmann, K.; Hundsdoerfer, P.; Morales-Gonzalez, S.; Schuelke, M.; Nikolaus, M. Hodgkin Lymphoma Cell Lines and Tissues Express mGluR5: A Potential Link to Ophelia Syndrome and Paraneoplastic Neurological Disease. Cells 2023, 12, 606. https://doi.org/10.3390/cells12040606
Schnell S, Knierim E, Bittigau P, Kreye J, Hauptmann K, Hundsdoerfer P, Morales-Gonzalez S, Schuelke M, Nikolaus M. Hodgkin Lymphoma Cell Lines and Tissues Express mGluR5: A Potential Link to Ophelia Syndrome and Paraneoplastic Neurological Disease. Cells. 2023; 12(4):606. https://doi.org/10.3390/cells12040606
Chicago/Turabian StyleSchnell, Sofia, Ellen Knierim, Petra Bittigau, Jakob Kreye, Kathrin Hauptmann, Patrick Hundsdoerfer, Susanne Morales-Gonzalez, Markus Schuelke, and Marc Nikolaus. 2023. "Hodgkin Lymphoma Cell Lines and Tissues Express mGluR5: A Potential Link to Ophelia Syndrome and Paraneoplastic Neurological Disease" Cells 12, no. 4: 606. https://doi.org/10.3390/cells12040606
APA StyleSchnell, S., Knierim, E., Bittigau, P., Kreye, J., Hauptmann, K., Hundsdoerfer, P., Morales-Gonzalez, S., Schuelke, M., & Nikolaus, M. (2023). Hodgkin Lymphoma Cell Lines and Tissues Express mGluR5: A Potential Link to Ophelia Syndrome and Paraneoplastic Neurological Disease. Cells, 12(4), 606. https://doi.org/10.3390/cells12040606